Raspberry Pi-Based Low-Cost Connected Device for Assessing Road Surface Friction


1
Faculty of Mechanical Engineering, University of Ljubljana, SI-1000 Ljubljana, Slovenia
2
Faculty of Electrical Engineering, University of Ljubljana, SI-1000 Ljubljana, Slovenia
*
Author to whom correspondence should be addressed.
Electronics 2019, 8(3), 341; https://doi.org/10.3390/electronics8030341
Submission received: 8 January 2019
/
Revised: 14 March 2019
/
Accepted: 15 March 2019
/
Published: 20 March 2019
(This article belongs to the Special Issue Smart, Connected and Efficient Transportation Systems)
Abstract
:Measuring friction between the tyres of a vehicle and the road, often and on as many locations on the road network as possible, can be a valuable tool for ensuring traffic safety. Rather than by using specialised equipment for sequential measurements, this can be achieved by using several low-cost measuring devices on vehicles that travel on the road network as part of their daily assignments. The presented work proves the hypothesis that a low cost measuring device can be built and can provide measurement results comparable to those obtained from expensive specialised measuring devices. As a proof of concept, two copies of a prototype device, based on the Raspberry Pi single-board computer, have been developed, built and tested. They use accelerometers to measure vehicle braking deceleration and include a global positioning receiver for obtaining the geolocation of each test. They run custom-developed data acquisition software on the Linux operating system and provide automatic measurement data transfer to a server. The operation is controlled by an intuitive user interface consisting of two illuminated physical pushbuttons. The results show that for braking tests and friction coefficient measurements the developed prototypes compare favourably to a widely used professional vehicle performance computer.
1. Introduction
The knowledge of friction conditions on the contact between the road surface and the tyres of the vehicles driving on it is of essential importance for ensuring traffic safety [1,2]. The major challenge in this is providing friction measurements with sufficient spatial and temporal frequency. The indication of achievable friction on a roadway is its so-called skid resistance, which is measured with specialised devices applying different physical principles [3,4]. The measurement of skid resistance can be a challenge from two different standpoints: the first is the fact that the required specialised equipment is often expensive and thus of limited availability, and the second is the fact that the values obtained by different measurement methods are not comparable to each other as many of them do not directly measure the friction forces but rather other quantities that are then used in more or less complicated models to calculate the friction coefficients. Some of those methods are described in [1,2]. Whenever the specialised equipment for skid resistance measurement is required, it is thus often difficult to perform measurements on critical locations in a timely manner (e.g., during sudden changes of weather conditions).
With a low-cost yet sufficiently accurate system for measuring longitudinal deceleration on vehicles during braking these shortcomings can be successfully overcome. The vehicle deceleration during braking is in direct relation to the friction force achievable on the contact between the roadway and a particular set of tyres as per (1).
where FT is the friction force, FV the vertical force, m vehicle mass, aB braking deceleration, g acceleration due to gravity and µ the coefficient of adhesion between the vehicle tyres and the road, also referred to as the friction coefficient. Since the acceleration due to gravity is constant, it is only required to measure the longitudinal deceleration during braking in order to know the friction between the vehicle tyres and the road surface.
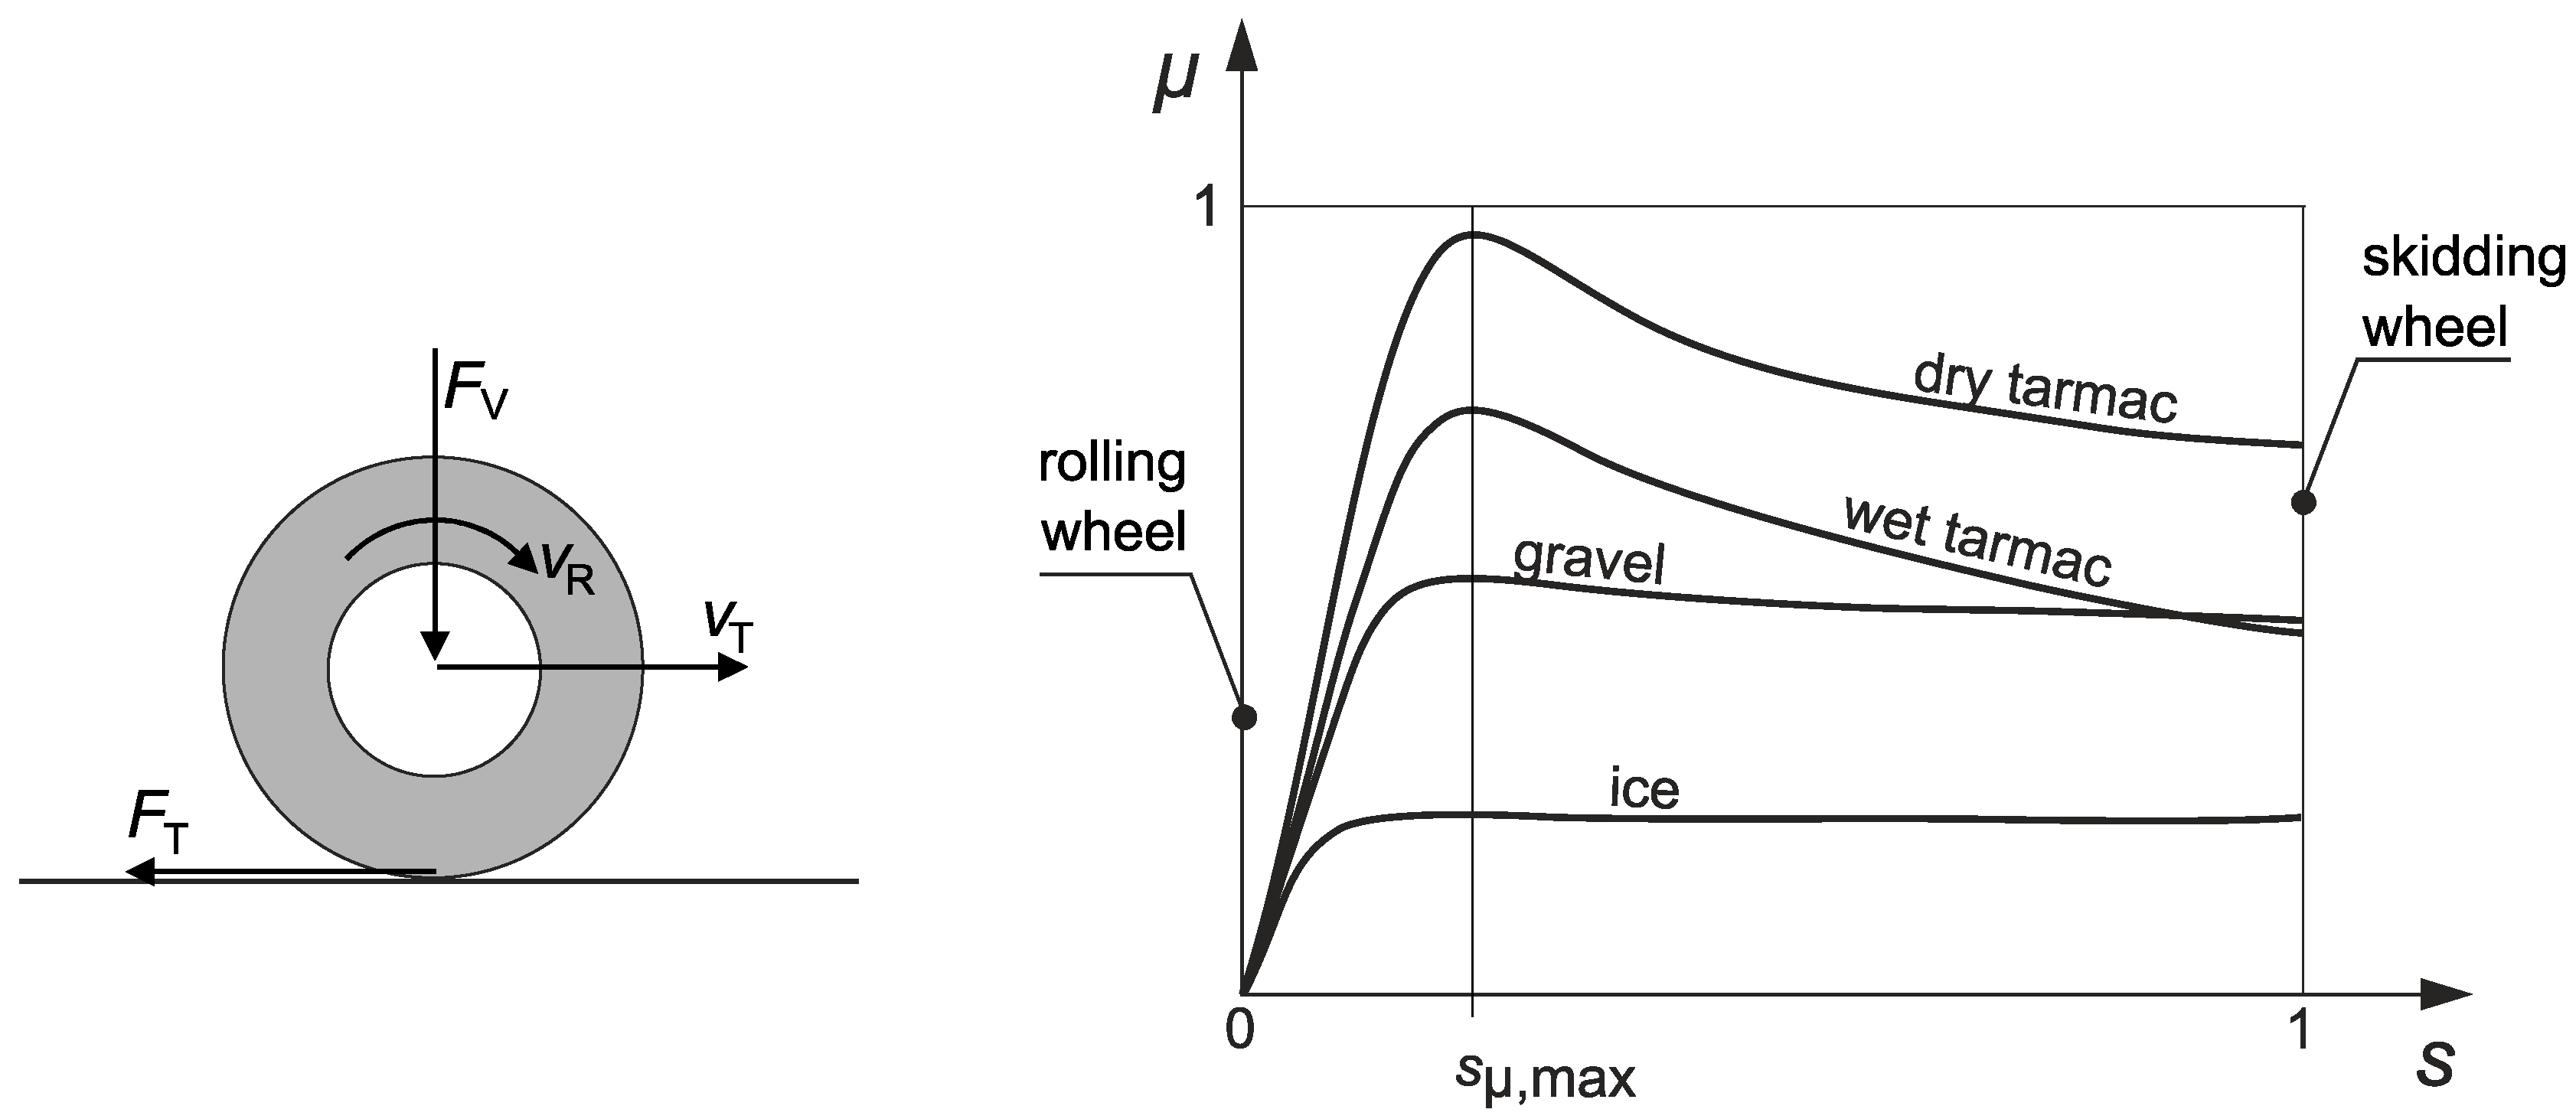
Other kinematic properties such as the stopping distance in relation to the vehicle’s initial velocity can easily be calculated from the measured decelerations, as can be the relation between the friction coefficient and wheel longitudinal slip, defined as:
where vT is the translational velocity of the wheel centre and vR the tangential velocity of wheel rotation (see Figure 1). The relation between the friction coefficient and longitudinal slip for some characteristic surfaces is shown in the graph in Figure 1.
These data can in turn be used to monitor the conditions on the road network, compare them to the values that ensure safety and act accordingly whenever the values fall outside the safe interval.
By installing the sensors on several vehicles and by ensuring non-complicated and repeatable measurements, it is possible to acquire data from large parts of the road network. The suitable candidate vehicles for installation of the sensor system are the vehicles that are daily traversing the road network. These include vehicles used by the road inspectors, police and rescue vehicles, postal vehicles etc. By transferring the measurement data from the devices into a central database, the road management authorities are given the possibility of a higher quality conditions monitoring and a faster, more efficient application of maintenance measures.
In recent years, MEMS (Micro Electro-Mechanical System on a chip) technology enabled low cost production and widespread use in mobile and automotive applications. With single board computers (SBC) becoming widely available at a reasonable cost in the early 2010’s there have been numerous successful implementations of SBC-based connected and distributed systems for measuring and monitoring various variables in traffic [5,6,7,8], environmental sciences [9,10,11,12], manufacturing [13,14], and environment automation [15,16,17,18].
The work described in this article was conducted to test the hypothesis that a low-cost device fulfilling the stated requirements can be developed, built, and used on different vehicles to achieve the performance comparable to that of special vehicle performance testing equipment.
2. Materials and Methods
The final goal of the presented work was to build a working prototype of the acceleration-measuring device. Since we were not bound to any previously developed systems, devices or components, we started the development process from scratch, using the morphological matrix approach [19]. This included defining the requirements, preparing and evaluating the concept alternatives, selecting the optimal concept, selecting and sourcing the components, building and testing a laboratory prototype, building and testing the final prototype, and proving the possibility of cloning the device by building a second instance of the final prototype.
The final version of the prototype device will be used in brake tests that will follow the same procedure of full braking of a vehicle from an initial speed (typically 60 km/h) to a complete stop. The procedure involves accelerating the vehicle to the initial speed; upon reaching this speed, the clutch is disengaged and the service brake is activated by instantly applying the required activation force (typically 500 N) to the brake pedal until the vehicle comes to a complete stop. The device is required to sense the acceleration threshold (typically −0.2 g) to trigger the start of data acquisition, and end it when the acceleration value changes its sign on vehicle rebound upon coming to a stop. The test conditions are a simplified set of those required by UNECE Regulation No. 13 [20].
2.1. System Requirements and Concept Synthesis
In the earliest phase of the design process, we defined the following set of system requirements that the final version of the device must fulfil:
- Measurement of acceleration in the range of ±20 m/s2 in three orthogonal axes (longitudinal, lateral, vertical).
- Acceleration data sampling with at least 12-bit resolution and the frequency of 100 samples per second.
- Automatic sensing of the beginning and the end of the braking test with adjustable acceleration sensing threshold.
- Acquisition of location data (geographic latitude and longitude) on the start of measurement.
- User control with rugged and simple user interface using physical buttons and light indicators
- Possibility of using power supply sources commonly available in vehicles and in laboratories (vehicle on-board power, mains power).
- Possibility of physically mounting the device in or on various vehicles (such as passenger cars, commercial vehicles, mobile work machinery and motorcycles).
- Ability to wirelessly connect to the server for data transfer using one of the standard connection protocols (Wi-Fi, Bluetooth, LTE or similar).
- Component and material cost shall be kept as low as possible.
According to the defined requirements, a morphological matrix (Table 1) was prepared with the main functions of the prototype and the means of their implementation. By analysing the availability and the pricing of the proposed components, we synthesised three possible concepts, which we then evaluated from the technical and the economical point of view. We selected the highest-graded concept for implementation.
2.2. The Components
The concept, selected for implementation as the device prototype, includes the components as per Table 2.
2.3. System Integration
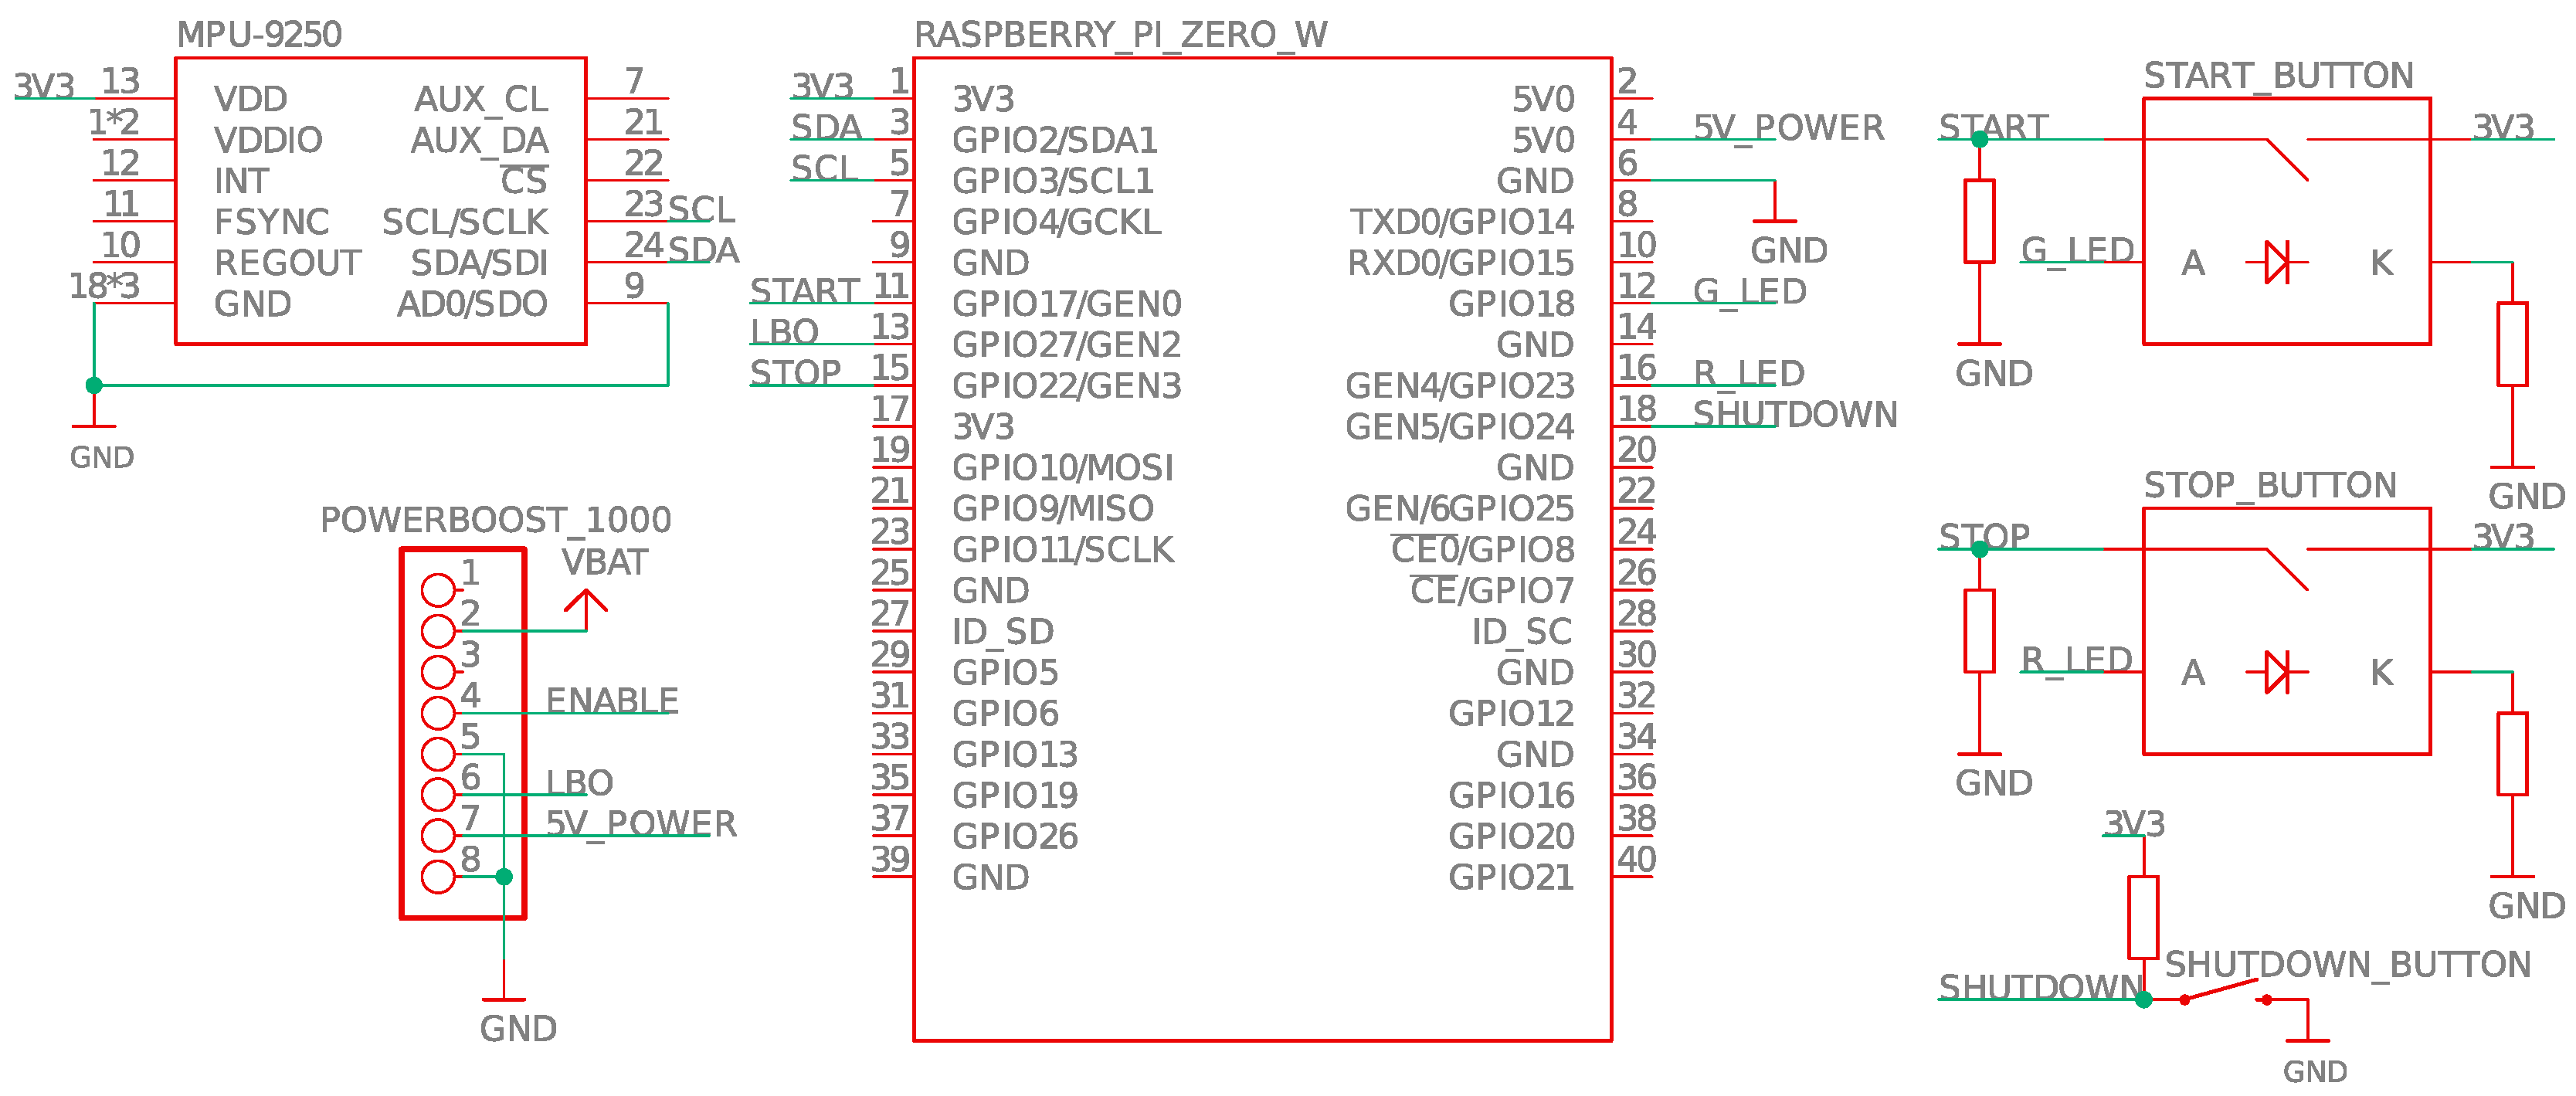
The components were integrated around the Raspberry Pi Zero W [21,22] as the central computer. The integration was done in two steps. The first step included building a laboratory prototype on a prototyping “breadboard” (also shown as a part of the testing setup in Figure 5 in Section 3.1.1) in order to test the electrical connections and functioning of the components as a system. The electrical schematics are shown in Figure 2. During the tests, we connected the components to the Raspberry Pi and their individual functions were verified using the appropriate software from within the Linux shell.
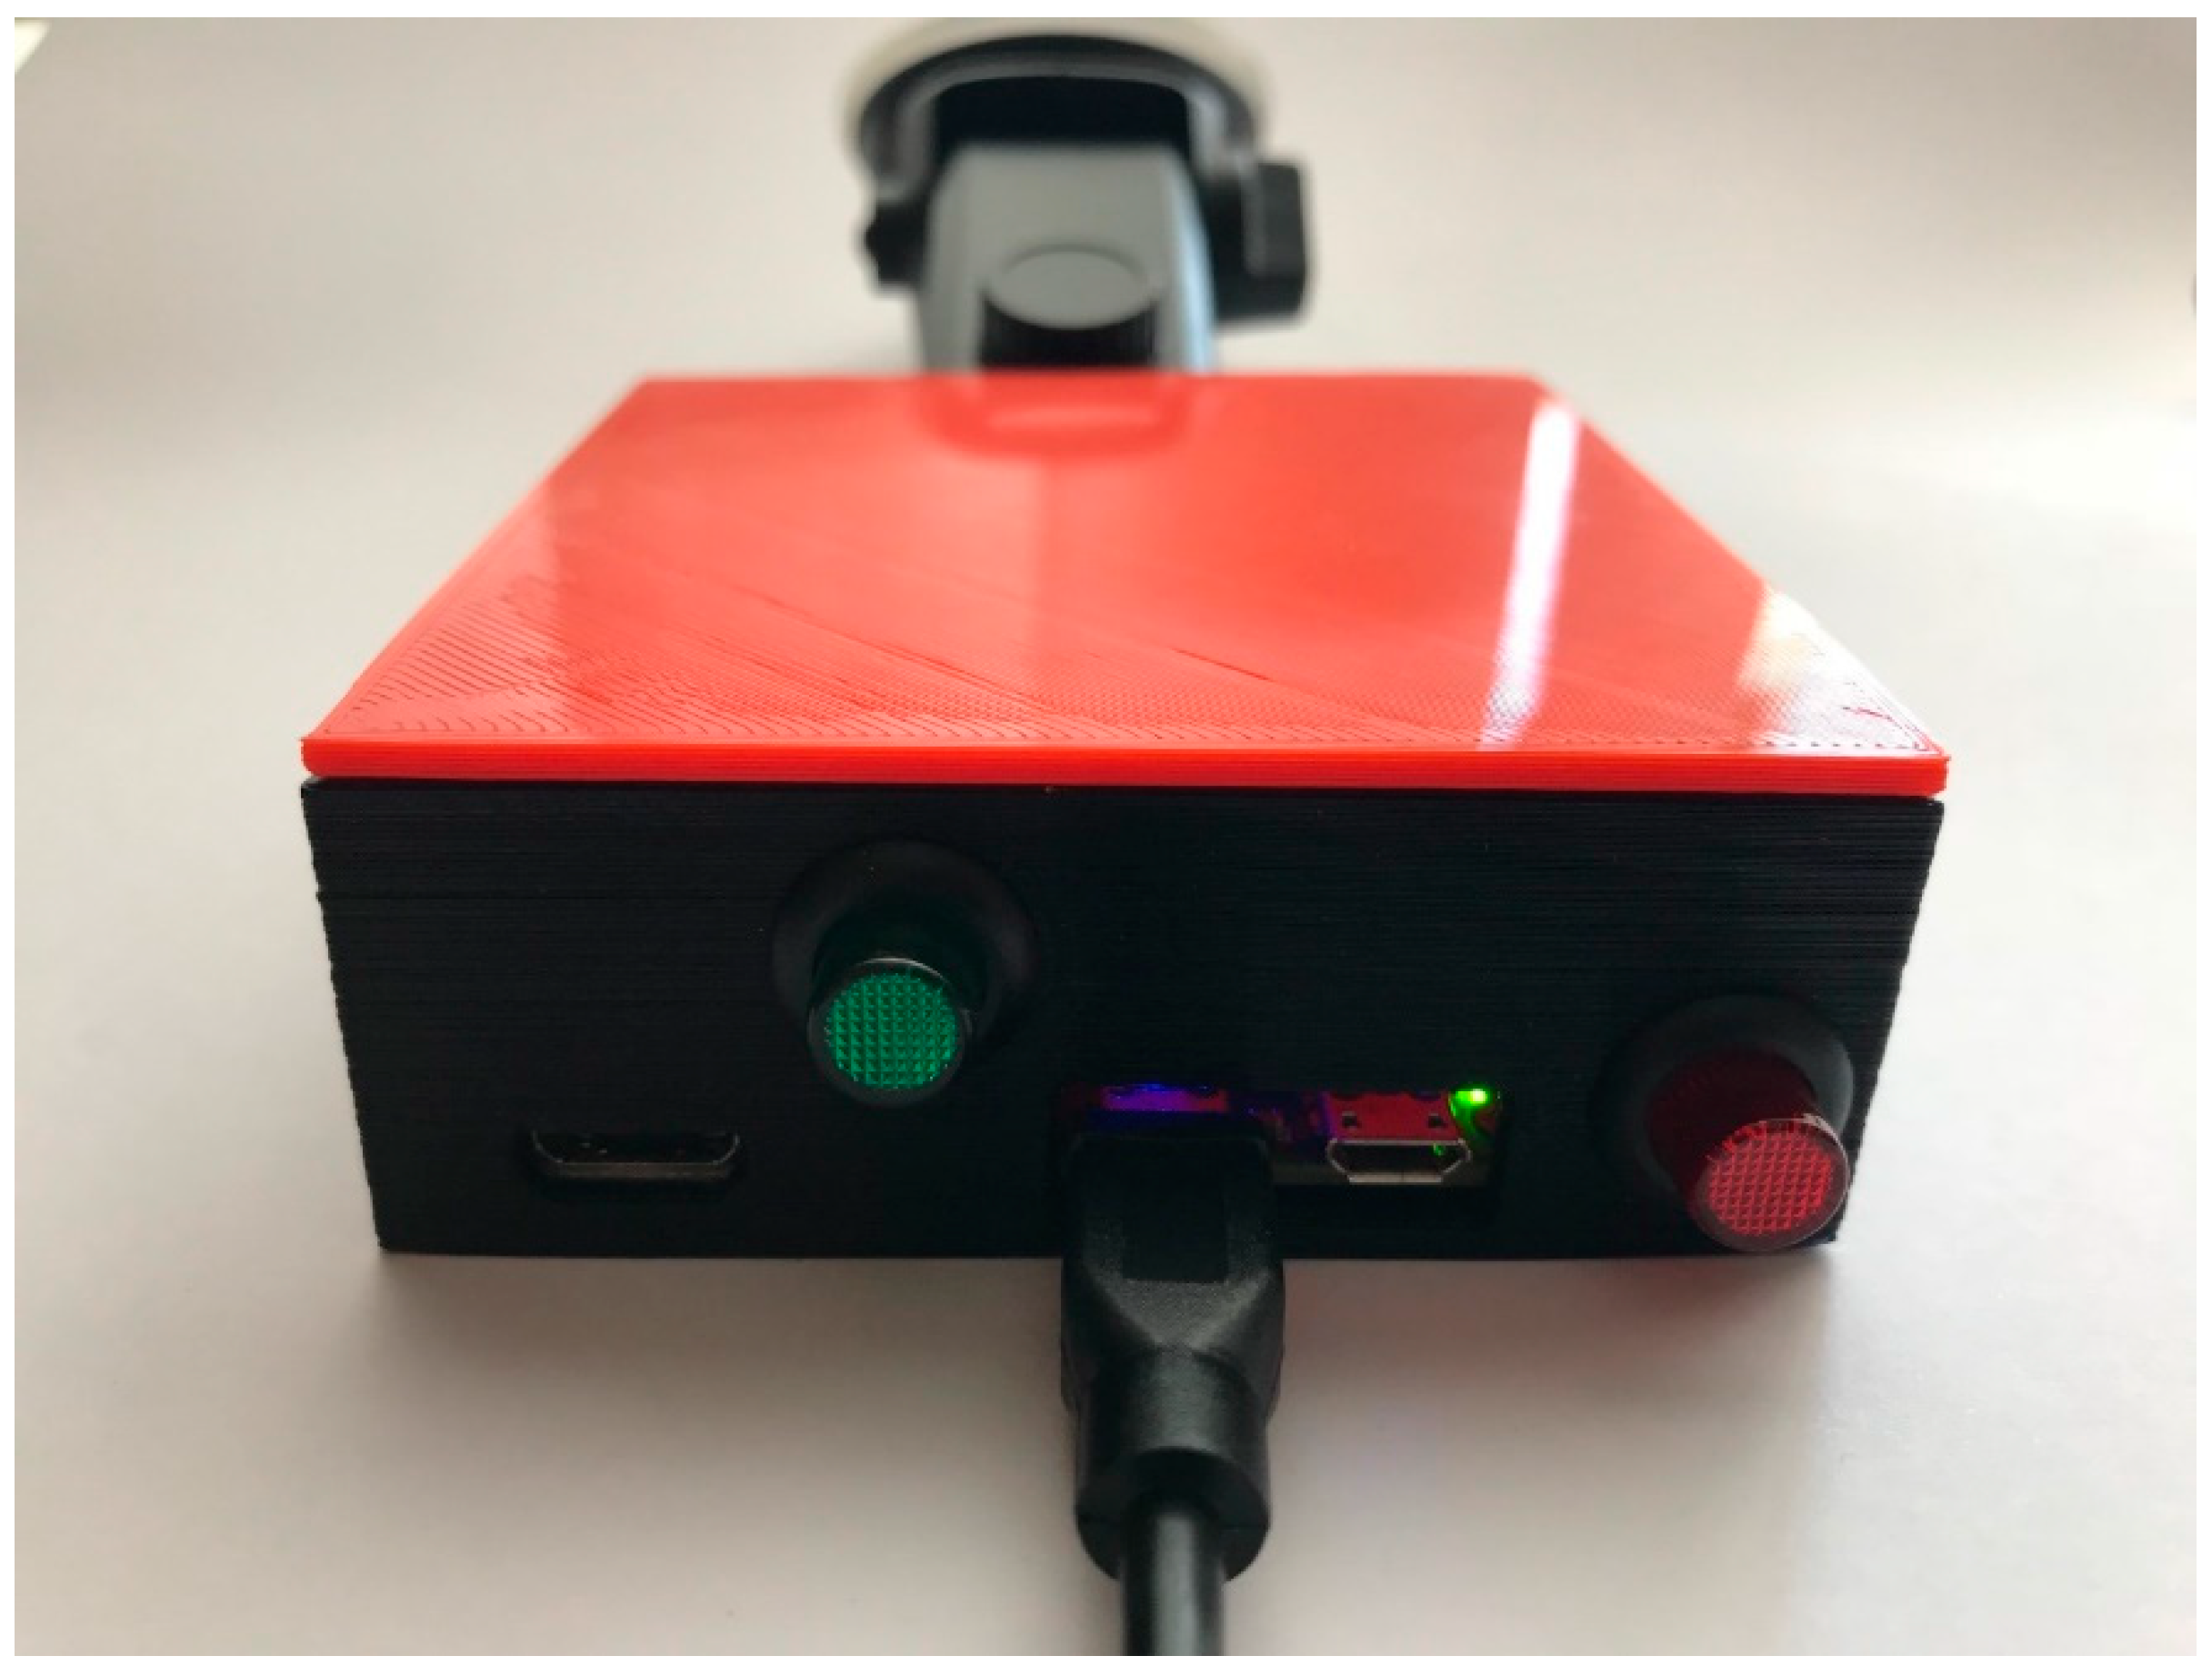
After we have confirmed the components to be electrically compatible and suitable for use in the final prototype, we created a 3D-geometrical model of the components assembly. Based on this, we then created several iterations of the model of the case to include all the components. The final iteration was produced using rapid-prototyping techniques (FDM 3D-print) and populated with the components. The result is presented in Figure 3.
2.4. The System Software Setup
Application of Raspberry Pi as the central computer for the measuring system enabled us to use Linux as the operating system. This is especially important in proof-of-concept development as it provides high-level tools for accessing the sensors connected to the computer and thus speeds up the application development and facilitates more efficient debugging.
The standard distribution of Linux for the Raspberry Pi family of single-board computers is Raspbian [23], which itself is a derivative of Debian GNU/Linux [24]. It offers a repository of precompiled binary packages and a toolchain for building the packages from source. Raspbian is currently available as a disk-image in two different versions: the full version includes desktop and other productivity software packages; the “Lite” version only includes the command-line environment and the minimal set of pre-installed software packages. For the purpose of the prototype development, we installed the current version of the “Raspbian Stretch Lite” image.
The installed Linux image comes with the standard Linux kernel, which uses the default scheduler and thus cannot provide fixed and predictable latency required for real-time data sampling. To ensure deterministic scheduling we replaced the standard kernel with a custom-built kernel from the Raspbian RT (Real Time) kernel branch [25]. This kernel applies the RT-Preempt patch to achieve fully preemptible operation [26]. Some further configuration adjustments, including disabling the unnecessary hardware drivers, were also made to the kernel configuration before building in order to offload the unnecessary tasks from the CPU. After building and testing the custom kernel, we made further adjustments to the system configuration to disable the system console, set up the network and USB-connection parameters, and configure the kernel to load only the required kernel modules. As the final step of the operating system configuration, we removed the unneeded pre-installed software packages from the system to maximise the storage space.
Once the operating system was configured, we tested it for performance and memory management using the standard Linux tools. The running processes after the boot include the systemd services (journald, udevd, timesyncd an logind), system logging daemon (rsyslogd), dbus daemon, cron daemon, dhcpd daemon, wpa_supplicant and sshd daemon. The achievable latency times as reported by cyclictest [27] are summarised in Table 3. After successfully testing the OS installation, the micro SD card with the current OS image was backed up for use as a starting point for future installations.
2.5. The Measurement Application
The software application for data acquisition and storage was developed in userspace and is written in C. Its principal tasks are to initialize the peripheral hardware, interact with the user, interact with the connected peripheral hardware and conduct simple computational logic. It is run as an infinite loop in a single thread, where the application’s internal scheduler addresses task scheduling. The application source code is published on a public repository [28].
2.5.1. Modular Structure and Build Process
The application has a modular structure, where each module represents either a common set of functionalities, a hardware driver or measurement data storage. The main modules are described in Table 4.
Different modules and debugging options can be enabled/disabled through options available in the file “supervisor.h” and a subsequent rebuild of the application. The application is built by running the makefile, which creates an executable file with the help of the GNU compiler collection (GCC). The GCC is called in combination with several flags, which allow for easier debugging if an error is encountered during compilation. Additionally, the external libraries wiringPi [29] and pthread are linked to the application, providing straightforward GPIO (General-Purpose Input/Output) interfacing and allowing the application to run in a separate thread.
2.5.2. Peripheral Component Interaction
To interact with the connected components, we chose different means of communication, depending on the supported protocols by the component. For interacting with the user interface and the power management component, simple GPIO logic interfacing is used. On the other hand, asynchronous serial communication is used to interact with the GNSS (Global Navigation Satellite System) receiver component and the more complex protocol I2C was used in order to acquire measurement data from the IMU (Inertial Measurement Unit) component.
Because the application runs in userspace, it was not possible to influence the settings of the asynchronous serial communication with the GNSS component. Therefore, the communication ran with default values. The output data of the communication was filtered to obtain only the $GPRMC NMEA sentence [30] containing the current position, velocity, time and date. Using the I2C protocol for accessing the IMU component proved to be the best choice, as it provided adequate sampling rate. Also available is the SPI protocol but it is not activated by default in the used IMU and would have to be enabled on each reboot via I2C, meaning additional hardware would be needed.
2.5.3. Program Flow
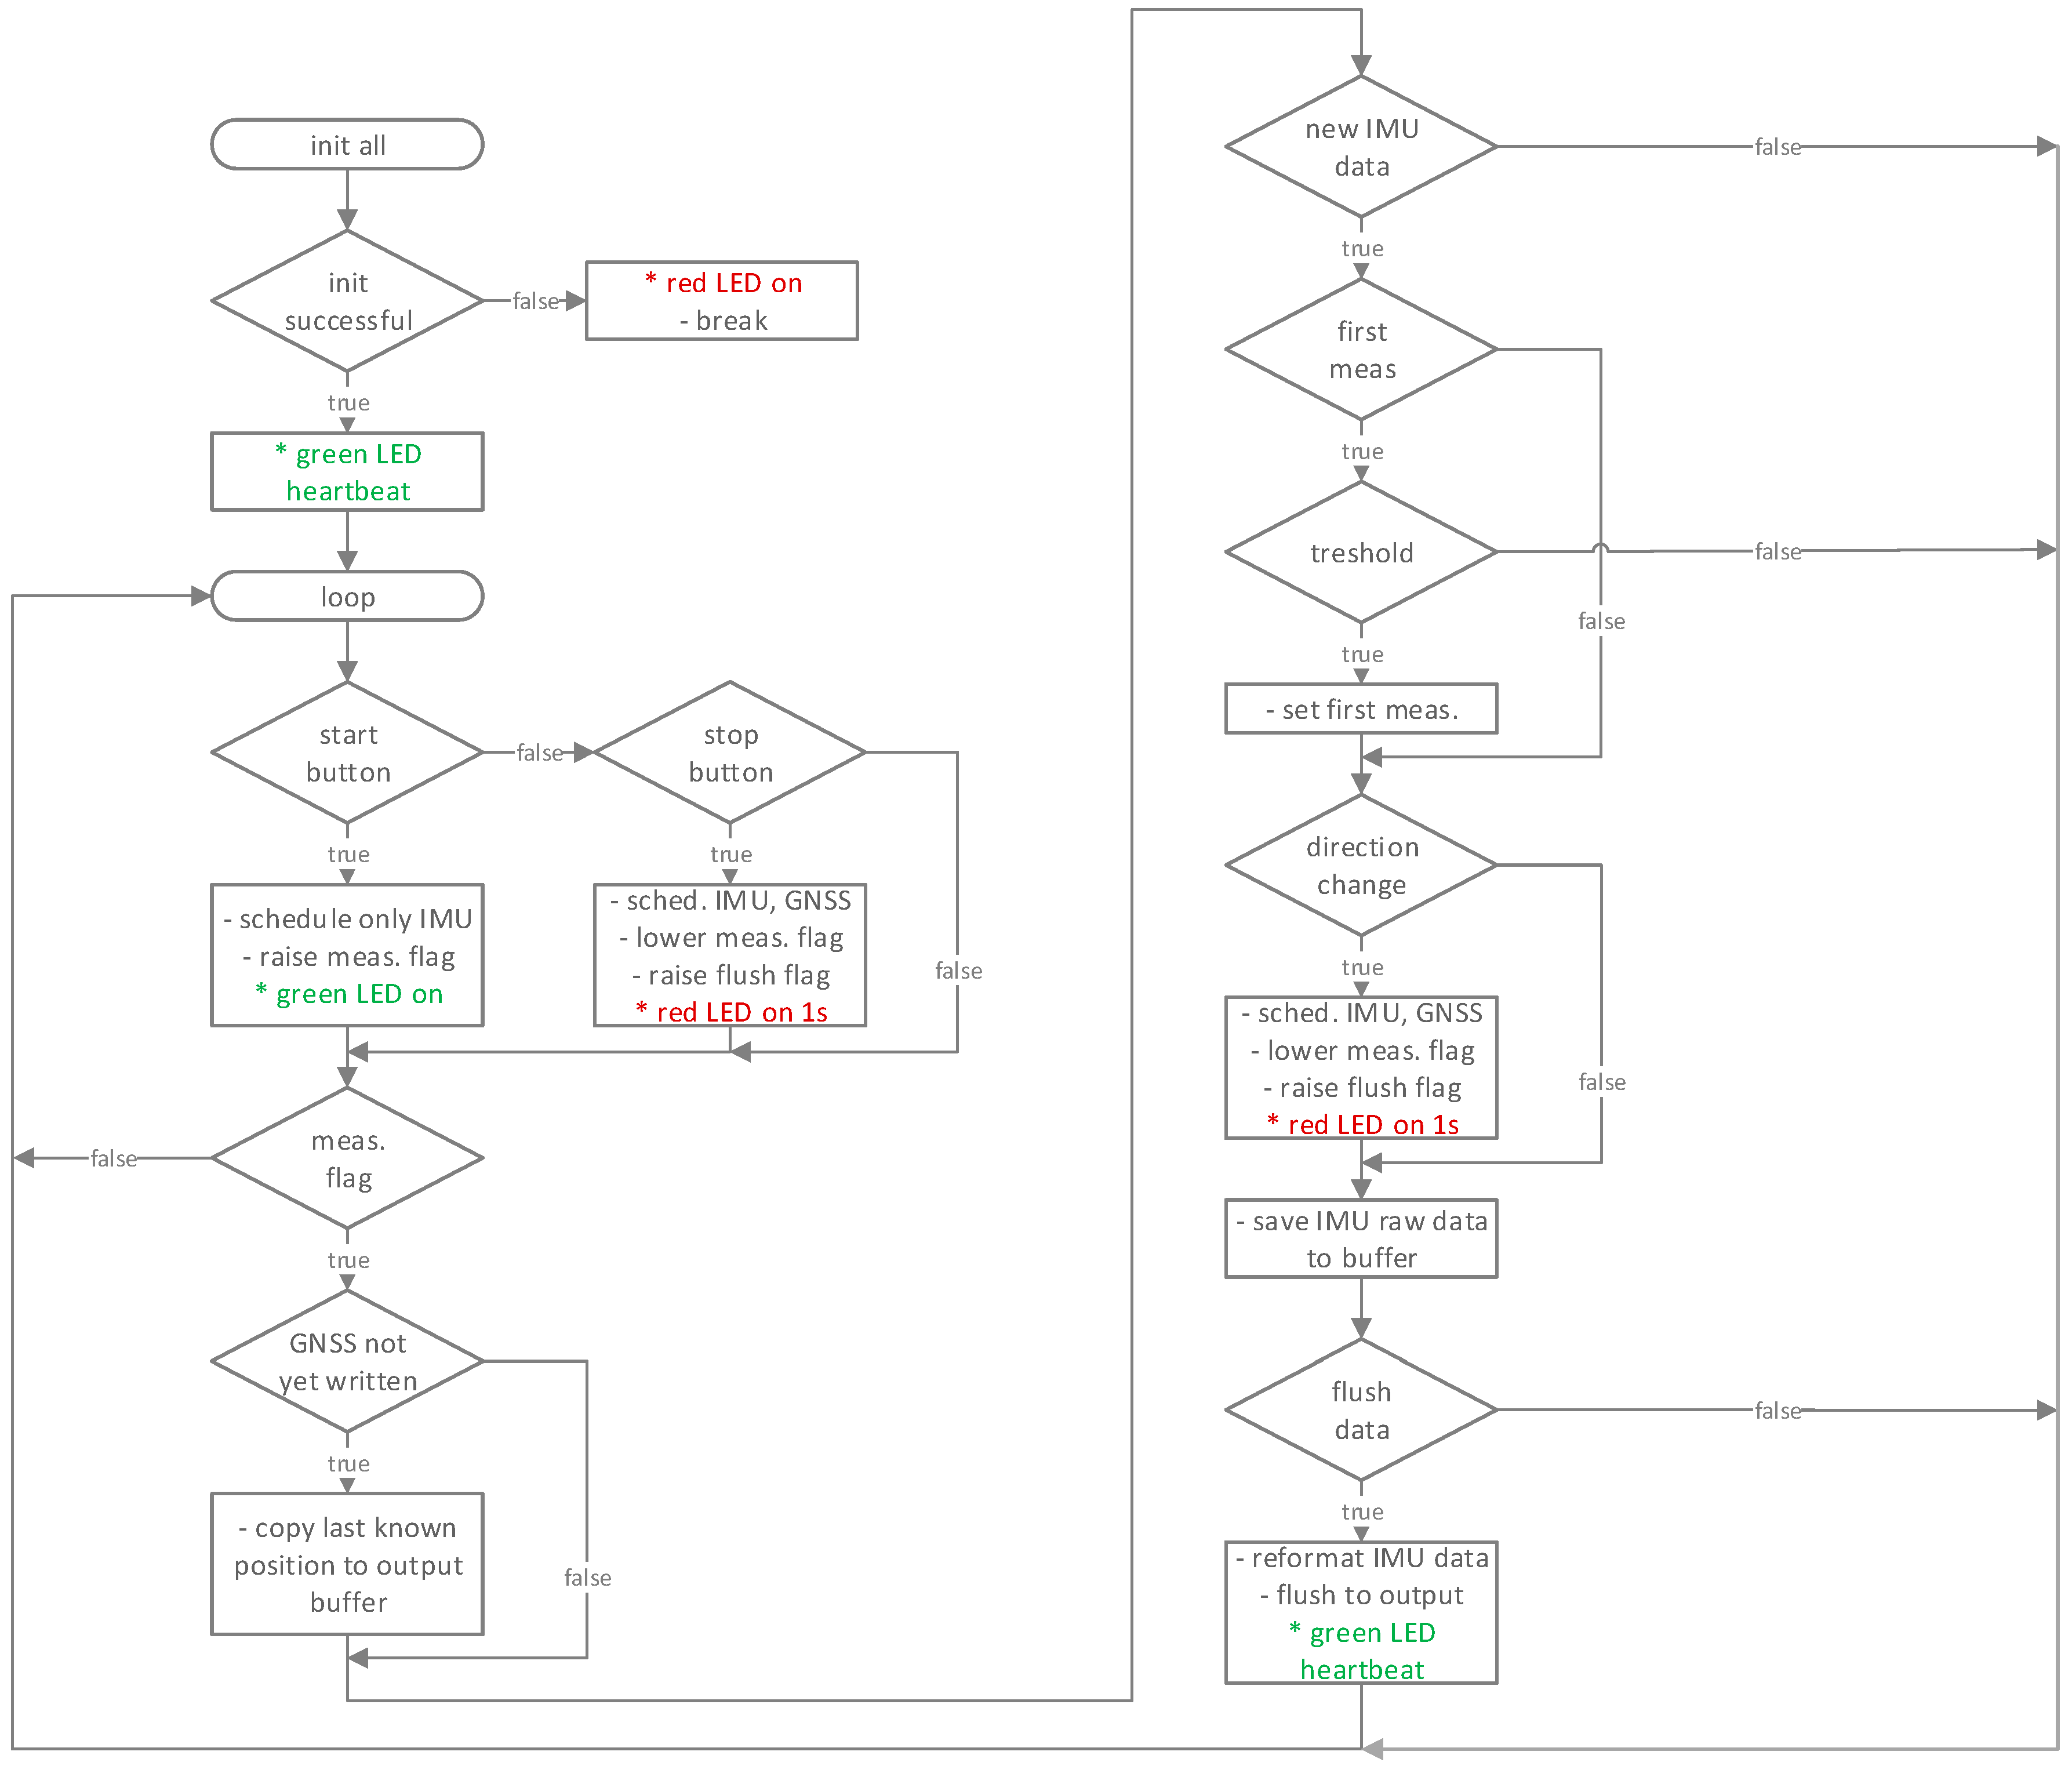
At the end of the operating system boot sequence, the application runs automatically and the initialisation process is started. The initial task of the application is to verify that all peripheral components are connected and accessible. During this sequence, the world time data is acquired from the GNSS since the prototype device does not have a battery-backed real time clock. The initialisation process therefore ensures that there is no user intervention required, apart from turning the device on and later using the primary user interface to start the measurement process. In case of an unsuccessful initialisation, the application exits with an error code and the red LED lights up to inform the user of the failure.
After successful initialisation, the main program loop is started, where data reading, processing and storage is handled together with user interface control. The main loop runs cyclically and is used to handle non-deterministic tasks such as data format transformation, file manipulation and changing the program state. During its execution, a system timer interrupt triggers periodical data acquisition every 0.01 s from the accelerometer sampling routine. The same interrupt is also used to read GNSS data once every second. Additionally, a hardware timer associated with the start/stop buttons may also interrupt the execution of the main loop. It is used to raise a flag, signalling a program state change request.
While the main loop is in execution, a blinking heartbeat pattern notifies the user that the device is ready for a new brake test measurement. After pressing the start button and starting the measurement process, the green LED is turned on continuously, letting the user know that they can start the measurement procedure. At the same time, as the start button is pressed, the last known vehicle position acquired from GNSS is saved. The application at this stage starts measuring the accelerometer data. In the event of a longitudinal deceleration exceeds the predefined threshold value (typically 0.2 g), the acceleromter data acquisition is started. Raw measurement data is temporarily stored in a buffer in the system’s working memory in order to prevent any unexpected delays during the measurement process. Once the vehicle comes to a stop after braking, the measuring system senses an inversion in the acceleration sign and automatically stops the measurement procedure. The green LED is turned off and the red LED is turned on continuously. The application then transfers the measurement data from the temporary buffer to a data file on the storage file system (i.e., a dedicated data directory on the micro-SD card). When all the measurement data has been transferred and stored, the red LED is turned off and the green LED starts to blink in a heartbeat pattern, letting the user know that the system is ready to conduct further measurements. If the user presses the stop button during the measurement, the measuring procedure is immediately halted and the available measurement is transferred from the buffer to the storage file system. This ensures that the system can be reinitialised without reboot in case of falsely sensing the measurement thresholds. The application program flow is summarised in Figure 4.
2.5.4. Integrating the Measurement Application into the Operating System
The final version of the prototype must be ready for use without requiring any user intervention to start the measurement application on system power-on. We achieved this by creating a systemd [31] service that starts the properly configured measurement application at the correct time during the boot process.
2.6. The Server-Side Application
To fulfil the requirement for automatic wireless data transfer from the prototype device to a server, we developed a server-side application. It runs as a daemon and periodically queries the local network for presence of the prototype devices. Whenever one of them is detected on-line, the server application automatically compares its local storage of measurement files to the storage of each connected prototype device and transfers any new files using rsync [32]. The acceleration data from the files are automatically transferred into a PostgreSQL database on the server, from where it can be used for further processing or display.
3. Results
3.1. Prototype Testing
The first functional tests of the integrated system and the development version of the measurement application were done on the breadboard prototype consisting only of the essential components—the Raspberry Pi, the IMU and a combination of an LED and a button as the user interface. This prototype was used to test the basic operation, such as achievable sampling rate and its consistency. Further tests included evaluation of measured acceleration values and repeatability of threshold triggering—for these tests the final prototype was used.
3.1.1. Hardware Functions
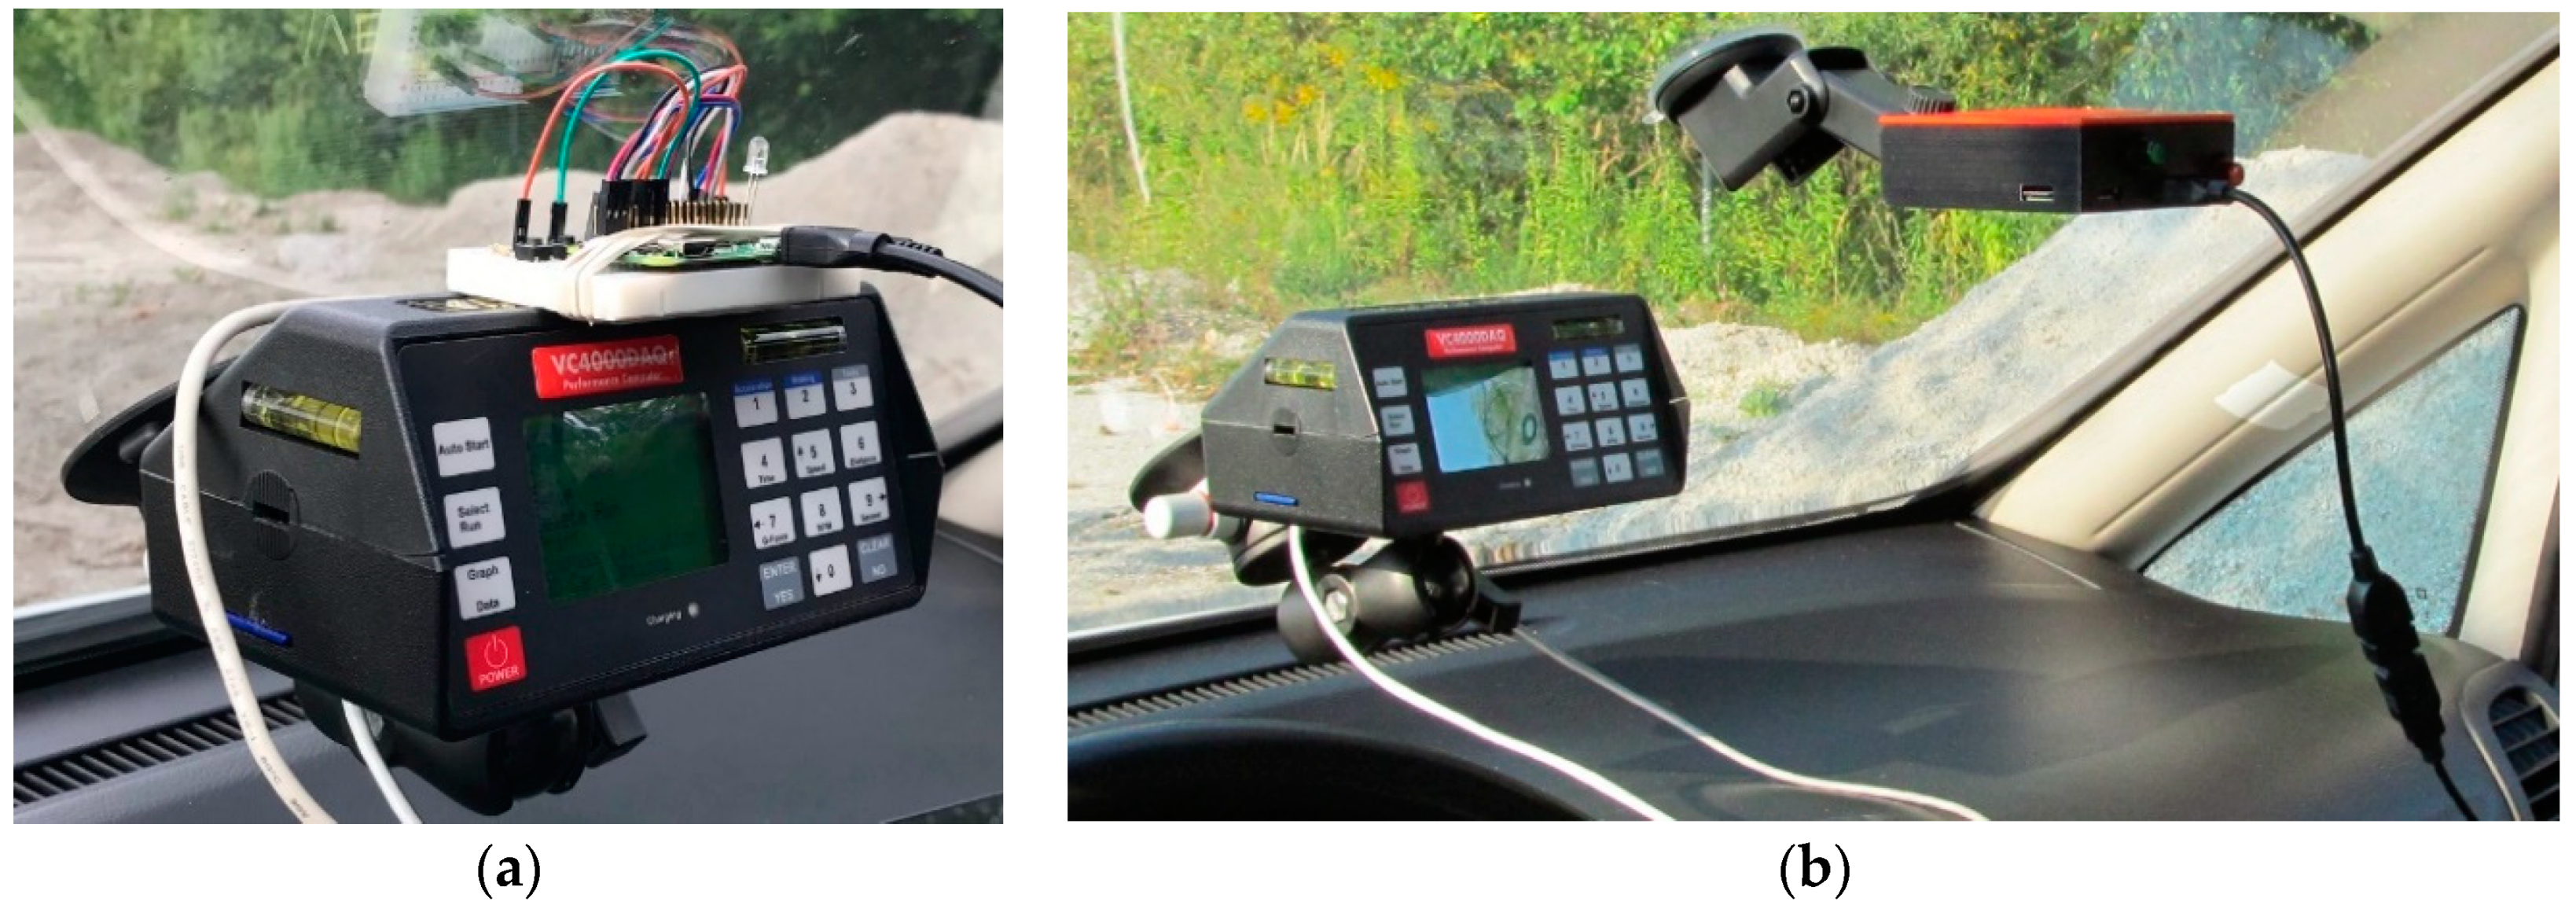
To test the suitability of the integrated hardware components for data acquisition as per the system requirements, a series of tests was performed. The breadboard prototype was installed atop of the housing of the Vericom VC4000DAQ vehicle performance computer [33] as shown in Figure 5a. The VC4000DAQ was chosen for comparison as it is one of the most convenient and widely used instruments for measuring braking deceleration. It uses an internal 3-axial accelerometer and is capable of sampling the acceleration data at frequencies of up to 1000 samples/s. It also provides an analogue-to-digital converter for connecting external sensors, as well as built in GPS and CAN interface for connecting to the vehicle’s on-board diagnostics system. Its firmware, user interface and the accompanying PC software enable the user to easily control the measurement flow in various pre-defined test scenarios (braking, acceleration, continuous measurement), and transfer the measurement data to a PC for analysis.
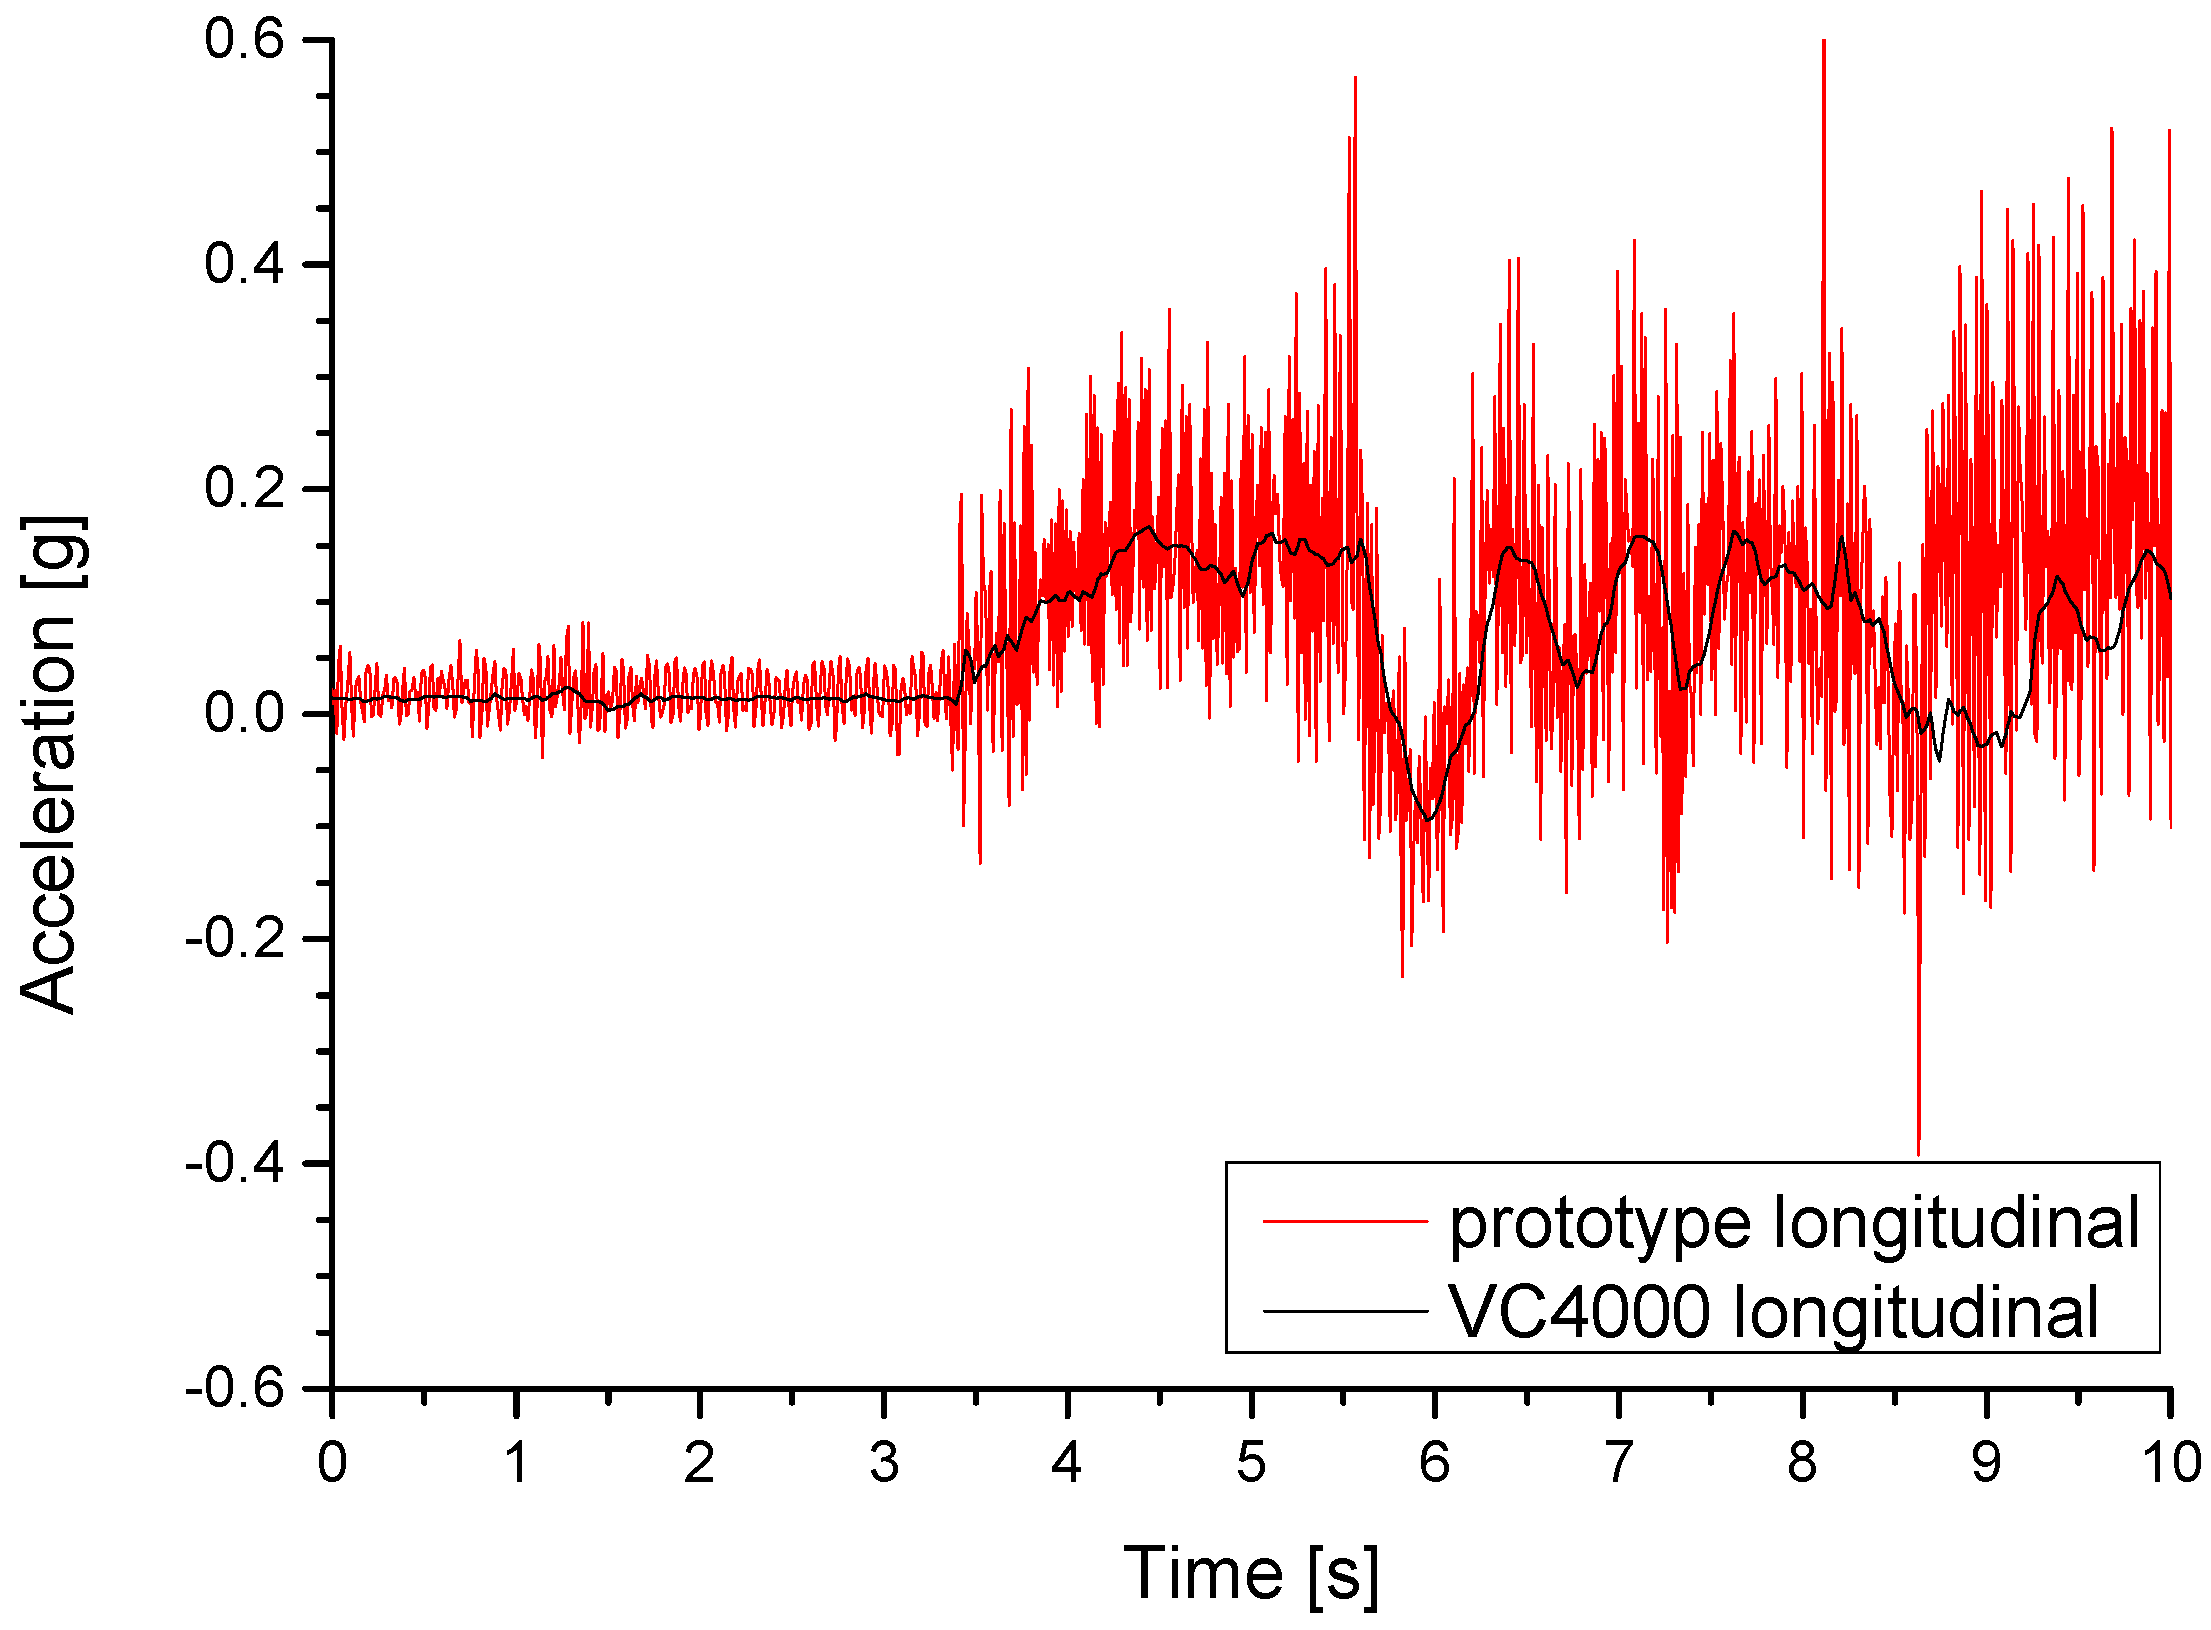
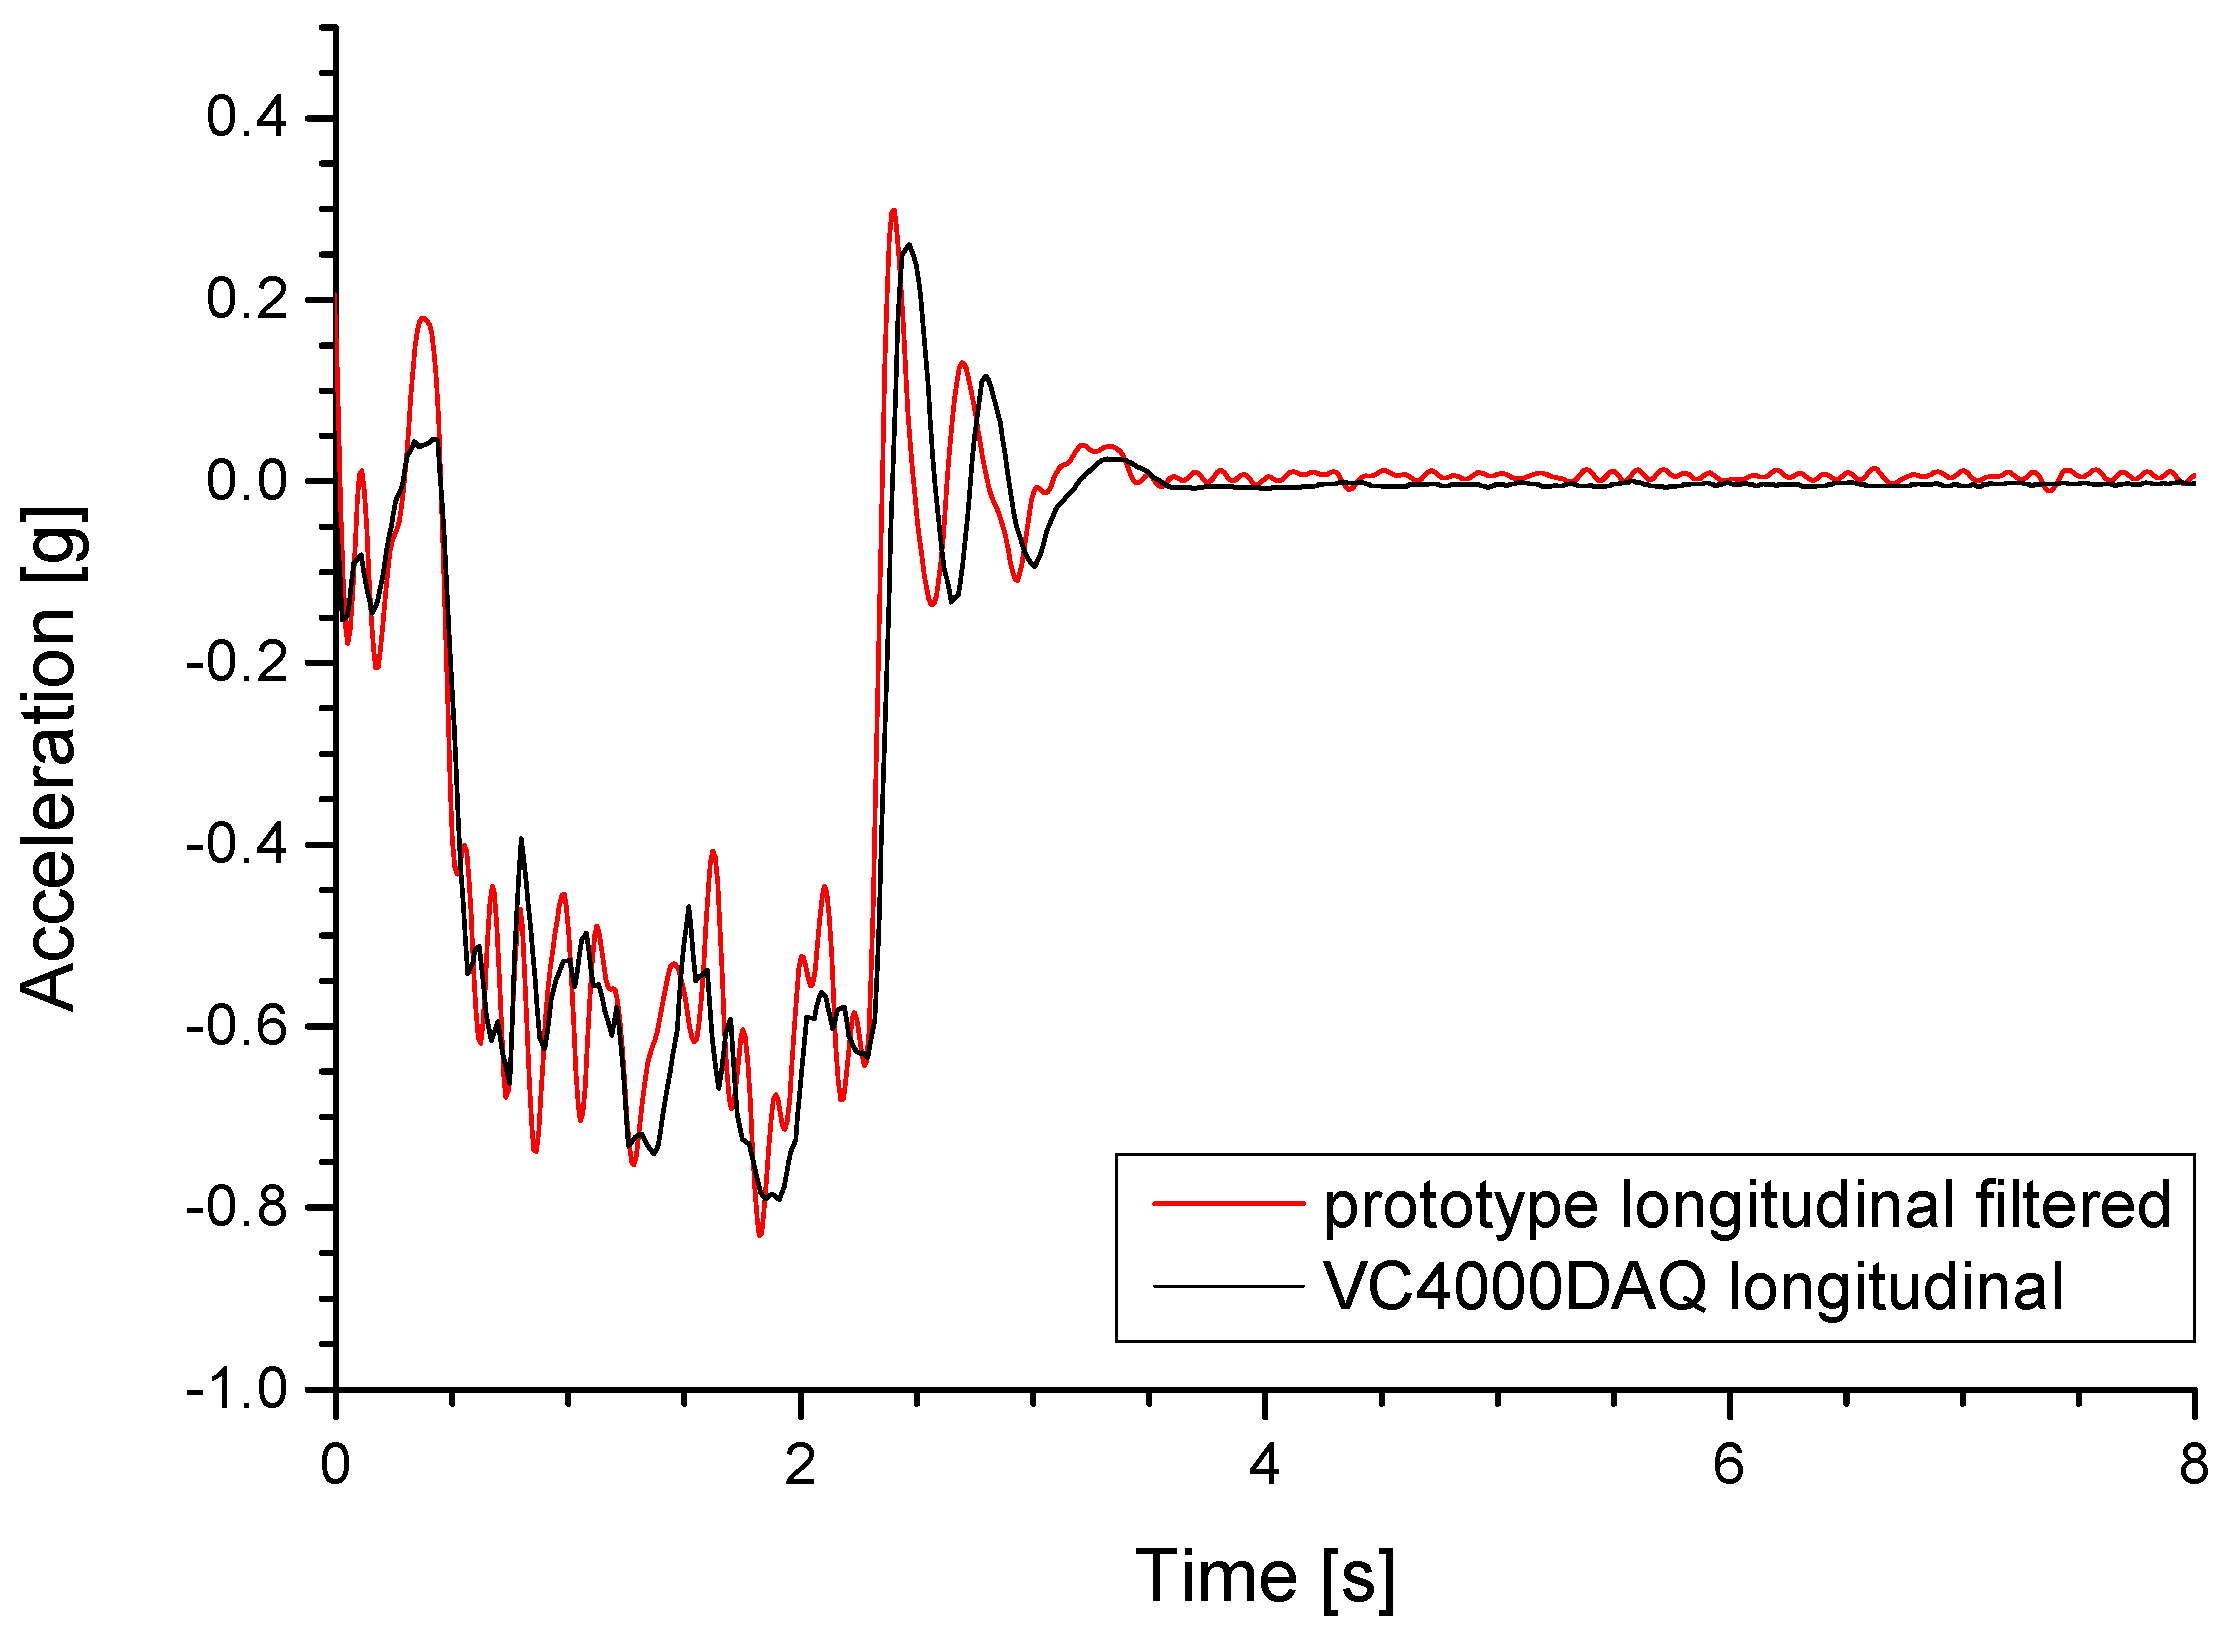
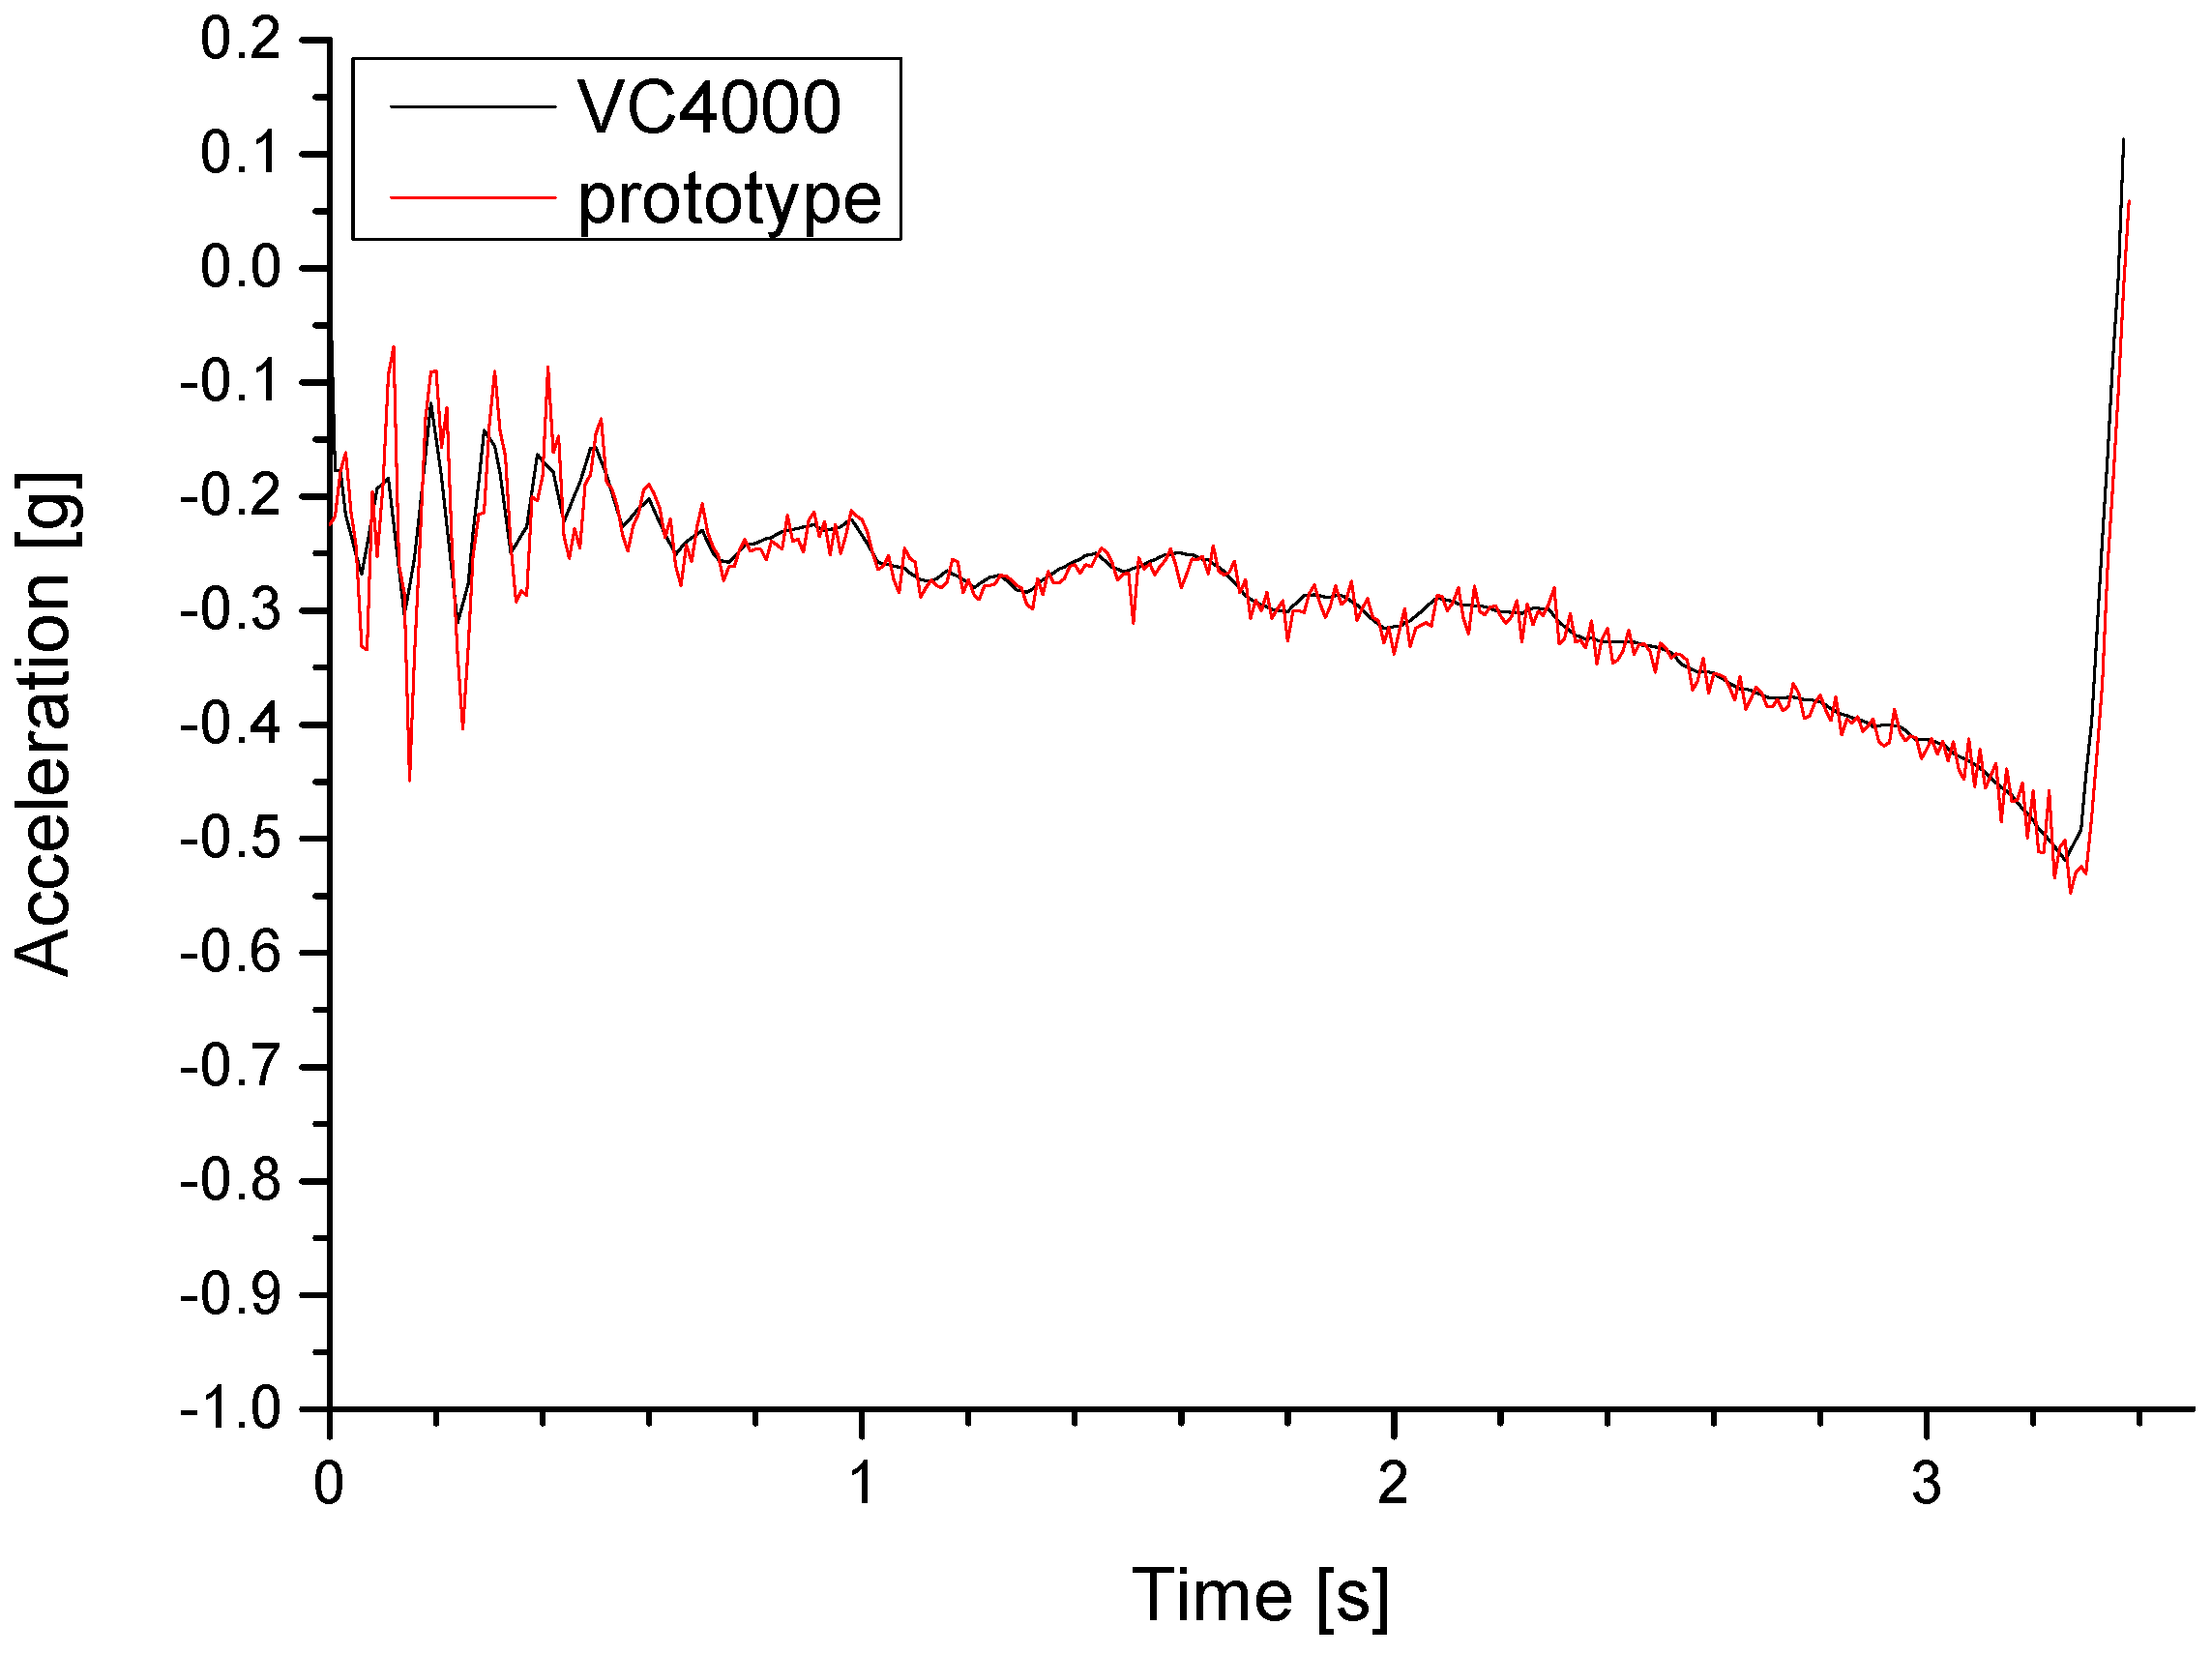
We tested the quality of the data acquired by the prototype device during several rides with a vehicle on a closed circuit, which consisted of an acceleration, several left and right turns and several brakings of different intensities. The acceleration data was simultaneously acquired from the VC4000DAQ and the prototype device at the sampling rate of 100 samples per second. The initial results have shown that excessive noise was present in the acceleration data from the prototype device when compared to the data from the VC4000DAQ. An excerpt from the measurement results of one such test run is shown in Figure 6. To smooth out the noise from the mechanical vibrations, the acceleration sampling function of the measurement application was adjusted to apply the MPU 9250 built-in hardware low-pass filtering [34] with 10 Hz cut-off frequency. The applied filtering filters out the frequencies which are irrelevant to the process of measuring road surface friction, also preventing false triggering of the measurements due to noise. After this adjustment, the tests were repeated in the described manner and the analysis of the measured values has confirmed that the unwanted noise was largely eliminated as it can be observed from the chart in Figure 7. The different filtering, however, introduces different time delays. Therefore the measurements are time shifted as it can be observed in Figure 7. Since a slight time shift does not influence the calculation of the friction coefficient value from the measurements, this time shift was not compensated for.
3.1.2. Operation Performance
The most important operating performance parameters are the achievable sample rate and the consistency of the sample interval length. The preliminary bench tests indicated that the required sample rate of 100 samples per second is comfortably achievable using the selected hardware, the real-time Linux kernel and the developed measurement application. Nevertheless, we performed a set of more thorough tests to determine any inconsistencies in the sampling interval length. During these tests, the acceleration data has been sampled at 100 samples per second for a duration of one minute (about 15-times the duration of a typical braking test). The recorded sample interval lengths were found to be consistent and all of them were within 10 ms. The clock accuracy of the prototype device was also compared to that of the VC4000DAQ. The time discrepancy between the two devices during several one-minute tests never exceeded the sampling interval length of 10 ms.
3.1.3. Controlled Environment Tests
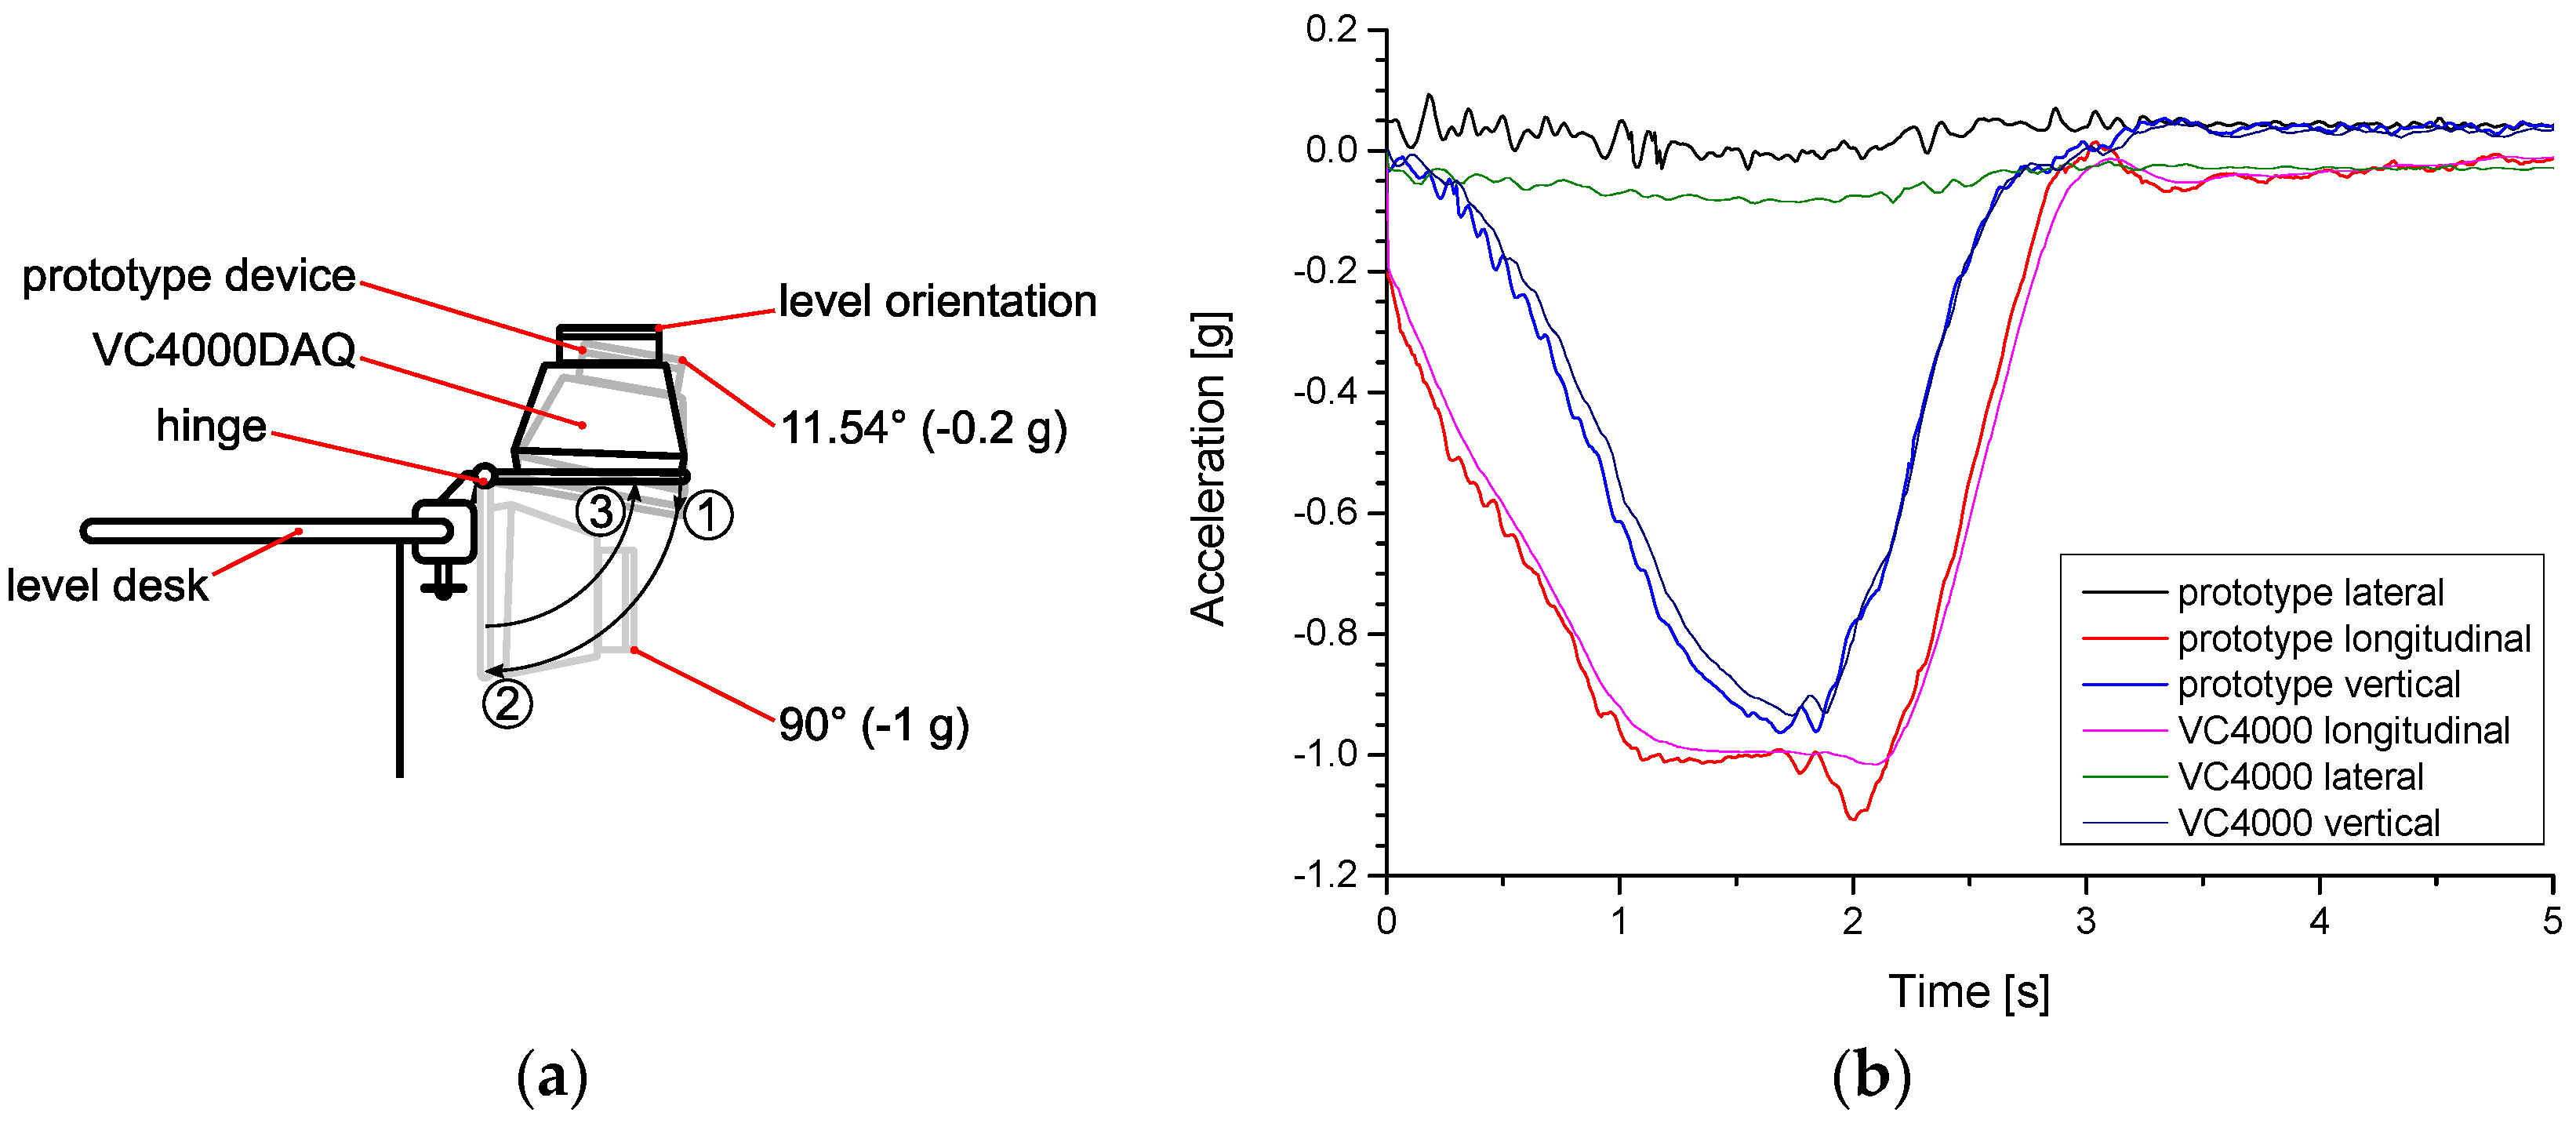
We tested the function of threshold triggering and comparing this function to the equivalent one of the VC4000DAQ in a controlled laboratory environment. The breadboard prototype was firmly attached to the VC4000DAQ, which was attached to a purpose-built device (Figure 8a) that allowed tilting the assembly to continuously vary the gravity acceleration effect on both devices from level (0°) ① over −0.2 g (11.54°) ② to −1 g (90°) and ③ back to level. This simulates a typical acceleration course during a braking of a vehicle to a complete stop. The tests on the device confirmed that the triggering at a threshold of 0.2 g and ending the measurement at the change of the sign of the longitudinal acceleration work in the same manner as the VC4000DAQ. Figure 8b shows a comparison of measured acceleration between the two used devices from one such test.
For field-testing we used the final prototype of the device and compared the measured data to the one measured by the VC4000DAQ (Figure 5b). All experiments were braking tests of various vehicles performed on different surfaces under different conditions.
Table 5 summarises the comparison of 20 braking tests done with two different passenger cars (a 2001 Opel Zafira and a 2009 Renault Clio) on three different driving surfaces (dry tarmac, dry gravel and wet skid pad) with varying initial speeds ranging from 38 km/h to 65 km/h. The prototype device and the VC4000DAQ were mounted side by side on the inside of the vehicle windshield. In the first set of tests (Zafira) special care was taken to achieve equal levelling of the two devices, while this was not the case in the second set of tests (Clio). The average decelerations and times of measurement tm measured with the prototype device were compared to those measured by the VC4000DAQ. The differences between the measurements from the two devices in percent (Δ and Δtm) and the Pearson coefficients of correlation were computed for each of the deceleration curve pairs. Figure 9 and Figure 10 show plotted data from two of the reference tests (marked in bold in Table 5).
4. Discussion
The triggering capability of the prototype system has been verified by comparing the measurement times tm, which are within 2% of those measured by the VC4000DAQ. The measured average decelerations are mostly within 3% between the two devices, with some exceptions that can be attributed to slightly different mounting angles of the two devices in the second vehicle. The correlation between the signals, expressed with Pearson coefficients mostly well over 0.8, also proves that the prototype device can achieve performance comparable to the VC4000DAQ.
We performed the presented work in order to prove the concept of using a low-cost system to measure vehicle braking deceleration with an accuracy comparable to more costly specialised devices. The low cost of such a device opens a possibility to build the device in a larger number of copies and connect them to a distributed system covering a larger area on the road network. Currently the road management authorities in Slovenia only collect the driveway friction properties data on each location on the road network a few times yearly. A distributed system consisting of multiple measuring devices, on the other hand, can collect the relevant data much more frequently and provide them to the road management authorities for use in decision making and issuing early warnings.
After considering the available options for the data acquisition and storage subsystem, we chose the Raspberry Pi Zero W single-board computer as the viable option. It combines a powerful CPU, a selection of hardware interfaces to connect the peripherals and an on-board WiFi adapter. It can run Linux, which makes software development and debugging significantly easier and quicker compared to other platforms. Apart from this, the SBC has very modest power requirements and is very attractively priced.
The current design of the prototype device provides wireless data transfer to the server using WiFi network. The data are thus transferred after the vehicles return to the base and the devices come within range of the WiFi access point. The data transfer and storage is automatic. The storage space on the prototype device using a 16 GB micro-SD card is sufficient for over 800,000 typical brake tests. If, in the future, it becomes necessary to transfer the data in real time, a GSM/LTE transceiver can be added to the devices to provide this functionality, albeit with some additional cost and increased complexity. During the system integration and while interfacing the peripheral components to the Raspberry Pi we faced some challenges. The final version of the prototype had to be reliable. Therefore a safe system shutdown was needed when the battery started running low. The used power management component has a pin for low battery warning, which is a weak pull-up pin driven by the battery voltage. To connect it to a GPIO on the Raspberry Pi a high input impedance level shift circuit had to be used. In the application, the connected GPIO was set as a dedicated interrupt handler to initiate a system shutdown, when the battery is running low. This added some complexity to the final design and increased its cost for a small margin. In the next design iterations another battery management solution may be used to avoid the need for these additional components.
5. Conclusions
The results of the work presented in this article proves the hypothesis stating that it is possible to produce a low-cost device for measuring acceleration during vehicle braking performance-wise comparable with professional equipment developed for the purpose. By following the commonly applicable steps of a design process, we were able to design, make and successfully test the prototype of such a device.
We designed the prototype device around the Raspberry Pi Zero W single-board computer. The sensors are off-the-shelf components, selected to meet the system requirements while also striving to minimise the cost. We manufactured the prototype device case using a FDM 3D printer. The operating system used on the Raspberry Pi is Linux with the RT-Preempt patched kernel and adjustments made to optimise the performance. The measuring application is developed in C and runs in userspace. The final version of the prototype runs automatically without any user intervention required to set-up and run the measuring application. The included battery capacity provides about 10 h of constant-on operation without recharging, which is sufficient for a typical 8-h shift of measuring even if the device is not connected to the vehicle on-board power.
The intermediate versions of the prototype and its final version were subject to different tests in a laboratory as well as in the field. We compared the measurements obtained from the prototype during some tests to those obtained from the Vericom VC4000DAQ performance computer, which is one of the most often used devices when it comes to vehicle braking testing. The comparison of the measurement results between the two devices shows that the designed prototype achieves performance comparable to the VC4000DAQ regarding all measurement parameters including sampling frequency, acceleration values and triggering thresholds. The material cost of the prototype device is about 10 to 15-times less than the retail price of the basic version of the VC4000 Brake Meter. As a proof of concept, we produced the second instance of the prototype. It is currently being used in extensive field tests along with the first prototype and various reference devices.
The flexible nature of the prototype device ensures that any changes in data acquisition algorithms and additions to the sensorics or auxiliary subsystems are easily implementable. One such possibility being considered is adding temperature sensors (such as DS1820) to some of the devices in order to be able to reliably measure the ambient temperature of the testing environment without with to rely on meteorological data. Another future addition to the prototype may be a GSM/LTE transceiver to enable continuous data transfer. In the future, we plan to use the collected data in a geographic information system (GIS) application for monitoring the history of road surface friction properties on the road network.
Author Contributions
M.A. prepared the initial concept for the presented prototype device, participated in the process of hardware selection, device software development, led the prototype production and testing, and developed the server application. U.H. and A.M. participated in the hardware selection, prototype construction and testing, and were the lead developers of the device software. R.K. supervised the component integration, software development, and participated in the final prototype testing and evaluation of the results. All the authors have jointly written and revised the manuscript, and prepared the graphical material.
Funding
The work presented in this article was partly funded by the Republic of Slovenia and the European Union from the European Social Fund and partly by the Slovenian Research Agency as part of the “Modelling in technics and medicine” (code P2-0109) and “Motion Analysis and Synthesis in Man and Machine” (code P2-0228) research programmes.
Acknowledgments
The authors wish to thank the company Cestel, d. o. o., for their continuous support of the presented research, and to the students Simon Grum, Rok Kogovšek, Rok Štefančič and Patrik Tarfila for their valuable contribution in prototype manufacturing and testing.
Conflicts of Interest
The authors declare no conflict of interest.
References
- Pardillo Mayora, J.; Jurado Piña, R. An assessment of the skid resistance effect on traffic safety under wet-pavement conditions. Accid. Anal. Prev. 2009, 41, 881–886. [Google Scholar] [CrossRef] [PubMed]
- Lindenmann, H.P. New findings regarding the significance of pavement skid resistance for road safety on Swiss freeways. J. Saf. Res. 2006, 37, 395–400. [Google Scholar] [CrossRef] [PubMed]
- Wallman, C.-G.; Åström, H. Friction Measurement Methods and the Correlation between Road Friction and Traffic Safety. A Literature Review; Swedish National Road and Transport Research Institute: Linköping, Sweden, 2001. [Google Scholar]
- Mataei, B.; Zakeri, H.; Zahedi, M.; Nejad, F.M. Pavement Friction and Skid Resistance Measurement Methods: A Literature Review. Open J. Civ. Eng. 2016, 6, 537–565. [Google Scholar] [CrossRef]
- Hammoudi, K.; Benhabiles, H.; Kasraoui, M.; Ajam, N.; Dornaika, F.; Radhakrishnan, K.; Bandi, K.; Cai, Q.; Liu, S. Developing vision-based and cooperative vehicular embedded systems for enhancing road monitoring services. Procedia Comput. Sci. 2015, 52, 389–395. [Google Scholar] [CrossRef]
- Andria, G.; Attivissimo, F.; Di Nisio, A.; Lanzolla, A.M.L.; Pellegrino, A. Development of an automotive data acquisition platform for analysis of driving behavior. Measurement 2016, 93, 278–287. [Google Scholar] [CrossRef]
- Virant, M.; Ambrož, M. Universal Safety Distance Alert Device for Road Vehicles. Electronics 2016, 5, 19. [Google Scholar] [CrossRef]
- Ambrož, M. Raspberry Pi as a low-cost data acquisition system for human powered vehicles. Measurement 2017, 100, 7–18. [Google Scholar] [CrossRef]
- Lewis, A.J.; Campbell, M.; Stavroulakis, P. Performance evaluation of a cheap, open source, digital environmental monitor based on the Raspberry Pi. Measurement 2016, 87, 228–235. [Google Scholar] [CrossRef]
- Mydlarz, C.; Salamon, J.; Bello, J.P. The implementation of low-cost urban acoustic monitoring devices. Appl. Acoust. 2016, 117, 207–218. [Google Scholar] [CrossRef]
- Pasquali, V.; D’Alessandro, G.; Gualtieri, R.; Leccese, F. A new data logger based on Raspberry-Pi for Arctic Notostraca locomotion investigations. Measurement 2017, 110, 249–256. [Google Scholar] [CrossRef]
- Pasquali, V.; Gualtieri, R.; D’Alessandro, G.; Granberg, M.; Hazlerigg, D.; Cagnetti, M.; Leccese, F. Monitoring and analyzing of circadian and ultradian locomotor activity based on Raspberry-Pi. Electronics 2016, 5, 58. [Google Scholar] [CrossRef]
- Gómez, A.; Cuiñas, D.; Catalá, P.; Xin, L.; Li, W.; Conway, S.; Lack, D. Use of Single Board Computers as Smart Sensors in the Manufacturing Industry. Procedia Eng. 2015, 132, 153–159. [Google Scholar] [CrossRef]
- Lu, Y.-S.; Wan, H.-W.; Liu, S.-H. An integrated accelerometer for dynamic motion systems. Measurement 2018, 125, 471–475. [Google Scholar] [CrossRef]
- Vujović, V.; Maksimović, M. Raspberry Pi as a Sensor Web node for home automation. Comput. Electr. Eng. 2015, 44, 153–171. [Google Scholar] [CrossRef]
- Leccese, F.; Cagnetti, M.; Di Pasquale, S.; Giarnetti, S.; Caciotta, M. A new power quality instrument based on Raspberry-Pi. Electronics 2016, 5, 64. [Google Scholar] [CrossRef]
- Leccese, F.; Cagnetti, M.; Trinca, D. A smart city application: A fully controlled street lighting isle based on Raspberry-Pi card, a ZigBee sensor network and WiMAX. Sensors 2014, 14, 24408–24424. [Google Scholar] [CrossRef] [PubMed]
- Leccese, F.; Cagnetti, M.; Calogero, A.; Trinca, D.; di Pasquale, S.; Giarnetti, S.; Cozzella, L. A new acquisition and imaging system for environmental measurements: An experience on the Italian cultural heritage. Sensors 2014, 14, 9290–9312. [Google Scholar] [CrossRef] [PubMed]
- Ma, H.; Chu, X.; Xue, D.; Chen, D. A systematic decision making approach for product conceptual design based on fuzzy morphological matrix. Expert Syst. Appl. 2017, 81, 444–456. [Google Scholar] [CrossRef]
- Regulation No 13 of the Economic Commission for Europe of the United Nations (UN/ECE). Uniform Provisions Concerning the Approval of Vehicles of Categories M, N and O with Regard to Braking; UN/ECE: Geneva, Switzerland, 2016; Volume 194. [Google Scholar]
- Raspberry Pi Foundation. Raspberry Pi Zero W. Available online: https://www.raspberrypi.org/products/raspberry-pi-zero-w/ (accessed on 30 November 2018).
- Johnston, S.J.; Cox, S.J. The raspberry Pi: A technology disrupter, and the enabler of dreams. Electronics 2017, 6, 51. [Google Scholar] [CrossRef]
- Raspberry Pi Foundation. Raspbian. Available online: https://www.raspberrypi.org/downloads/raspbian/ (accessed on 30 November 2018).
- Debian—The Universal Operating System. Available online: https://www.debian.org (accessed on 30 November 2018).
- Real-Time Linux. Available online: https://wiki.linuxfoundation.org/realtime/start (accessed on 30 November 2018).
- Real-Time Linux Wiki. Available online: https://rt.wiki.kernel.org/index.php/Main_Page (accessed on 19 November 2018).
- The Linux Foundation. Cyclictest. Available online: https://wiki.linuxfoundation.org/realtime/documentation/howto/tools/cyclictest/ (accessed on 30 November 2018).
- CONSKID—Connected System for Acquisition and Analysis of Driving Surface Friction Properties. Available online: https://github.com/FSKMTM/CONSKID (accessed on 21 November 2018).
- Wiring Pi, GPIO Interface library for the Raspberry Pi. Available online: http://wiringpi.com/ (accessed on 30 November 2018).
- NMEA Data. Available online: https://www.gpsinformation.org/dale/nmea.htm (accessed on 30 November 2018).
- freedesktop.org. Systemd. Available online: https://www.freedesktop.org/wiki/Software/systemd/ (accessed on 30 November 2018).
- Rsync. Available online: https://rsync.samba.org/ (accessed on 30 November 2018).
- Vericom LLC. VC4000DAQ Performance Computer. Available online: https://www.vericomcomputers.com/products/performance-computers/vc4000daq/ (accessed on 30 November 2018).
- TDK InvenSense. MPU-9250, Nine-Axis (Gyro + Accelerometer + Compass) MEMS MotionTracking™ Device. Available online: https://www.invensense.com/products/motion-tracking/9-axis/mpu-9250/ (accessed on 30 November 2018).
Figure 1.
Relation between wheel slip and friction on different surfaces.

Figure 2.
Schematics of the prototype device.

Figure 3.
Finished prototype of the device.

Figure 4.
Measurement application program flow.

Figure 5.
(a) Breadboard prototype on the calibrated measurement device during initial testing; (b) Finished prototype and the calibrated measurement device mounted on the vehicle windshield, ready for brake testing.
Figure 5.
(a) Breadboard prototype on the calibrated measurement device during initial testing; (b) Finished prototype and the calibrated measurement device mounted on the vehicle windshield, ready for brake testing.

Figure 6.
Preliminary test with noise still present in the prototype signal.

Figure 7.
Preliminary test with 10 HZ low-pass filter applied to prototype accelerometer signal.

Figure 8.
(a) Schematics of the tilting device; (b) Comparison of recorded acceleration time series during a test on the tilting device.
Figure 8.
(a) Schematics of the tilting device; (b) Comparison of recorded acceleration time series during a test on the tilting device.

Figure 9.
Measured acceleration during braking (passenger car on dry tarmac, 65 km/h, test #2).

Figure 10.
Measured acceleration during braking (passenger car on wet skid-pad, 40 km/h, test #20).


Table 1.
Morphological matrix.
| Function/Implementation | Option 1 | Option 2 | Option 3 |
|---|---|---|---|
| data acquisition and storage | single board computer with on-board storage | generic microcontroller with storage capacity | purpose-built data logger |
| kinematics measurement | analogue single axis accelerometer | SPI/I2C 3-axis accelerometer | SPI/I2C 6-DOF IMU |
| location measurement | USB GNSS module | SPI/I2C GNSS module | GSM/LTE/GPS combination |
| wireless data transfer | GSM/LTE | WiFi pull | WiFi push |
| mounting to vehicle | magnetic | velcro | suction cup |
| device enclosure | ready-made | folded sheet plastic | 3D printed |
Table 2.
Components selected for the prototype.
| Function | Component | Characteristics | Approximate Unit Cost |
|---|---|---|---|
| Acceleration measurement | Tri-axial accelerometer with IMU based on MPU-9250 | I2C/SPI interface, 16-bit resolution, 2–16 g range | 15.00€ |
| Location acquisition | USB GNSS receiver based on u-blox M8N | Simultaneous receive of up to 3 GNSS, 2.5 m accuracy, up to 10 Hz update rate | 28.00€ |
| Central computer, data acquisition, storage and transfer | Raspberry Pi Zero W | 1 GHz ARM CPU, 512 MB RAM, 802.11 b/g/n WLAN, 8 GB micro SD card for OS and storage | 12.00€ |
| Power storage | 18650 Li-ion battery | 3.7 V, 3000 mAh | 10.00€ |
| Power management | Adafruit Powerboost 1000C | 5 V 1 A load-sharing power supply, simultaneous battery charging and power output | 19.90€ |
| User interface | Two buttons with built-in LED (red, green) | Momentary switch with pull-up resistor and LED with series resistor | 6.00€ |
| Casing | Custom case for components | 3D-printed from PLA, mounts and openings for built-in components | 4.00€ |
| Mounting into vehicle | Suction cup mount | Adjustable arm angle, rubber suction cup | 2.50€ |
| Total | 97.40€ | ||
Table 3.
Latency as reported by cyclictest on the prototype device.
| Sampling Interval | Loop Count | Min. Latency | Avg. Latency | Max. Latency |
|---|---|---|---|---|
| (µs) | (µs) | (µs) | (µs) | |
| 1000 | 100,000 | 14 | 39 | 103 |
| 500 | 100,000 | 14 | 36 | 88 |
| 200 | 100,000 | 12 | 23 | 70 |
| 100 | 100,000 | 13 | 20 | 100 |
| 50 | 100,000 | 13 | 18 | 127 |
| 20 | 100,000 | 15 | 29 | 129 |
Table 4.
Application modules.
| Rtos | Implementation of a cyclic real time operating system scheduler |
| tasks | Descriptions of task objects and their corresponding functions |
| serial_read | Driver for peripheral GNSS component |
| mpu_9250 | Driver for peripheral IMU component |
| i2c | Driver for i2c protocol |
| gpio | Driver for general purpose input/output pins |
| Fifo | Definition of a universal “first in first out” data buffer constructor |
| data_save | Functionalities connected with saving measurement data |
| measurement_flow | Finite state machine for program flow |
| measurements | Directory used for measurement data storage |
Table 5.
Statistical comparison of measured data between the prototype device and the VC4000DAQ.
| Test # | Type | (g) | tm (s) | (%) | Δtm (%) | Pearson |
|---|---|---|---|---|---|---|
| 1 | Zafira on tarmac, 60 km/h | −0.74 | 2.57 | 1.64 | −1.17 | 0.87 |
| 2 | Zafira on tarmac, 65 km/h | −0.67 | 2.88 | 0.36 | 1.04 | 0.89 |
| 3 | Zafira on tarmac, 60 km/h | −0.71 | 2.65 | 1.07 | −1.13 | 0.87 |
| 4 | Zafira on tarmac, 60 km/h | −0.68 | 2.61 | 1.36 | −1.53 | 0.92 |
| 5 | Zafira on gravel, 40 km/h | −0.52 | 2.21 | 0.23 | −1.81 | 0.77 |
| 6 | Zafira on gravel, 48 km/h | −0.49 | 2.79 | −0.02 | −1.43 | 0.86 |
| 7 | Zafira on gravel, 38 km/h | −0.50 | 2.21 | 0.81 | −1.36 | 0.73 |
| 8 | Clio on wet skid pad, ~40 km/h | −0.41 | 3.02 | 3.22 | −0.66 | 0.93 |
| 9 | Clio on wet skid pad, ~40 km/h | −0.41 | 3.04 | 3.33 | −0.66 | 0.88 |
| 10 | Clio on wet skid pad, ~40 km/h | −0.42 | 2.99 | 3.50 | −0.67 | 0.92 |
| 11 | Clio on wet skid pad, ~40 km/h | −0.45 | 2.74 | 4.45 | −0.73 | 0.82 |
| 12 | Clio on wet skid pad, ~40 km/h | −0.42 | 2.85 | 4.53 | −0.70 | 0.86 |
| 13 | Clio on wet skid pad, ~40 km/h | −0.41 | 2.80 | 4.26 | −1.07 | 0.86 |
| 14 | Clio on dry tarmac, ~50 km/h | −0.80 | 1.43 | 5.46 | −2.80 | 0.94 |
| 15 | Clio on dry tarmac, ~50 km/h | −0.78 | 1.51 | 4.91 | −1.99 | 0.93 |
| 16 | Clio on dry tarmac, ~50 km/h | −0.81 | 1.50 | 3.77 | −1.33 | 0.98 |
| 17 | Clio on dry tarmac, ~50 km/h | −0.79 | 1.34 | 3.59 | −1.42 | 0.88 |
| 18 | Clio on dry tarmac, ~50 km/h | −0.80 | 1.40 | 4.94 | −2.86 | 0.91 |
| 19 | Clio on dry tarmac, ~50 km/h | −0.80 | 1.41 | 4.17 | −2.13 | 0.93 |
| 20 | Clio on wet skid pad, ~40 km/h | −0.30 | 3.38 | 1.86 | 0.30 | 0.88 |
| Root Mean Square | 3.35 | 1.50 | 0.88 |
© 2019 by the authors. Licensee MDPI, Basel, Switzerland. This article is an open access article distributed under the terms and conditions of the Creative Commons Attribution (CC BY) license (http://creativecommons.org/licenses/by/4.0/).
Share and Cite
MDPI and ACS Style
Ambrož, M.; Hudomalj, U.; Marinšek, A.; Kamnik, R. Raspberry Pi-Based Low-Cost Connected Device for Assessing Road Surface Friction. Electronics 2019, 8, 341. https://doi.org/10.3390/electronics8030341
AMA Style
Ambrož M, Hudomalj U, Marinšek A, Kamnik R. Raspberry Pi-Based Low-Cost Connected Device for Assessing Road Surface Friction. Electronics. 2019; 8(3):341. https://doi.org/10.3390/electronics8030341
Chicago/Turabian StyleAmbrož, Miha, Uroš Hudomalj, Alexander Marinšek, and Roman Kamnik. 2019. "Raspberry Pi-Based Low-Cost Connected Device for Assessing Road Surface Friction" Electronics 8, no. 3: 341. https://doi.org/10.3390/electronics8030341
Note that from the first issue of 2016, this journal uses article numbers instead of page numbers. See further details here.