
Comparing the Use of Two Different Approaches to Assess Teachers’ Knowledge of Models and Modeling in Science Teaching

Department of STEM Education, North Carolina State University, Raleigh, NC 27695, USA
*
Author to whom correspondence should be addressed.
Educ. Sci. 2023, 13(4), 405; https://doi.org/10.3390/educsci13040405
Submission received: 3 February 2023
/
Revised: 3 April 2023
/
Accepted: 10 April 2023
/
Published: 17 April 2023
(This article belongs to the Special Issue Practices in Science and Engineering Education)
Abstract
:Science teacher knowledge for effective teaching consists of multiple knowledge bases, one of which includes science content knowledge and pedagogical knowledge. With the inclusion of science and engineering practices into the national science education standards in the US, teachers’ content knowledge goes beyond subject matter knowledge and into the realm of how scientists use practices for scientific inquiry. This study compares two approaches to constructing and validating two different versions of a survey that aims to measure the construct of teachers’ knowledge of models and modeling in science teaching. In the first version, a 24-item Likert scale survey containing content and pedagogical knowledge items was found to lack the ability to distinguish different knowledge levels for respondents, and validation through factor analysis indicated content and pedagogical knowledge items could not be separated. Findings from the validation results of the first survey influenced revisions to the second version of the survey, a 25-item multiple-choice instrument. The second survey employed a competence model framework for models and modeling for item specifications, and results from exploratory factor analysis revealed this approach to assessing the construct to be more appropriate. Recommendations for teacher assessment of science practices using competence models and points to consider in survey design, including norm-referenced or criterion-referenced tests, are discussed.
1. Introduction
Reform efforts in K-12 science education in the US over the past two decades have shifted the focus away from science disciplinary knowledge and towards work that more closely resembles the true work of scientists [1]. The Next Generation Science Standards (NGSS) [2] place an emphasis on science practices as a major means for students to learn conceptual, procedural, and epistemic understandings of science [3]. Students use science practices to serve as their own epistemic agents of science learning [4,5]; in doing so, they become more scientifically literate citizens [2,6]. One such practice, developing and using models, is noted as having the largest impact on student learning outcomes due to its ability to promote inquiry [7,8]. Other studies showcase effective teaching strategies where modeling is found to improve students’ abilities to reason with evidence [9], promote science integration skills [10], help students view science phenomena in the context of a system [11], and serve as a source of STEM integration by promoting data literacy [12] and engineering design [13]. These findings are one of the many reasons why numerous scholars suggest that modeling be the centerpiece of science teaching today [14,15,16].
Despite these promising outcomes on student learning, teachers do not readily implement science practices, including modeling, into their science classrooms [17,18] and literature suggests modeling, in particular, is not being implemented by teachers in a way that aligns with the way modeling is done by scientists [19,20,21,22]. A main reason for this limited implementation of modeling is a lack of knowledge about (1) how models function in science and (2) how to employ models as epistemic tools in the science classroom [1,5,23]. With this in mind and conceptualizing how models function in science as content knowledge of models, or CK, and how to employ models as epistemic tools in the science classroom as pedagogical knowledge of models, or PK, we have conducted a study that aims to develop and validate an instrument which measures both domains (CK and PK) of teachers’ knowledge of models and modeling in science teaching, called KMM-ST hereafter. The major assumption underlying the study is that CK and PK are two separate bodies of knowledge essential to the development of pedagogical content knowledge (PCK) required for effective science teaching since PCK is an amalgamation of CK and PK [24], even though it is more than the sum of both [25,26].
Previous studies to measure teacher knowledge for teaching science through models and modeling [27,28,29,30,31] tend to focus on measuring the knowledge base through the lens of pedagogical content knowledge (PCK) as it is defined by Lee Shulman [24] and Shirley Magnusson [32], where PCK is composed of several elements (e.g., orientations toward teaching, knowledge of the curriculum, knowledge of assessment, knowledge of students, knowledge of instructional strategies). However, few studies involve measuring CK and PK as distinct bodies of knowledge from PCK that function as parental knowledge bases for PCK development [26], mainly due to the lack of appropriate instruments to assess CK and PK. Such studies on CK and PK will contribute to our better understanding of the relationship among CK, PK, and PCK in the context of model-based science teaching. This current study responds to this need.
Through an iterative process of development and validation of two versions of the KMM-ST survey using different approaches to item construction, we explore the plausibility of having a single instrument which can quantitatively measure the construct of the KMM-ST. Results from both rounds of validation offer insights into the clarification of the KMM-ST construct and the boundaries of measuring this construct. Supported by PCK research, our findings in the validation of the first version of the survey showed CK and PK as being highly integrated components. These findings influenced the construction of the second version of the survey, in which we purposefully constructed CK test items using different item specifications from PK test items and validated them separately. Because validation is still being conducted on PK items from the second survey, we only report findings from CK items in the second survey in this paper. Conceptual frameworks and methodological approaches utilized in this study can serve as a prototype model for researchers interested in developing measures of teacher knowledge necessary for the effective implementation of other science practices besides developing and using models. In addition, the final KMM-ST instrument can pave the way for future studies that examine relationships between teacher knowledge, teaching practices, and student-related variables.
2. Theoretical Backgrounds
2.1. Conceptualizations of the KMM-ST Construct Used to Develop the 1st Version Survey
2.1.1. Content Knowledge for Models and Modeling
Shulman’s [24] seminal work in PCK frames CK and PK as the knowledge domains that teachers must enact together to make science content understandable for students. In the context of modeling, CK is knowledge about how models and modeling function in science, for which there is a wealth of literature that has focused on the identification of this construct [30,31,33,34] as well as ways to measure and assess this construct [35,36]. Since modeling was identified as one of the eight science and engineering practices by the NGSS, much of the research has focused on students, aiming to identify what students should learn about models/modeling and how the uptake of this knowledge occurs. By viewing teachers as adult learners who must possess the CK that they expect their students to learn, we can use the research on students’ CK of models/modeling to build the construct of CK. Regarding what students should learn, many researchers agree that students should have knowledge of modeling practices [30,31,36]. This refers to the iterative process of modeling, which includes phases of model construction, model testing or evaluation, and model revision and is often referred to as the conceptual understanding of modeling [37].
In addition to this knowledge, there is a consensus among researchers that students should have an epistemological understanding of models [30,31,33,34,36]. Seminal work investigating this domain of CK coined the term “metamodeling knowledge” [33] (p. 166) and referred to it as students’ knowledge of the nature and purposes of models. In a review of model-based learning literature, Louca and Zacharia [37] concluded that teaching students to develop and use models (i.e., modeling practices) is not enough to satisfy what reform documents expect of students in reference to science practices. Rather, there should be a “meta-modeling layer” [37] (p. 485) in which this metamodeling knowledge is explicitly taught and integrated into the iterative modeling cycle. Given the consensus on knowledge of modeling practices and metamodeling knowledge, our initial conceptual framework of KMM-ST was built using these two components to operationalize the CK subconstruct within KMM-ST.
2.1.2. Pedagogical Knowledge for Models and Modeling
Science teachers play a crucial role in facilitating students’ engagement with models and modeling [1,38]. In Todd Campbell and colleagues’ review study, they refer to pedagogies that are specifically linked to the use of models and modeling in the classroom as “modeling pedagogies” [19] (p. 159). While this review was conducted using literature prior to the release of NGSS, their findings showed that in the majority of studies, teachers use modeling pedagogies to teach content rather than to teach scientific inquiry and science practices. This is consistent with Gouvea and Passmore’s [5] useful heuristic of models of versus models for. They claim that many teachers are using models to represent or illustrate a phenomenon (models of) when, in fact, they should be using the models as tools for inquiring (models for), as this is the way models are used in science and is the way the NGSS posits models should be used. Therefore, teachers who are adopting a models for view would be those who are using modeling pedagogies that show connections to other science and engineering practices as students engage in inquiry.
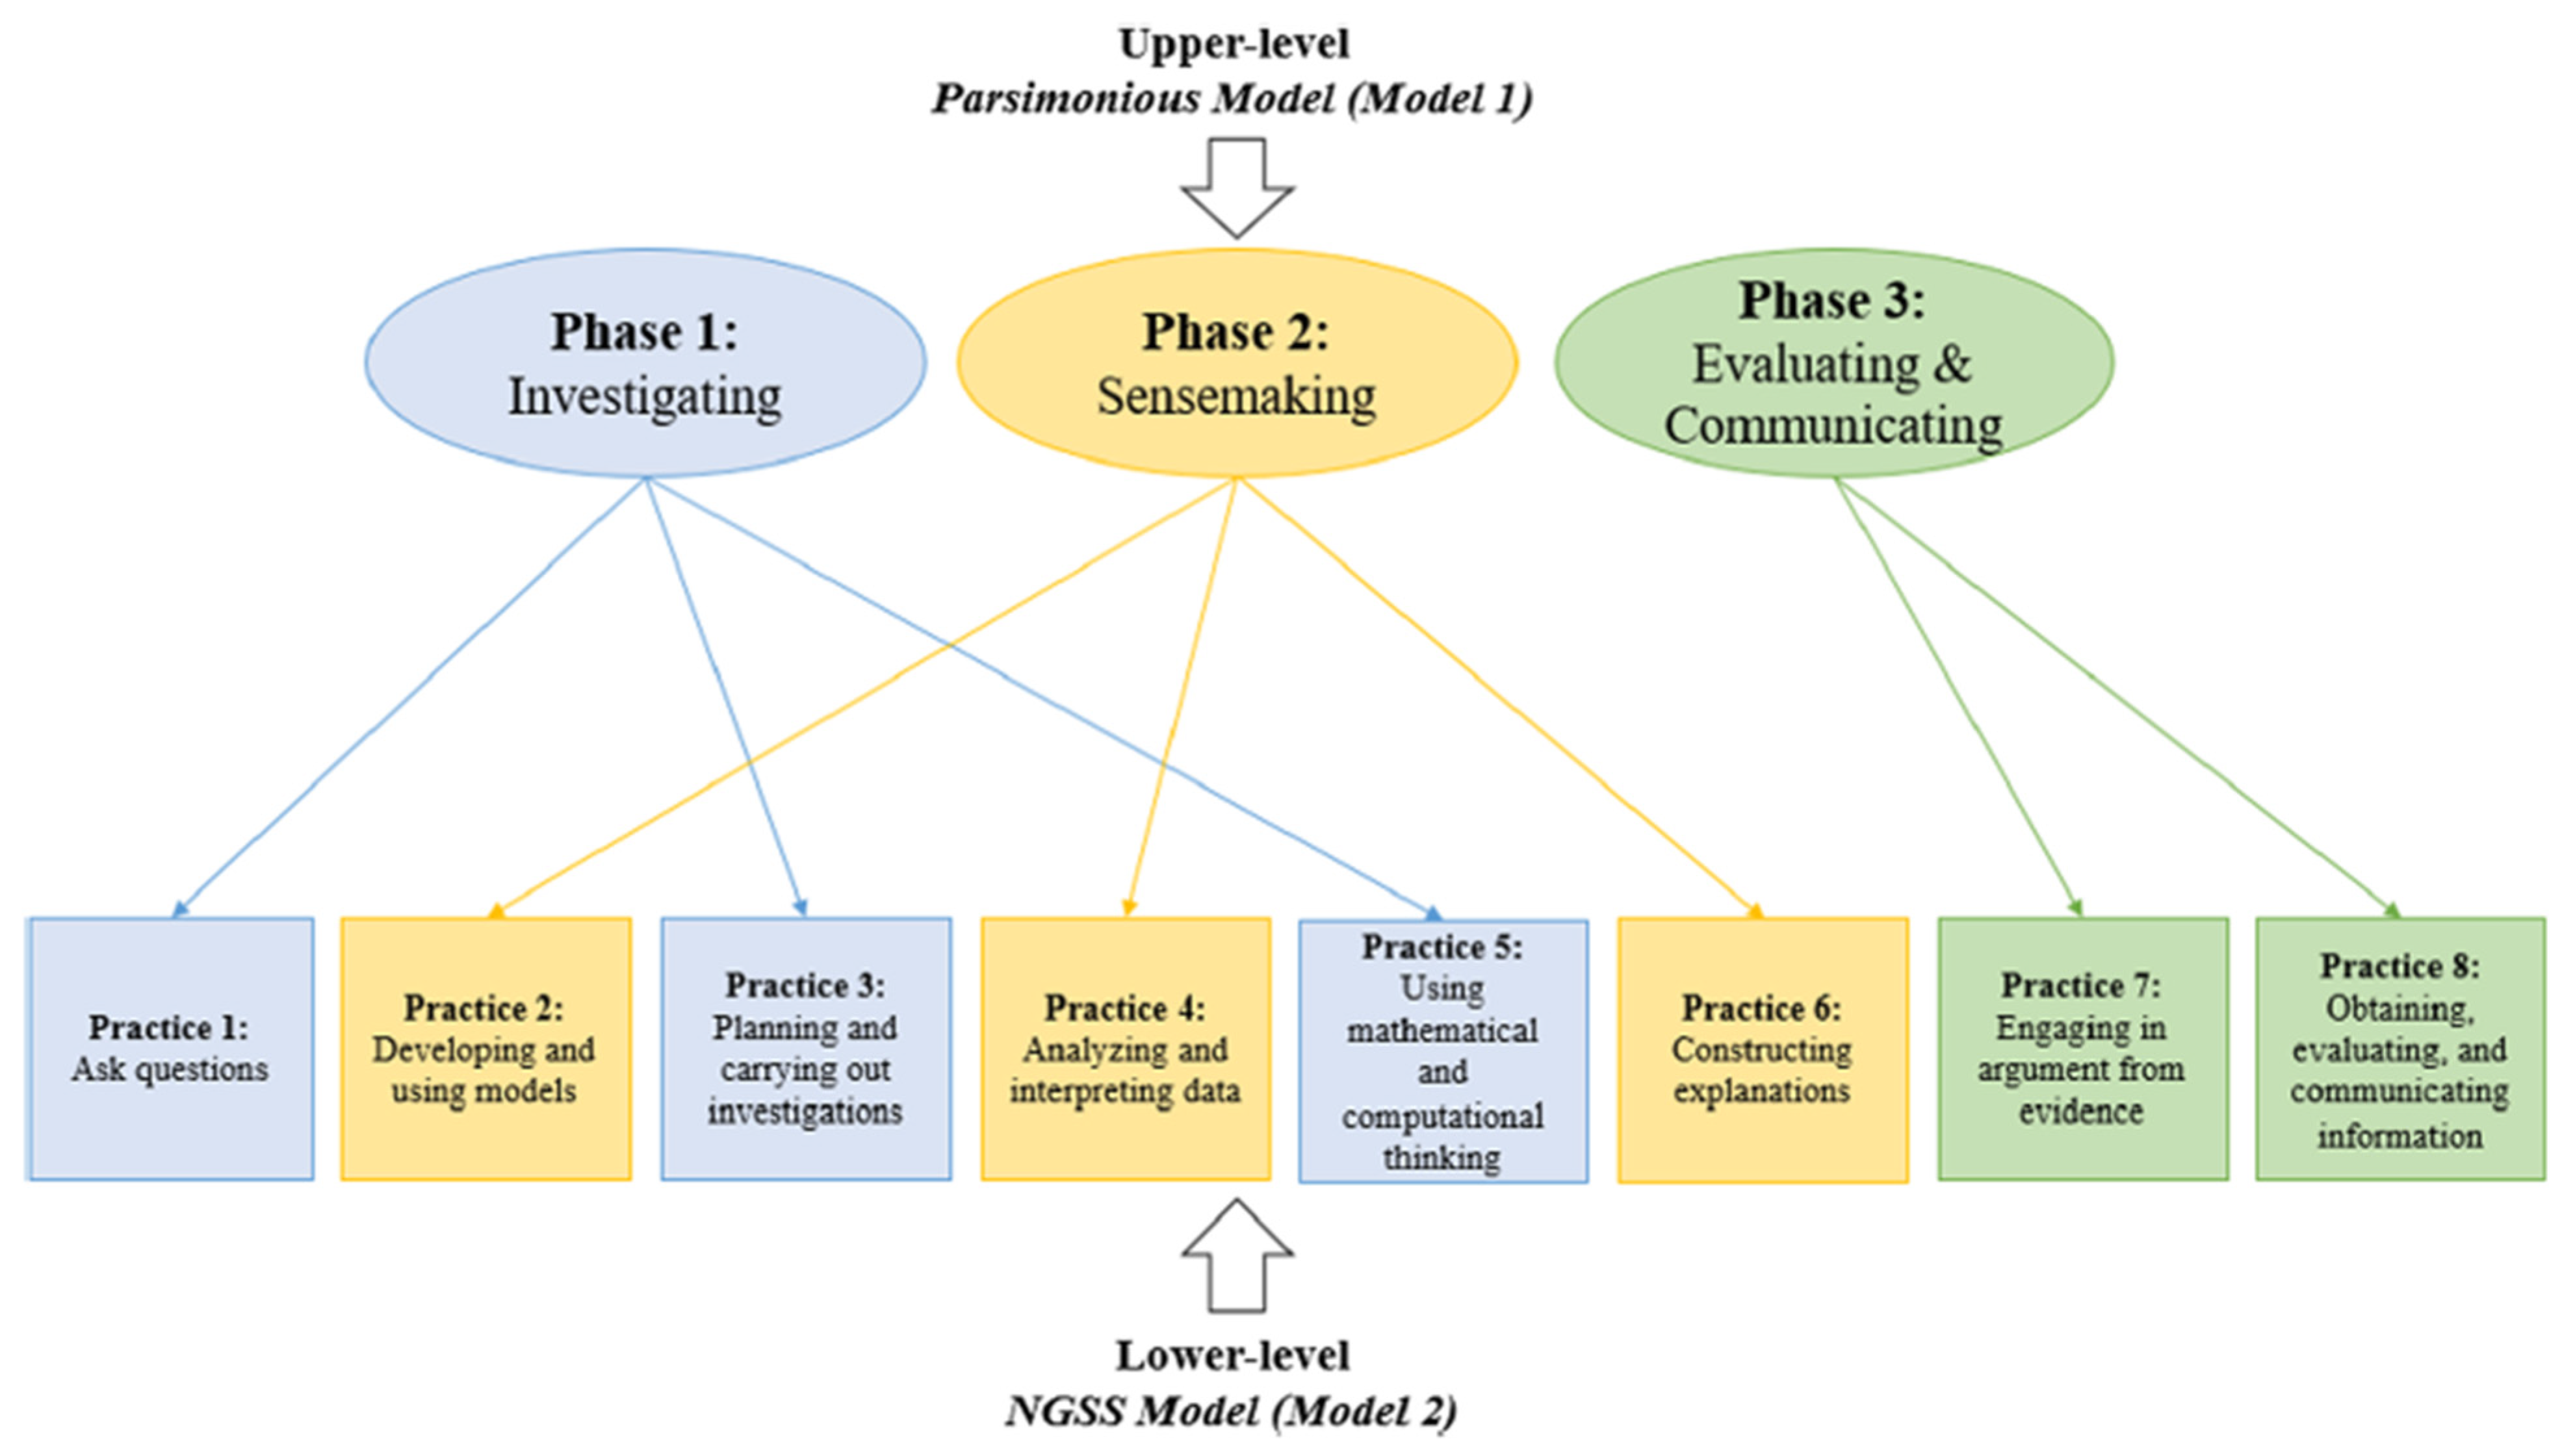
Chen and Terada [7] offer a helpful conceptual model for making sense of how models might integrate with other science and engineering practices. Their comprehensive model places each of the eight science and engineering practices within one of the three phases of knowledge development that occur during the inquiry cycle: (1) investigating, (2) sensemaking, (3) evaluating and communicating. In the investigating phase, students are sharing their prior knowledge, and the teacher is eliciting student ideas related to the scientific phenomena [7]. In the sensemaking phase, students are dealing with their data from the investigation phase, and the teacher is facilitating any changes in student thinking that may occur as a result of their analysis and interpretation of findings [7]. In the evaluation and communication phase, students collaboratively critique the findings until a class consensus is reached, and the teacher works to establish and support the routines and procedures necessary for productive evaluation and communication in a scientific community [7].
2.1.3. Initial KMM-ST Conceptual Framework
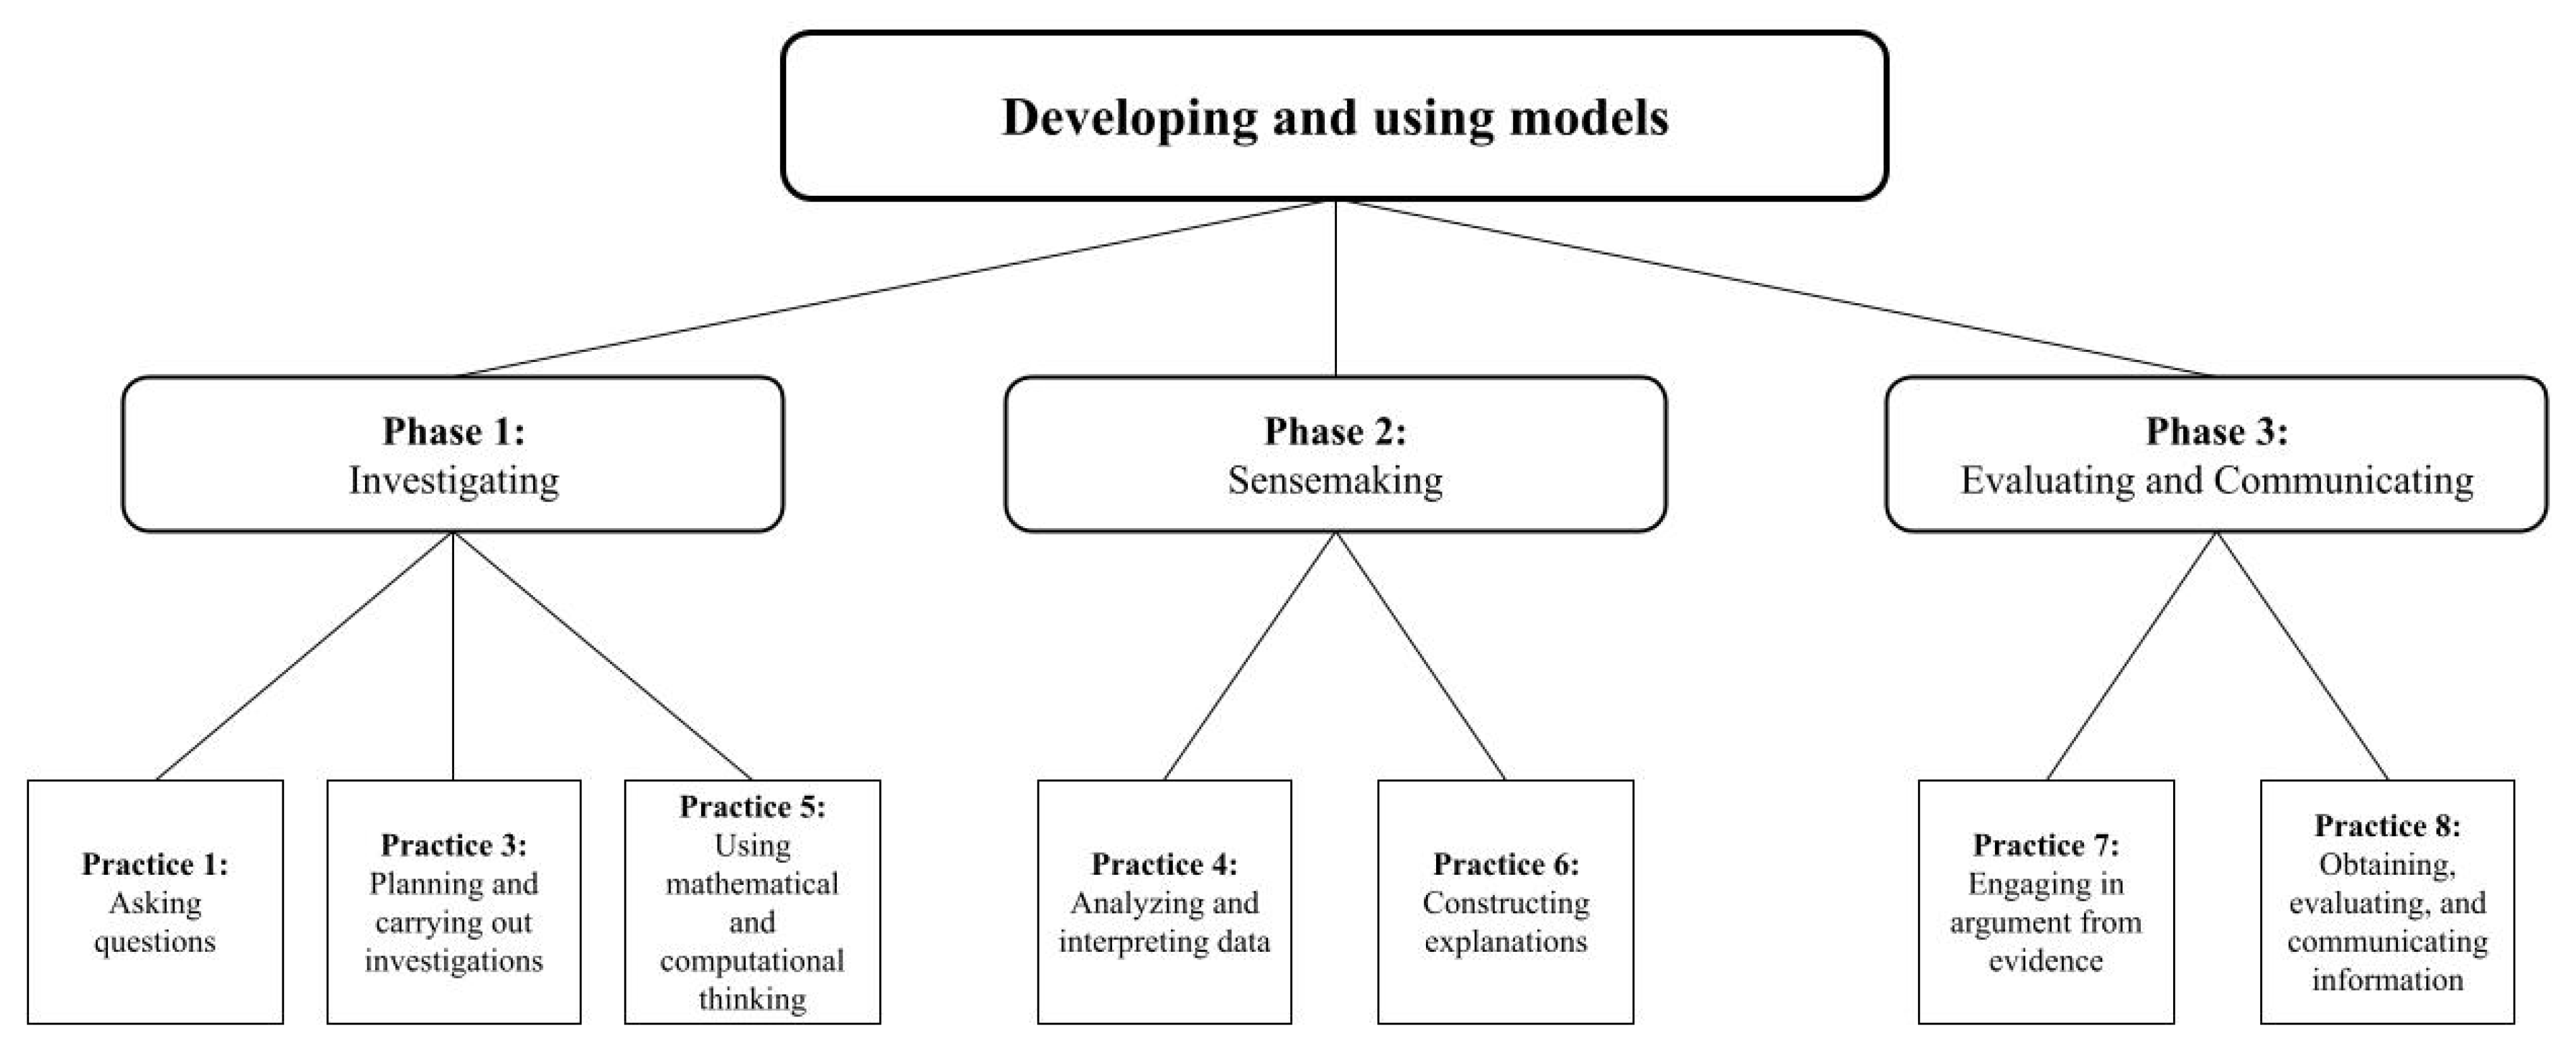
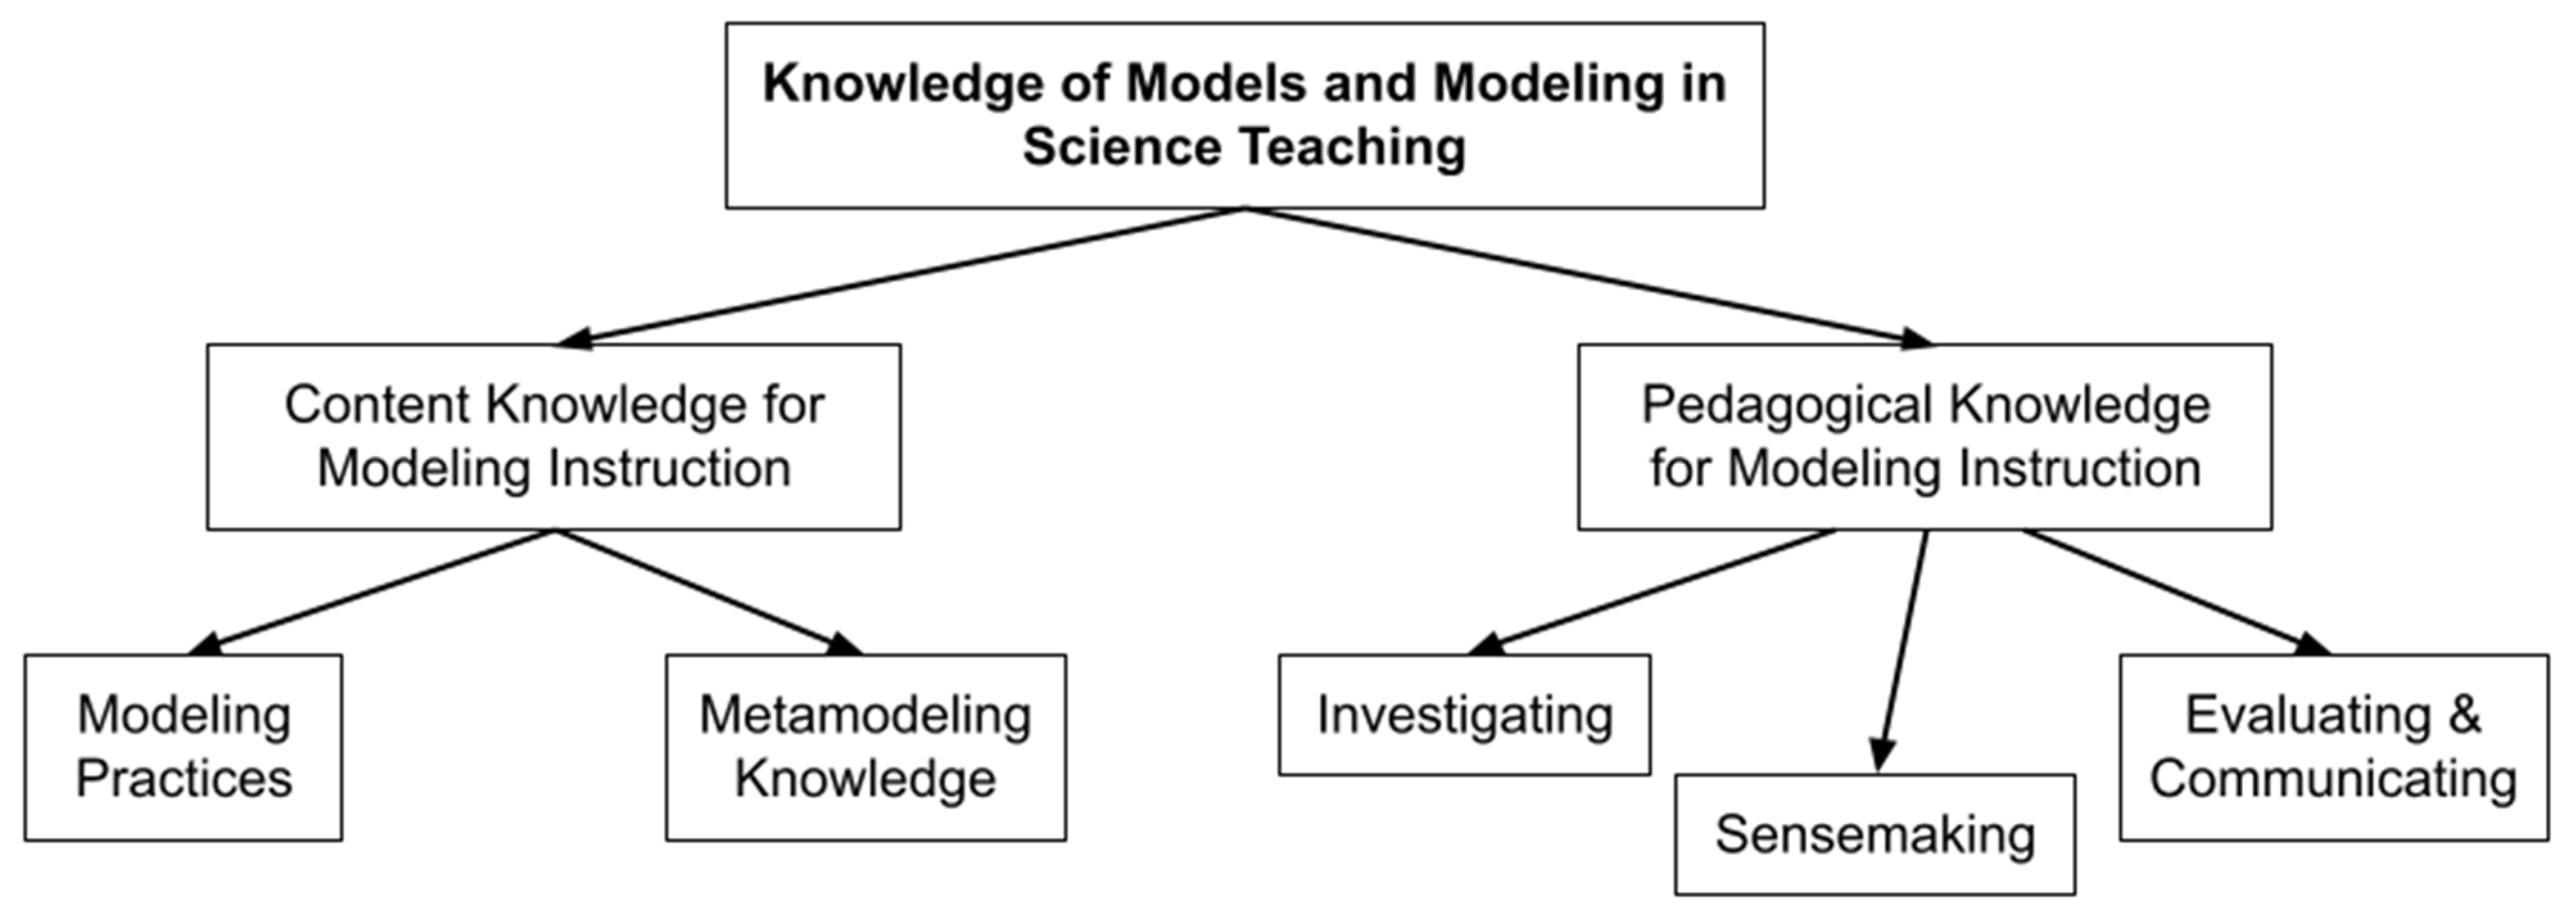
Using the aforementioned theoretical underpinnings of CK and PK for models and modeling, we developed an initial KMM-ST framework that was used as the conceptual framework on which items were designed for the initial KMM-ST survey (1st version survey). KMM-ST has two subconstructs, CK and PK. The CK subconstruct consists of knowledge regarding modeling practices and metamodeling knowledge. Modeling practices are defined as a teacher’s understanding of a series of iterative steps such as construction, use, evaluation, and revision [31]. Metamodeling knowledge is defined as the metacognitive awareness of the nature and purposes of models while in the process of modeling [33]. This metacognitive awareness helps scientists make decisions about their models and how to move forward in a modeling iteration. For the PK subconstruct, we argue that in order for teachers to demonstrate their knowledge of modeling pedagogies, they will need to show evidence of knowledge of pedagogical moves that can be implemented across the three different phases of knowledge development during inquiry. That is to say, if we were to modify Chen and Terada’s [7] comprehensive model to have modeling at the core, a teacher should have knowledge of how modeling pedagogies can be used across all three phases of inquiry. Figure 2 shows how we envision this.
At the investigating phase, teachers demonstrate their knowledge of modeling pedagogies by showing evidence of ways that models or modeling can be used to encourage students to ask questions, plan out investigations, or be used synergistically with mathematical or computational thinking. At the sensemaking phase, teachers demonstrate knowledge of modeling pedagogies by showing evidence of how models or modeling are integrated into students’ analysis and interpretation of data and their ability to construct explanations. At the evaluating and communicating stage, teachers demonstrate knowledge of modeling pedagogies by showing evidence of how models can be used in the process of argumentation and in obtaining, evaluating, and communicating information. The entire KMM-ST conceptual framework, shown in Figure 3, was used to construct items for our initial KMM-ST survey.
2.2. Conceptualizations of the KMM-ST Construct Used to Develop the 2nd Version of the Survey
Findings from the administration and validation of the 1st version of the survey informed our revision of the KMM-ST framework. Specifically, it confirmed that CK and PK are tightly integrated components in KMM-ST, which is elaborated in Section 4. While revisions were made to both the CK and PK subconstructs of the framework, this paper only focuses on the revisions to CK as the revisions to PK are still underway and ongoing. Thus, the theoretical underpinnings that support the revision to the CK subconstruct are described here, while future work will describe and elaborate on the revisions to the PK subconstruct.
While there is agreement in the modeling literature regarding what students should know regarding modeling CK (i.e., modeling practices and metamodeling knowledge), how scholars represent the uptake of this knowledge falls into two different categories: (1) learning progressions and (2) competence models. Both are models which illustrate student learning with regard to a particular topic, and both models have been constructed for modeling in science education (see [31] for the learning progression model and [39] for the competence model). Of these two models, the competence model has been the most extensively investigated [40], having been theoretically derived but then further refined through empirical examination [34]. Additionally, the theoretical basis for the model considered literature from both students’ knowledge of models and modeling [41] as well as teachers’ (e.g., pre-service and in-service) knowledge [42].
A deeper dive into this competence model, called the Framework for Modeling Competence (FMC), shown in Table 1, shows modeling competence as being composed of five components: (1) nature of models, (2) multiple models, (3) purpose of models, (4) testing of models, and (5) changing models.
In the initial conceptualization of CK within the KMM-ST framework, we considered modeling practices and metamodeling knowledge to be two separate components, or factors; however, many scholars believe metamodeling knowledge to be subsumed into modeling practices [37]. This was the assumption with the FMC and was also supported by our validation work with the 1st version of the survey. When considering that, the FMC identifies three levels of increasing sophistication that students or teachers could demonstrate to show their knowledge of modeling, both in relation to their knowledge of modeling practices as well as their knowledge of metacognitive aspects of modeling. Level 1 for any component shows evidence that the individual does not examine the model in relation to the phenomenon that it represents. Level 2 for any component shows evidence that the individual recognizes the need to compare it to the phenomenon, but the focus is on using the model as a representative tool (i.e., model of [5]). Level 3 for any component shows evidence that the individual compares the model to the phenomenon and uses the model for the purpose of generating knowledge.
Revised KMM-ST Conceptual Framework
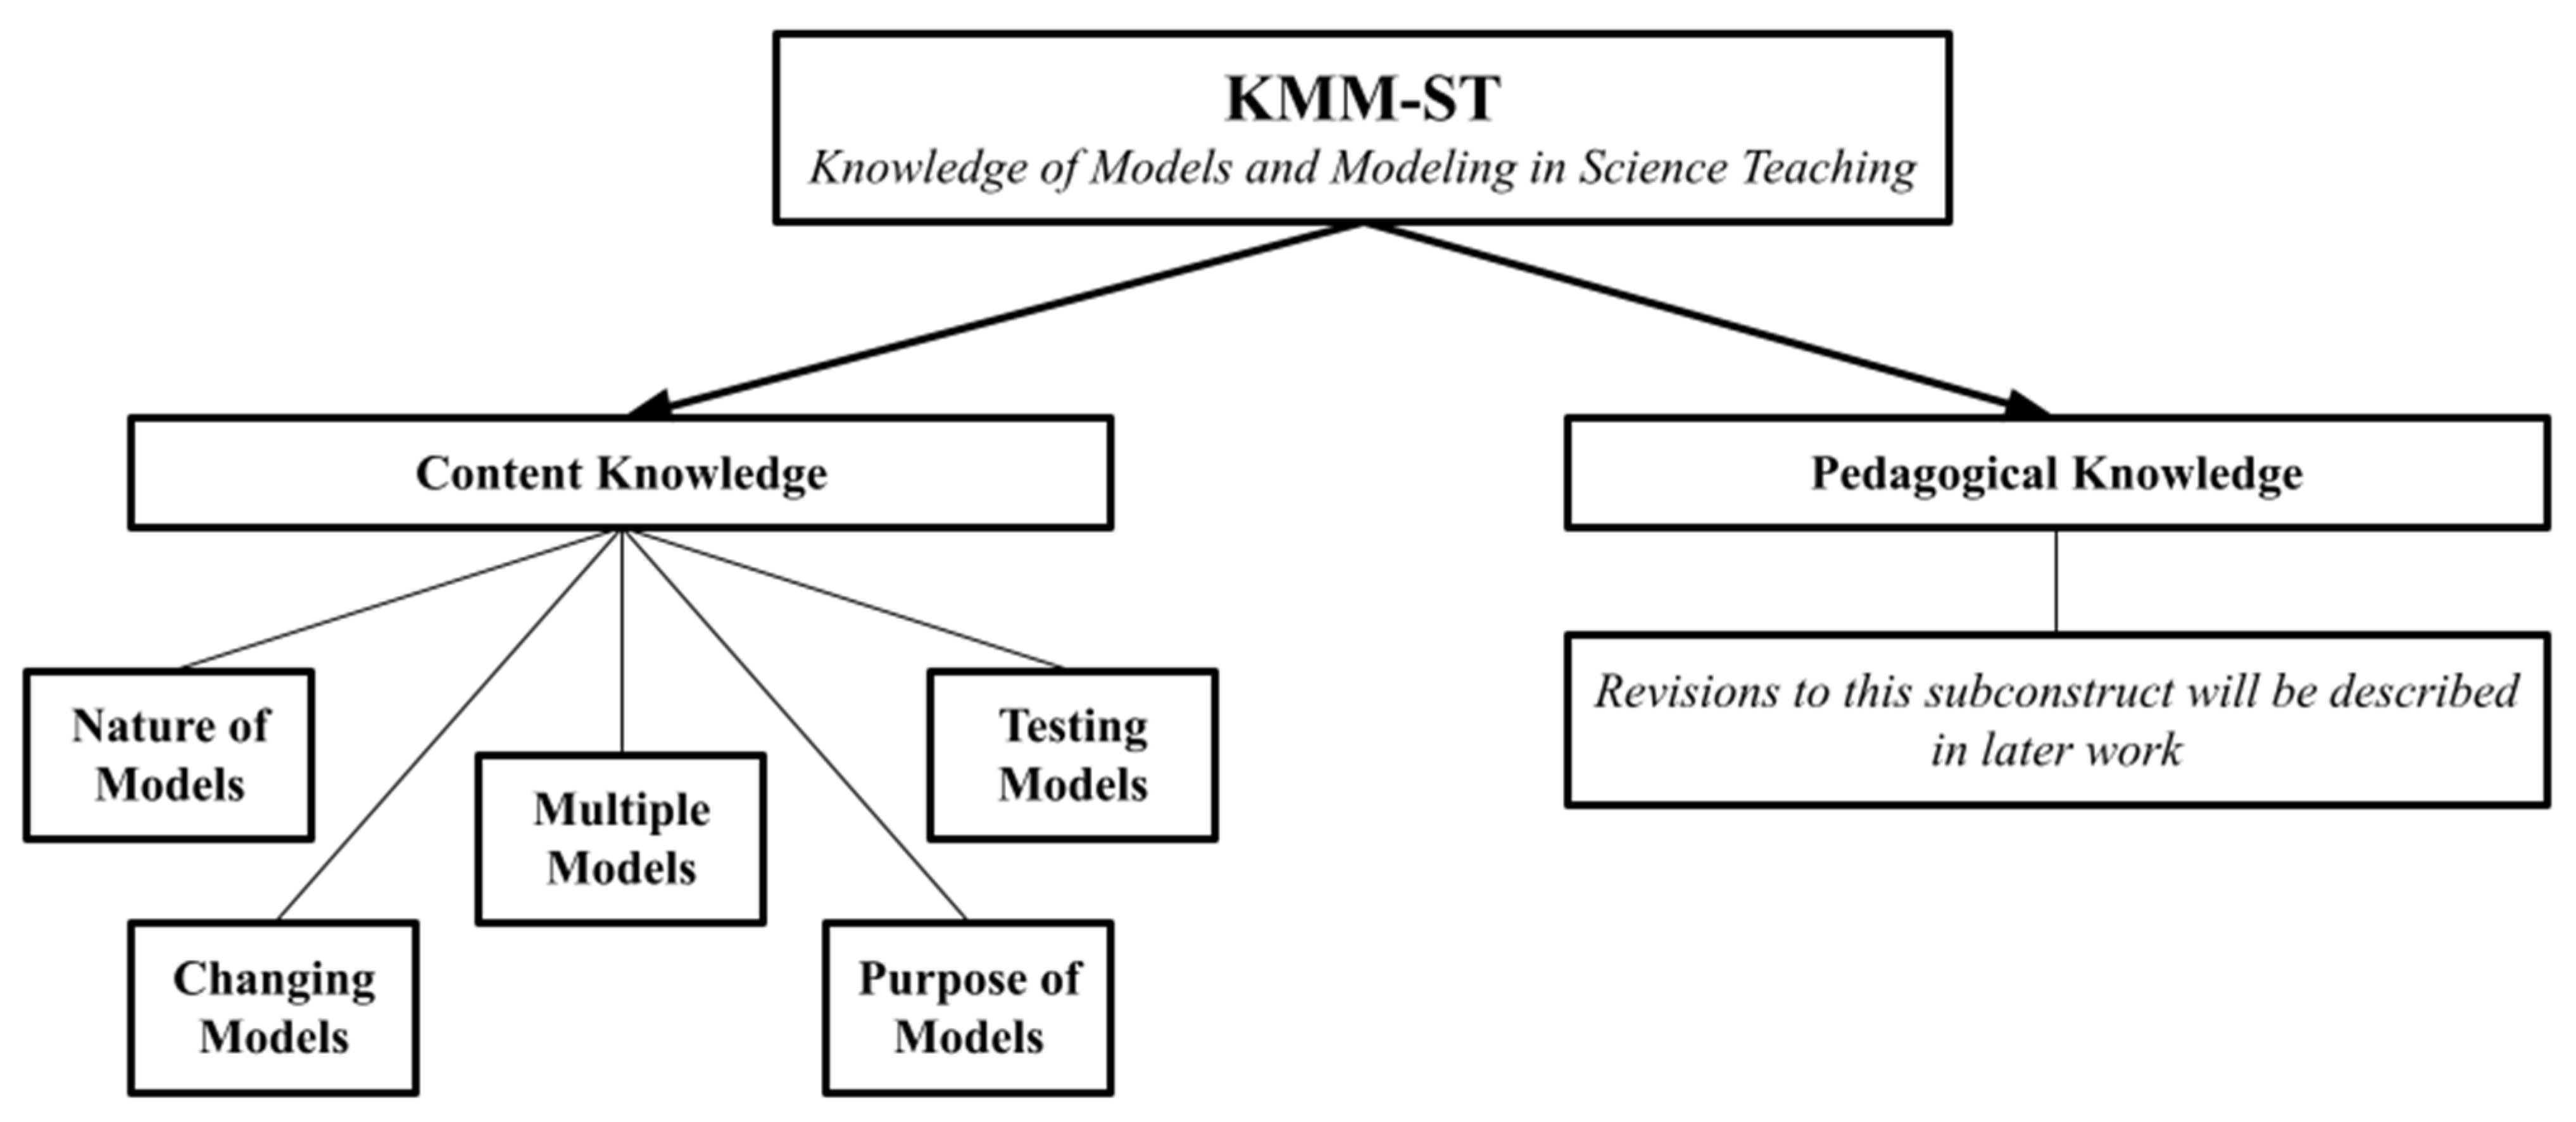
Driven by the results from the validation of the first survey, we decided to reconfigure how we were conceptualizing CK within the KMM-ST framework. Given the evidence supporting the FMC model as a legitimate model for assessing student knowledge [36,43,44] and the fact that this model was also developed from empirical studies of pre-service and in-service teacher knowledge [34], we have adopted this model into the KMM-ST framework. The 2nd version of the survey was constructed using this revised KMM-ST framework (Figure 4). We chose to include an additional level to the FMC, which we called Level 0, which was prompted by Grünkorn et al.’s identification of an “initial level” [39] (p. 1651). This level indicates no knowledge of the component whatsoever.
3. Methods
The KMM-S survey has been through two major rounds of the iterative process of item development and content validation, administration, construct validation, and revision. Detailed descriptions of the stepwise process are as follows.
3.1. The 1st Version of the KMM-ST Survey
3.1.1. 1st Version Item Development and Content Validation
Using the initial KMM-ST framework shown in Figure 3 as a guide, initial CK items were written to reflect the two components, modeling practices and metamodeling knowledge, as well as PK items. All the items were written as 4-point Likert scale items. An example CK item is shown in Figure 5. To avoid unintentionally weighting one portion of the scale more than the other, CK and PK had equal item counts (14 items in CK, 14 items in PK). Specifically, for CK items, modeling practices had five items and metamodeling knowledge had nine items.
The initial 28-item KMM-ST survey was sent to subject matter experts (SMEs) to collect content-related validity evidence. Two SMEs were scientists: one was a climate scientist that did climate modeling, and the other was an environmental engineer that did hydraulic modeling. Two other SMEs were science educators with a research focus in NGSS Science and Engineering Practices. SMEs were provided a framework for the construct, which defined our operationalization of the CK and PK subconstructs and the components within them. They were also provided a content validation worksheet (see Supplementary File S1), and they were asked to provide a score of relevancy for each item as well as written feedback (optional) on the items. Based on the analysis of the evaluation and feedback from SMEs, 28 items were reduced to 24. Justifications for the removal of 4 items are provided in Section 4.
3.1.2. Administration
The 24-item survey was imported into Qualtrics, an online survey platform. The survey was distributed to secondary science teachers (grades 6–12, ages 12–18) across the US using mailing lists and social media sites for science teachers. Participants were not provided with compensation for their completion of the survey. After being active for one month, we stopped survey collection, and a total of 105 complete surveys were collected.
3.1.3. Construct Validation and Revision
Using StataIC 16 [45] and RStudio (2021.09.0, Build 351) [46], exploratory factor analysis (EFA) was conducted to determine the factor structure of the survey items after determining that the sample was suitable for EFA using the Kaiser–Meyer–Olkin (KMO) Measure of Sampling Adequacy and Bartlett’s Test of Sphericity [47]. Principle Axis Factoring was used to explore the data, as this method, as opposed to Principal Component Analysis, is more aligned with social science research [48]. There are two broad types of rotations that can be utilized during factor analysis: orthogonal and oblique. Orthogonal rotation assumes there is no correlation between factors, while oblique rotation assumes correlated factors [47]. Given the theoretical background of the KMM-ST construct, we assumed factors would be correlated and adopted an oblique rotation method, Oblimin rotation. Factor structure was assessed using model fit statistics (RMSEA, TLI, and BIC), and three methods were utilized for determining factor retention: Kaiser’s criterion [49], Horn’s parallel analysis [50], and the empirical Kaiser criterion [51]. These methods are described in greater detail as they are presented in the results.
3.2. The 2nd Version of the KMM-ST Survey
3.2.1. 2nd Version Item Development and Content Validation
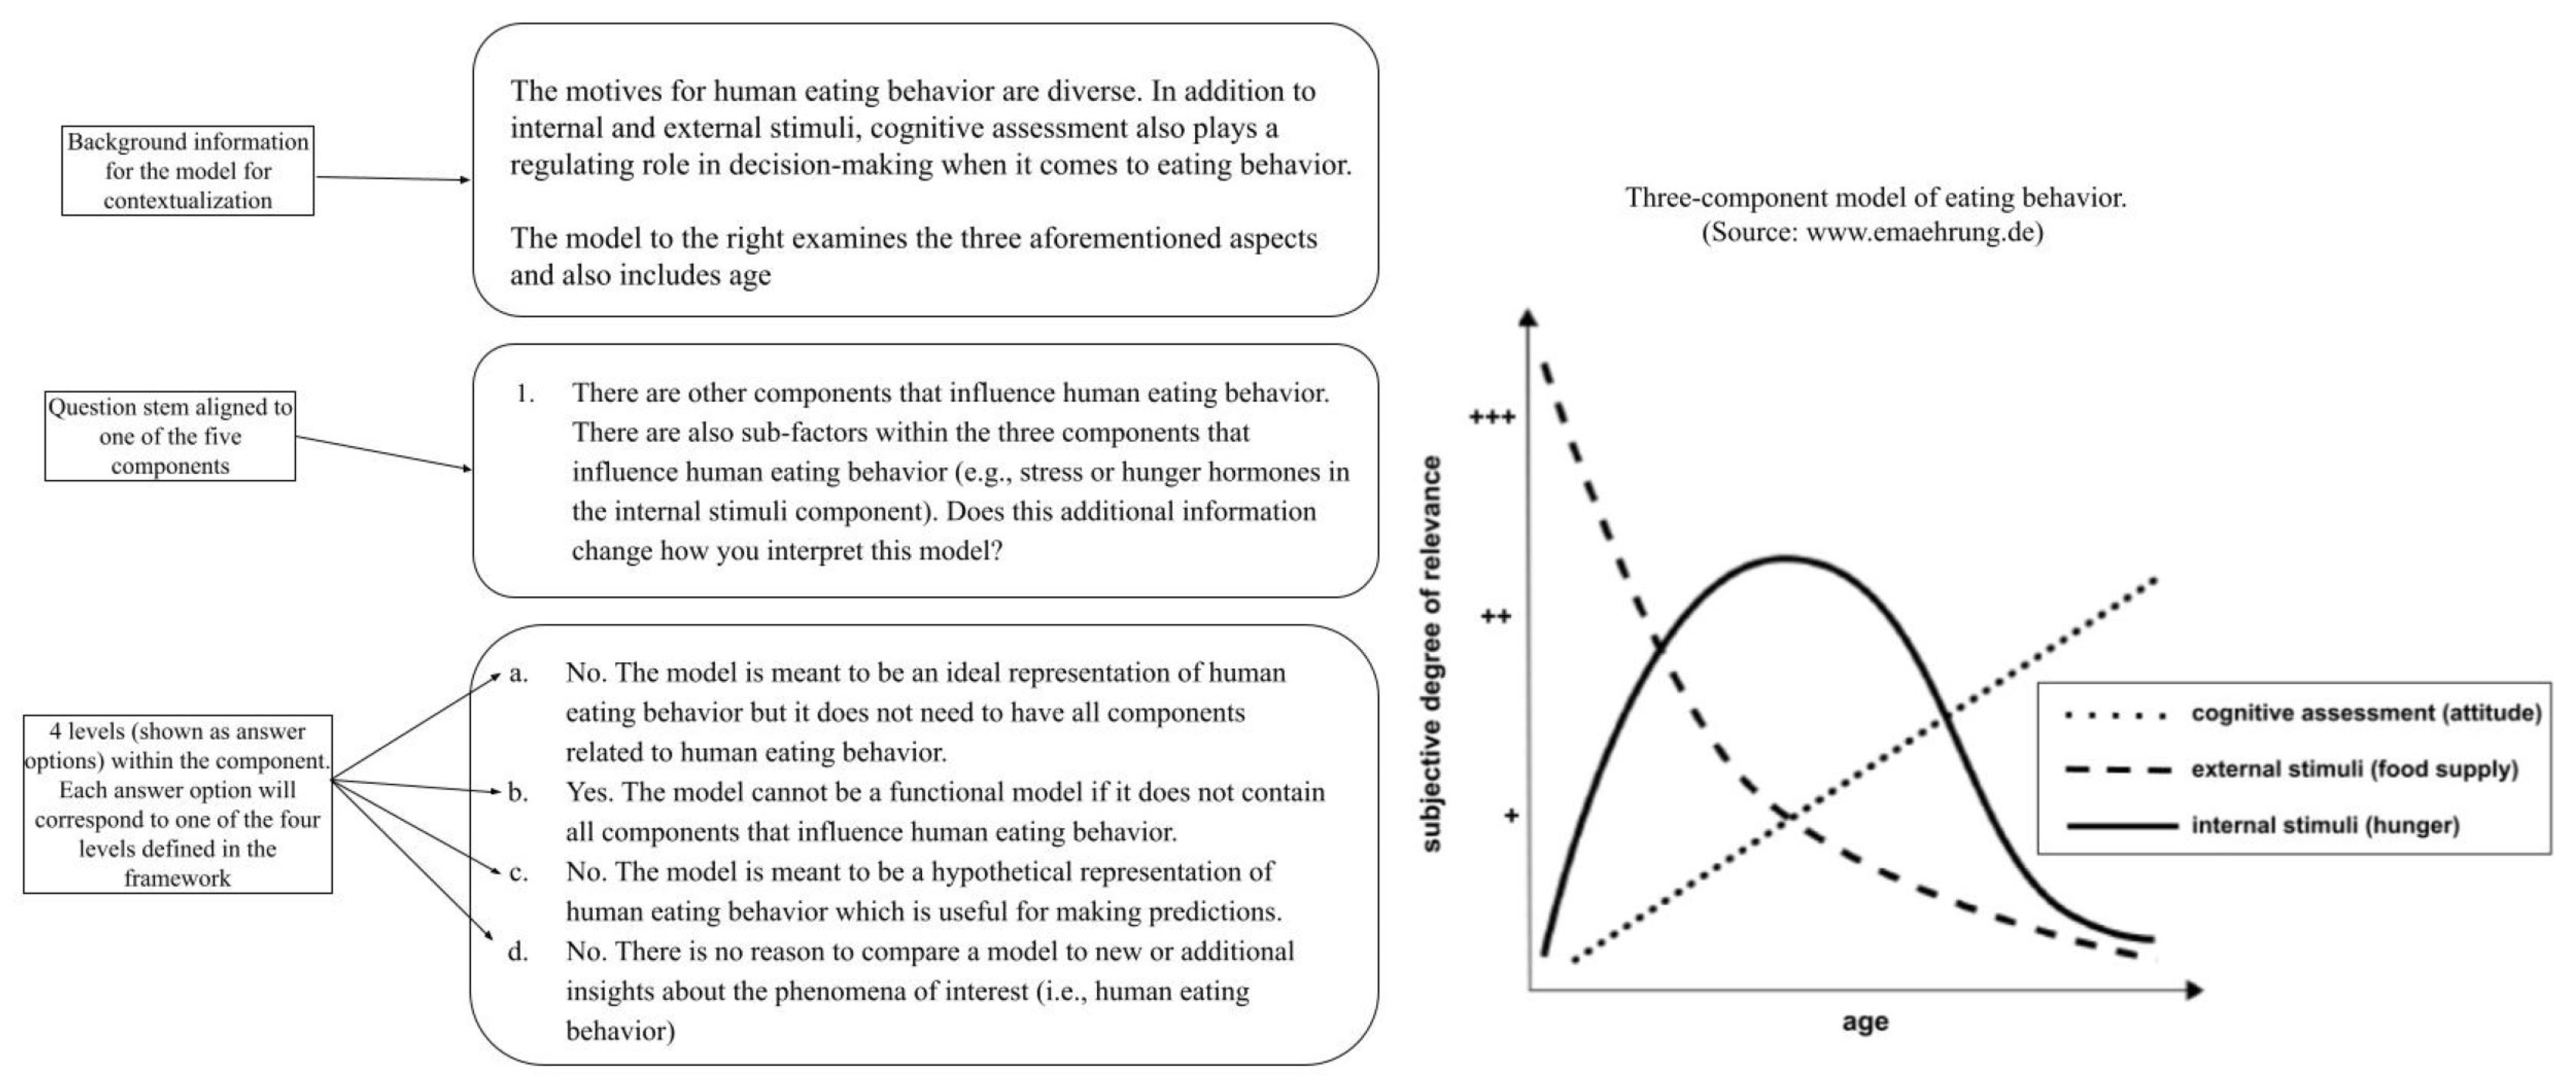
Using the revised KMM-ST framework shown in Figure 4, focusing only on the CK portion of the framework, CK items were written to reflect the five components of the CK subconstruct as well as the levels defined in the FMC. All items were written as multiple-choice items. Item specifications included: (1) background information which would contextualize the model for the participant, (2) a question stem that was aligned with one of the five components in the FMC, and (3) answer options which corresponded to each level in the FMC for that modeling component. Background information for each question was constructed through the modification of eight models provided in a pre-existing German multiple-choice instrument to assess pre-service science teachers’ scientific reasoning competences [52], translated into English [53,54]. Modifications were made to the eight models to improve their clarity (i.e., recreate figures and graphs) and to add additional background information necessary for contextualizing the model. An example item showing the three parts (background, question stem, and answer options) is shown in Figure 6. Each of the five components in the FMC was assessed with five items each for a total of 25 items in the 2nd version of the survey.
The 25-item survey was sent to SMEs to collect content-related validity evidence. While these SMEs were not exactly the same as the SMEs from the first survey, their roles were similar. Two SMEs were in science and engineering fields; one was an ecologist and the other an environmental engineer. The other two SMEs were science educators with a PhD in STEM education and a focus on curriculum and instruction. The same method used in the 1st version of the survey for collecting content validity was used here. In addition, for each answer option, SMEs were asked to provide the level (in the FMC) to which they believed the answer option was assigned. The content validation worksheet can be found in Supplementary File S2. Based on the analysis of the evaluation and feedback from SMEs, no items were dropped from the survey, but some question stems and answer options were revised. Justification for these revisions is provided in Section 4.
3.2.2. Administration
The 25-item survey, along with background questions including years of teaching experience, science teaching disciplines, school context, and additional certifications or teaching credentials, was imported into Qualtrics, an online survey platform. The survey was distributed to secondary science teachers (grades 6–12, ages 12–18) across the southeast US using email addresses collected from public records requests. Participants were provided a USD 20 Amazon e-gift card for their completion of the survey. After being active for one month, we stopped survey collection, and a total of 144 complete surveys were collected.
3.2.3. Construct Validation and Revision
Using StataIC 16 [45] and RStudio (2021.09.0, Build 351) [46], exploratory factor analysis (EFA) was conducted to determine the factor structure of the survey items after determining that the sample was suitable for EFA using the Kaiser–Meyer–Olkin (KMO) Measure of Sampling Adequacy and Bartlett’s Test of Sphericity [47]. We followed the same process for EFA as was conducted for the validation of the first survey.
4. Results
4.1. Validation and Revision of the 1st Version of the KMM-ST Survey
4.1.1. Content Validation through SME Consultation
In reviewing the results from SMEs Content Validation Worksheets, we found two items from the CK subconstruct and two items from the PK subconstruct that experts had identified as not being related to the framework. These four items were items that all four SMEs agreed needed to be removed. In addition, for items that only a portion of SMEs found issues with, we opted to revise these items rather than remove them entirely from the scale. This resulted in 10 items from CK and four items from PK that were revised. For the final survey, the CK subconstruct, composed of modeling practice items and metamodeling knowledge items, had five and seven items, respectively. The PK subconstruct, composed of investigating, sensemaking, and evaluating and communicating items, had five, three, and four items, respectively. In total, the finalized survey that was administered contained a total of 24-Likert scale items.
4.1.2. Analysis of Responses to the 1st Version of the KMM-ST Survey
Descriptive Statistics
The initial survey asked respondents to answer on a four-point response scale (1 = inaccurate, 2 = somewhat inaccurate, 3 = somewhat accurate, and 4 = accurate). All items in the survey were written to either be answered with inaccurate (1) or accurate (4). No items were written to be correctly answered with 2 s or 3 s. As such, to compile the descriptive statistics for the survey, we recoded all the data to show whether the item was answered correctly (coded with “1”) or incorrectly (coded with “0”).
Table 2 shows the descriptive statistics of the 1st version of the survey. Respondents were able to respond correctly to the majority of items, as evidenced by the mean scores of the individual items. The average score on the 24-item survey was 20.34. Reverse-coded items appeared to be the most difficult items in the survey (MMK2R, EC1R, and EC2R). Respondents scored relatively similarly on CK and PK items (average scores of 10.21 and 10.13, respectively).
Results from Exploratory Factor Analysis
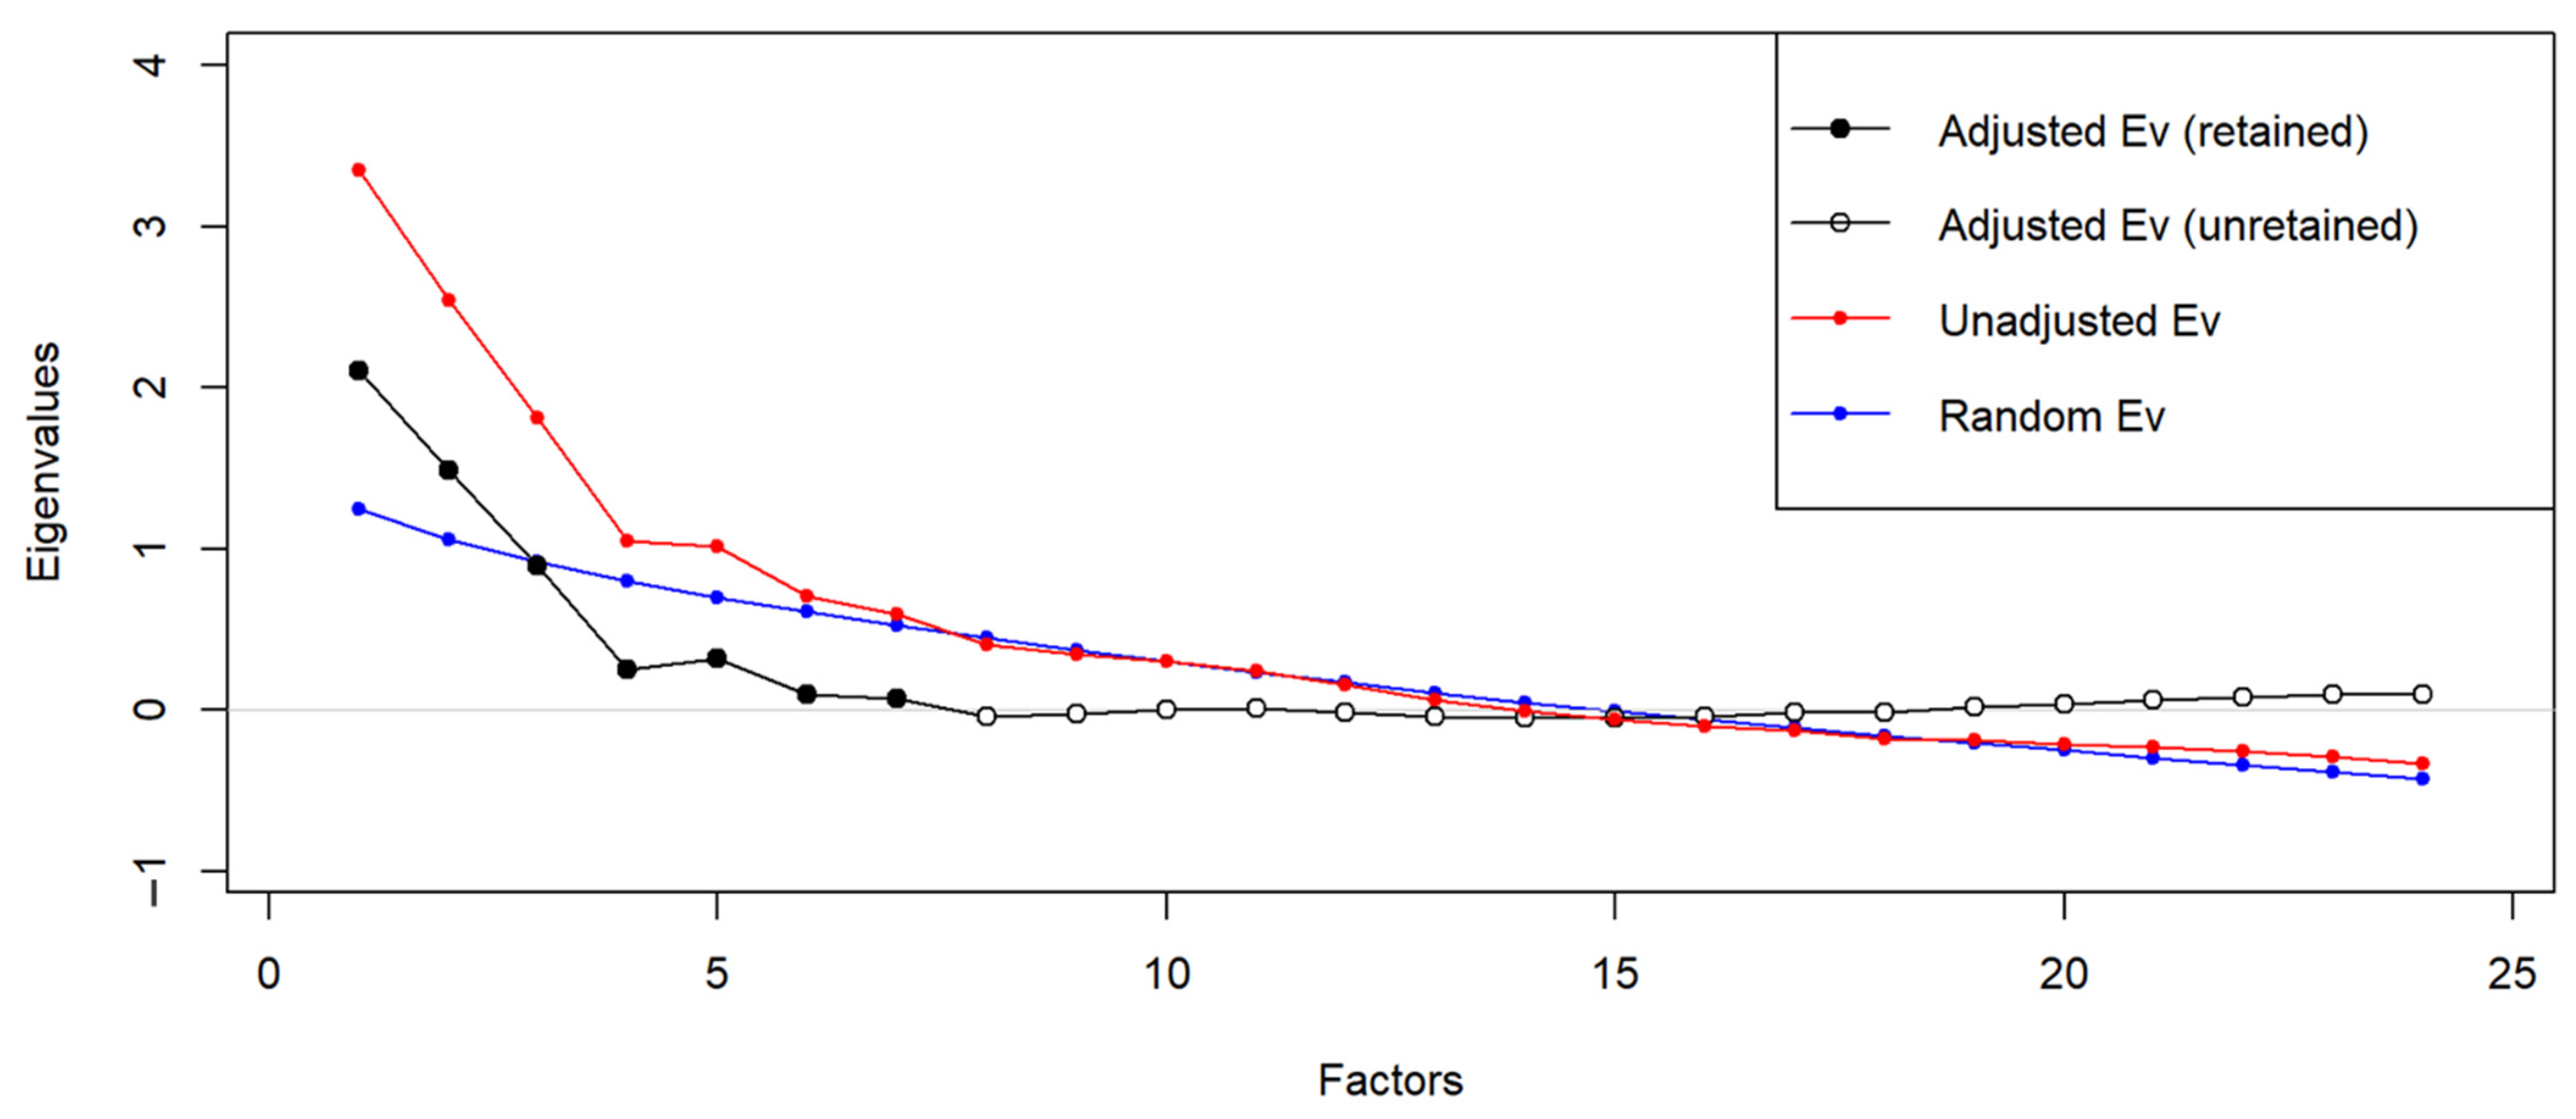
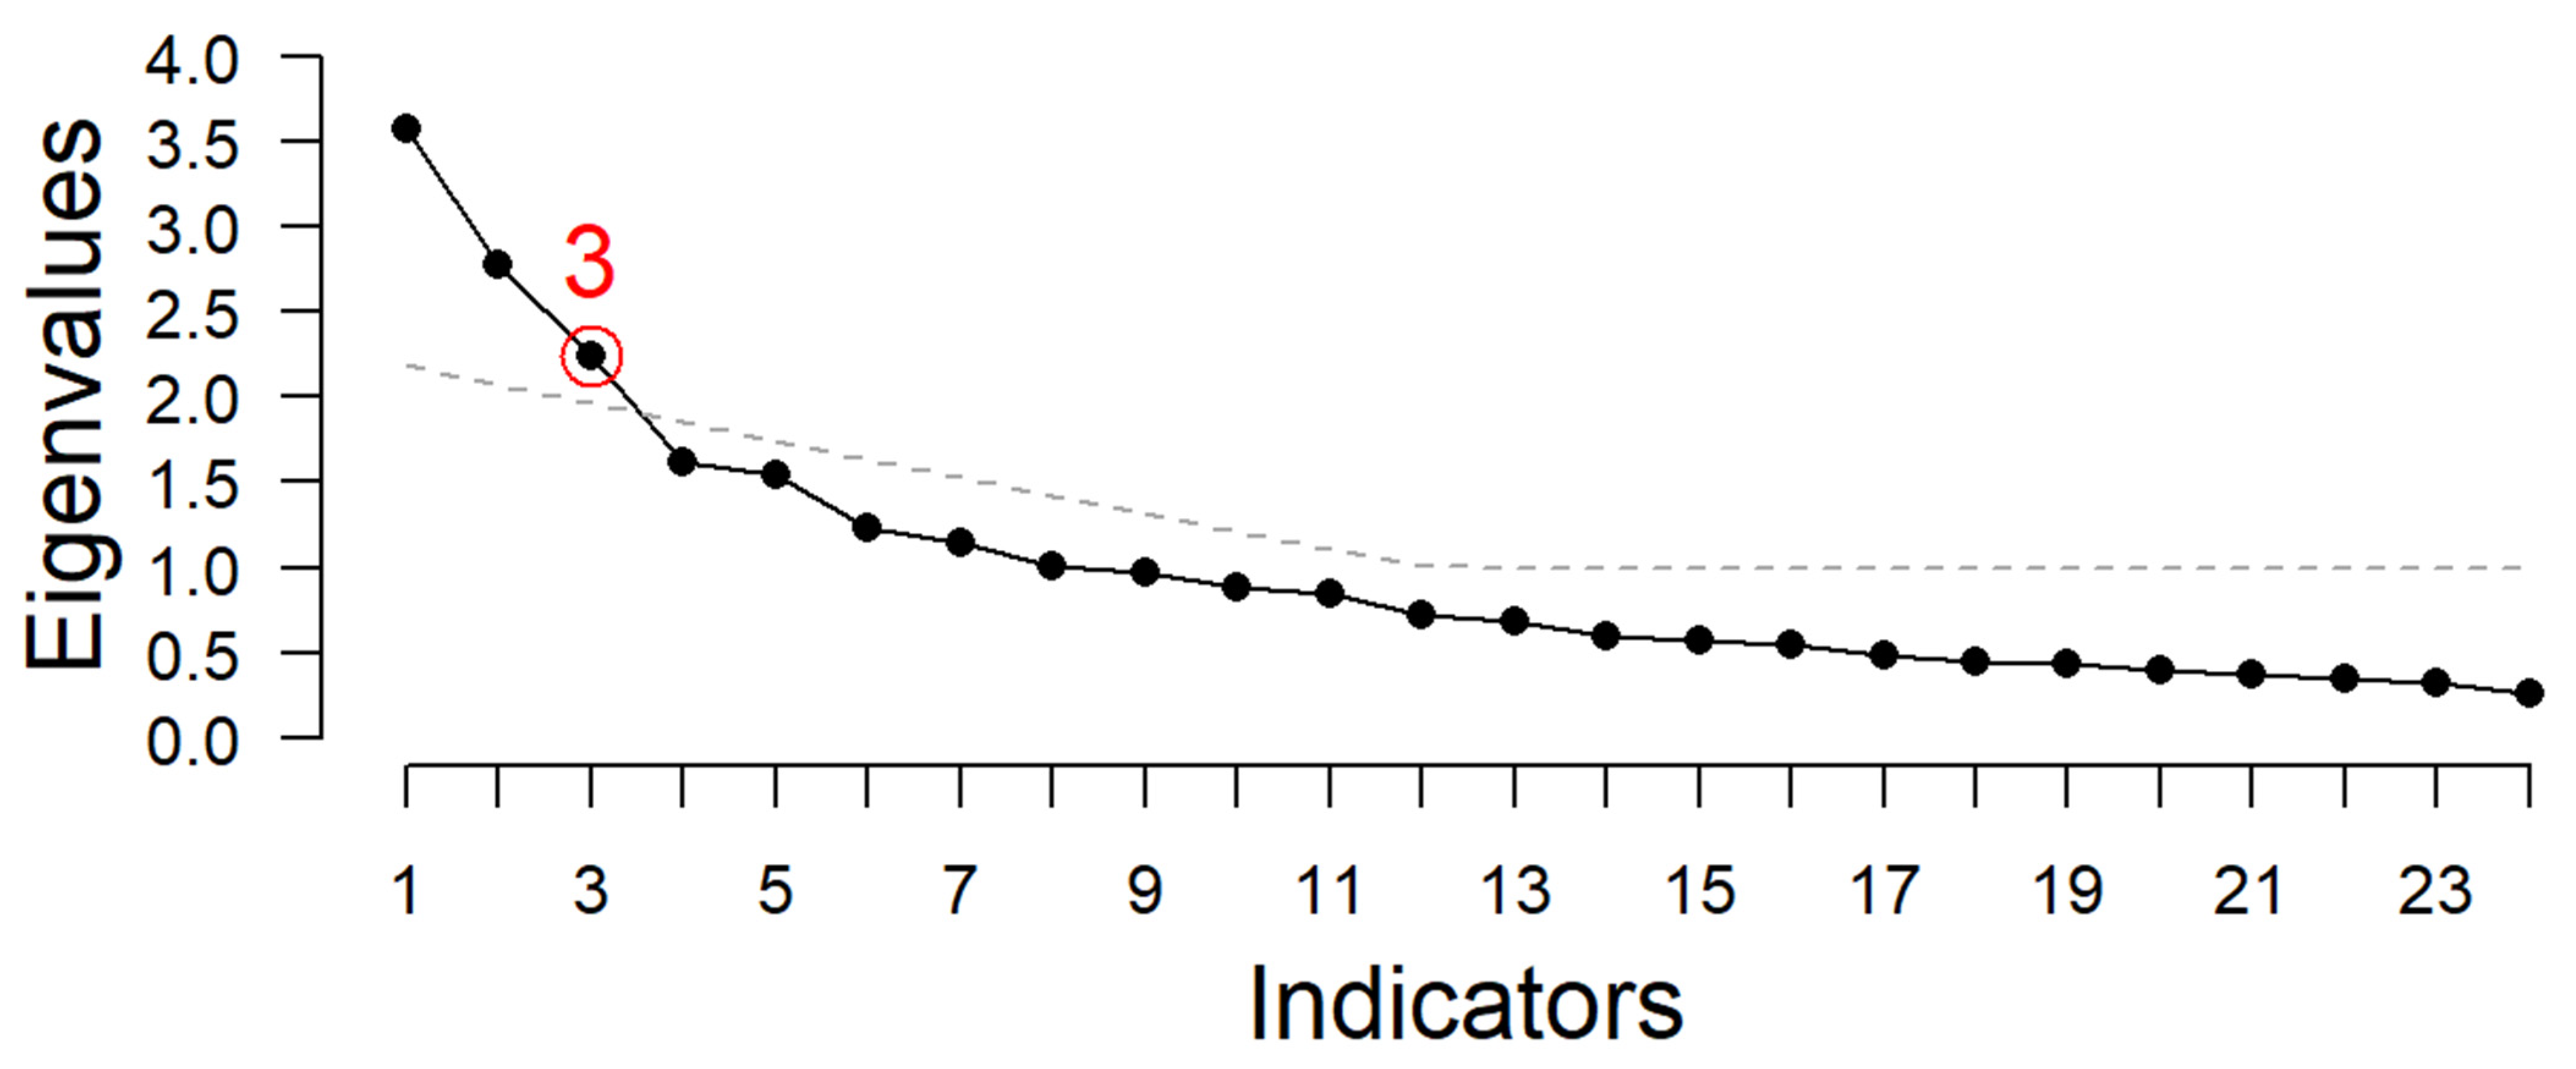
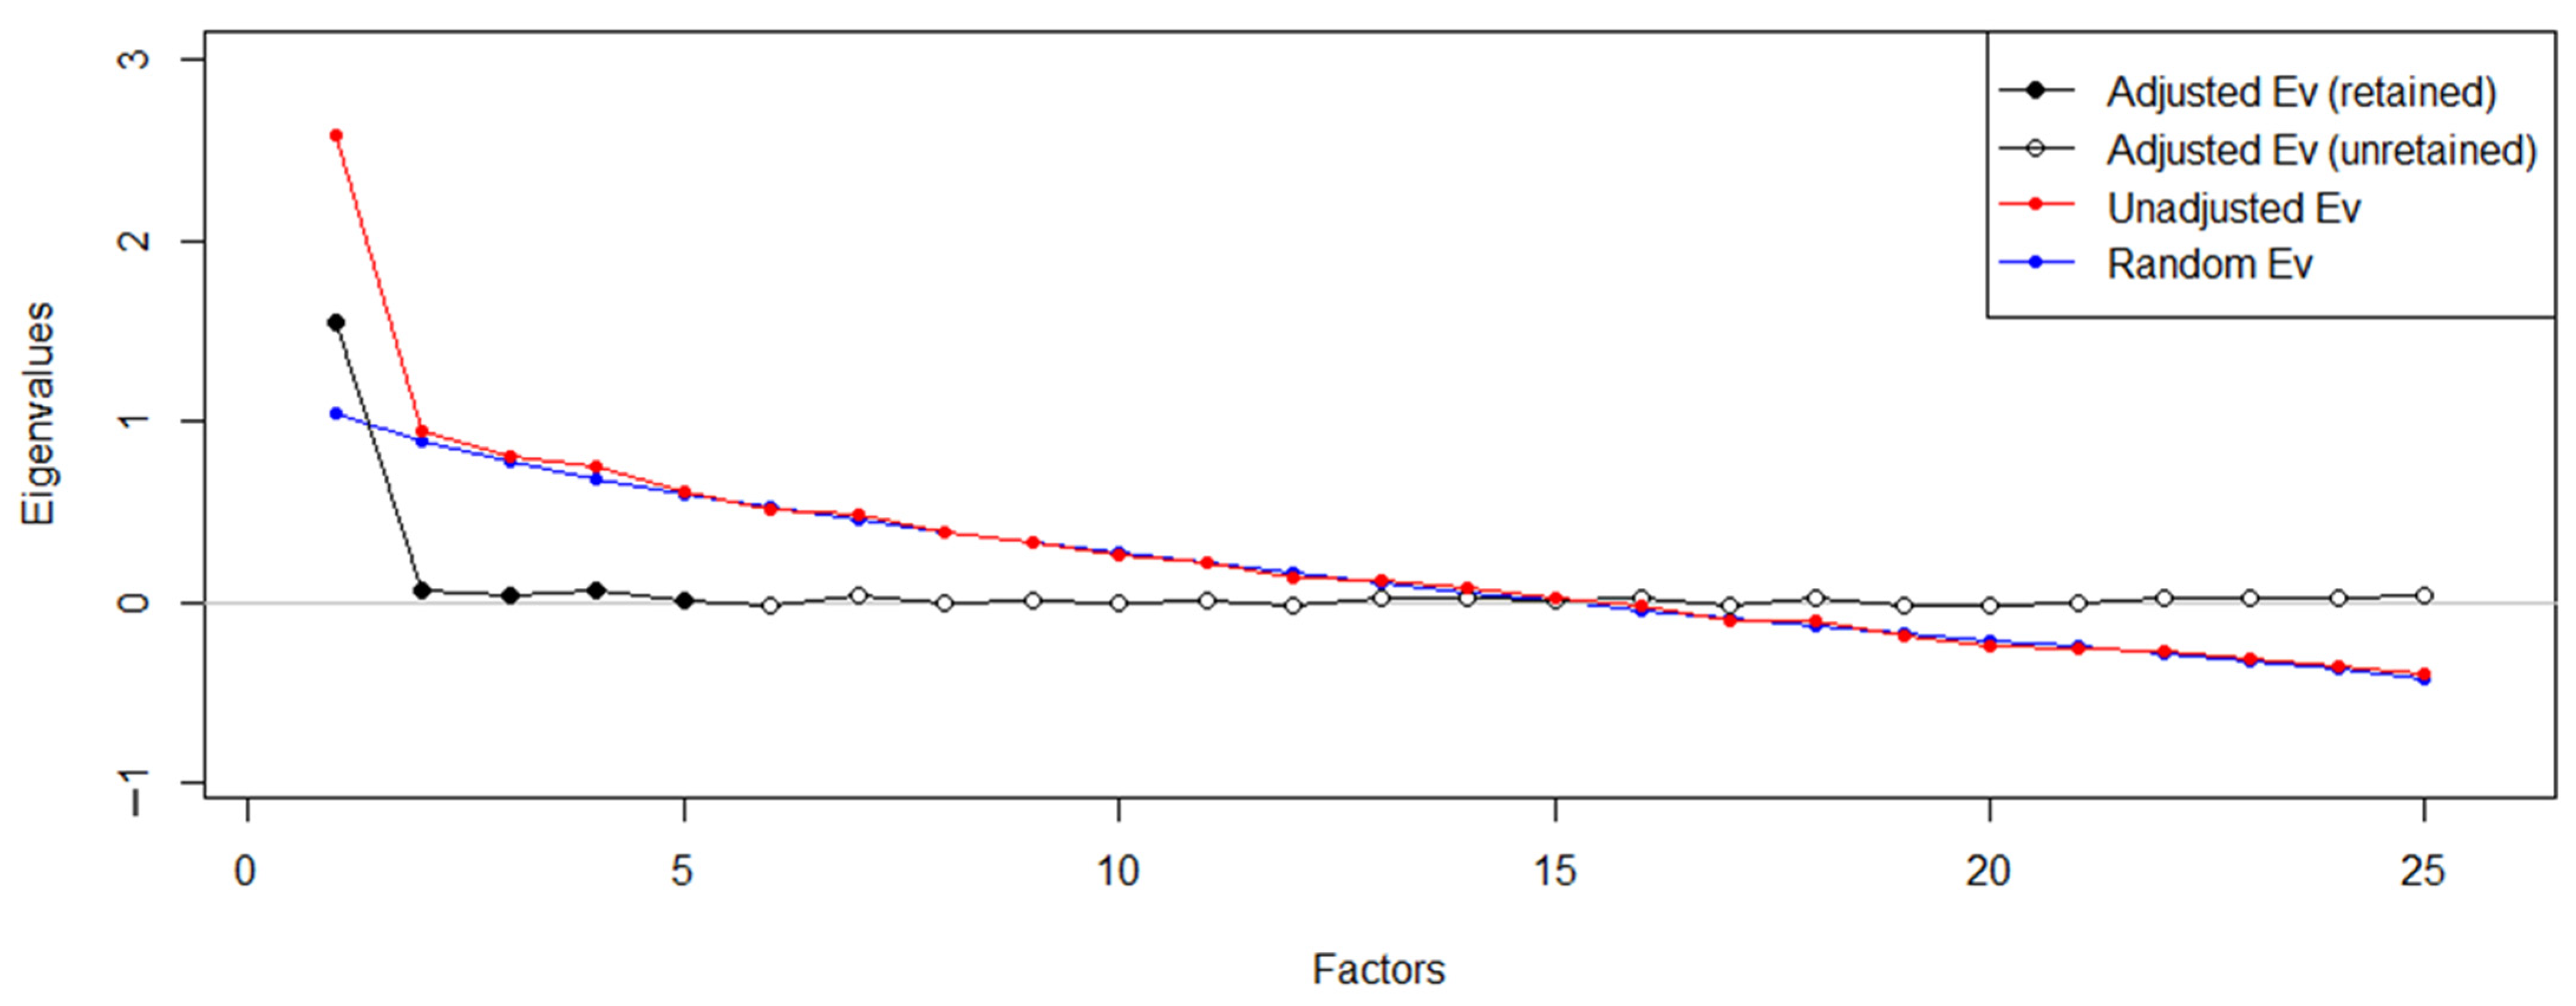
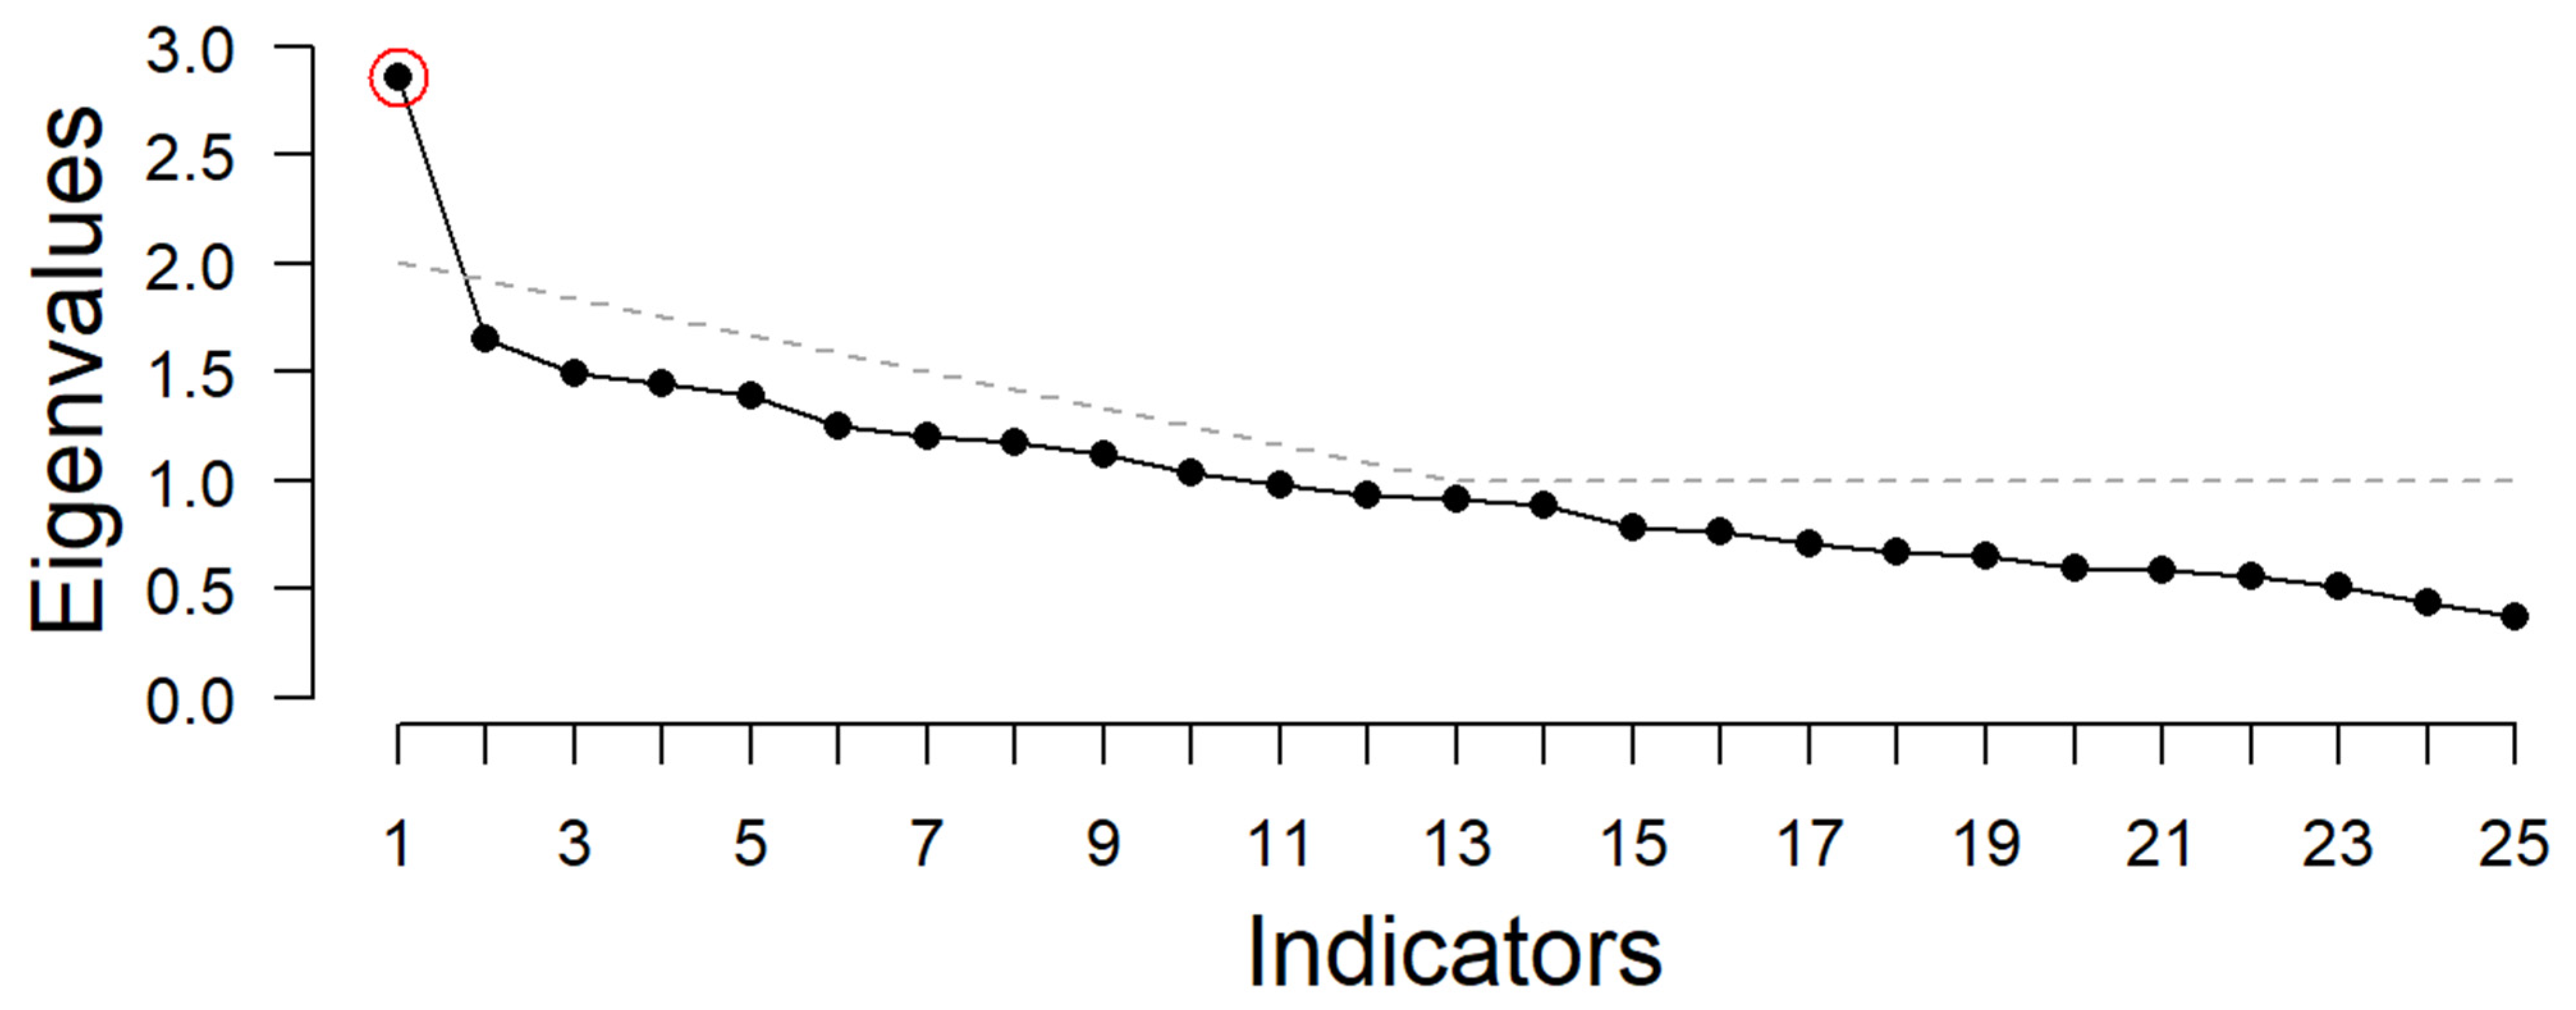
We conducted a test to determine the suitability of the data for exploratory factor analysis (EFA). The Kaiser–Meyer–Olkin (KMO) Measure of Sampling Adequacy and Bartlett’s Test of Sphericity can be used for this purpose [47]. Bartlett’s Test of Sphericity (𝝌2 = 753.55; d.f. = 276; p < 0.001) and the KMO Measure of Sampling Adequacy (KMO = 0.663) indicate that EFA was appropriate for our sample. Factor analysis (Principal Axis Factoring) of the dataset using Oblimin rotation revealed a four-factor model based on eigenvalues which were greater than one (i.e., Kaiser’s criterion [49]). It should be noted that there was no clear drop in eigenvalues below one, which indicated the need for alternative methods for clarifying the factors in the scale. We used Horn’s parallel analysis [50] to further examine the scale. The analysis revealed a seven-factor model would be more suitable for the data (Figure 7). Using Horn’s method for parallel analysis [50], a random set of data was generated over 720 iterations to produce eigenvalue distributions at the 95th percentile. In Figure 7, the red line shows the observed data, the black line shows the 95th percentile (adjusted data), and the blue line shows the randomly generated data. Again, there is a lack of clarity regarding the number of factors to retain, as the graph shows seven factors to be retained, yet factors from three to seven fell below the blue line. Upon seeing this result, we adopted a third method for exploring the number of factors to be retained: the empirical Kaiser criterion method [51]. This method “clearly outperforms parallel analysis for the specific case of oblique factors” [51] (p. 463). Figure 8 shows the findings from the empirical Kaiser criterion method, which indicated three factors be retained.
Taken together, the three methods used for discerning the number of factors to retain indicated that between two and seven factors would be appropriate for the data. We ran models for each factor structure using Oblimin rotation and referenced the model fit statistics to help us discern which factor structure was appropriate. Table 3 shows RMSEA, Tucker Lewis Index (TLI), and Bayesian information criterion (BIC) statistics for each model. Following the guidance of Finch [55] and Preacher et al. [56], we determined decent model fit to be RMSEA values less than 0.05 and TLI values of 0.9 or greater, and we searched for small (or negative) BIC values. As Table 3 indicates, the six- and seven-factor models fit these criteria. Thus, we moved forward with examining the factor loadings and interitem correlations in six- and seven-factor models despite these not aligning with our theoretical framework for survey development.
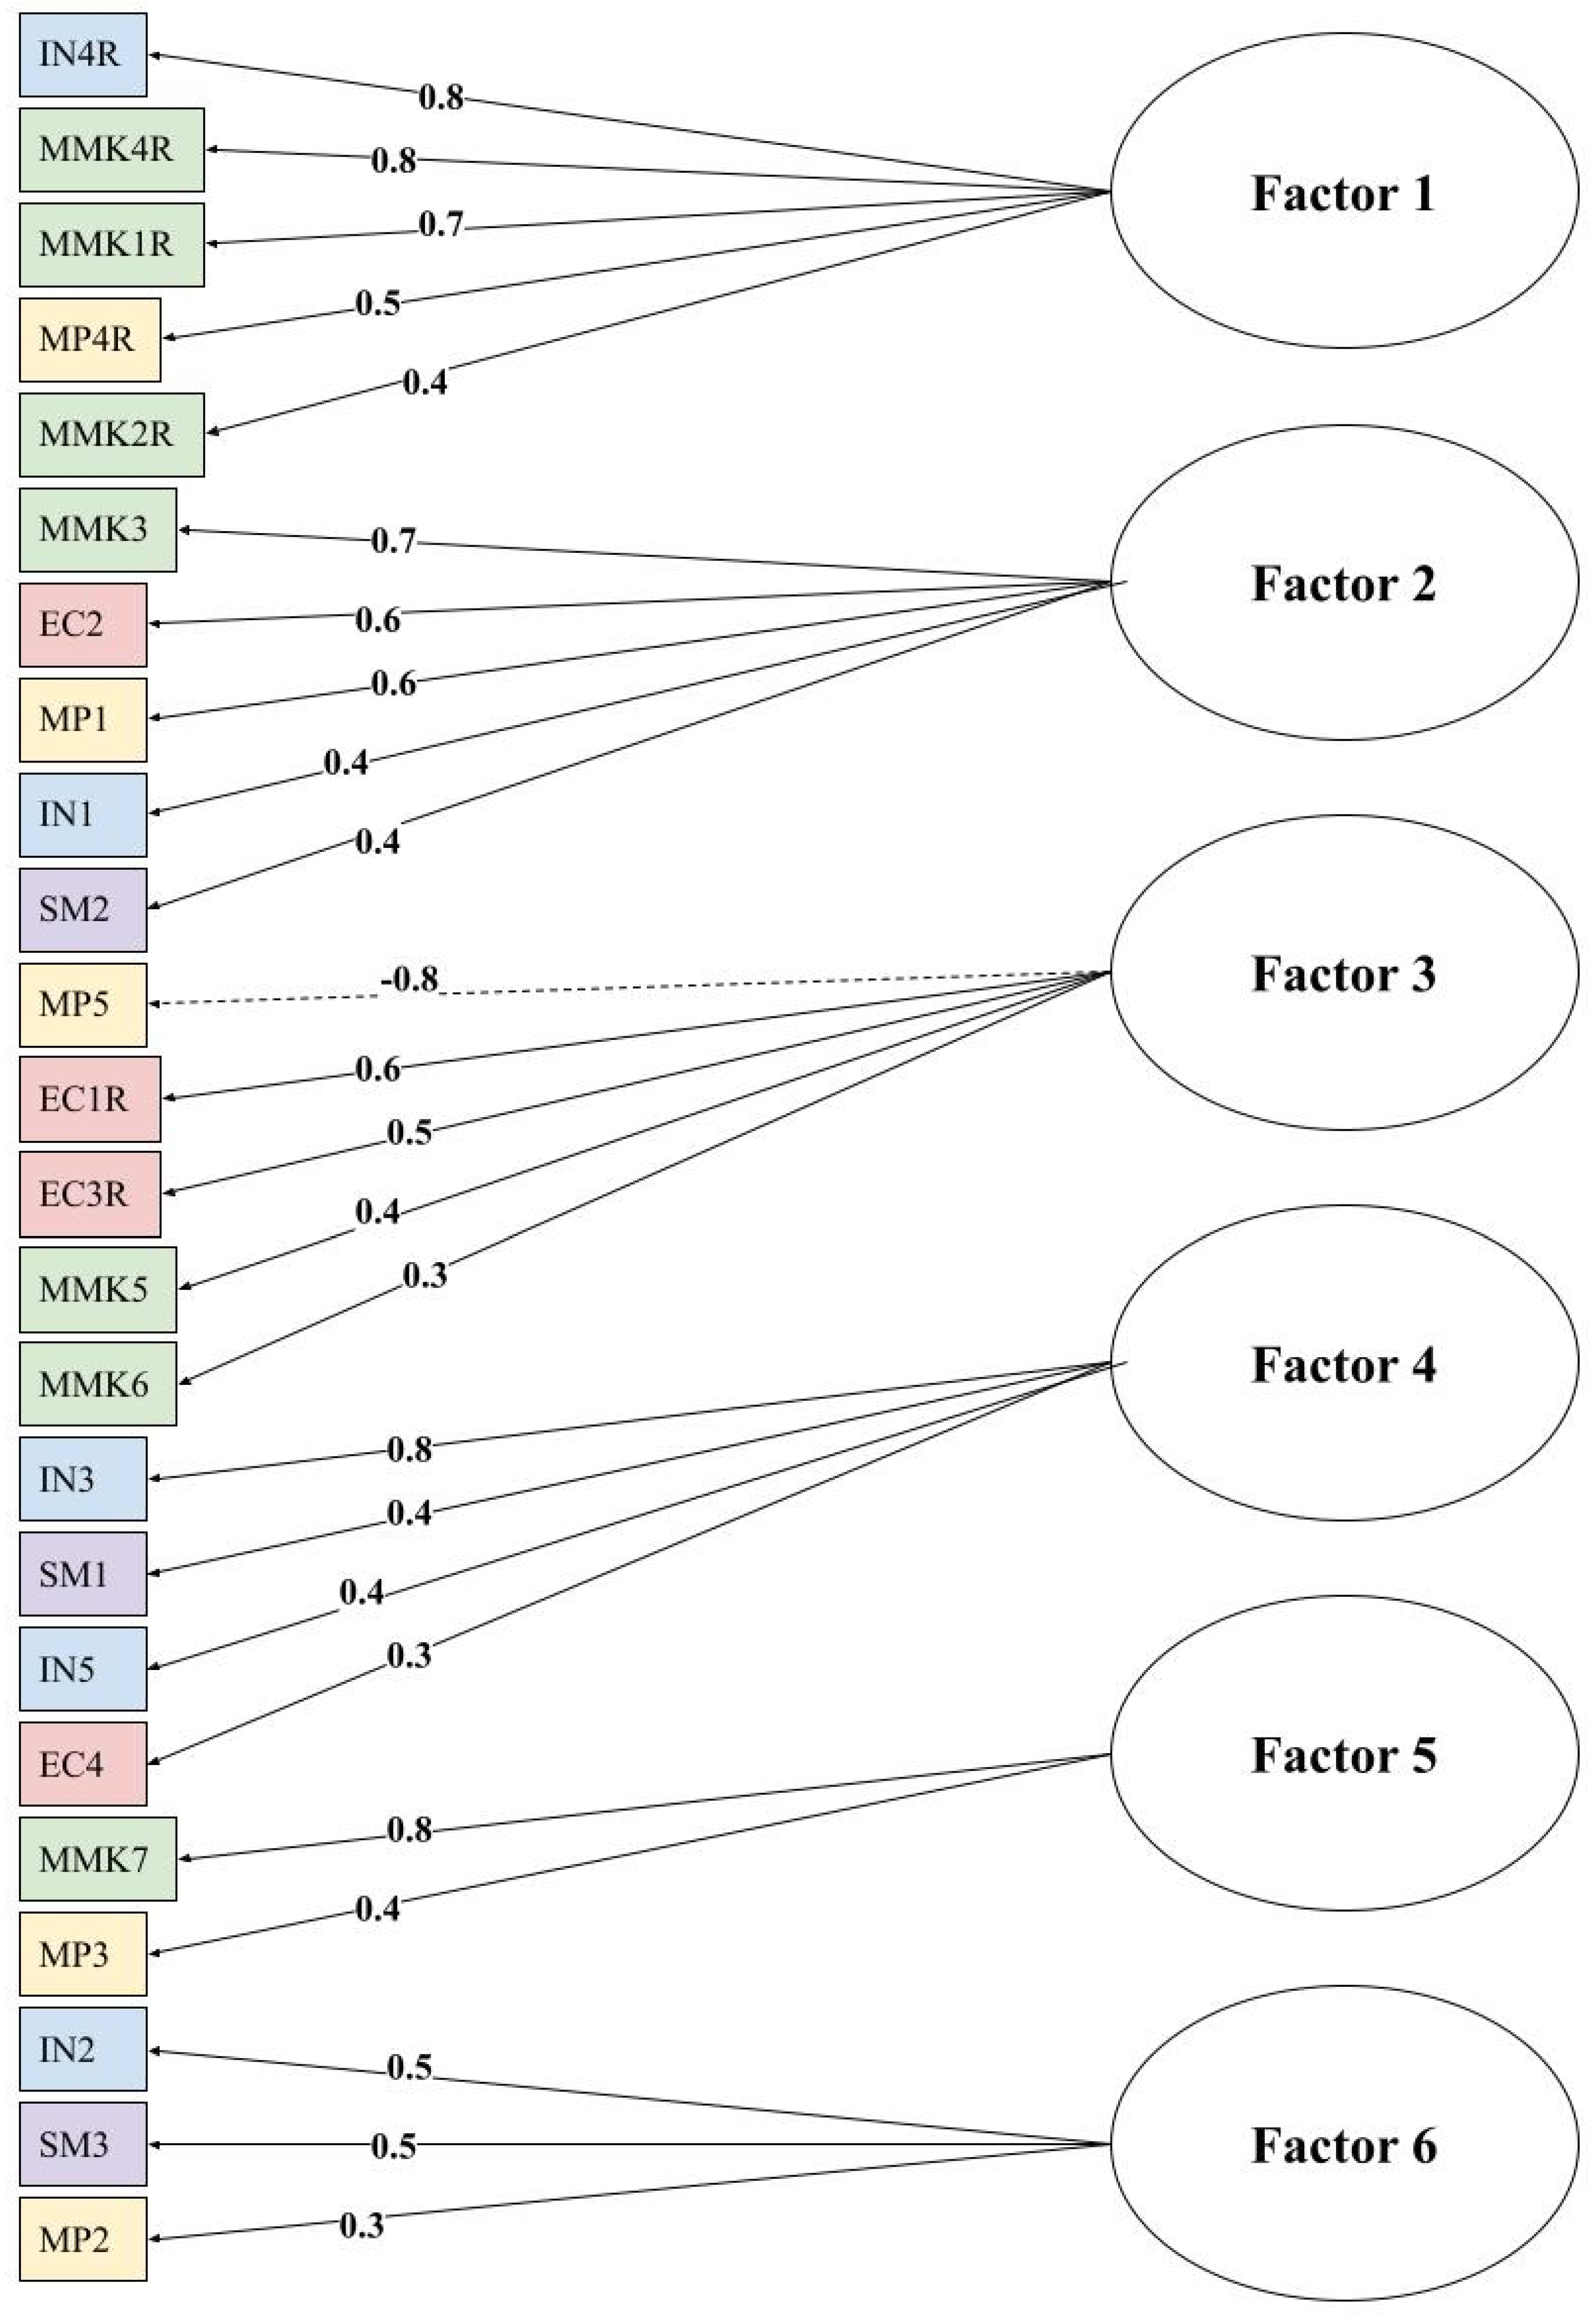
We extracted the six-factor model using Principal Axis Factoring and Oblimin rotation. The six factors explained a total variance of 44%. As Figure 9 shows, factor loadings for all 24 variables ranged from 0.3 to 0.8 with the exception of one item (MP5), which had a negative factor loading (−0.8 on Factor 3). More detailed factor loadings can be found in Supplementary File S3, and the correlation matrix for this survey can be found in Supplementary File S4. This factor structure does not coincide with the theoretical framework on which the items were developed: (1) modeling practices (CK subconstruct), (2) metamodeling knowledge (CK subconstruct), (3) investigating (PK subconstruct), (4) sensemaking (PK subconstruct), and (5) evaluating and communicating (PK subconstruct). Figure 9 is color-coded to show this. Ideally, we would expect items of the same color to fall into the same factor, and this was not the case.
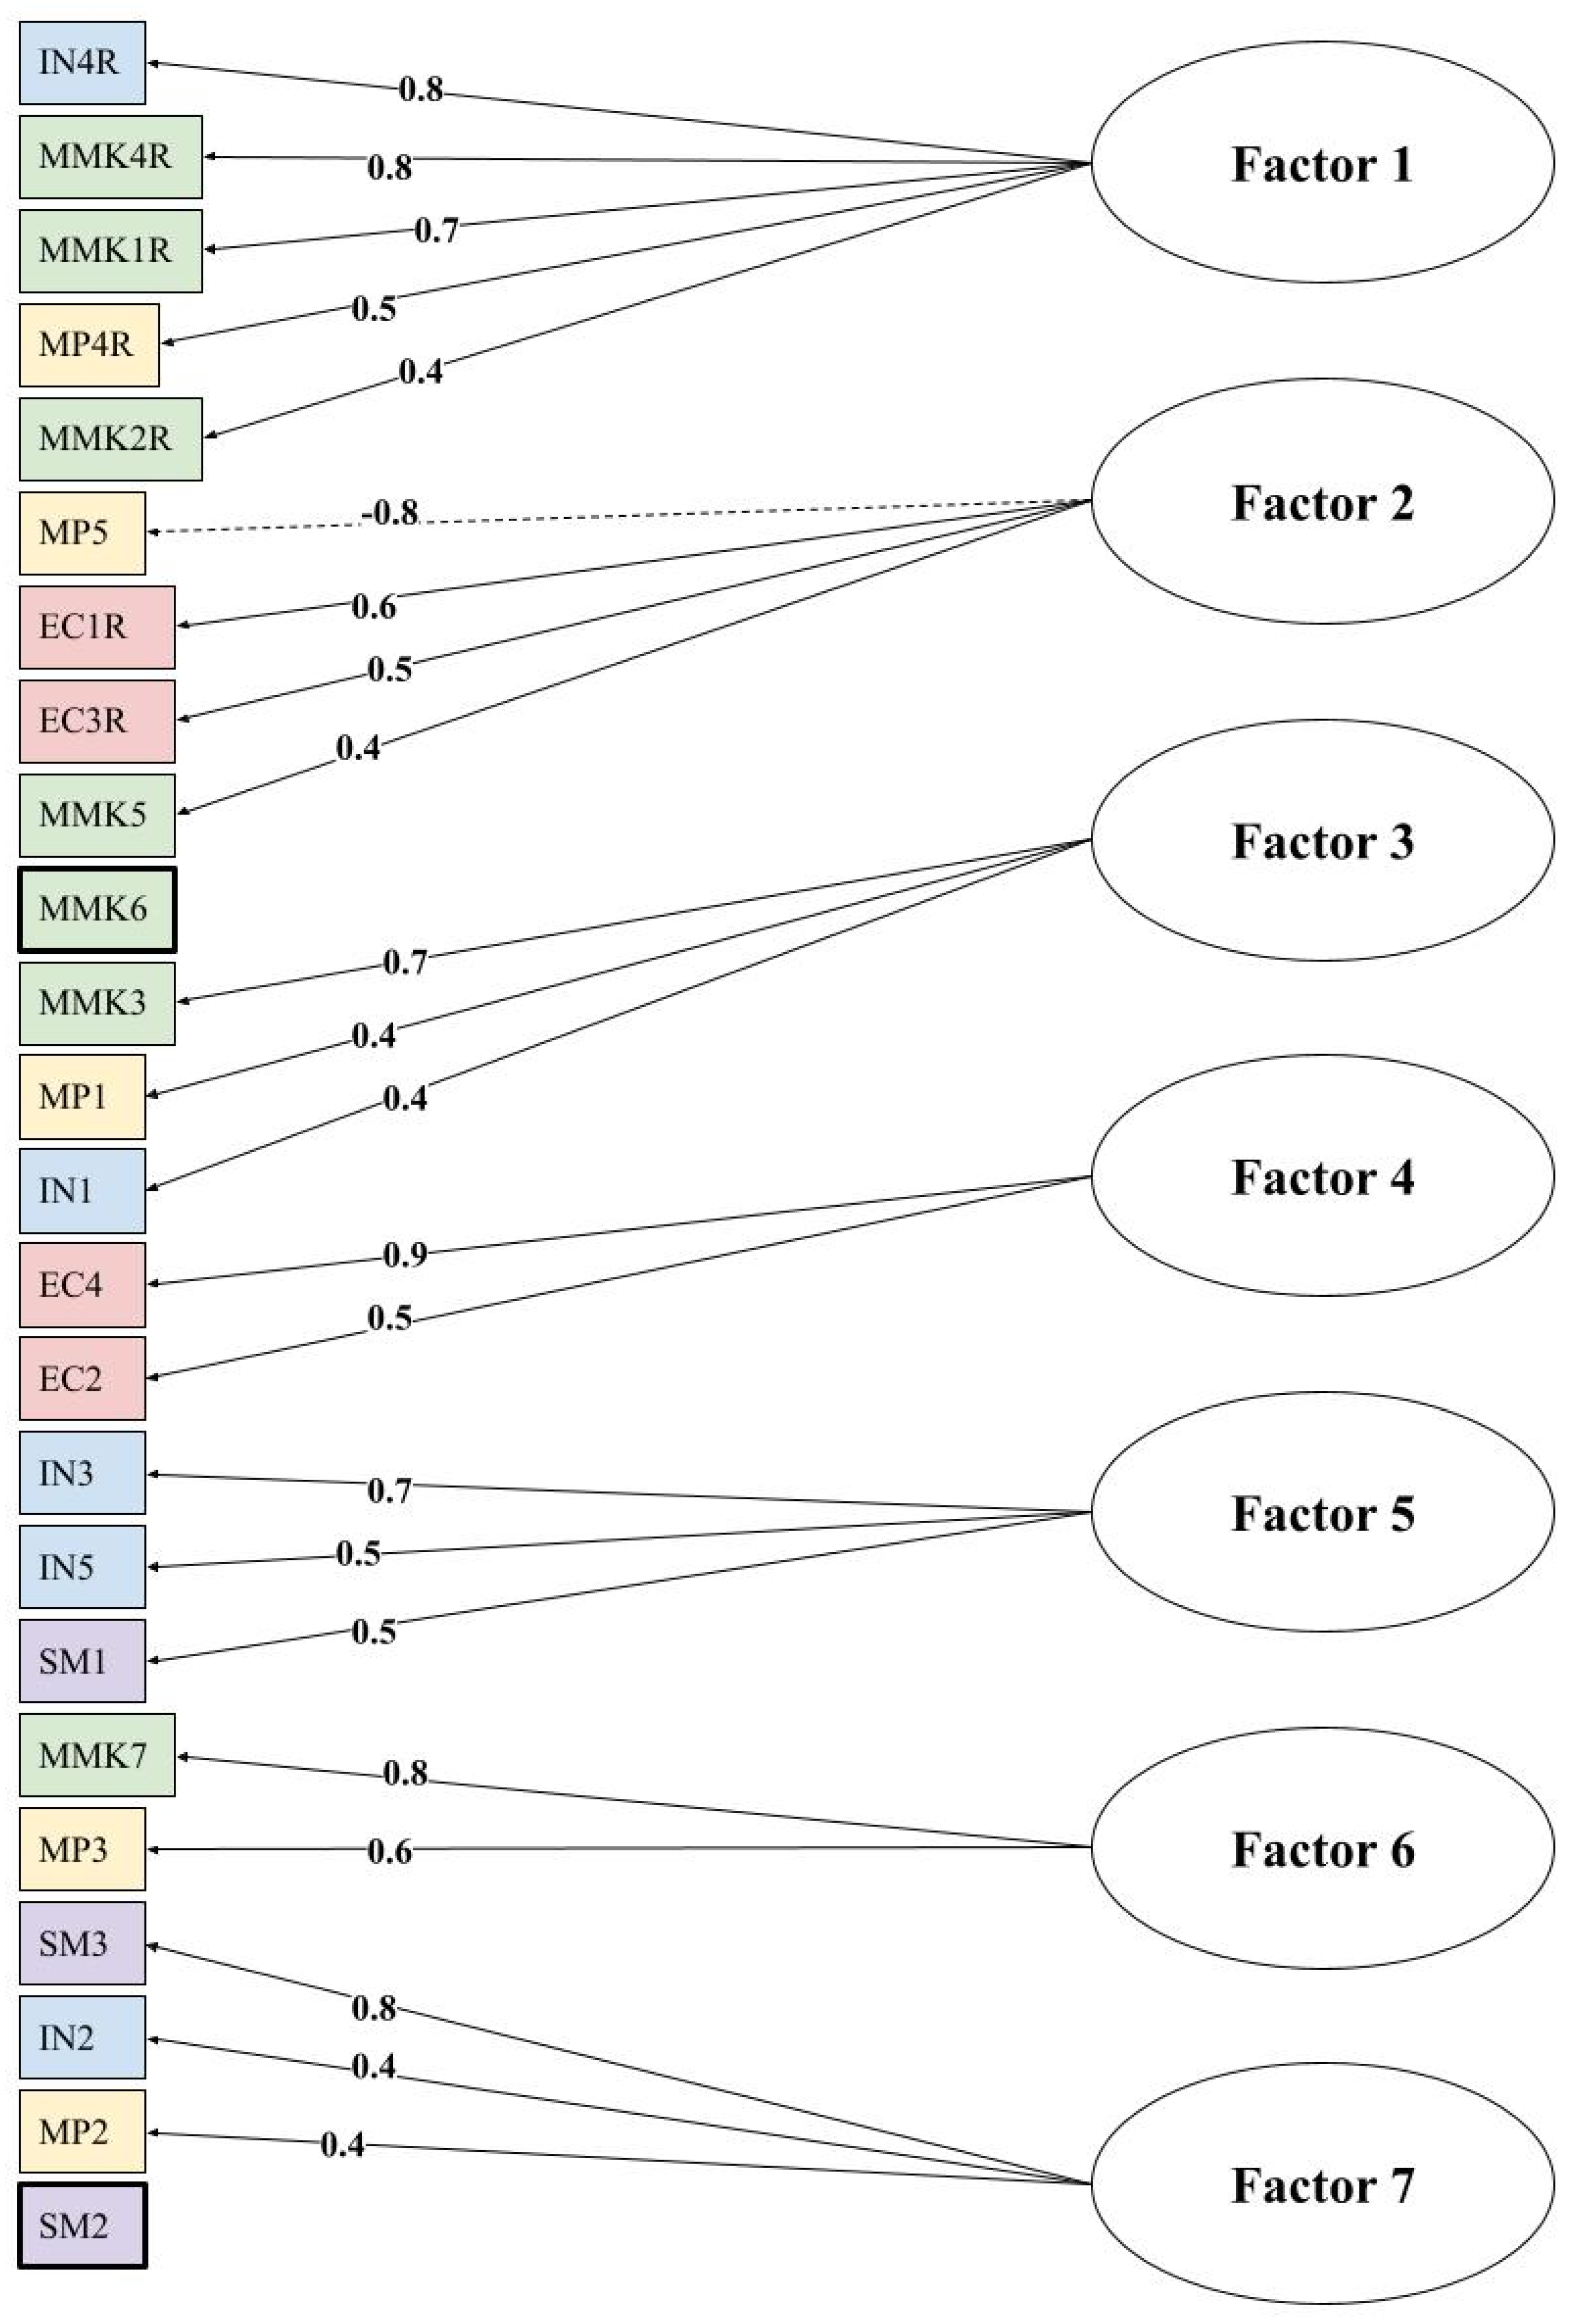
Next, we extracted the seven-factor model using Principal Axis Factoring and Oblimin rotation. The seven factors explained a total variance of 49%, an improvement of 5% from the six-factor model. As Figure 10 shows, 22 of the 24 variables loaded onto the seven factors, and the factor loadings ranged from 0.4 to 0.9, a slight improvement from the 0.3 to 0.8 range in the six-factor model. Item MP5 was still a problematic item with a negative factor loading (−0.8 on Factor 2). More detailed factor loadings can be found in Supplementary File S3, and the correlation matrix for this survey can be found in Supplementary File S4. Again, this factor structure does not coincide with the theoretical framework on which the items were developed. As Figure 10 shows, the items continue to load based on factors that we did not anticipate (i.e., colors are not matched to factors). Reverse-coded items are loading onto factors by themselves (e.g., Factor 1), and CK items (e.g., MP and MMK items) are loading onto factors with PK items (e.g., IN, SM, and EC items). Furthermore, two items, MMK6 and SM2, did not load onto any of the seven factors because they had cross-loadings across two or more factors (see Supplementary File S3).
4.2. Validation and Revision of the 2nd Version of the KMM-ST Survey
4.2.1. Content Validation through SME Consultation
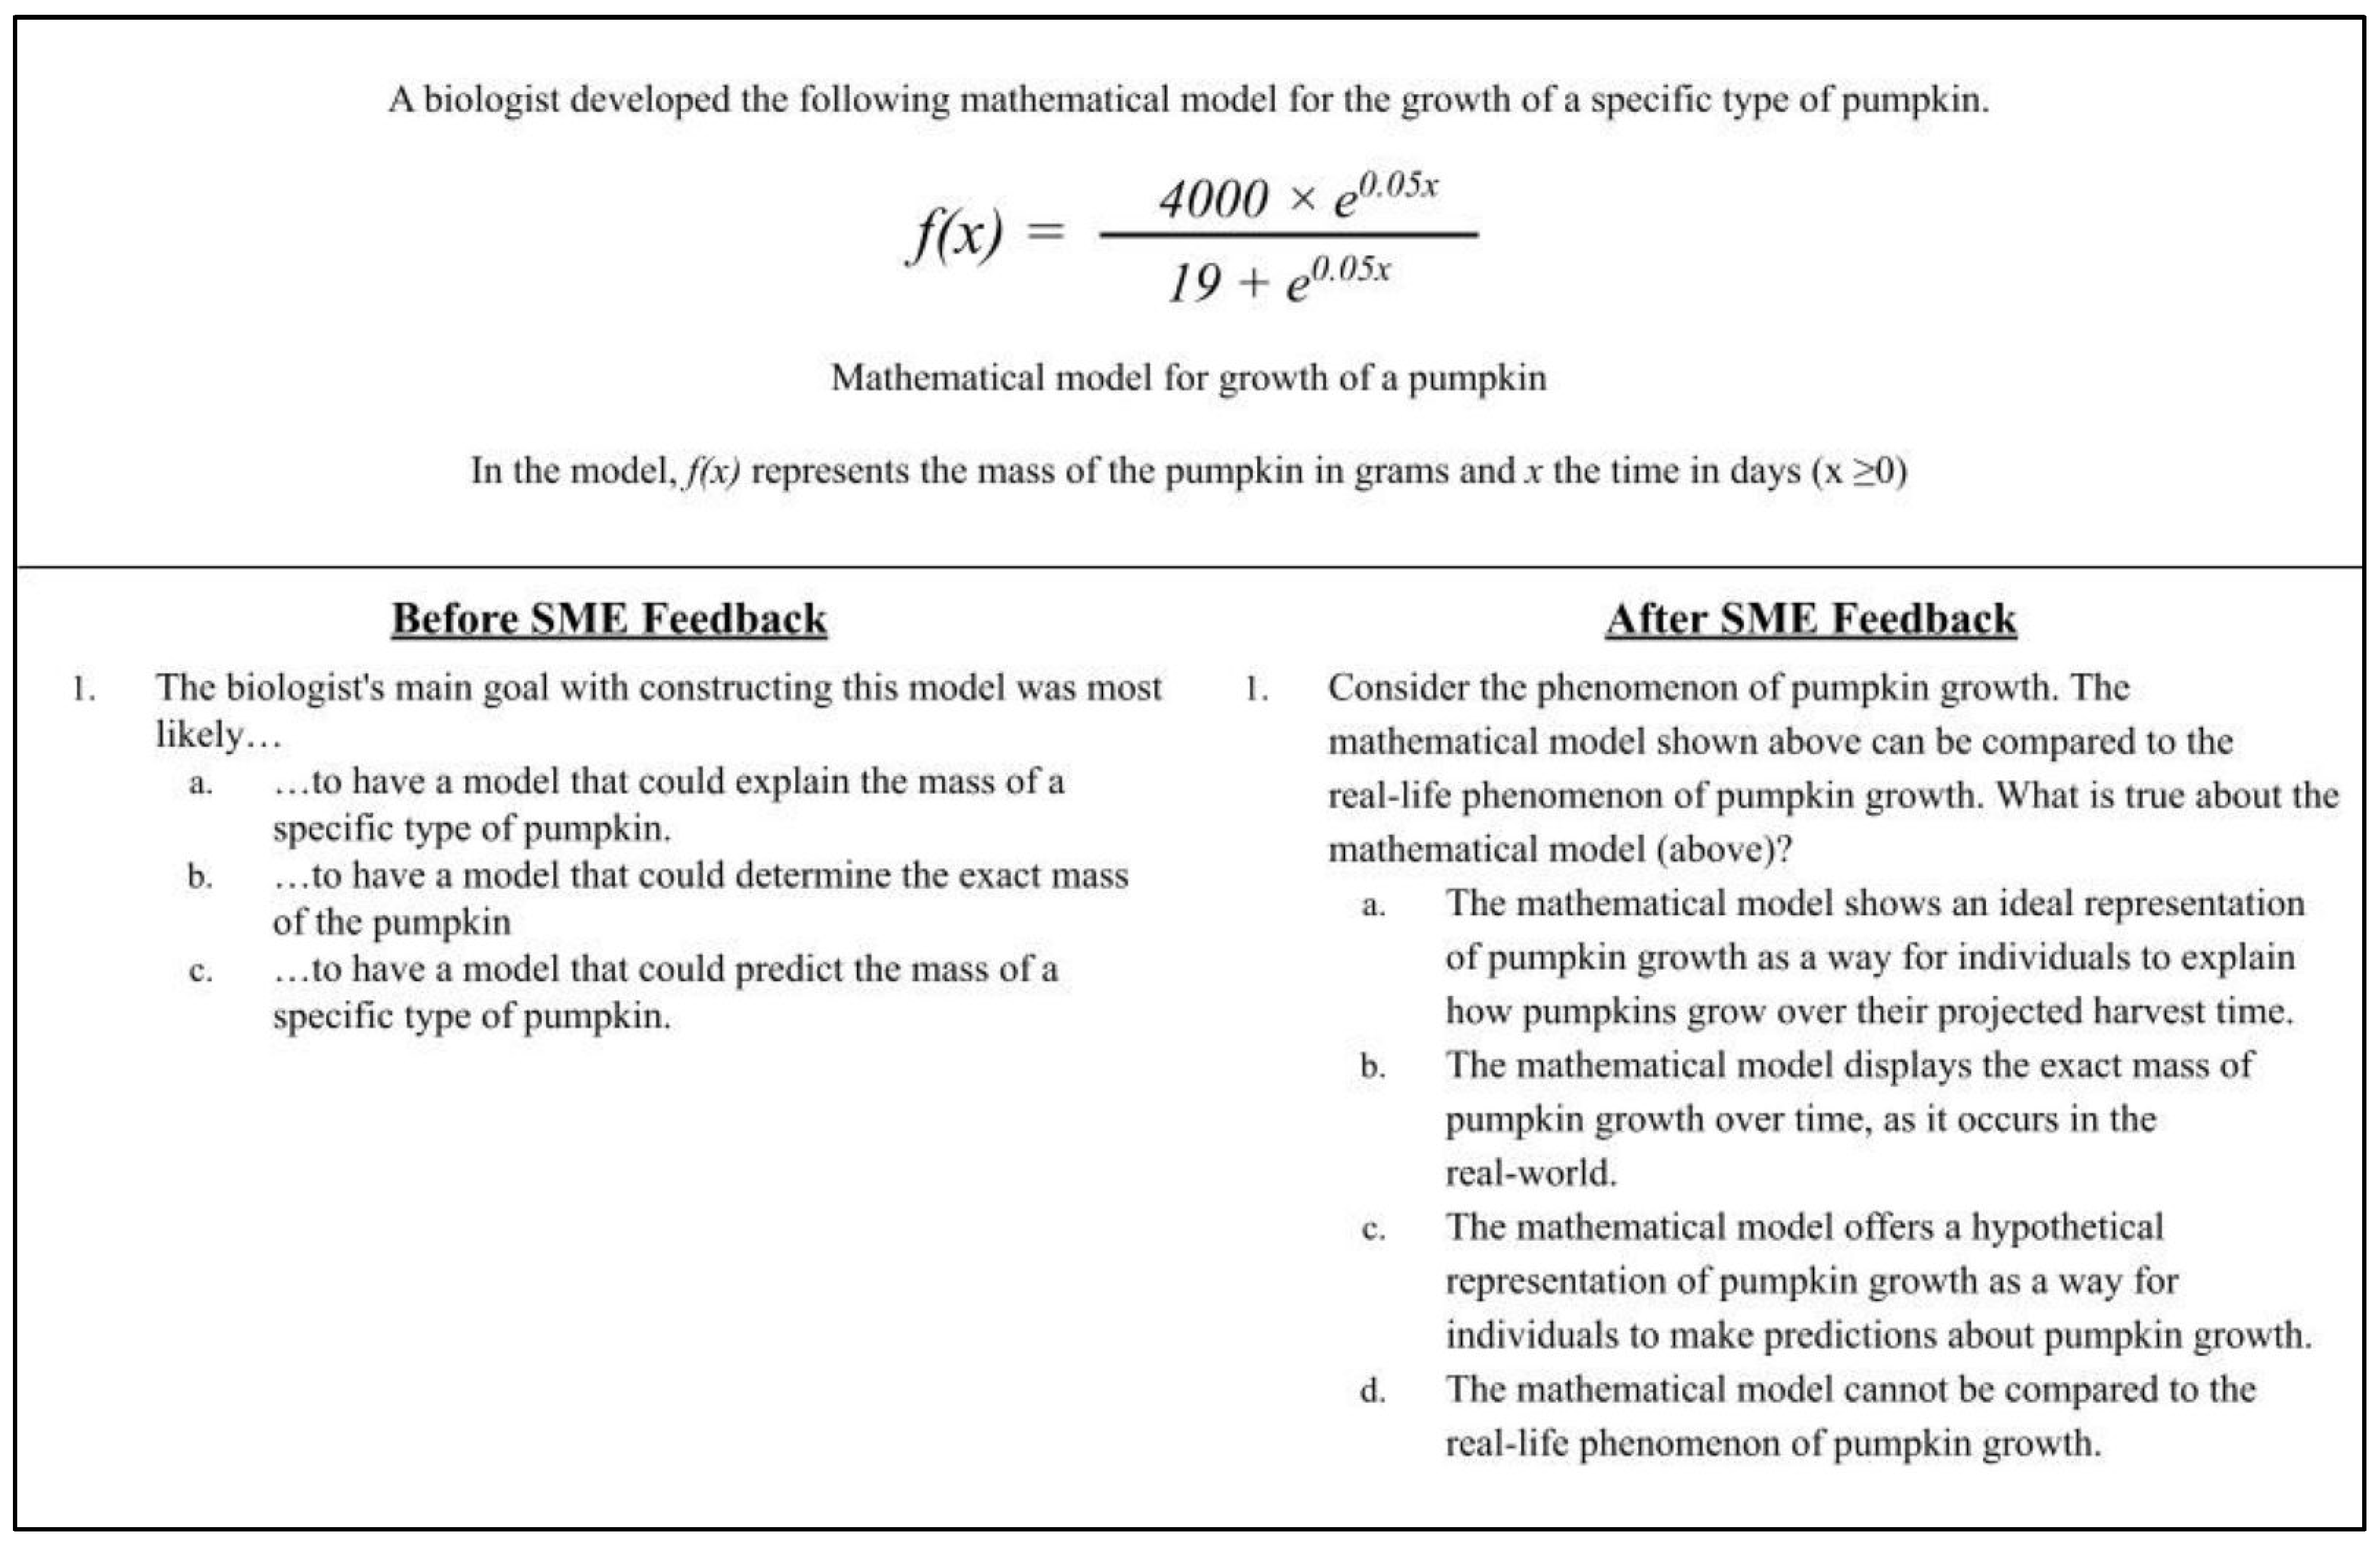
On the Content Validation Worksheets, SMEs were asked to provide a score of relevancy for each question stem as a way to indicate to the researchers whether items were appropriately assigned to the component to which we had assigned them. A review of this data indicated that one item (NM_Pumpkin) was not relevant. This prompted revision of the item (see Figure 11).
In addition to scores of relevancies, SMEs were also asked to examine the answer options in each item within the instrument and report the level that they believed the answer option was associated with, using the theoretical framework they were provided. We analyzed these results to search for items in which SMEs had selected levels that were non-adjacent scores (e.g., SME 1 says answer option A is level 1, and SME 2 says answer option A is level 3). A total of 10 items had non-adjacent scores. For these 10 items, we revised the answer options to better fit the proposed levels in the framework (Table 1). An example of such a revision is shown in Figure 12.
4.2.2. Analysis of Responses to the 1st Version of the KMM-ST Survey
Descriptive Statistics and Item Analysis
Results from the survey revealed a mean score of 57.6 points out of a total of 75 points (SD = 5.88) and a median score of 59 points. When examining each of the five components in the revised KMM-ST framework (Figure 4), participants scored the lowest on changing models, with a sum of 9.90 (SD = 2.20) for the five items related to this component, followed by multiple models, with a sum of 11.21 (SD = 1.82). The remaining three aspects, nature of models, purposes of models, and testing models, had sums of 12.35 (SD = 1.91), 12.03 (SD = 1.88), and 12.20 (SD = 1.72), respectively. The mean scores and standard deviations for each independent item are shown in Table 4 below.
Results from Exploratory Factor Analysis
We conducted a test to determine the suitability of the data for exploratory factor analysis (EFA). The Kaiser–Meyer–Olkin (KMO) Measure of Sampling Adequacy and Bartlett’s Test of Sphericity can be used for this purpose [47]. Bartlett’s Test of Sphericity (𝝌2 = 488.09; d.f. = 300; p < 0.001) and the KMO Measure of Sampling Adequacy (KMO = 0.600) indicate that EFA was appropriate for our sample. Factor analysis (Principal Axis Factoring) of the dataset using Oblimin rotation revealed a one-factor model based on eigenvalues which were greater than one (i.e., Kaiser’s criterion [49]). We used Horn’s parallel analysis [50] to further examine the scale. This analysis revealed a five-factor model would be more suitable for the data (Figure 13). Using Horn’s method for parallel analysis [50], a random set of data was generated over 720 iterations to produce eigenvalue distributions at the 95th percentile. In Figure 13, the red line shows the observed data, the black line shows the 95th percentile (adjusted data), and the blue line shows the randomly generated data. A one-factor model is consistent with the revised KMM-ST framework (Figure 3), where all five components tested in this survey belong to the CK subconstruct. A five-factor model would also be supported by the literature if it aligns with the five components identified in the FMC (Table 1). Given the discrepancy between Kaiser’s criterion and Horn’s parallel analysis, we adopted a third method for determining factor retention: the empirical Kaiser criterion method [51]. This method suggested a one-factor model was most appropriate for the data (Figure 14).
Given that both a one-factor and five-factor model would be consistent with the theoretical background on which the items were constructed, we ran both models and determined which model had the best fit for the data based on fit statistics (RSMEA, TLI, and BIC). For clarity, we also ran two-, three-, and four-factor models to examine changes to the fit statistics as we approached the five-factor model. Table 5 shows the five-factor model is favored over the one-factor model primarily due to the Tucker Lewis Index. Ideally, a good model fit should have a TLI score of 0.09 or greater [55]. When comparing the TLI of the one-factor model to the five-factor model, only the five-factor model meets this TLI criterion.
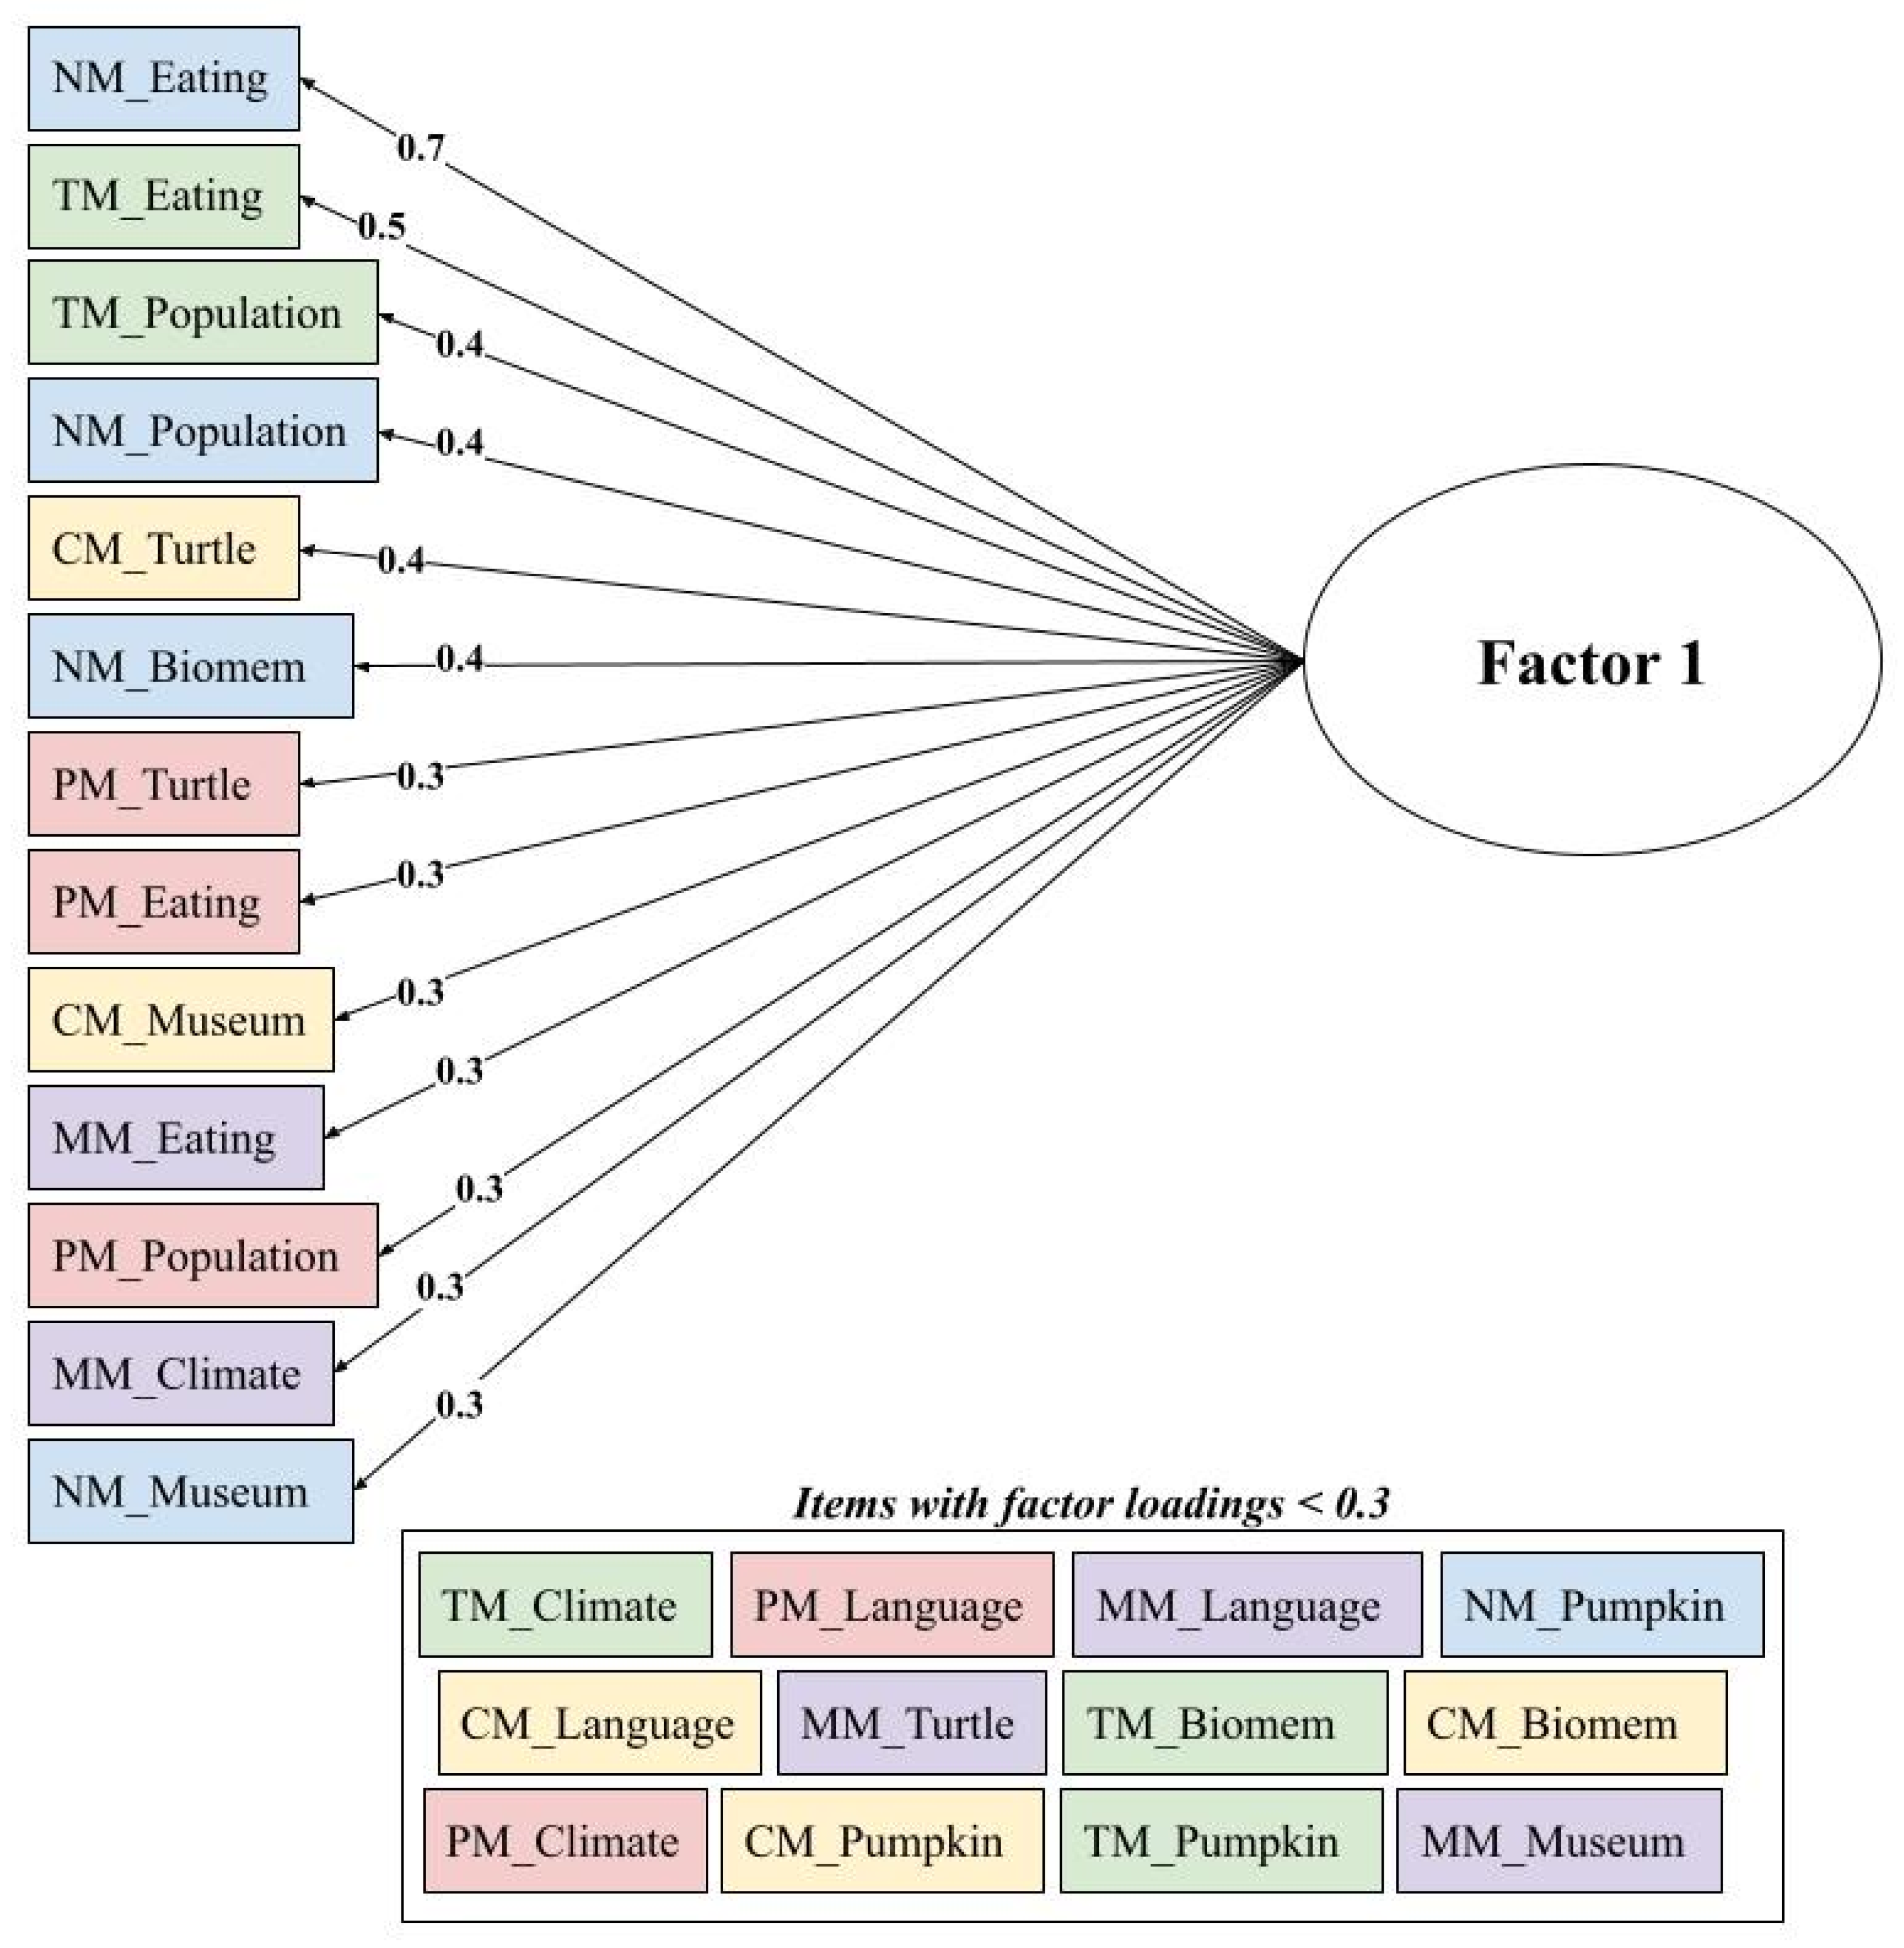
We extracted the one-factor model using Principal Axis Factoring and Oblimin rotation. The one factor explained a total variance of 10%. As Figure 15 shows, a total of 13 items loaded onto the factor with factor loadings between 0.3 and 0.7. A total of 12 items had inadequate factor loadings (less than 0.3). More detailed factor loadings can be found in Supplementary File S5, and the correlation matrix for this survey can be found in Supplementary File S6. This factor structure could align with theory, as all five components of the FMC are part of the CK construct; thus, the factor could be measuring content knowledge of models and modeling as defined by the FMC components. Items are color-coded in Figure 15 to show the component of the FMC to which they were assigned. Figure 15 shows that there are at least two of each FMC-component item within the one factor that was retained, thus ensuring the measure captures all components of the FMC in the measure.
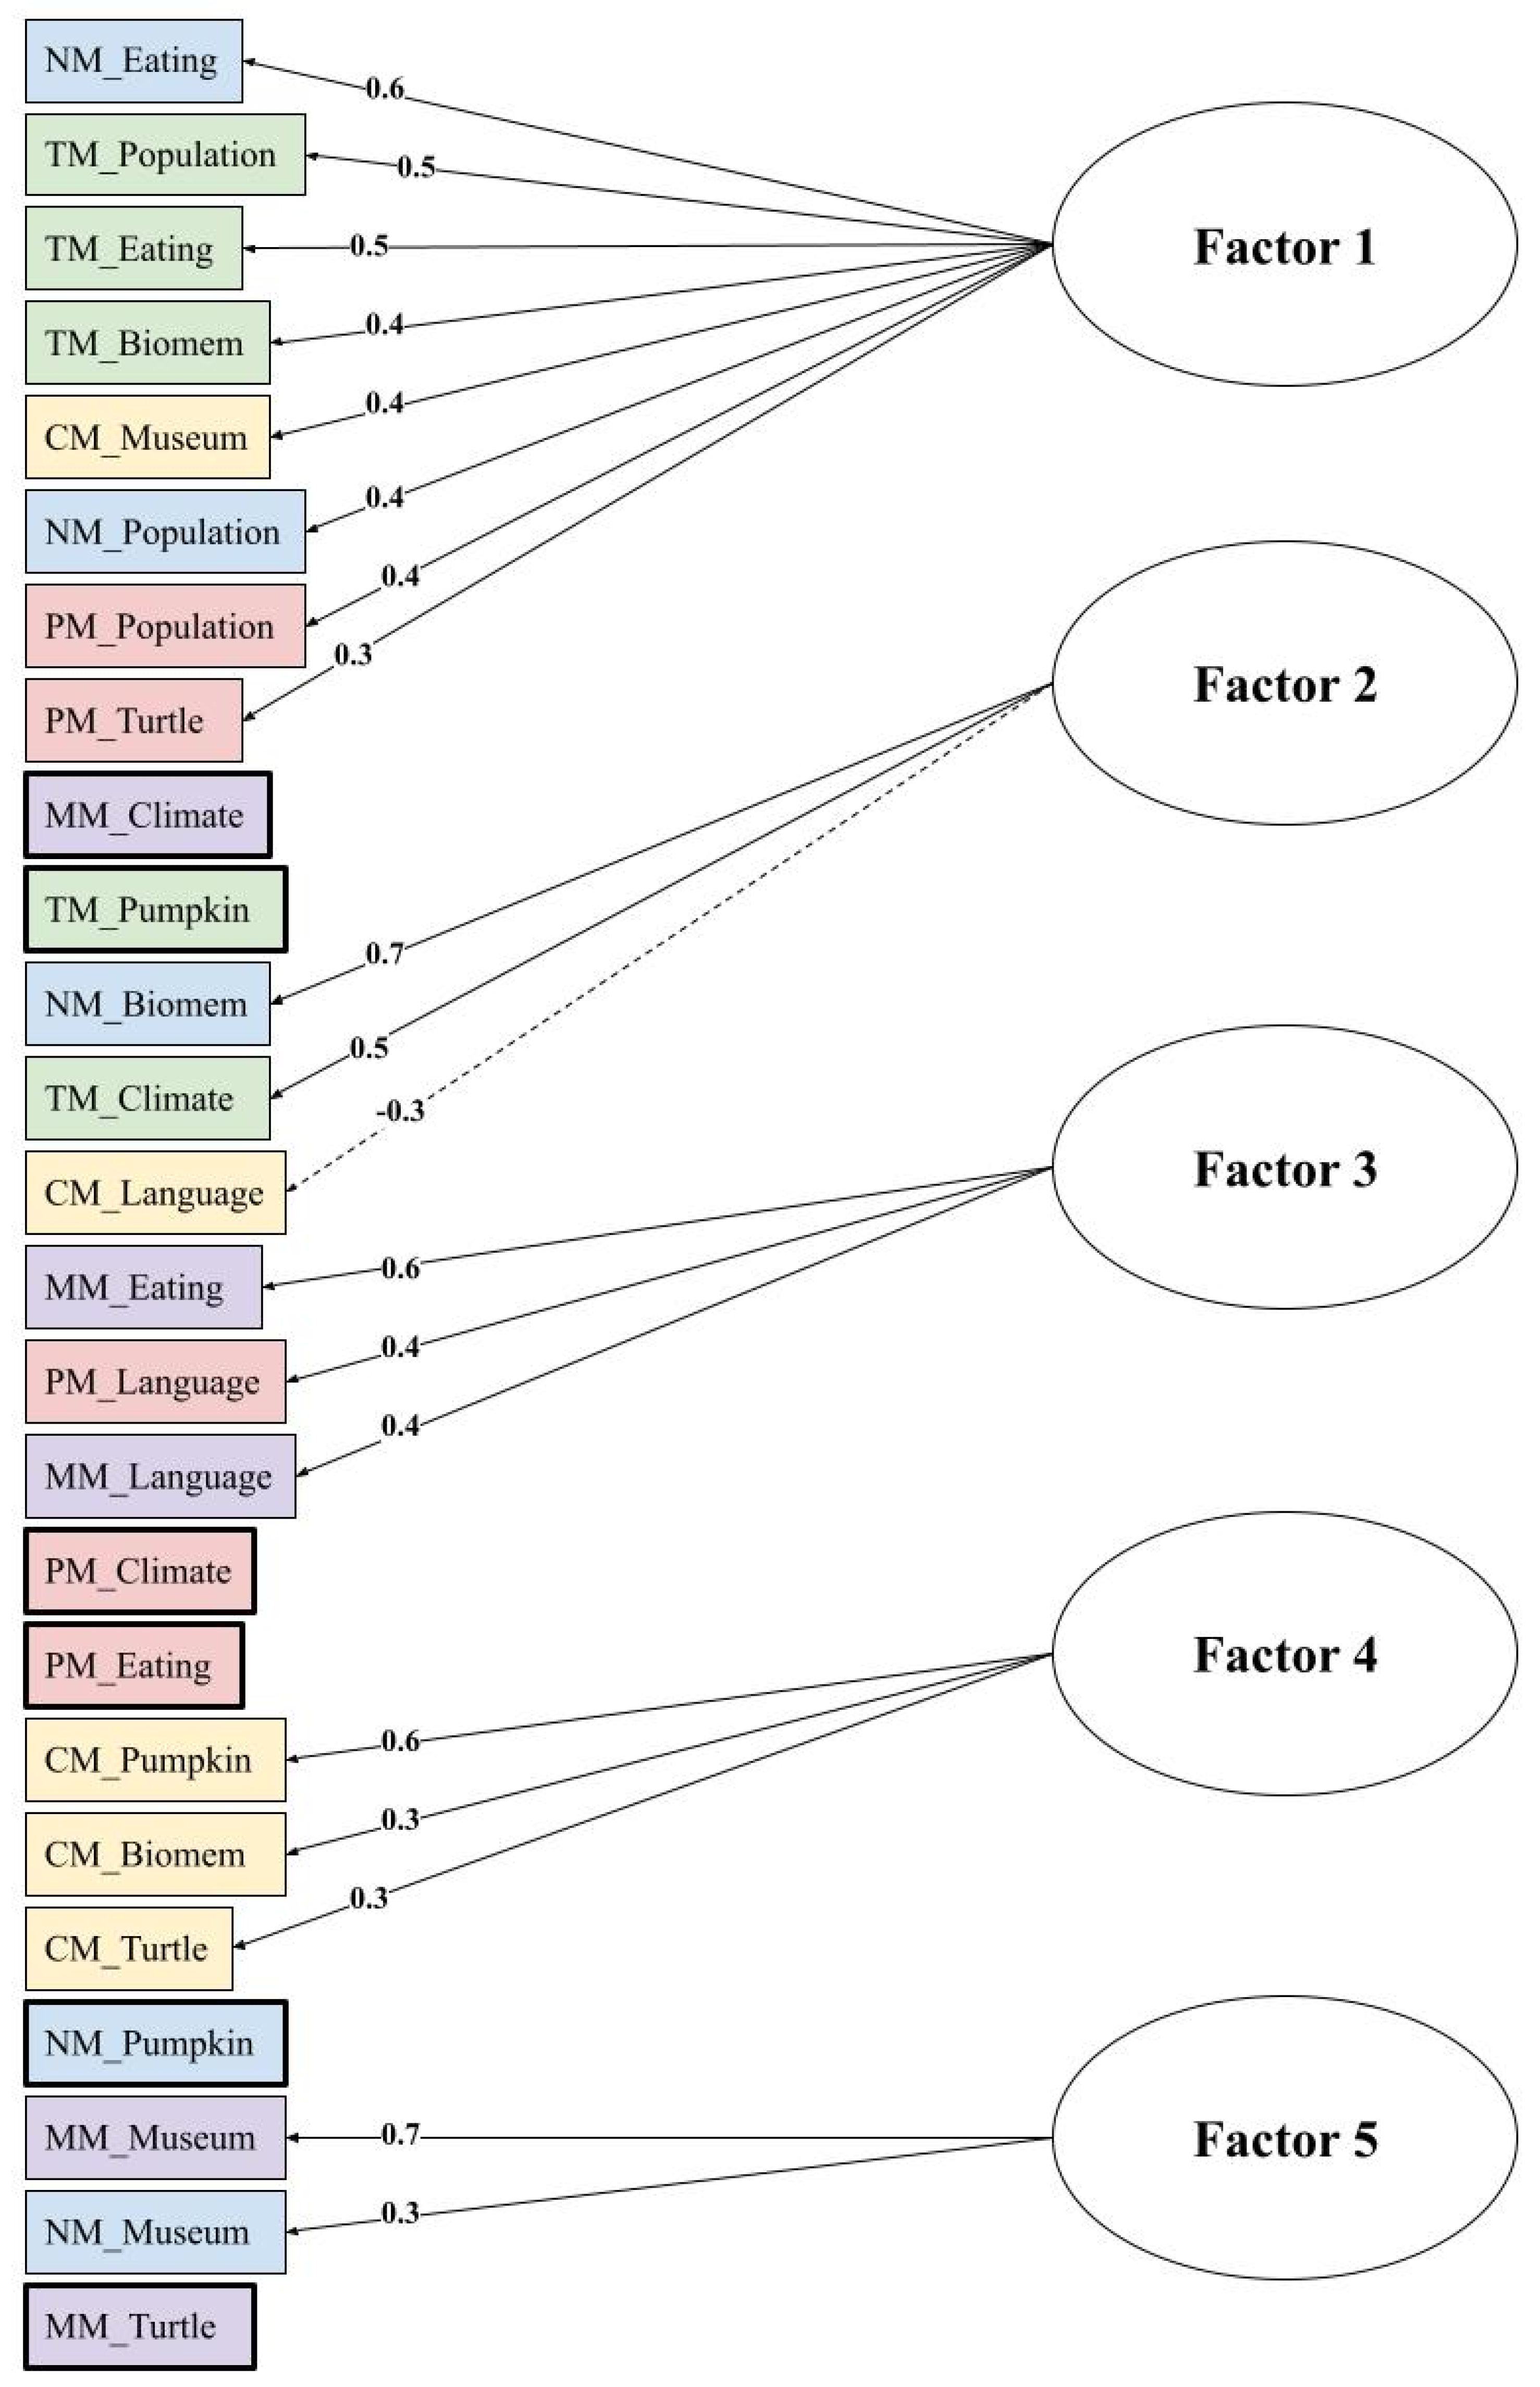
Next, we extracted the five-factor model that was supported by model fit statistics as well as Horn’s parallel analysis. This model explained 24% of the variance in the data, an improvement of 14% from the one-factor model. As Figure 16 shows, 19 of the 25 variables were loaded onto the five factors, with loadings ranging from 0.3 to 0.7. A total of six variables did not load onto any factor due to cross-loading issues (see Supplementary File S5). In addition, CM_Language had a negative factor loading as this item proved difficult for survey respondents. Most importantly, this factor structure indicated that items were not loaded onto the anticipated five factors aligned to the FMC. This can be seen in Figure 16, where we would expect items of the same color to load onto the same factor.
Unlike the items from the first version of the KMM-ST survey, the second KMM-ST survey showed potential for alignment with the theoretical framework. Therefore, we moved into a period of iterative item reduction in hopes of clarifying the factor structure. We used the one-factor model to guide this work because it was supported by the empirical Kaiser criterion [51] and general Kaiser’s rule [49] as the appropriate factor structure for the data. Using guidance from Ford et al. [57], we took a stepwise approach to item reduction in which we dropped items with communalities less than 0.20 and factor loadings less than 0.40. We dropped one item at a time, choosing items with the lowest communality value and factor loading each time, and reexamined the factor structure after each item was dropped. A total of 14 items were dropped from the scale before a factor structure resembling the FMC was revealed. This factor structure was found to be a four-factor model (RMSEA = 0; TLI = 1.06; and BIC = −70), in which testing models and nature of models fall into the same factor while the other components of the FMC (changing models, purpose of models, and multiple models) are in their own factors. Dropping over 50% of the total items is not ideal, and we do not suggest the final scale is a valid and reliable scale for measuring KMM-ST given the measures taken to clarify the factor structure. However, it does show promise for the next round of revision of the KMM-ST survey as it helps to show patterns in the items that belong to the same factor. Figure 17 shows the factor structure, while Table 6 shows the factor loadings and communalities for the retained items. More detailed information can be found in Supplementary File S5.
5. Discussion
5.1. Discussion of the Findings from the 1st Version of the KMM-ST Survey
In the development and validation of two versions of a KMM-ST survey aimed at measuring teachers’ content and pedagogical knowledge of models and modeling in science teaching, we were able to obtain insights into measuring this knowledge construct that could be a helpful addition to the extant literature on modeling assessments for teachers. When examining the descriptive statistics and feedback from SMEs from the first version of the KMM-ST survey, we found CK and PK items using a Likert-scale to be unchallenging for respondents. The majority of respondents were able to easily select the correct response for both CK (M = 10.21; 85%) and PK (M = 10.13; 84%) items. A plausible explanation could be that as NGSS have been implemented for almost 10 years and the use of science models has been emphasized in science education as a key component of scientific inquiry even before the release of NGSS [58,59], science teachers are likely to be familiar with the nature of models and modeling and their applications in science classrooms. This indicates that our initial items are not challenging enough to discriminate between different levels of teacher understanding and led us to adjust the difficulty level of the items by changing their format to a multiple-choice item (for CK items only). One limitation to this study is that we did not collect background information for this group of participants, so we were unable to examine whether these results were reflective of a specific subset of teachers (e.g., those with advanced degrees) or all teachers. In addition, modeling is at the core of scientific reasoning [60], which is why modeling is frequently found within assessments of scientific reasoning (e.g., PISA [61]). Therefore, it is possible that the first version of the KMM-ST survey might measure scientific reasoning skills and the enactment of those skills in the classroom (i.e., pedagogies) rather than understanding of scientific modeling. This could explain the high mean scores on items even for teachers who have little experience with scientific modeling (e.g., those who teach in non-NGSS states).
One of the most problematic methodological issues we found in the 1st version of the KMM-ST survey was with reverse-coded items loading onto the same factor. Many researchers have recently become critical of reverse-coded items [62], and one reason for the criticism is that these items may measure something that the researchers do not intend to measure [63]. When reviewing our reverse-coded items as a whole, one theme emerged in relation to beliefs about learning. For example, one PK item reads, “The critique of scientific models in the science classroom should function to support students’ content knowledge development”. Teachers who have a strong belief that science teaching should prioritize content acquisition are more likely to endorse this item, and thus this item might measure teachers’ epistemic beliefs about teaching science instead of their pedagogical knowledge of models or both, depending on how individual teachers interpret and respond to the item. Furthermore, in consultation with SMEs in science education, several points of feedback described PK items as potentially controversial due to different “teaching styles” and this appears to be confirmed, at least for reverse-coded items, by the factor analysis. This finding is one reason why we adopted a multiple-choice format for the 2nd version of KMM-ST.
The decision to use a Likert response scale for the first version of the KMM-ST survey was influenced by a survey by van Driel and Verloop [22], where they used Likert scale items to assess teachers’ knowledge of models and modeling in science. One key difference between our survey and the van Driel and Verloop [22] survey is the approach to assessing this construct. In the van Driel and Verloop [22] survey, they captured teacher knowledge of the construct with reference to science teaching norms. In other words, their survey acted as a norm-referenced test. Alternatively, our aim with the construction of this survey is to arrive at an instrument that can measure teacher knowledge in relation to a predefined set of knowledge of models and modeling, also known as a criterion-referenced test [64]. This required us to dichotomize responses (i.e., recode the data to represent “correct” and “incorrect” responses) when describing the data. Given the problems we found with reverse-coded items, items exhibiting a ceiling effect because they were unchallenging, the need to recode our data for descriptive purposes, and the factor analyses showing a factor structure that was unsupported by theory where CK and PK items were loading onto the same factors, we determined that our response scale needed to change for the 2nd version of the KMM-ST survey.
5.2. Discussion of the Findings from the 2nd Version of the KMM-ST Survey
Reflecting on the results from our 1st version of the KMM-ST survey, we reconsidered the Likert response scale as well as the issue of having CK and PK items load onto the same factors. We knew that our response scale needed to be more reflective of response scales that are typical for criterion-referenced tests, and we would encourage scholars involved in the assessment of science and engineering practices to first consider the distinctions between norm-referenced and criterion-referenced tests. We would argue that (1) for most practices, there exists a large enough body of literature to justify cut scores for criterion-referenced tests, and (2) norm-referenced tests are more susceptible to the inclusion of additional school- or teacher-level variables and thus harder to validate. For this reason, we adopted the multiple-choice format for items in the 2nd version of the survey. In addition, we also chose to separate the CK and PK subconstructs and measure them using different scales, meaning they would be validated separately. Our work on the PK items, which are designed using an open-ended questionnaire format, is ongoing and will be reported in a later publication. In the case of our 2nd version of the KMM-ST, the CK items were constructed through the adoption of the FMC (Table 1), a competence model, because it offered a clear method for determining cut scores and a framework for building multiple-choice items. We encourage scholars investigating other science practices to refer to pre-existing learning progressions or competence models [40] that have been constructed for their desired practice. These frameworks serve as the standard or objective on which item specifications can be built and cut scores can be derived. For example, in the case of the FMC, scholars suggest that students who have reached level 3 show evidence of using the models for perspective, while students at level 2 continue to use the models of perspective [5,33]. As such, the cut score can be established as being between level 2 and level 3.
In reference to the results from the exploratory factor analysis, we found evidence to support a four-factor model consistent with the FMC but with low reliability estimates and extreme negative impacts on validity. This can be explained by the small number of items in each factor (e.g., three factors with two items each). We plan to move forward by using the retained items as a guide for revising the dropped items so that we can reincorporate these items into the survey and improve the reliability and validity of the scale. Additionally, the results showed that the nature of models items loaded onto the same factor as testing models. We suspect that this could be because both the nature and purposes of models tend to be inherent in the other components (i.e., testing, changing, and multiple models). We attempted to clarify the nature of models items which loaded onto the testing models factor so that these items, in future survey administrations, would load onto a separate fifth factor.
5.3. Limitations and Future Work
Moving forward, we plan to continue revisions and subsequently collect validity-related evidence for the KMM-ST survey using the multiple-choice approach. Dropping a total of 14 items from a 25-item scale (the 2nd version of the KMM-ST survey) impacted the validity and reliability of this survey. This limitation, in conjunction with a smaller sample size (1st version: n = 105; 2nd version: n = 144), are the two pieces we aim to improve in future work. As previously mentioned, item revisions to the 2nd version of the KMM-ST survey are underway and are driven primarily by the aim of revising dropped items in ways that make them mirror the retained items in their factor, with the goal of improving the reliability and validity of the scale in future iterations. Should this not be possible, we plan to consider an additional layer to the item response format—a ranking task for each item. Currently, respondents are asked to endorse only one correct answer for each question. A ranking task would mean that respondents are asked to rank each answer option in the question from “applies least” to “applies most” [44]. This could be a possible solution which would improve the reliability of the scale should the revised items still not load onto their appropriate factors in a future survey administration. However, we recognize that there are advantages and disadvantages to this approach. Ranking the answer options could prove to be tedious for respondents and could result in testing fatigue whereas the same is not true for multiple-choice items. Yet, respondents are more likely to randomly endorse items if they are asked to select a single answer. Finally, cognitive interviews with two teachers at the conclusion of the administration of the second version of the KMM-ST revealed that teachers are struggling with selecting a single answer option. This is because levels one, two, and three answer options are all plausible and valid answers, but only level three is the most correct. This indicates that we may be able to capture more insightful information from teachers if we were to utilize the ranking task method. In reference to sample size, EFA is highly susceptible to sample size effects, yet there is disagreement in the psychometric community about the size needed to test for statistical significance in validation work [65]. Item-to-response ratios vary between 1:4 [66] and up to 1:10 [67]. In this work, our sample sizes were at the lower end of the ranges described. As such, future work will aim for a sample size of 200 or more, making the item-to-response ratio 1:8. In conclusion, by comparing two different approaches to measuring teachers’ content and pedagogical knowledge of models and modeling in science teaching, we were able to determine the most appropriate method for assessing the CK subconstruct and continue this work for the PK subconstruct. Based on the outcomes of the validation of the first version of the KMM-ST survey, we have determined that PK items are better suited to an open-ended assessment format. This is justified by their correlation with CK items, the feedback from science education SMEs suggesting these items might be “controversial” due to teachers’ different approaches and orientations to teaching, and previous scholars who argue pedagogy is context-dependent [68], making it difficult to assess without a consideration of context. Additionally, approaches for constructing CK items should follow guidelines for criterion-referenced tests rather than norm-referenced tests. Given that a wealth of modeling literature exists to determine cut scores for criterion-referenced tests, these tests can indicate a more accurate knowledge level against standards. Finally, as we continue to collect more construct-related validity on the CK portion of the KMM-ST survey, we will examine additional factors that might improve the reliability of the survey that involve revisions of previously dropped items and the possibility of including a ranking task within the multiple-choice items. Overall, this work builds on the existing literature for modeling assessment for teachers and provides insights into the ways that either competence models or learning progression frameworks designed for student learning could also be applicable for measuring teacher knowledge of science and engineering practices.
Supplementary Materials
The supplementary files are available online at https://www.mdpi.com/article/10.3390/educsci13040405/s1.
Author Contributions
Conceptualization, G.C. and S.P.; Methodology, G.C. and S.P.; Validation, G.C.; Writing—original draft, G.C.; Writing—review & editing, S.P.; Supervision, S.P. All authors have read and agreed to the published version of the manuscript.
Funding
This research was funded by the National Science Foundation, grant number: 2101590.
Institutional Review Board Statement
The study was conducted in accordance with the Declaration of Helsinki, and approved by the Institutional Review Board of North Carolina State University (protocol code: #24400, 5 October 2021; #25000, 13 June 2022).
Informed Consent Statement
Informed consent was obtained from all subjects involved in the study.
Data Availability Statement
The data are not publicly available due to North Carolina State University Institutional Review Board Protocols 24400 and 25000.
Conflicts of Interest
The authors declare no conflict of interest.
References
- Ke, L.; Schwarz, C.V. Supporting students’ meaningful engagement in scientific modeling through epistemological messages: A case study of contrasting teaching approaches. J. Res. Sci. Teach. 2021, 58, 335–365. [Google Scholar] [CrossRef]
- NGSS Lead States. Next Generation Science Standards: For States, by States; National Academies Press: Washington, DC, USA, 2013. [Google Scholar]
- OECD. PISA 2018 Assessment and Analytical Framework. In OECD, PISA 2018 Science Framework; OECD Publishing: Paris, France, 2019; pp. 97–117. [Google Scholar] [CrossRef]
- Berland, L.K.; Schwarz, C.V.; Krist, C.; Kenyon, L.; Lo, A.S.; Reiser, B.J. Epistemologies in practice: Making scientific practices meaningful for students. J. Res. Sci. Teach. 2016, 53, 1082–1112. [Google Scholar] [CrossRef]
- Gouvea, J.; Passmore, C. ‘Models of’ versus ‘Models for’: Toward an agent-based conception of modeling in the science classroom. Sci. Educ. 2017, 26, 49–63. [Google Scholar] [CrossRef]
- National Research Council (NRC). A Framework for K-12 Science Education: Practices, Crosscutting Concepts, and Core Ideas; National Academies Press: Washington, DC, USA, 2012. [Google Scholar]
- Chen, Y.; Terada, T. Development and validation of an observation-based protocol to measure the eight scientific practices of the next generation science standards in K-12 science classrooms. J. Res. Sci. Teach. 2021, 58, 1489–1526. [Google Scholar] [CrossRef]
- Inkinen, J.; Klager, C.; Juuti, K.; Schneider, B.; Salmela-Aro, K.; Krajcik, J.; Lavonen, J. High school students’ situational engagement associated with scientific practices in designed science learning situations. Sci. Educ. 2020, 104, 667–692. [Google Scholar] [CrossRef]
- Barth-Cohen, L.A.; Braden, S.K.; Young, T.G.; Gailey, S. Reasoning with evidence while modeling: Successes at the middle school level. Phys. Rev. Phys. Educ. Res. 2021, 17, 020106, Education Database. [Google Scholar] [CrossRef]
- Chang, H.-Y. Teacher guidance to mediate student inquiry through interactive dynamic visualizations. Instr. Sci. 2013, 41, 895–920. [Google Scholar] [CrossRef]
- Hmelo-Silver, C.E.; Jordan, R.; Eberbach, C.; Sinha, S. Systems learning with a conceptual representation: A quasi-experimental study. Instr. Sci. 2017, 45, 53–72. [Google Scholar] [CrossRef]
- Hung, J.-F.; Tsai, C.-Y. The effects of a virtual laboratory and meta-cognitive scaffolding on students’ data modeling competences. J. Balt. Sci. Educ. 2020, 19, 923–939, Education Database. [Google Scholar] [CrossRef]
- Cuperman, D.; Verner, I.M. Learning through creating robotic models of biological systems. Int. J. Technol. Des. Educ. 2013, 23, 849–866. [Google Scholar] [CrossRef]
- Lehrer, R.; Schauble, L. Scientific thinking and science literacy: Supporting development in learning in contexts. In Handbook of Child Psychology, 6th ed.; Damon, W., Lerner, R.M., Renninger, K.A., Sigel, I.E., Eds.; John Wiley and Sons: Hoboken, NJ, USA, 2006; Volume 4. [Google Scholar]
- Passmore, C.; Stewart, J.; Cartier, J. Model-based inquiry and school science: Creating connections. Sch. Sci. Math. 2009, 109, 394–402. [Google Scholar] [CrossRef]
- Windschitl, M.; Thompson, J.; Braaten, M. Beyond the scientific method: Model-based inquiry as a new paradigm of preference for school science investigations. Sci. Educ. 2008, 92, 941–967. [Google Scholar] [CrossRef]
- Banilower, E.R. Understanding the big picture for science teacher education: The 2018 NSSME+. J. Sci. Teach. Educ. 2019, 30, 201–208. [Google Scholar] [CrossRef]
- Park, S.; Kite, V.; Suh, J.; Jung, J.; Rachmatullah, A. Investigation of the relationships among science teachers’ epistemic orientations, epistemic understanding, and implementation of Next Generation Science Standards science practices. J. Res. Sci. Teac. 2022, 59, 561–584. [Google Scholar] [CrossRef]
- Campbell, T.; Oh, P.S.; Maughn, M.; Kiriazis, N.; Zuwallack, R. A review of modeling pedagogies: Pedagogical functions, discursive acts, and technology in modeling instruction. EURASIA J. Math. Sci. Technol. Educ. 2015, 11, 159–176. [Google Scholar] [CrossRef]
- Danusso, L.; Testa, I.; Vicentini, M. Improving prospective teachers’ knowledge about scientific models and modelling: Design and evaluation of a teacher education intervention. Int. J. Sci. Educ. 2010, 32, 871–905. [Google Scholar] [CrossRef]
- Krell, M.; Krüger, D. University students’ meta-modelling knowledge. Res. Sci. Technol. Educ. 2017, 35, 261–273. [Google Scholar] [CrossRef]
- Van Driel, J.H.; Verloop, N. Teachers’ knowledge of models and modelling in science. Int. J. Sci. Educ. 1999, 21, 1141–1153. [Google Scholar] [CrossRef]
- Shi, F.; Wang, L.; Liu, X.; Chiu, M. Development and validation of an observation protocol for measuring science teachers’ modeling-based teaching performance. J. Res. Sci. Teach. 2021, 58, 1359–1388. [Google Scholar] [CrossRef]
- Shulman, L.S. Those Who Understand: Knowledge Growth in Teaching. Educ. Res. 1986, 15, 4–14. [Google Scholar] [CrossRef]
- Park, S.; Chen, Y.-C. Mapping out the integration of the components of pedagogical content knowledge (PCK) for teaching photosynthesis and heredity. J. Res. Sci. Teach. 2012, 49, 922–941. [Google Scholar] [CrossRef]
- Gess-Newsome, J. Pedagogical content knowledge: An introduction and orientation. In Examining Pedagogical Content Knowledge; Springer: Dordrecht, The Netherlands, 1999; pp. 3–17. [Google Scholar]
- Förtsch, S.; Förtsch, C.; von Kotzebue, L.; Neuhaus, B. Effects of teachers’ professional knowledge and their use of three-dimensional physical models in biology lessons on students’ achievement. Educ. Sci. 2018, 8, 118. [Google Scholar] [CrossRef]
- Henze, I.; Van Driel, J.; Verloop, N. The change of science teachers’ personal knowledge about teaching models and modelling in the context of science education reform. Int. J. Sci. Educ. 2007, 29, 1819–1846. [Google Scholar] [CrossRef]
- Henze, I.; Van Driel, J.H.; Verloop, N. Development of experienced science teachers’ pedagogical content knowledge of models of the solar system and the universe. Int. J. Sci. Educ. 2008, 30, 1321–1342. [Google Scholar] [CrossRef]
- Gilbert, J.K.; Justi, R. Modelling-Based Teaching in Science Education; Springer International Publishing: Cham, Switzerland, 2016; Volume 9. [Google Scholar] [CrossRef]
- Schwarz, C.V.; Reiser, B.J.; Davis, E.A.; Kenyon, L.; Achér, A.; Fortus, D.; Shwartz, Y.; Hug, B.; Krajcik, J. Developing a learning progression for scientific modeling: Making scientific modeling accessible and meaningful for learners. J. Res. Sci. Teach. 2009, 46, 632–654. [Google Scholar] [CrossRef]
- Magnusson, S.; Krajcik, J.; Borko, H. Nature, sources, and development of pedagogical content knowledge for science teaching. In Examining Pedagogical Content Knowledge; Springer: Dordrecht, The Netherlands, 1999; pp. 95–132. [Google Scholar]
- Schwarz, C.V.; White, B.Y. Metamodeling Knowledge: Developing Students’ Understanding of Scientific Modeling. Cogn. Instr. 2005, 23, 165–205. [Google Scholar] [CrossRef]
- Upmeier zu Belzen, A.; van Driel, J.; Krüger, D. Introducing a framework for modeling competence. In Towards a Competence-Based View on Models and Modeling in Science Education; Upmeier zu Belzen, A., Krüger, D., van Driel, J., Eds.; Springer International Publishing: Cham, Switzerland, 2019; Volume 12, pp. 3–20. [Google Scholar] [CrossRef]
- Mathesius, S.; Krell, M. Assessing modeling competence with questionnaires. In Towards a Competence-Based View on Models and Modeling in Science Education; Upmeier zu Belzen, A., Krüger, D., van Driel, J., Eds.; Springer International Publishing: Cham, Switzerland, 2019; Volume 12, pp. 117–130. [Google Scholar] [CrossRef]
- Nicolaou, C.T.; Constantinou, C.P. Assessment of the modeling competence: A systematic review and synthesis of empirical research. Educ. Res. Rev. 2014, 13, 52–73. [Google Scholar] [CrossRef]
- Louca, L.T.; Zacharia, Z.C. Modeling-based learning in science education: Cognitive, metacognitive, social, material and epistemological contributions. Educ. Rev. 2012, 64, 471–492. [Google Scholar] [CrossRef]
- Oh, P.S.; Oh, S.J. What teachers of science need to know about models: An overview. Int. J. Sci. Educ. 2011, 33, 1109–1130. [Google Scholar] [CrossRef]
- Grünkorn, J.; Upmeier zu Belzen, A.; Krüger, D. Assessing students’ understandings of biological models and their use in science to evaluate a theoretical framework. Int. J. Sci. Educ. 2014, 36, 1651–1684. [Google Scholar] [CrossRef]
- Upmeier zu Belzen, A.; Alonzo, A.C.; Krell, M.; Krüger, D. Learning progressions and competence models: A comparative analysis. In Bridging Research and Practice in Science Education; McLoughlin, E., Finlayson, O.E., Erduran, S., Childs, P.E., Eds.; Springer International Publishing: Cham, Switzerland, 2019; Volume 6, pp. 257–271. [Google Scholar] [CrossRef]
- Grosslight, L.; Unger, C.; Jay, E.; Smith, C.L. Understanding models and their use in science: Conceptions of middle and high school students and experts. J. Res. Sci. Teach. 1991, 28, 799–822. [Google Scholar] [CrossRef]
- Crawford, B.A.; Cullin, M.J. Supporting prospective teachers’ conceptions of modelling in science. Int. J. Sci. Educ. 2004, 26, 1379–1401. [Google Scholar] [CrossRef]
- Jansen, S.; Knippels, M.; van Joolingen, W. Assessing students’ understanding of models of biological processes: A revised framework. Int. J. Sci. Educ. 2019, 41, 981–994. [Google Scholar] [CrossRef]
- Krell, M.; Reinisch, B.; Kruger, D. Analyzing students’ understanding of models and modeling referring to the disciplines biology, chemistry, and physics. Res. Sci. Educ. 2015, 45, 367–393. [Google Scholar] [CrossRef]
- StataCorp. Stata Statistical Software: Release 16; StataCorp LLC: College Station, TX, USA, 2019. [Google Scholar]
- R Core Team. R: A Language and Environment for Statistical Computing; R Foundation for Statistical Computing: Vienna, Austria, 2021; Available online: https://www.R-project.org/ (accessed on 2 April 2023).
- Yong, A.G.; Pearce, S. A beginner’s guide to factor analysis: Focusing on exploratory factor analysis. Tutor. Quant. Methods Psychol. 2013, 9, 79–94. [Google Scholar] [CrossRef]
- Warner, R.M. Applied Statistics: From Bivariate through Multivariate Techniques; Sage Publications: Thousand Oaks, CA, USA, 2012. [Google Scholar]
- Kaiser, H.F. The application of electronic computers to factor analysis. Educ. Psychol. Meas. 1960, 20, 141–151. [Google Scholar] [CrossRef]
- Horn, J.L. A rationale and test for the number of factors in factor analysis. Psychometrika 1965, 30, 179–185. [Google Scholar] [CrossRef]
- Braeken, J.; Van Assen, M.A. An empirical Kaiser criterion. Psychol. Methods 2017, 22, 450. [Google Scholar] [CrossRef]
- Krüger, D.; Hartmann, S.; Nordmeier, V.; Upmeier zu Belzen, A. Measuring scientific reasoning competencies. In Student Learning in German Higher Education; Zlatkin-Troitschanskaia, O., Pant, H., Toepper, M., Lautenbach, C., Eds.; Springer: Wiesbaden, Germany, 2020; pp. 261–280. [Google Scholar]
- Krell, M.; Redman, C.; Mathesius, S.; Krüger, D.; van Driel, J. Assessing pre-service science teachers’ scientific reasoning competencies. Res. Sci. Educ. 2018, 50, 2305–2329. [Google Scholar] [CrossRef]
- Krell, M.; Mathesius, S.; van Driel, J.; Vergara, C.; Krüger, D. Assessing scientific reasoning competencies of pre-service science teachers: Translating a German multiple-choice instrument into English and Spanish. Int. J. Sci. Educ. 2020, 42, 2819–2841. [Google Scholar] [CrossRef]
- Finch, W.H. Using Fit Statistic Differences to Determine the Optimal Number of Factors to Retain in an Exploratory Factor Analysis. Educ. Psychol. Meas. 2020, 80, 217–241. [Google Scholar] [CrossRef] [PubMed]
- Preacher, K.J.; Zhang, G.; Kim, C.; Mels, G. Choosing the optimal number of factors in exploratory factor analysis: A model selection perspective. Multivar. Behav. Res. 2013, 48, 28–56. [Google Scholar] [CrossRef] [PubMed]
- Ford, J.K.; MacCallum, R.C.; Tait, M. The application of exploratory factor analysis in applied psychology: A critical review and analysis. Pers. Psychol. 1986, 39, 291–314. [Google Scholar] [CrossRef]
- National Research Council (NRC). National Science Education Standards; National Academy Press: Washington, DC, USA, 1996. [Google Scholar]
- Rudolph, J.L. How We Teach Science: What’s Changed, and Why It Matters; Harvard University Press: Cambridge, MA, USA, 2019. [Google Scholar]
- Rost, M.; Knuuttila, T. Models as epistemic artifacts for scientific reasoning in science education research. Educ. Sci. 2022, 12, 276. [Google Scholar] [CrossRef]
- OECD. PISA 2015 Results (Volume II): Policies and Practices for Successful Schools; OECD Publishing: Paris, France, 2016. [Google Scholar] [CrossRef]
- Sonderen, E.V.; Sanderman, R.; Coyne, J.C. Ineffectiveness of reverse wording of questionnaire items: Let’s learn from cows in the rain. PLoS ONE 2013, 8, e68967. [Google Scholar] [CrossRef]
- Lindwall, M.; Barkoukis, V.; Grano, C.; Lucidi, F.; Raudsepp, L.; Liukkonen, J.; Thøgersen-Ntoumani, C. Method effects: The problem with negatively versus positively keyed items. J. Personal. Assess. 2012, 94, 196–204. [Google Scholar] [CrossRef]
- Crocker, L.M.; Algina, J. Item Analysis. In Introduction to Classical and Modern Test Theory; Crocker, L.M., Algina, J., Eds.; Wadsworth Group: Belmont, CA, USA, 1986. [Google Scholar]
- Hinkin, T.R. A brief tutorial on the development of measures for use in survey questionnaires. Organ. Res. Methods 1998, 1, 104–121. [Google Scholar] [CrossRef]
- Rummel, R.J. Applied Factor Analysis; Northwestern University Press: Evanston, IL, USA, 1988. [Google Scholar]
- Schwab, D.P. Construct validity in organizational behavior. In Research in Organizational Behavior; Staw, B.M., Cummings, L.L., Eds.; JAI: Greenwich, CT, USA, 1980; Volume 2, pp. 3–43. [Google Scholar]
- Park, S.; Oliver, J.S. Revisiting the conceptualisation of pedagogical content knowledge (PCK): PCK as a conceptual tool to understand teachers as professionals. Res. Sci. Educ. 2008, 38, 261–284. [Google Scholar] [CrossRef]
Figure 1.
Chen and Terada’s [7] comprehensive model.
Figure 1.
Chen and Terada’s [7] comprehensive model.

Figure 2.
Modification of Chen and Terada’s [7] comprehensive model with modeling at the core.
Figure 2.
Modification of Chen and Terada’s [7] comprehensive model with modeling at the core.

Figure 3.
Initial KMM-ST conceptual framework.

Figure 4.
Revised KMM-ST conceptual framework.

Figure 5.
CK example item from the 1st version of the survey.

Figure 6.
The 2nd version of the survey example item with identified item specifications.

Figure 7.
Horn’s parallel analysis for the 1st version of the KMM-ST survey showing the 95th percentile of eigenvalues from random data.
Figure 7.
Horn’s parallel analysis for the 1st version of the KMM-ST survey showing the 95th percentile of eigenvalues from random data.

Figure 8.
Empirical Kaiser’s criterion method of assessing factor retention for the 1st version of the KMM-ST survey where solid line represents eigenvalues for each factor and red circle indicates three factors.
Figure 8.
Empirical Kaiser’s criterion method of assessing factor retention for the 1st version of the KMM-ST survey where solid line represents eigenvalues for each factor and red circle indicates three factors.

Figure 9.
Six-factor model for the 1st version of the KMM-ST survey. Color indicates theoretically-assigned category.
Figure 9.
Six-factor model for the 1st version of the KMM-ST survey. Color indicates theoretically-assigned category.

Figure 10.
Seven-factor model for the 1st version of the KMM-ST survey.

Figure 11.
Revisions to NM_Pumpkin.

Figure 12.
Revisions to TM_Pumpkin answer options.

Figure 13.
Horn’s parallel analysis for the 2nd version of the KMM-ST survey showing the 95th percentile of eigenvalues from random data.
Figure 13.
Horn’s parallel analysis for the 2nd version of the KMM-ST survey showing the 95th percentile of eigenvalues from random data.

Figure 14.
Empirical Kaiser’s criterion method of assessing factor retention for the 2nd version of the KMM-ST survey where solid line represents eigenvalues for each factor and red circle indicates one factor.
Figure 14.
Empirical Kaiser’s criterion method of assessing factor retention for the 2nd version of the KMM-ST survey where solid line represents eigenvalues for each factor and red circle indicates one factor.

Figure 15.
One-factor model for the 2nd version of the KMM-ST survey.

Figure 16.
Five-factor model for the 2nd version of the KMM-ST survey.

Figure 17.
Four-factor model for the 2nd version of the (shortened) KMM-ST survey.


Table 1.
The framework for modeling competence as it is described in Upmeier zu Belzen et al. [34].
Table 1.
The framework for modeling competence as it is described in Upmeier zu Belzen et al. [34].
| Aspect | Level I | Level II | Level III |
|---|---|---|---|
| Nature of models | Replication of the original | Idealized representation of the original | Theoretical reconstruction of the original |
| Multiple models | Different model objects | Different foci on the original | Different hypotheses about the original |
| Purpose of models | Describing the original | Explaining the original | Predicting something about the original |
| Testing models | Testing the model object | Comparing the model and the original | Testing hypotheses about the original |
| Changing models | Correcting defects of the model object | Revising due to new insights | Revising due to the falsification of hypotheses about the original |
Note: a level zero, representing no knowledge of the component, was added when adopting this framework for constructing the 2nd version of the survey.
Table 2.
Descriptive statistics of the 1st version of the survey.
| Item | Mean | |||
|---|---|---|---|---|
| MP1 | 0.92 | Mean of MP Items | Mean of all CK Items | Total Mean Score |
| MP2 | 0.99 | 4.43 (of 5) | 10.21 (of 12) | 20.34 (of 24) |
| MP3 | 0.92 | |||
| MP4R | 0.70 | |||
| MP5 | 0.90 | |||
| MMK1R | 0.93 | Mean of MMK Items | ||
| MMK2R | 0.45 | 5.78 (of 7) | ||
| MMK3 | 0.97 | |||
| MMK4R | 0.89 | |||
| MMK5 | 0.76 | |||
| MMK6 | 0.85 | |||
| MMK7 | 0.93 | |||
| IN1 | 0.65 | Mean of IN Items | Mean of all PK Items | |
| IN2 | 0.93 | 4.35 (of 5) | 10.13 (of 12) | |
| IN3 | 0.97 | |||
| IN4R | 0.81 | |||
| IN5 | 0.99 | |||
| SM1 | 0.99 | Mean of SM Items | ||
| SM2 | 0.97 | 2.92 (of 3) | ||
| SM3 | 0.96 | |||
| EC1R | 0.47 | Mean of EC Items | ||
| EC2 | 0.96 | 2.86 (of 4) | ||
| EC3R | 0.44 | |||
| EC4 | 0.99 |
Note. Items recoded as “1” (correct) and “0” (incorrect). Items with “R” at end (e.g., MP4R) are reverse coded items.
Table 3.
Model fit statistics for various factor structures in the 1st version of the KMM-ST survey.
Table 3.
Model fit statistics for various factor structures in the 1st version of the KMM-ST survey.
| RMSEA | TLI | BIC | |
|---|---|---|---|
| Two-Factor Model | 0.09 | 0.52 | −649 |
| Three-Factor Model | 0.07 | 0.68 | −645 |
| Four-Factor Model | 0.06 | 0.76 | −606 |
| Five-Factor Model | 0.05 | 0.84 | −563 |
| Six-Factor Model | 0.04 | 0.90 | −513 |
| Seven-Factor Model | 0.01 | 0.99 | −470 |
Table 4.
Descriptive statistics of the 2nd version of the survey.
| Item Name | Mean (SD) | Endorsed Level 0 | Endorsed Level 1 | Endorsed Level 2 | Endorsed Level 3 |
|---|---|---|---|---|---|
| CM_Museum | 2.49 (0.84) | 7 (4.9%) | 12 (8.3%) | 29 (20.1%) | 96 (66.7%) |
| CM_Turtle | 2.09 (0.79) | 2 (1.3%) | 33 (23.0%) | 59 (41.0%) | 50 (34.7%) |
| CM_Language | 1.73 (0.96) | 7 (4.9%) | 69 (47.9%) | 24 (16.7%) | 44 (30.5%) |
| CM_Biomem | 1.88 (0.89) | 17 (11.8%) | 16 (11.1%) | 79 (54.9%) | 32 (22.2%) |
| CM_Pumpkin | 1.72 (0.91) | 1 (0.7%) | 82 (56.9%) | 18 (12.5%) | 43 (29.9%) |
| NM_Museum | 2.37 (0.79) | 0 (0.0%) | 28 (19.4%) | 35 (24.3%) | 81 (56.3%) |
| NM_Eating | 2.33 (0.72) | 2 (1.4%) | 15 (10.4%) | 60 (41.7%) | 67 (46.5%) |
| NM_Biomem | 2.63 (0.60) | 3 (2.1%) | 0 (0.0%) | 44 (30.6%) | 97 (67.4%) |
| NM_Pumpkin | 2.56 (0.62) | 1 (0.7%) | 7 (4.9%) | 46 (31.9%) | 90 (62.5%) |
| NM_Population | 2.45 (0.66) | 3 (2.1%) | 4 (2.7%) | 62 (43.1%) | 75 (52.1%) |
| MM_Museum | 2.42 (0.79) | 3 (2.1%) | 18 (12.5%) | 39 (27.1%) | 84 (58.3%) |
| MM_Turtle | 1.75 (0.71) | 1 (0.7%) | 56 (38.9%) | 65 (45.1%) | 22 (15.3%) |
| MM_Language | 2.17 (0.81) | 2 (1.4%) | 31 (21.5%) | 52 (36.1%) | 59 (41.0%) |
| MM_Eating | 2.38 (0.64) | 1 (0.7%) | 9 (6.3%) | 69 (47.9%) | 65 (45.1%) |
| MM_Climate | 2.50 (0.73) | 0 (0.0%) | 20 (13.9%) | 32 (22.2%) | 92 (63.9%) |
| PM_Turtle | 2.38 (0.70) | 2 (1.4%) | 12 (8.3%) | 60 (41.7%) | 70 (48.6%) |
| PM_Language | 2.65 (0.62) | 1 (0.7%) | 8 (5.6%) | 32 (22.2%) | 103 (71.5%) |
| PM_Eating | 2.56 (0.67) | 2 (1.4%) | 8 (5.6%) | 42 (29.1%) | 92 (63.9%) |
| PM_Climate | 2.01 (0.66) | 0 (0.0%) | 31 (21.5%) | 81 (56.3%) | 32 (22.2%) |
| PM_Population | 2.45 (0.87) | 6 (4.2%) | 18 (12.5%) | 25 (17.4%) | 95 (65.9%) |
| TM_Eating | 2.45 (0.76) | 1 (0.7%) | 21 (14.6%) | 34 (23.6%) | 88 (61.1%) |
| TM_Climate | 2.22 (0.66) | 2 (1.4%) | 13 (9.0%) | 81 (56.3%) | 48 (33.3%) |
| TM_Biomem | 2.19 (0.60) | 1 (0.7%) | 12 (8.3%) | 90 (62.5%) | 41 (28.5%) |
| TM_Pumpkin | 2.52 (0.74) | 2 (1.4%) | 15 (10.4%) | 33 (22.9%) | 94 (65.3%) |
| TM_Population | 2.83 (0.49) | 2 (1.4%) | 1 (0.7%) | 17 (11.8%) | 124 (86.1%) |
Table 5.
Model fit statistics for various factor structures in the 2nd version of the KMM-ST survey.
Table 5.
Model fit statistics for various factor structures in the 2nd version of the KMM-ST survey.
| RMSEA | TLI | BIC | |
|---|---|---|---|
| One-Factor Model | 0.03 | 0.83 | −1062 |
| Two-Factor Model | 0.02 | 0.90 | −981 |
| Three-Factor Model | 0.01 | 0.96 | −900 |
| Four-Factor Model | 0.00 | 1.06 | −826 |
| Five-Factor Model | 0.00 | 1.10 | −745 |
Table 6.
Final communalities, factor loadings, and reliability estimates for 11 KMM-ST items produced by a four-factor solution.
Table 6.
Final communalities, factor loadings, and reliability estimates for 11 KMM-ST items produced by a four-factor solution.
| Cronbach’s Alpha (α) | Item | Factor 1 | Factor 2 | Factor 3 | Factor 4 | Communality |
|---|---|---|---|---|---|---|
| Factor 1 | TM_Population | 0.68 | 0.47 | |||
| α = 0.63 | TM_Eating | 0.65 | 0.47 | |||
| TM_Biomem | 0.63 | 0.62 | ||||
| NM_Eating | 0.62 | 0.59 | ||||
| NM_Population | 0.53 | 0.41 | ||||
| Factor 2 | MM_Language | 0.72 | 0.54 | |||
| α = 0.35 | MM_Eating | 0.70 | 0.52 | |||
| Factor 3 | CM_Pumpkin | 0.81 | 0.68 | |||
| α = 0.43 | CM_Biomem | 0.74 | 0.57 | |||
| Factor 4 | PM_Climate | 0.77 | 0.69 | |||
| α = 0.27 | PM_Population | 0.68 | 0.57 |
Disclaimer/Publisher’s Note: The statements, opinions and data contained in all publications are solely those of the individual author(s) and contributor(s) and not of MDPI and/or the editor(s). MDPI and/or the editor(s) disclaim responsibility for any injury to people or property resulting from any ideas, methods, instructions or products referred to in the content. |
© 2023 by the authors. Licensee MDPI, Basel, Switzerland. This article is an open access article distributed under the terms and conditions of the Creative Commons Attribution (CC BY) license (https://creativecommons.org/licenses/by/4.0/).
Share and Cite
MDPI and ACS Style
Carroll, G.; Park, S. Comparing the Use of Two Different Approaches to Assess Teachers’ Knowledge of Models and Modeling in Science Teaching. Educ. Sci. 2023, 13, 405. https://doi.org/10.3390/educsci13040405
AMA Style
Carroll G, Park S. Comparing the Use of Two Different Approaches to Assess Teachers’ Knowledge of Models and Modeling in Science Teaching. Education Sciences. 2023; 13(4):405. https://doi.org/10.3390/educsci13040405
Chicago/Turabian StyleCarroll, Grace, and Soonhye Park. 2023. "Comparing the Use of Two Different Approaches to Assess Teachers’ Knowledge of Models and Modeling in Science Teaching" Education Sciences 13, no. 4: 405. https://doi.org/10.3390/educsci13040405
Note that from the first issue of 2016, this journal uses article numbers instead of page numbers. See further details here.