
A Monitoring System for Carbon Dioxide and Humidity in Honeybee Hives †

School of Science and Technology, Nottingham Trent University, Clifton Lane, Nottingham NG11 8NS, UK
*
Authors to whom correspondence should be addressed.
†
Presented at the 9th International Electronic Conference on Sensors and Applications, 1–15 November 2022; Available online: https://ecsa-9.sciforum.net/ .
Eng. Proc. 2022, 27(1), 89; https://doi.org/10.3390/ecsa-9-13171
Published: 1 November 2022
(This article belongs to the Proceedings of The 9th International Electronic Conference on Sensors and Applications)
Abstract
:Two of the most relevant gasses correlating to honeybee colony health are likely carbon dioxide and humidity. Non-Dispersive Infra-Red (NDIR) detectors have become the dominant method for measuring atmospheric CO2. In this work, we describe a microcontroller-based system used to collect data from two models of these NDIR sensors that also provide humidity and temperature data. Placement in a frame in the brood box and in the crown board and queen excluder is investigated. With several thousands of hours of data for comparison, we demonstrate both the daily and long-term trends in these important gasses in multiple honeybee colonies.
1. Introduction
Carbon dioxide has long been known as a narcotic for the honeybee and has been used to immobilize them during scientific manipulation or transfer [1]. Higher levels of exposure cause permanent damage or result in death, and it is believed that high CO2 concentrations in the hive initiate fanning behavior [2]. For calibrated CO2 measurement, the nondispersive infrared (NDIR) sensor is the closest sensor to meeting the requirements for hive installation. The basic principle is that an infrared (IR) source, closely matched to the absorption frequency of CO2, shines down a sample tube containing air. The nondispersive terminology comes from there being no grating or prism to select the frequency of light rather, at the end is a filter to remove other frequencies followed by an IR detector. The difference between the amount of light radiated by the IR source and the amount of IR detected is directly proportional to the number of CO2 molecules in the air sample in the tube. Suitable models include the Sensirion SCD30 [3], which also includes temperature and humidity, the Teledyne T6713 [4], and the Sensair sunrise [5]. A lower-cost alternative is the Wisen MH-Z19B [6], but this does not include an i2c interface. Most recently, the Sensirion SCD41, using the photoacoustic NDIR sensing principle, delivers a much smaller footprint sensor [7]. These devices are also not instant ‘plug and play’ for calibrated measurements as, on first use, access to ‘outdoor’ concentrations is often required as burn-in to give accurate readings. However, once running, these devices do give actual CO2 gas concentration in parts per million within their specified error margin, typically 30 ppm + 3%.
Water vapor is water in its gaseous state, and water vapor in the air is called humidity. More often reported as relative humidity, this is the ratio of the partial pressure of water vapor to the equilibrium vapor pressure of water at a given temperature. Temperature and humidity are two of the most important factors affecting the health and survival of honeybee colonies. Humidity is known to play a vital role in the development of the brood. Investigations into the effect of humidity were initially made possible by controlled laboratory incubators, with more recent data being collected from hives in the field with smaller embedded sensors [8,9,10,11,12]. The measurement of humidity is readily available in low-cost small capacitive sensors that provide a relevant level of accuracy and in analog or digital formats. Digital devices usually include temperature measurements in the same package and reduce measurement errors by undertaking the analog to digital conversion on the sensor chip rather than introducing possible noise in the measurements.
In this article, we investigate the use of the Sensirion SCD30, and later the SCD41 for application in honeybee hives as these provide a specified CO2 measurement range of up to 40,000 ppm, with a specified accuracy of up to 5000 ppm, in addition to providing humidity and temperature data.
2. Materials and Methods
The data logging system chosen was the Teensy 3.5 microcontroller (PJRC, Sherwood, OR, USA) which provided a real-time clock and microSD card reader on board. The gas sensors were connected via the i2c bus to the Teensy 3.5, and a switch on one digital pin allowed the measurement to stop whilst the microSD memory card was safely replaced. Data consisting of EPOCH time, CO2, temperature, and humidity were saved with around three measurements per minute to approximately one file per day on the uSD card. Based on the SDC30 (Sensirion AG, Stäfa, Switzerland) gas sensor, an initial system was installed on a frame of an observation hive using a British National hive brood box at the NTU campus in Nottingham and comprised of an additional SCD30 to the top of the hive (above the crown board). When they became available, a new SCD41 sensor (Sensirion AG, Stäfa, Switzerland) was installed alongside the top SCD30. A separate system was also installed on a different colony on the NTU campus with the SCD41 sited in the queen excluder. These three positions allowed an investigation into the most appropriate positioning of sensors to be carried out, especially due to the challenges of the propolis coating of the sensors.
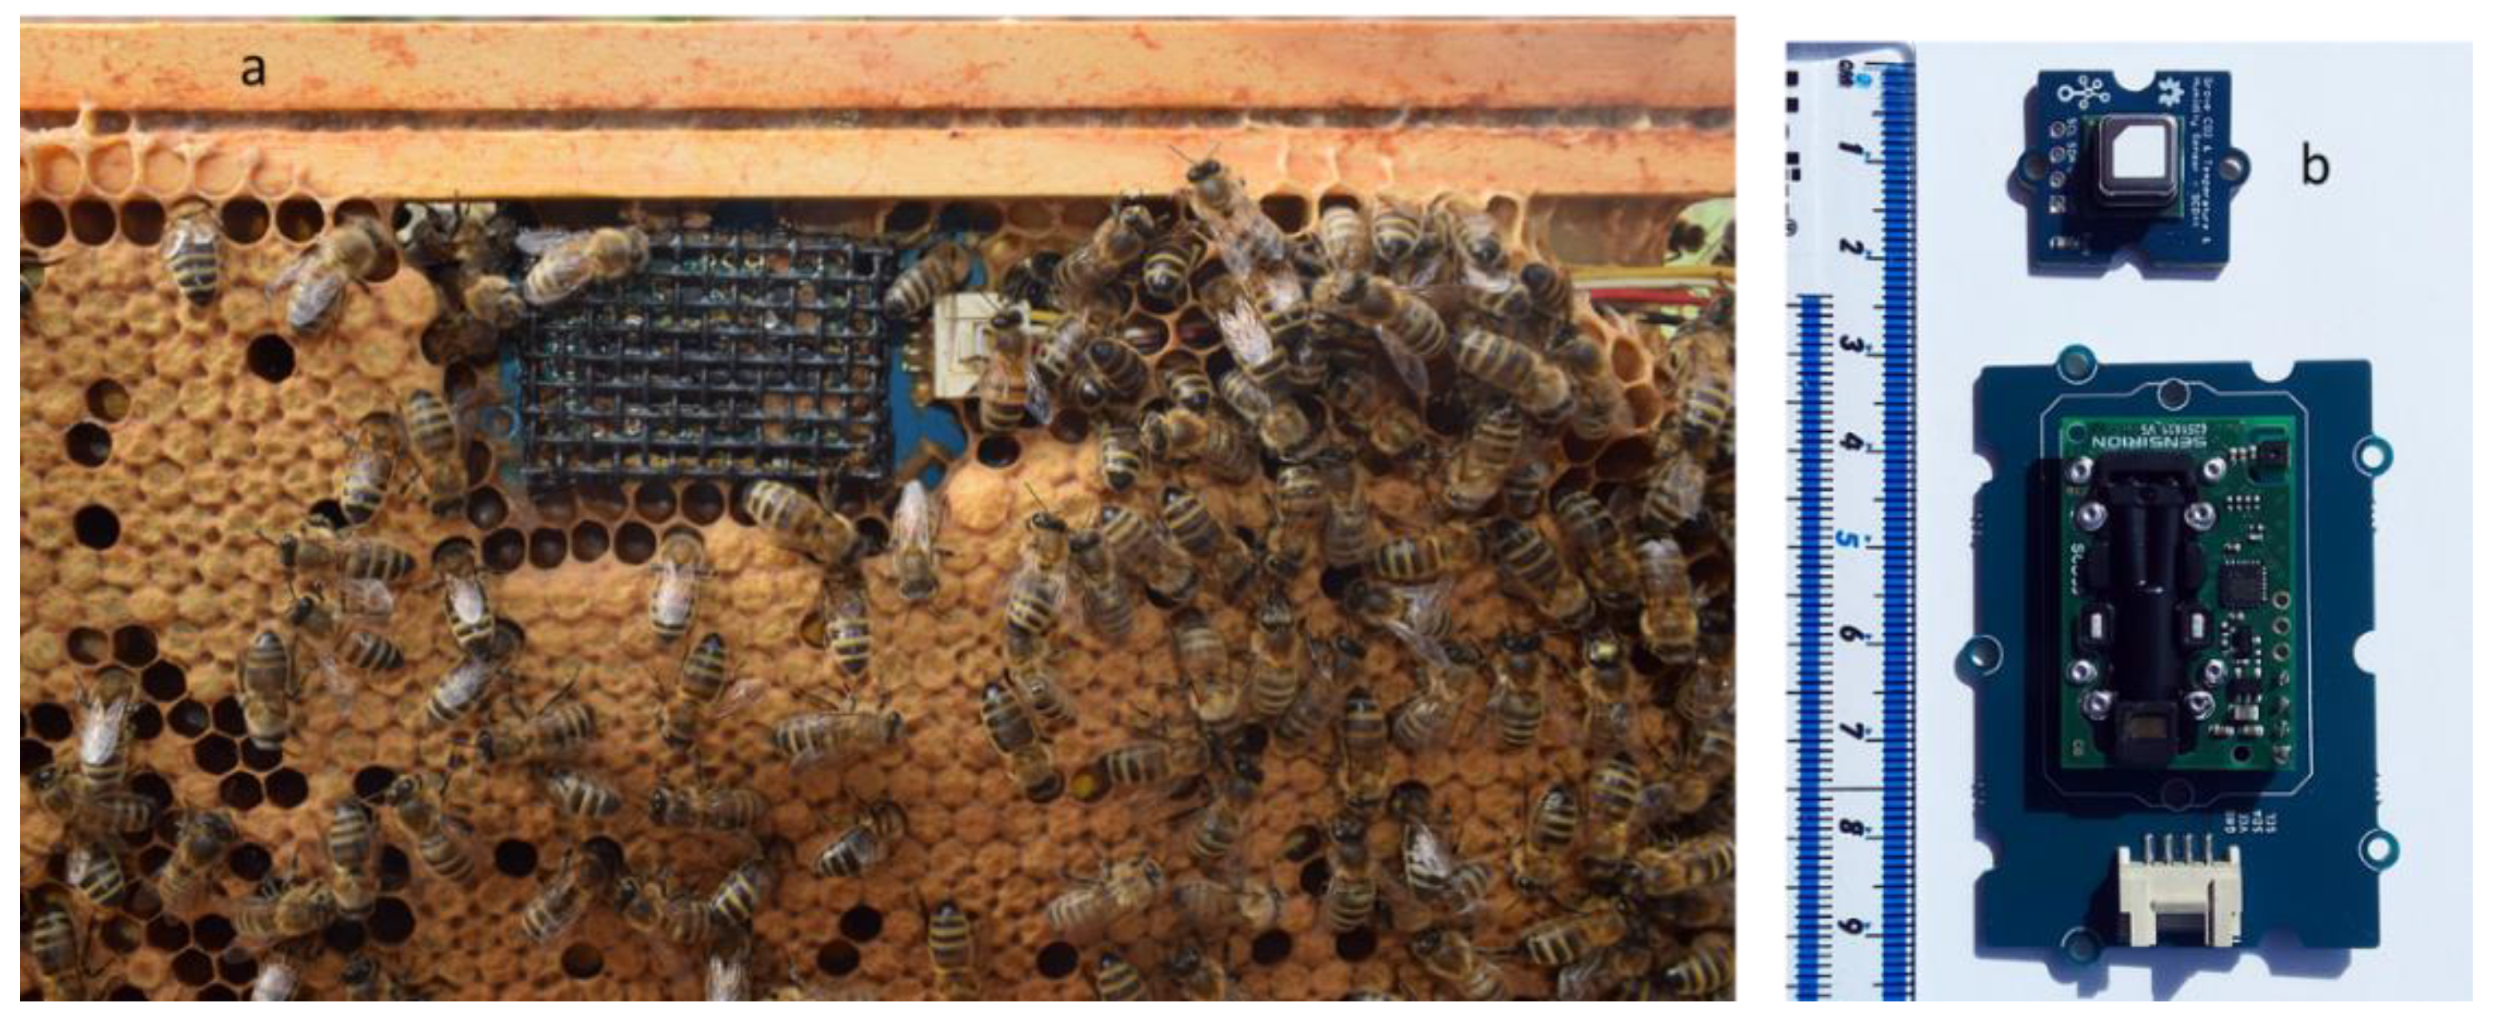
Figure 1a shows the SDC30 installed in a fully populated frame with a protective wire mesh cage covering it. Over time, the bees fill the holes in the mesh with propolis and/or wax, which need to be cleared as part of the regular beekeeping. Figure 1b shows the SDC30 (lower) and SCD41 (upper) with a cm rule to provide a scale. Both types of sensors have been delivering hundreds of hours of data.
3. Results
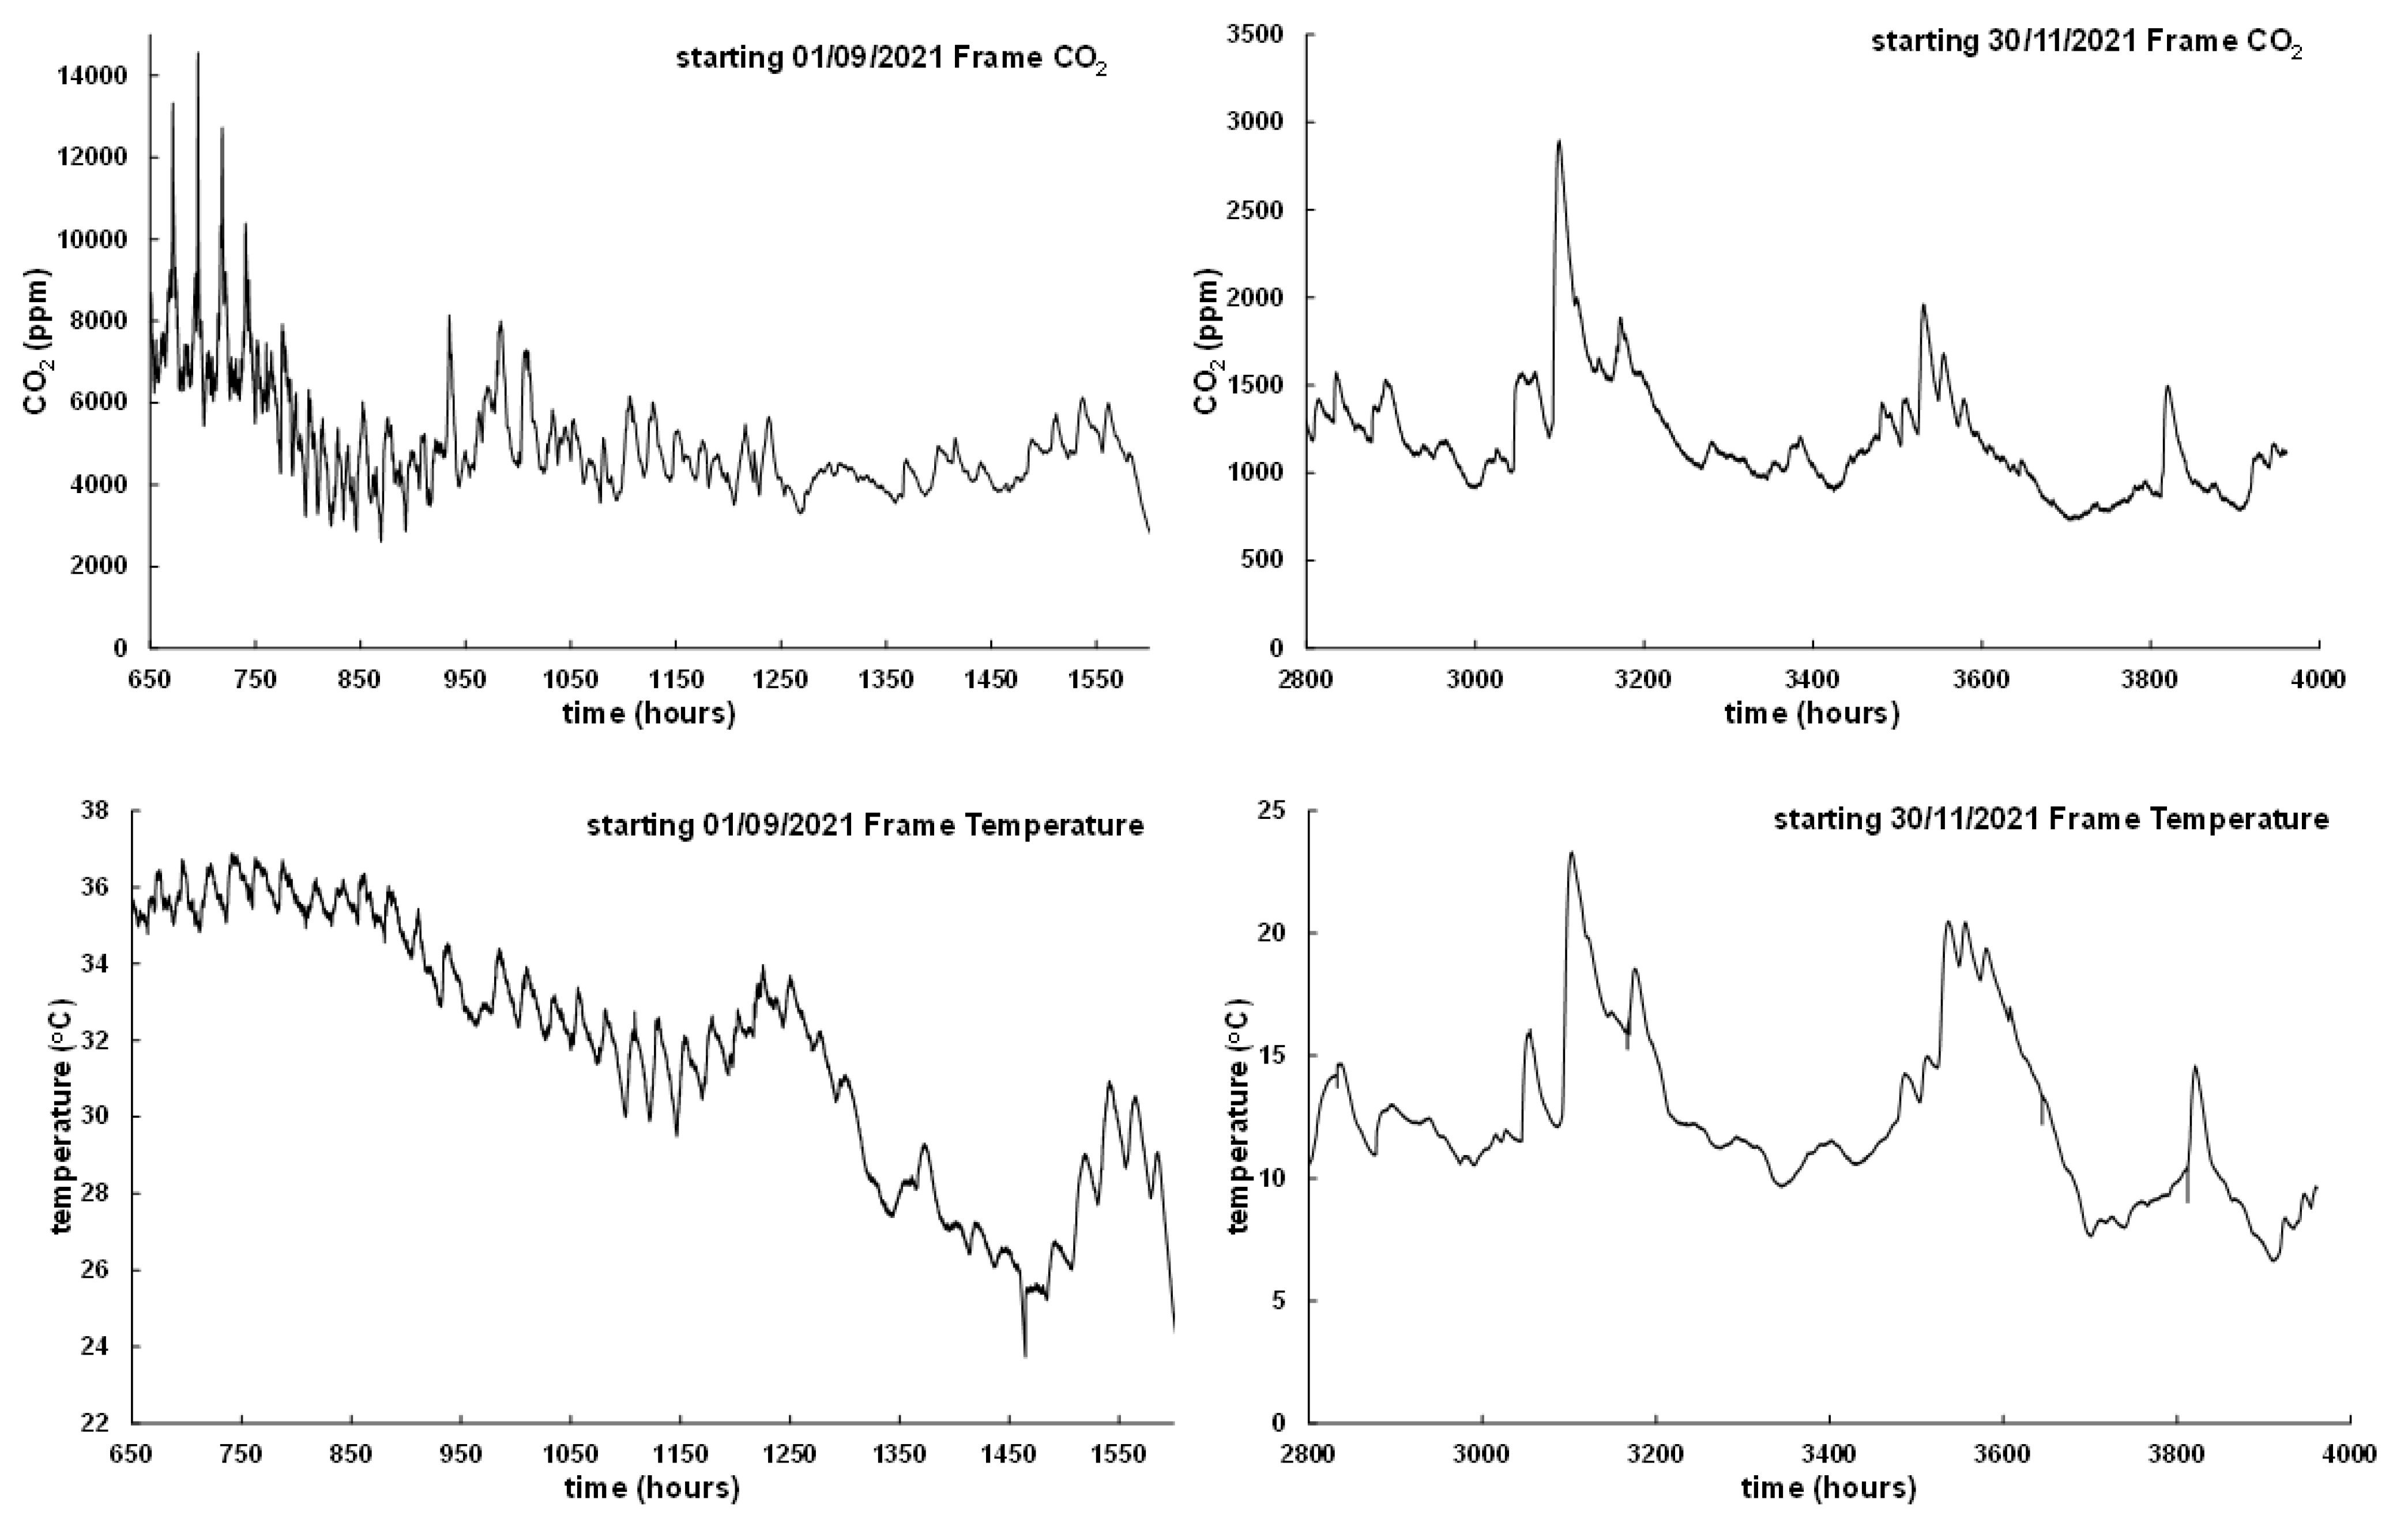
Figure 2 shows data from the SCD30 installed in a frame of the NTU observation hive. The top left graph is CO2 from September 2021, when the colony was active on the frame. This is demonstrated by the corresponding temperature data shown in the graph below, initially around 36 °C. Sharp peaks on the early CO2 data show the need for the high temporal resolution that we are using.
The top right graph is CO2 from the end of November 2021, when the colony was no longer active on the frame, shown by the temperature graph below exhibiting typical ambient temperatures. The hive CO2 level is still significantly elevated compared to outside ‘fresh air’, which is typically only 450 ppm.
4. Discussion
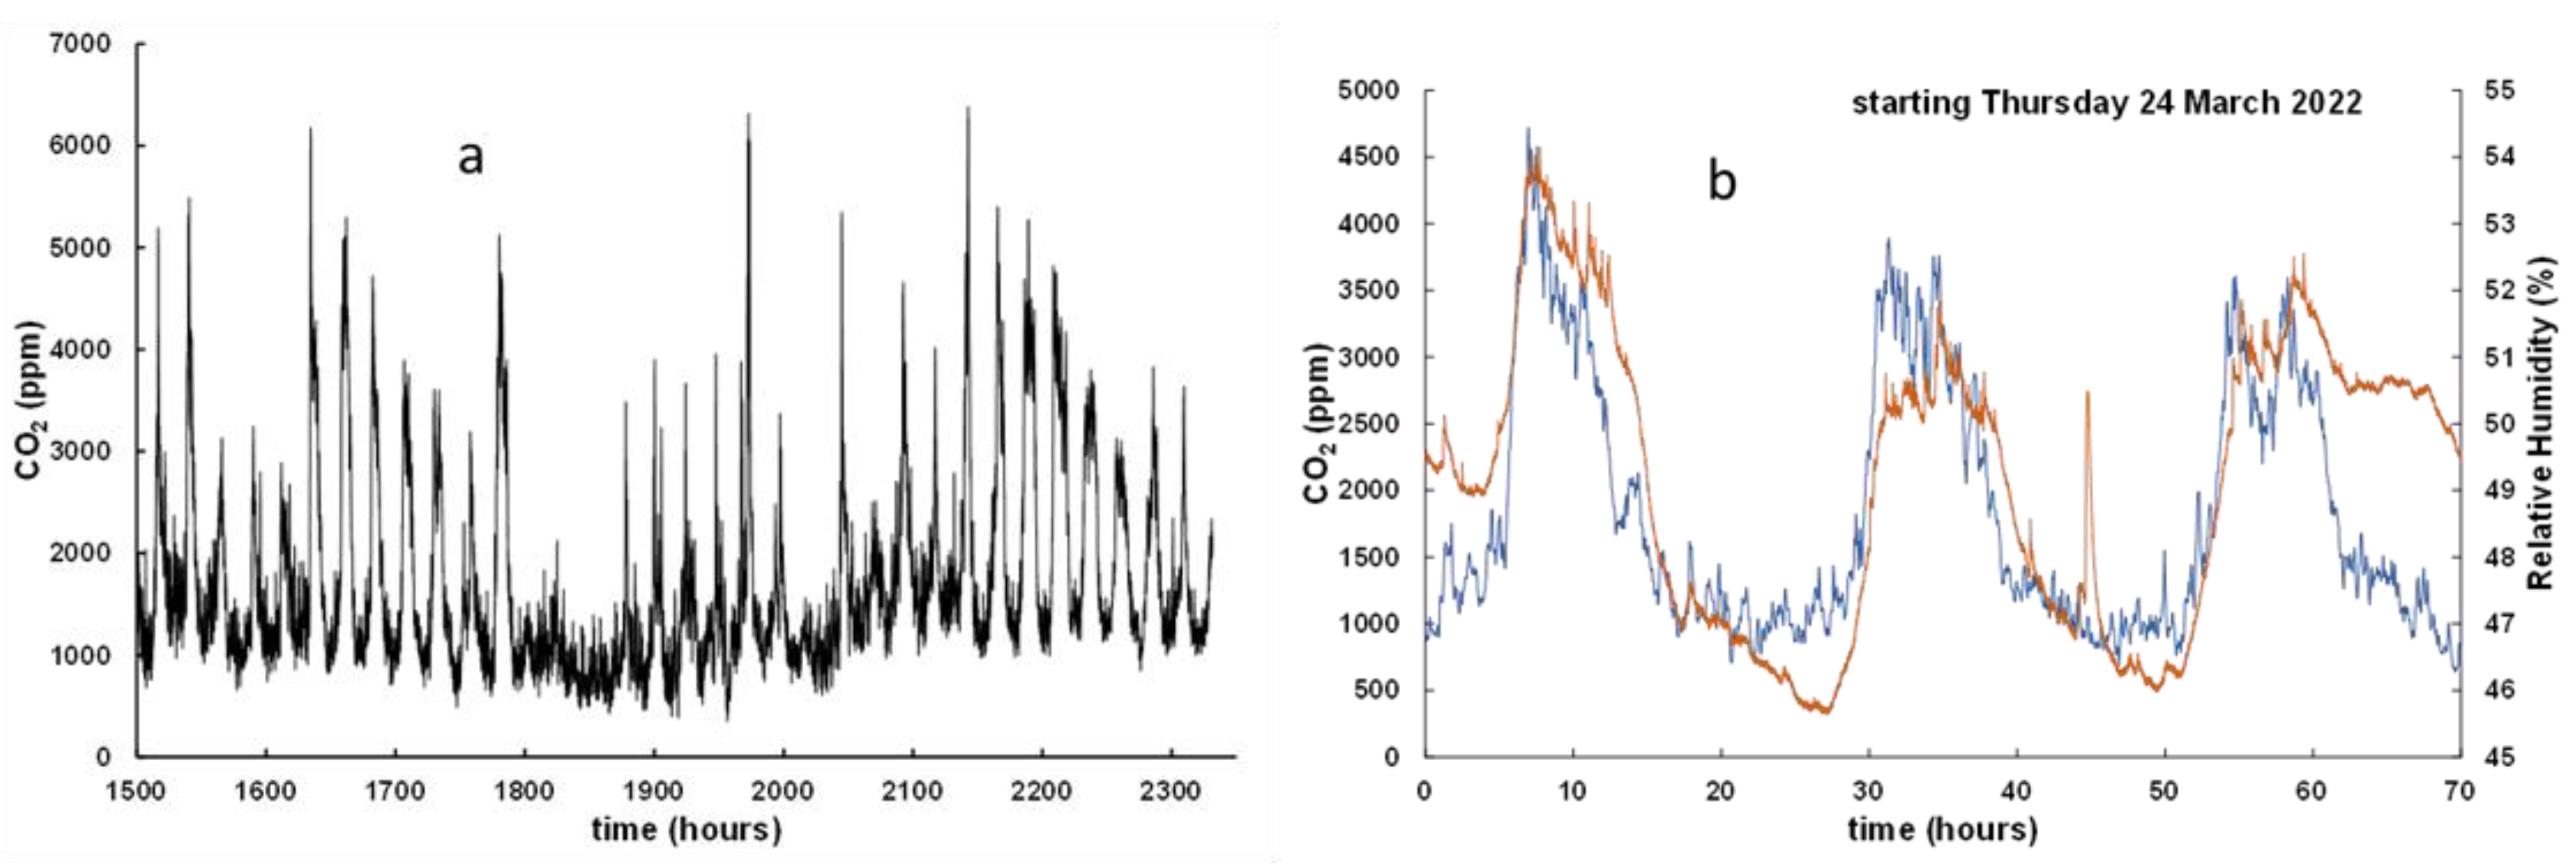
All positions of the SCD sensors provided high temporal resolution data showing both daily and longer-term trends in both CO2 and humidity (Figure 3). Two distinctive features can be seen in all the data. Firstly, there is a significant daily variation in CO2; secondly, the peak levels in the hive are ten times that conducive to human health. Even at the lowest values of CO2, the data was far in excess of the values that would be conducive to human health, where humans would expect general drowsiness between 1000–2500 ppm and adverse health effects may be expected from 2500–5000 ppm. In the frame, the maximum of 14,000 ppm is probably most reflective of the true levels of CO2 that the workers experience on a brood frame. This maximum is within the range that Seeley [2] reported but much lower than the values required to cause anesthesia [1]. The paper by Cecchi et al. [13] used a Telaire TL6615 (Amphenol Thermometrics Inc., St. Marys, PA USA) NDIR sensor installed directly in the brood box’s wood panel positioned in the back side’s lower part. Their data demonstrated a maximum of 3500 ppm, suggesting that they were collecting data similar to our crown board sensor but much lower than the data from the frame sensor.
Author Contributions
Conceptualization, M.I.N. and M.B.; investigation, M.I.N., C.T., A.M. and M.B. All authors have read and agreed to the published version of the manuscript.
Funding
This project receives funding from the European Union’s Horizon 2020 research and innovation program as part of the Giving Beekeeping Guidance by cOmputatiOnal-assisted Decision making (B-GOOD) consortium under grant agreement No 817622.
Institutional Review Board Statement
Not applicable.
Informed Consent Statement
Not applicable.
Data Availability Statement
The data presented in this study are openly available in FigShare at https://doi.org/10.6084/m9.figshare.20004278 (created 6 June 2022).
Acknowledgments
The authors acknowledge the owners of Holme Pierrepont Hall Nottingham UK for hosting the UK B-GOOD apiary.
Conflicts of Interest
The authors declare no conflict of interest.
References
- Czekońska, K. The Effect of Different Concentrations of Carbon Dioxide (CO2) in a Mixture with Air or Nitrogen Upon the Survival of the Honey Bee (Apis mellifera). J. Apic. Res. 2009, 48, 67–71. [Google Scholar] [CrossRef]
- Seeley, T.D. Atmospheric Carbon Dioxide Regulation in Honey-Bee (Apis mellifera) colonies. J. Insect Physiol. 1974, 20, 2301–2305. [Google Scholar] [CrossRef] [PubMed]
- Sensirion SCD30. Available online: https://www.sensirion.com/en/environmental-sensors/carbon-dioxide-sensors/carbon-dioxide-sensors-co2/ (accessed on 12 May 2022).
- Teledyne T6713 Datasheet. Available online: https://www.amphenol-sensors.com/en/telaire/co2/525-co2-sensor-modules/3399-t6713 (accessed on 12 May 2022).
- Sensair Sunrise. Available online: https://senseair.com/products/power-counts/sunrise/ (accessed on 12 May 2022).
- Wisen MH-Z19C. Available online: https://www.winsen-sensor.com/sensors/co2-sensor/mh-z19c.html (accessed on 12 May 2022).
- Sensirion SCD4x. Available online: https://sensirion.com/products/catalog/SCD41/ (accessed on 12 May 2022).
- Kraus, B.; Velthuis, H.H.W. High Humidity in the Honey Bee (Apis mellifera L.) Brood Nest Limits Reproduction of the Parasitic mite Varroa Jacobsoni Oud. Naturwissenschaften 1997, 84, 217–218. [Google Scholar] [CrossRef] [Green Version]
- Human, H.; Nicolson, S.W.; Dietemann, V. Do Honeybees, Apis mellifera Scutellata, Regulate Humidity in Their Nest? Naturwissenschaften 2006, 93, 397–401. [Google Scholar] [CrossRef]
- Abou-Shaara, H.F.; Owayss, A.A.; Ibrahim, Y.Y.; Basuny, N.K. A review of impacts of temperature and relative humidity on various activities of honey bees. Insect. Soc. 2017, 64, 455–463. [Google Scholar] [CrossRef]
- LiI, X.; Ma, W.; Shen, J.; Long, D.; Feng, Y.; Su, W.; Xu, K.; Du, Y.; Jiang, Y. Tolerance and response of two honeybee species Apis cerana and Apis mellifera to high temperature and relative humidity. PLoS ONE 2019, 14, e0217921. [Google Scholar] [CrossRef] [Green Version]
- Ellis, M.B. Homeostasis: Humidity and Water Relations in Honeybee Colonies (Apis mellifera). Magister Scientiae University of Pretoria 2008. Available online: https://repository.up.ac.za/bitstream/handle/2263/28357/dissertation.pdf (accessed on 12 May 2022).
- Cecchi, S.; Spinsante, S.; Terenzi, A.; Orcioni, S. A Smart Sensor-Based Measurement System for Advanced Bee Hive Monitoring. Sensors 2020, 20, 2726. [Google Scholar] [CrossRef] [PubMed]
Figure 1.
(a) SCD30 installed in brood box frame showing propolis coating on the protective mesh. (b) SCD30 (lower) and SCD41 (upper) sensors with a rule to show the relative sizes of the two devices.
Figure 1.
(a) SCD30 installed in brood box frame showing propolis coating on the protective mesh. (b) SCD30 (lower) and SCD41 (upper) sensors with a rule to show the relative sizes of the two devices.

Figure 2.
The top left panel shows the CO2 in a brood frame over a thirty-seven-day period starting at the beginning of September 2021, with the panel below showing the corresponding temperature. The top right panel shows the CO2 for the same frame starting at the end of November with the corresponding temperature below.

Figure 3.
(a) CO2 measured using an SCD41 in the crown board of the observation hive over a thirty-seven-day period starting in March 2022 exhibiting a clear daily variation; (b) CO2 (blue line) and corresponding relative humidity (orange line) over a three-day period showing them following similar daily change.

Disclaimer/Publisher’s Note: The statements, opinions and data contained in all publications are solely those of the individual author(s) and contributor(s) and not of MDPI and/or the editor(s). MDPI and/or the editor(s) disclaim responsibility for any injury to people or property resulting from any ideas, methods, instructions or products referred to in the content. |
© 2022 by the authors. Licensee MDPI, Basel, Switzerland. This article is an open access article distributed under the terms and conditions of the Creative Commons Attribution (CC BY) license (https://creativecommons.org/licenses/by/4.0/).
Share and Cite
MDPI and ACS Style
Newton, M.I.; McVeigh, A.; Tsakonas, C.; Bencsik, M. A Monitoring System for Carbon Dioxide and Humidity in Honeybee Hives. Eng. Proc. 2022, 27, 89. https://doi.org/10.3390/ecsa-9-13171
AMA Style
Newton MI, McVeigh A, Tsakonas C, Bencsik M. A Monitoring System for Carbon Dioxide and Humidity in Honeybee Hives. Engineering Proceedings. 2022; 27(1):89. https://doi.org/10.3390/ecsa-9-13171
Chicago/Turabian StyleNewton, Michael I., Adam McVeigh, Costas Tsakonas, and Martin Bencsik. 2022. "A Monitoring System for Carbon Dioxide and Humidity in Honeybee Hives" Engineering Proceedings 27, no. 1: 89. https://doi.org/10.3390/ecsa-9-13171