Proceeding Paper

Acoustic Characterization of Impulsive Underwater Noise Present in Port Facilities: Practical Case in the Port of Cartagena †

by
Ivan Felis Enguix
1,*,
Marta Sánchez Egea
1,
Antonio Guerrero González
2 and
David Arenas
1
1
Marine Technology Center (CTN), Fuente Álamo, 30320 Murcia, Spain
2
Department of Automation and Systems Engineering, Technical University of Cartagena (UPCT), Cartagena, 30202 Murcia, Spain
*
Author to whom correspondence should be addressed.
Presented at the 5th International Electronic Conference on Sensors and Applications, 15–30 November 2018; Available online: https://ecsa-5.sciforum.net.
Proceedings 2019, 4(1), 57; https://doi.org/10.3390/ecsa-5-05755
Published: 14 November 2018
(This article belongs to the Proceedings of 5th International Electronic Conference on Sensors and Applications)

Abstract

:
The data recording of underwater noise is a key aspect for the prevention and improvement of management systems of maritime spaces. Thus, due to the presence of activities potentially generating impulsive noise, ports deserve special attention. This article describes and shows the results of the spatial monitoring of both the basal noise and impulsive noise sources present in port facilities. A vessel was equipped with a smart digital hydrophone with a working frequency range between 10 and 200 kHz and an RVR (Received Voltage Response) of, approximately, −170 dB @ 1 V/µPa. Coupling the acoustic data together with the GPS coordinates of the vessel, a GIS map with spatiotemporal distribution of the basal sound pressure levels was made, identifying the sources of impulsive noise of interest and its temporal characteristics. This is a preliminary step for the development of future studies on underwater noise pollution and its potential impact on biodiversity in the environment of port facilities, with the maximum guarantees possible.

1. Introduction

One of the main sources of underwater noise is shipping traffic, with the highest levels of ambient noise concentrated in ports due to the continuous traffic of vessels. However, ports can also be the source of impulsive noise due to the presence of potentially impulsive noise generating activities, such as pumping systems, refrigeration, works in ports, and container loads, etc.
The objective of this work is to perform an acoustic characterization of impulsive underwater noises that may be present in the Port of Cartagena. This characterization will be carried out in accordance with the methodological criteria for the implementation of the Marine Strategies [1]. Therefore, the characterization of underwater noise proposed in the Port of Cartagena includes:
  • Quantification of background levels and continuous noise;
  • Location and identification of impulsive noise emission sources;
  • Quantification of impulse impulsive noise levels; and
  • Propagation of the values obtained beyond the domain of the Port of Cartagena.
To do this, as shown below, a series of underwater acoustic measurements of the bay are made.

2. Materials and Methods

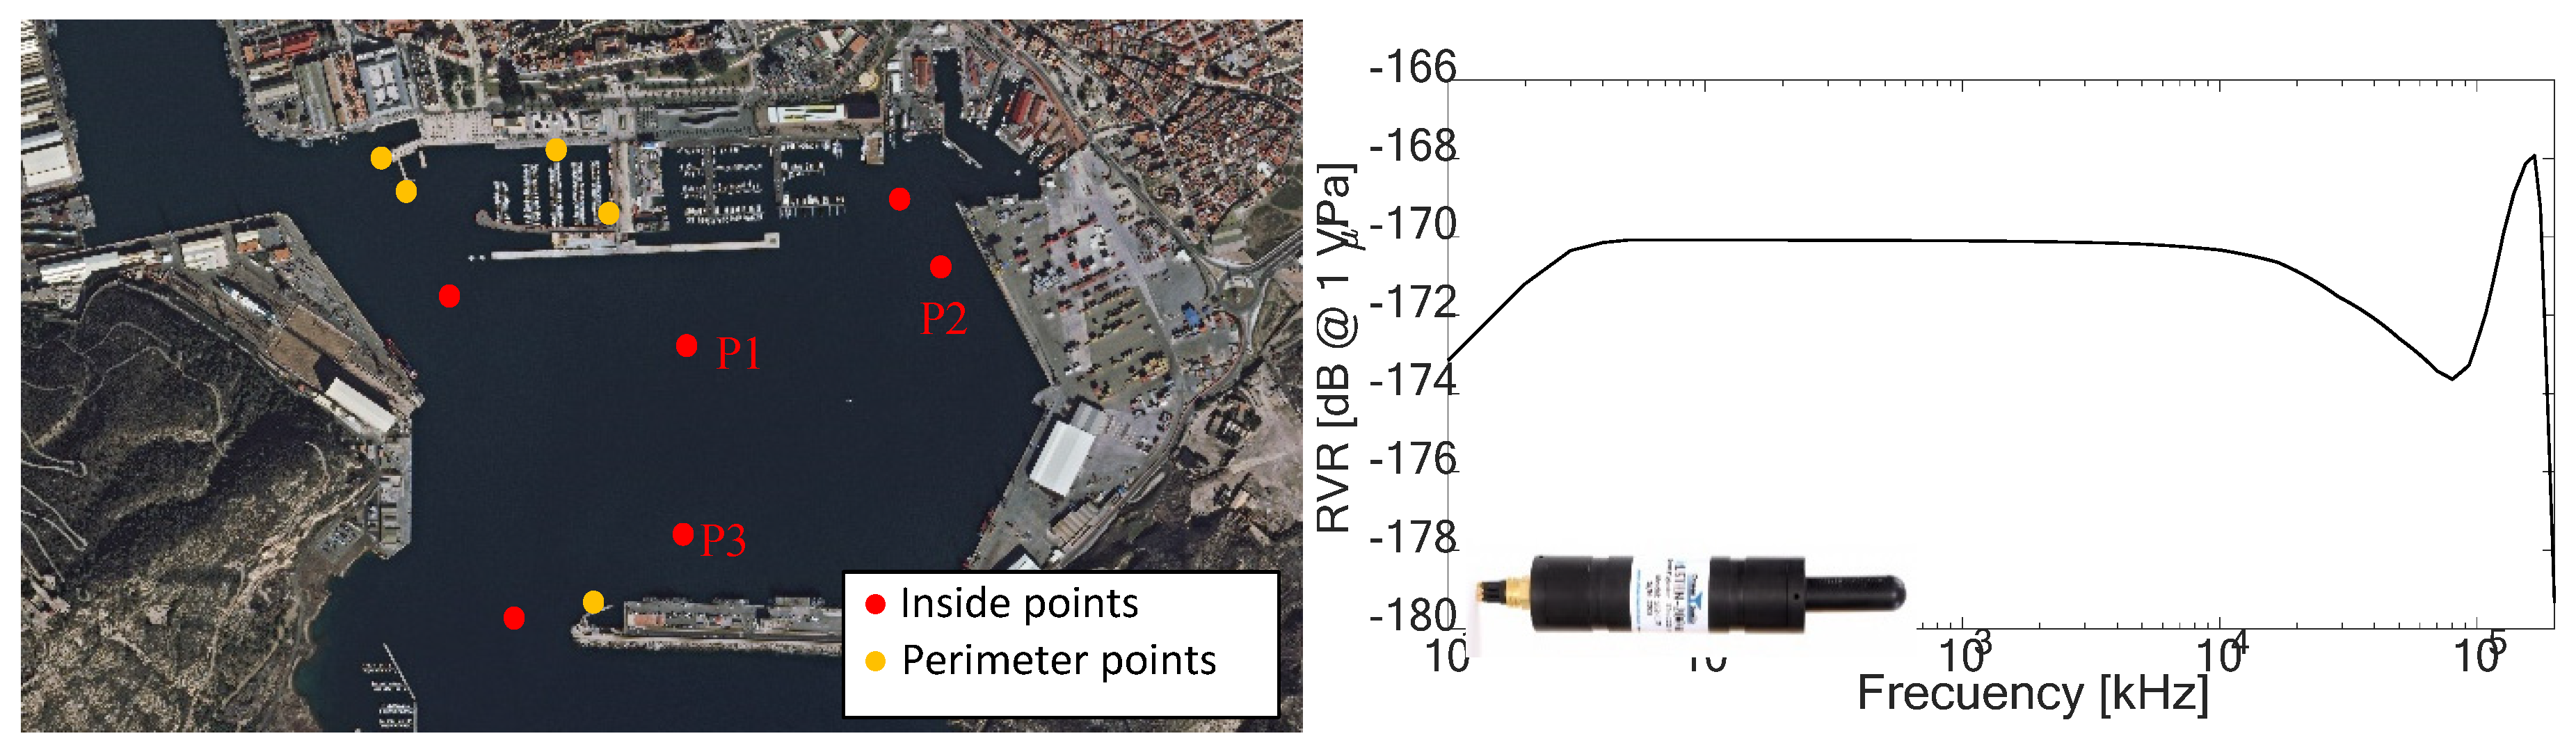
2.1. Materials and Methods

For the monitoring of submarine noise in the Port of Cartagena, two types of measures were carried out:
  • Measurements at different points of the perimeter of the Port of Cartagena, made by arranging the hydrophone by hand from the edge; and
  • Measurements at different points of the water area that enclosed the Port of Cartagena, as well as in the access zone outside the infrastructure of the Port of Cartagena. To do this, the hydrophone was sunk from a vessel.
The following Figure 1 shows, on the left, the location of all the measurements made in which GPS position was also recorded for the subsequent spatial processing of the noise data.
All measurements were made with an IcListen HF smart hydrophone with a bandwidth between 10 Hz and 200 kHz, and a sensitivity of approximately −169 dB @ 1 V/μPa. These measurements indicate that this is the industry’s most sensitive digital broadband hydrophone. Figure 1 left shows its bandwidth RVR sensibility.
In both configurations, the hydrophone was submerged 3 m from the water surface and a series of 3 min measurements were made, with a sampling frequency of 192 kS/s and 24 bits of resolution. During these measurements, the acoustic events were clasified in accordance with:
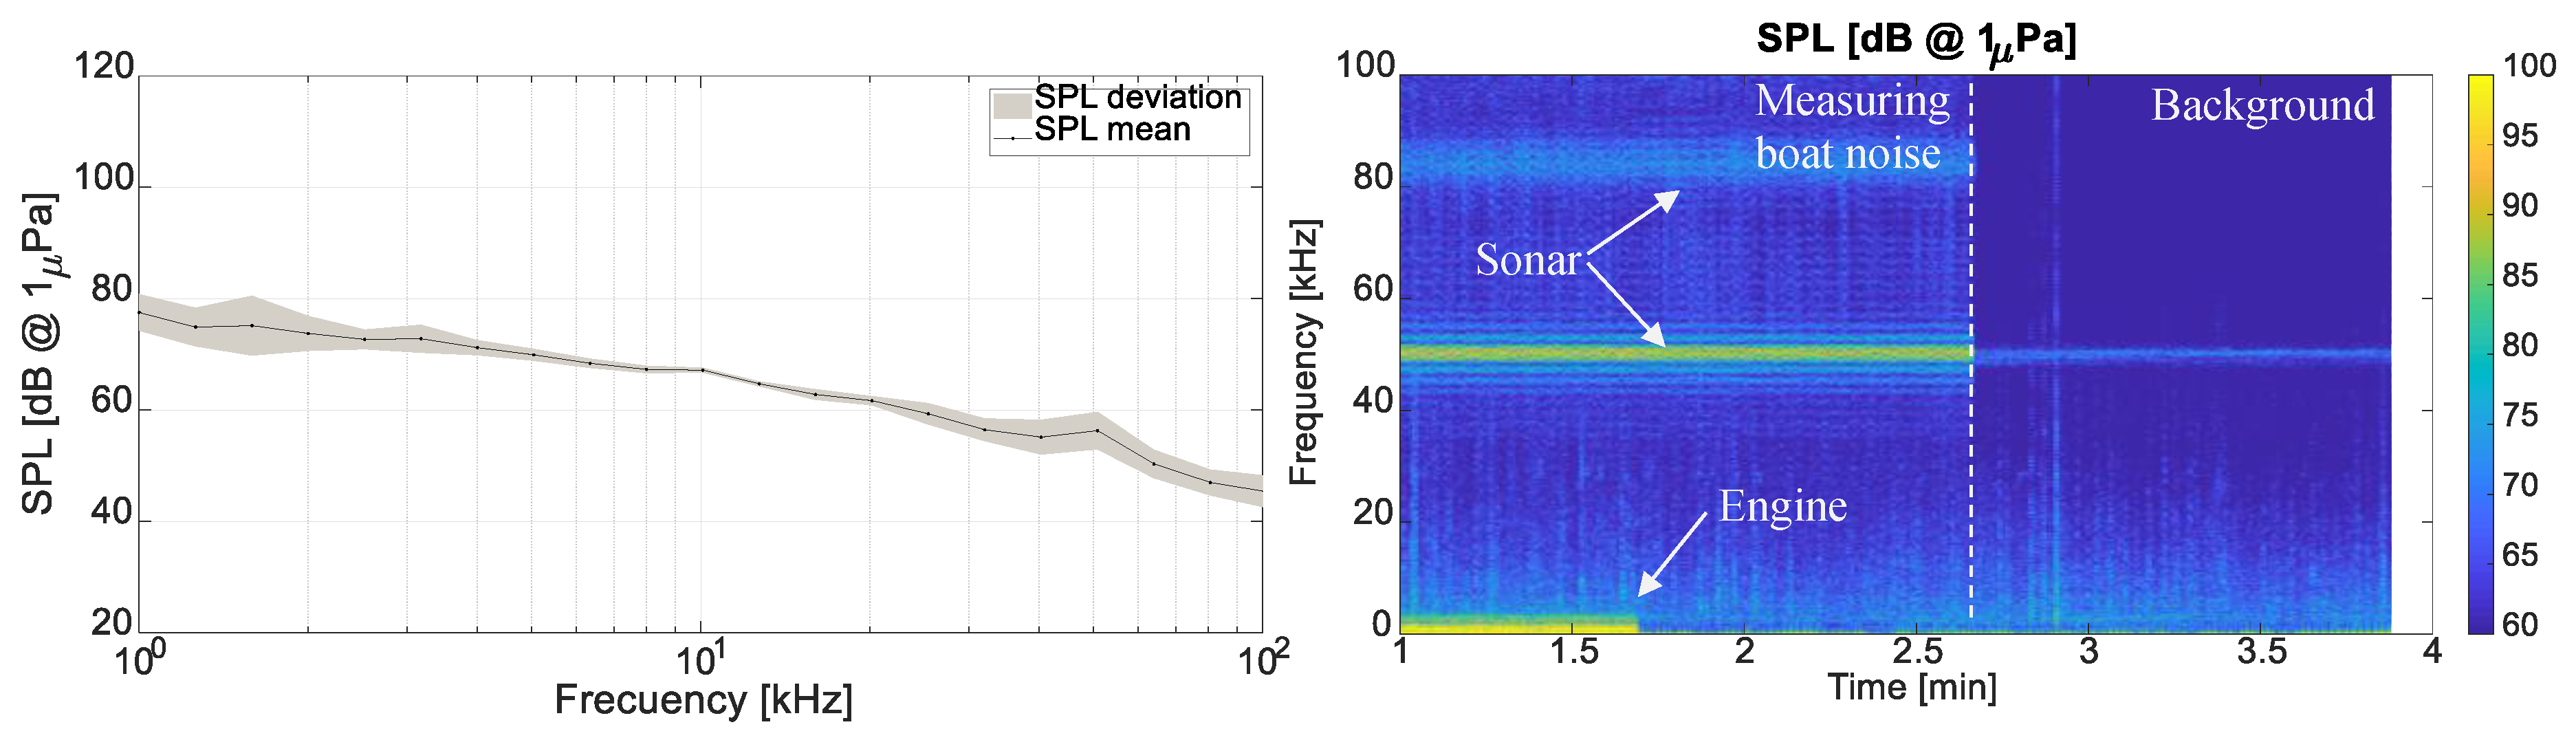
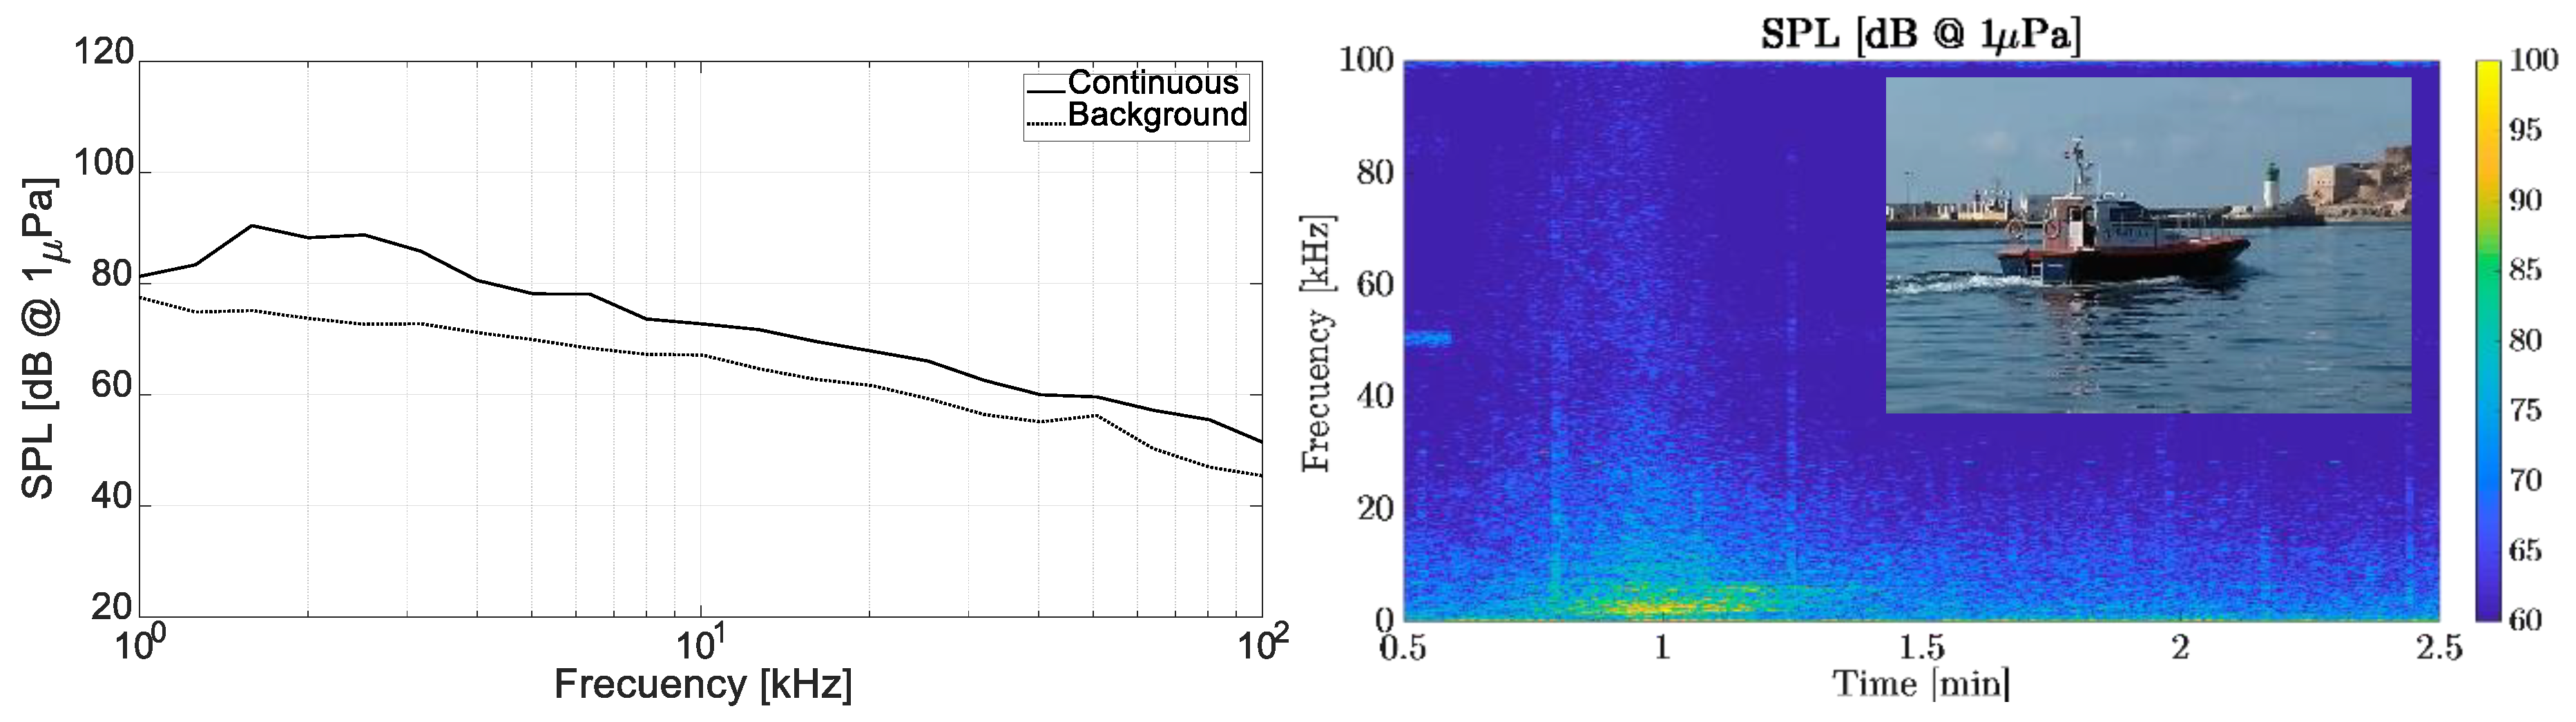
  • Continuous noise: different types of boats that crossed near the measurement points, that subsequently contrasted the background measurements with respect to the sound emitted by them. These measurements assisted us to characterize these sources of continuous noise whose levels were above background noise; and
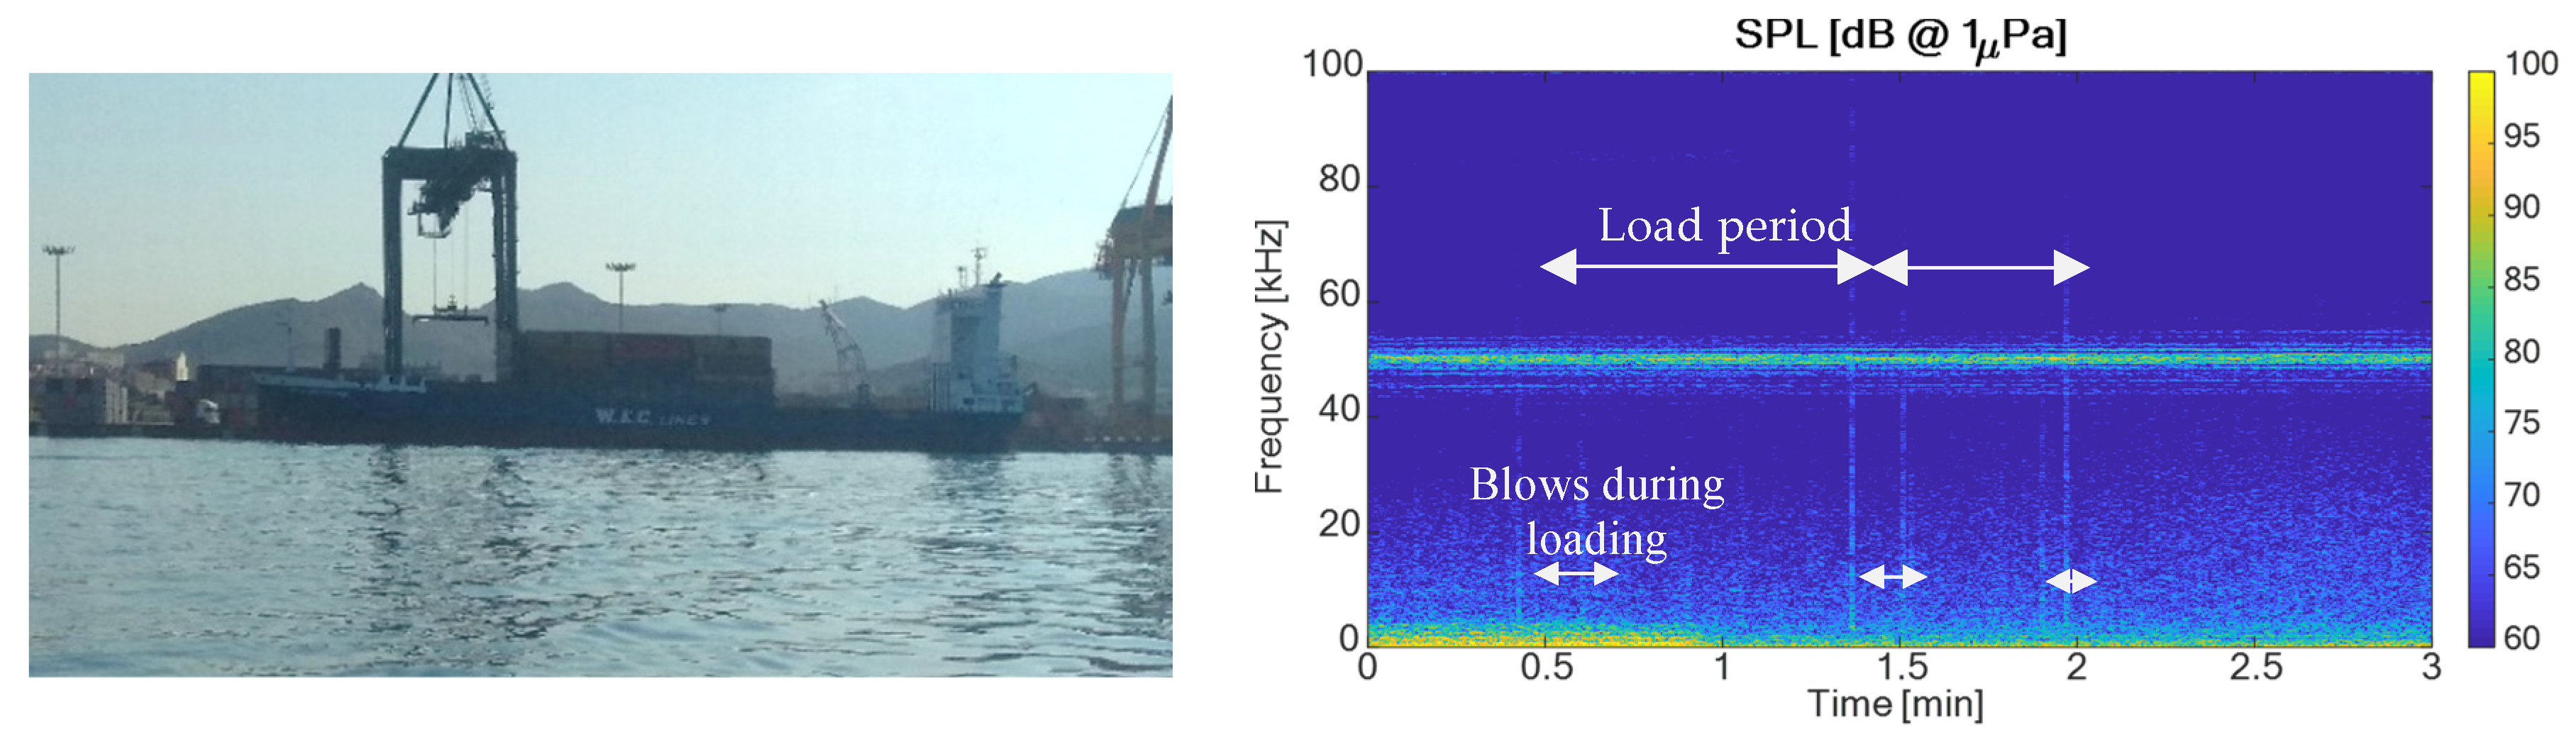
  • Impulsive noise: due to boat sonars and, especially, during the process of loading marine containers to freight ships. The spectrum, duration and periodicity of these events allowed us to make a first estimate of the quantification of an impulsive noise source inherent to the activity of the Port of Cartagena. In addition, these recorded levels were the basis for further development of the numerical propagation model.
Once the data and all the measurements had been obtained and analyzed, an acoustical propagation model was made and run with the experimental results. Finally, the spatial result of the model was integrated into a geo-maritime GIS hosted on the CTN website (http://www.ctninnova.com/visor-geomaritimo/).

2.2. Underwater Sound Propagation Model

Several mathematical models that study the underwater acoustic propagation can been found. Among them, highlight the models of ray tracing, normal modes, parabolic equation, and spectral integration. However, the configuration of these mathematical models requires several parameters whose value is not always known exactly, which can lead to unreliable results. Due to this problem, several semi-empirical models have also been developed to study the acoustic propagation in underwater media, distinguishing different types of propagation [2,3].
From these models, the ray tracing model is the most versatile and the most highly used, so it will be discussed briefly. The model of ray tracing is based on the consideration that the energy of a wave can be concentrated into defined paths, so that we can think of said energy as rays instead of waves. This consideration is valid if the amplitude of the wave and the speed of sound do not vary significantly in a wavelength. Thus, this condition would be better fulfilled by higher frequencies, since the wavelength is smaller in these instances. From the ray tracing model the field of pressures can be calculated, from which the transmission losses and the propagation time of said rays can be obtained.
In the Port of Cartagena, the depth to the bottom (~12 m) is such that there are multiple rebounds of the signal between the sea surface and the floor. This leads to a very important interaction of acoustic signals. This interaction is quite complex, since it is necessary to take into account the type of bottom, the sediments, how they are distributed and, the possible variations that suffer in terms of depth, etc. All these difficulties make the use of mathematical models such as ray tracing risky.
However, semi-empirical models can be used, among which the Colossus model stands out [4]. This model can be used from simulations between 0.1 and 10 kHz. It takes into account the height of the waves (depending on the state of the sea), the type of bottom, the depth of the water column, the frequency, and the profile of the speed of sound. This profile is formed by two constant segments: from the sea surface to a certain depth, , the speed of sound increases linearly with depth, while for depths greater than L , the speed decreases with depth until reaching the bottom. According to this model, the distance of jump, H , is defined as the maximum distance at which a ray makes contact with the surface or with the background of the shape given in equation:
H = L + D 3
where D is the depth from the water column in meters. With this, the transmission losses are obtained according to the equations given in:
T L = 20 log R + α R + 60 k L R < H 15 log R + α R + α T R H 1 + 5 log ( H ) + 60 k L H < R < 8 H 10 log R + α R + α T · R H 1 + 10 log ( H ) + 64.5 k L R > 8 H
where R is the distance, α the absorption coefficient, k L is a parameter called near-field anomaly, which measures the gain due to bounces between the background and the surface, in dB, and α T is the so-called effective attenuation coefficient, which takes into account the losses due to the energy coupling between the surface and the bottom, expressed in dB/bounce. The values of these last two coefficients appear tabulated for different types of bottom and sea state, for example in Reference [2]. As an example, for 1 kHz with calm sea and sandy bottom, k L = 6 dB/bounce and α T = 1.8 dB/bounce.

3. Results and Discussion

3.1. Bavkground and Continuous Acoustic Noise

Figure 2 shows the sound pressure levels (SPL) obtained in thirds of octave bands between 1 and 100 kHz. For each frequency band, it shows the averaging of levels in the area delimited by the registration points. The recorded SPL have an average of 62 dB with variations of ±18 dB.
With these results, we have a first estimate of the basal noise in the Port of Cartagena that we can take as a basis for the study of continuous and impulsive noise sources. However, there were also sources of continuous noise that, although they are not part of the basal noise of the port, they were considered in this study as part of the background that was not, specifically, impulsive noise. The sources of continuous sound recorded during the measurement campaign were, basically, the passage of boats. The following Figure 3 shows the spectrum of one example of such noise.

3.2. Impulsive Noises

During the measurements, only one source of impulsive noise was found. This was due to the process of loading sea containers on a freight ship moored in the eastern part of the Port of Cartagena (Figure 4, left). A study of the spectrogram shows the levels and periodicity of these impulses (Figure 4, right).
These impulse noise levels were recorded approximately 50 m from the source and have a considerable bandwidth (since it is pulses), with peaks of up to 85 dB at frequencies below 20 kHz. This results in about 100 dB @ 1μPa @ 1 m.

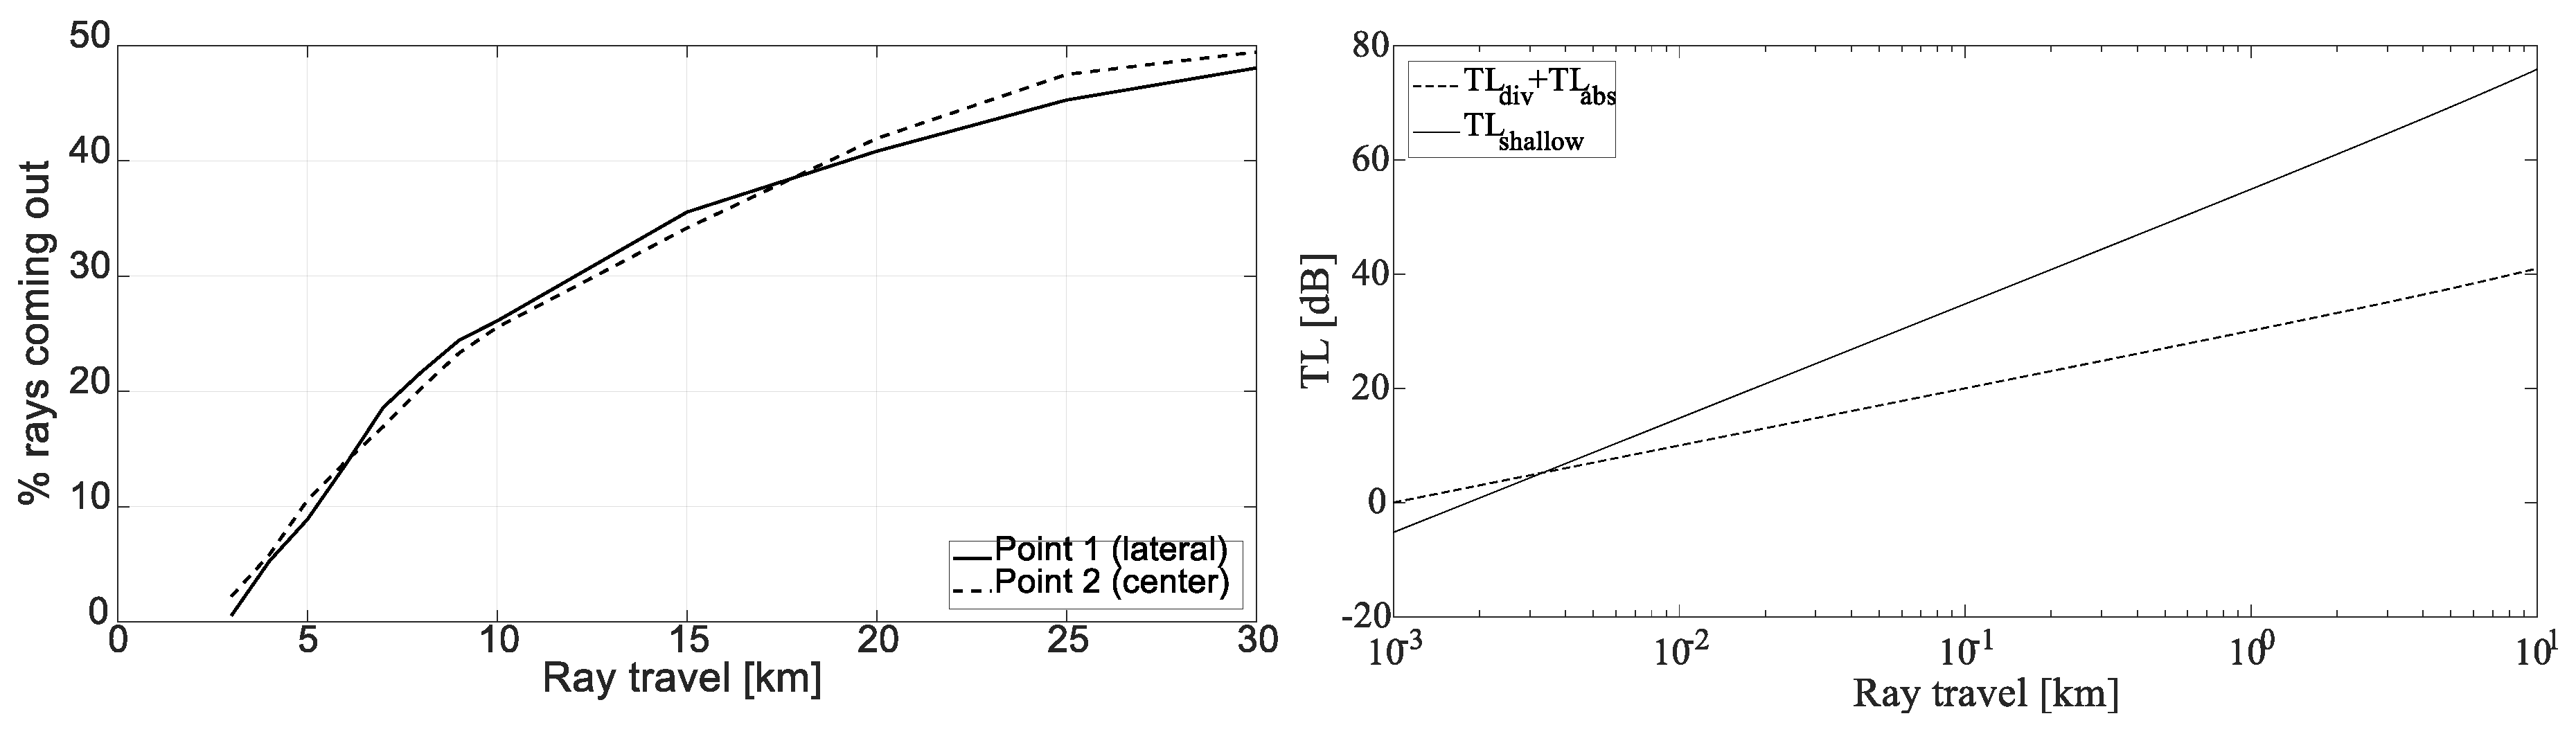
3.3. Propagation Underwater Noise

In these impulse noise source monitoring studies, we are interested in estimating the distance such noise gets out of the infrastructure of the Port of Cartagena. For this, measurements can be made at different distances, as well as the application of acoustic propagation models that take into account the characteristics of the water column and the soil.
In this case, we applied the simplified model described above to estimate the range of a source with characteristics similar to the one discussed in Section 3.2. This model was used on a ray tracing algorithm specifically implemented by the CTN, that considers the geometry of the bay in which the Port of Cartagena is located. Since this was a first approximation for a more extensive study of noise monitoring, the results of different approaches performed in said model are explained here. These studies serve as a basis for more robust subsequent studies.
Given the position of the detected impulsive noise source and the geometry of the port, Figure 5 is generated. On the left, two examples are shown of the path of rays that stretched 5 km from the source. As can be observed, one arrived at the exit of the Port of Cartagena while the other remained inside. By performing the same procedure for different emission angles, the assembly of Figure 5 right is obtained.
We obtained the left illustration of Figure 6 by quantifying the percentage of rays that came out of the Port of Cartagena with respect to the emitted noise. It is observed that only 10% of the rays completed 5 km of travel and up to 20% traveled 7.5 km. As will be seen below, these distances are enough for a decrease in the generated impulsive noise level.
To observe the effect of the acoustic propagation along these rays, we initially compared the transmission losses due only to cylindrical geometrical divergence and absorption with the transmission losses of the semi-empirical model given by Equation (2). The right illustration of Figure 6 shows that both models have the same losses within a few meters of the emission. At closer distances, the semi-empirical model presents fewer losses since, in this region, it takes into account the spherical divergence of the wave. For larger distances, the large number of reflections leads to a sharp increase in losses that limits propagation. Specifically, for 1 kHz, there are reductions of 35 dB in 100 m and 55 dB in 1000 m, much greater than those foreseen by divergence and absorption only.
From the above results we can estimate that a source of impulsive noise with SPL of, for example, 100 dB @ 1 μPa, located inside the Port of Cartagena, will present strong losses. Thus, this anthropogenic noise will reach the entrance of the Port of Cartagena with a level below the existing background noise.

5. Conclusions

After analyzing the background and continuous noise levels in the Port of Cartagena, it has been observed that impulsive noise must have a level above 80 dB @ 1 µPa to be detected. Only one source of impulsive noise was detected, that corresponds to the process of loading sea containers, which is carried out in the eastern part of the Port of Cartagena. Although this source is not usually indicated in the search for impulsive sources, it should be included. However, taking into account the geometry of the port as well as the transmission losses due to the propagation in shallow water, it is estimated that this noise did not reach the outside of the bay with a remarkable level.
Nevertheless, these studies are the basis for the realization of other developments, that will allow advancement, both experimentally and theoretically, in these studies. It is proposed that to further refine the propagation model, considerations as to the deviations in depth in the interior and exterior of the Port of Cartagena should be made.
However, this methodology is extensible to analyze noise generated in other bays with port activities, with a greater impact on marine fauna.

Funding

This research was funded by Cátedra de Medio Ambiente Autoridad Portuaria de Cartagena-Campus Mare Nostrum.

Acknowledgments

We would like to thank the Cartagena Port Authority for their general support in the operational campaign.

References

  1. Ruiz, P.; Cervantes, P.; Noelia, O.; Valt, J.; Uriarte, A. Sound impact of Mutriku Oscillating Water Column Plant: Unerstanding MSFD Descriptor 11. In Proceedings of the XIV Jornadas Españolas de Ingeniería de Costas y Puertos, Alicante, Spain, 24–25 May 2017. [Google Scholar]
  2. Urick, R.J. Principles of Underwater Sound, 3rd ed.; Península Publishing: Los Altos Hills, California,USA, 1983. [Google Scholar]
  3. Leighton, T.G. Fundamentals of Underwater Acoustics. In Fundamentals of Noise and Vibrations, 1st ed.; Fahy, F., Walker, J., Eds.; E & FN SPON: London and New York, 1998; pp. 373–443. [Google Scholar]
  4. Schulkin, M.; Mercer, J.A. Colossus Revisited: A Review and Extension of the Marsh-Schulkin Shallow Water Transmission Loss Model; APL-UW 8508; Applied Physics Laboratory, University of Washington: Washington, Seattle, Washington, USA, 1985. [Google Scholar]
Figure 1. (left) location of all the measurements points. (right) RVR of the hydrophone used.
Proceedings 04 00057 g001
Figure 2. (left) the spectrum of background noise. (right) its spectrogram at Point P1.
Proceedings 04 00057 g002
Figure 3. (left) the spectrum of a continuous noise source. (right) its corresponding spectrogram. (Point P3).
Proceedings 04 00057 g003
Figure 4. (left) the loading of a freight ship. (right) a spectrogram of the noise generated. (Point P2).
Proceedings 04 00057 g004
Figure 5. (left) an example of the tracing of two rays. (right) the tracing of all rays.
Proceedings 04 00057 g005
Figure 6. (left) the percentage of rays that leave the port. (right) the comparison of transmission losses with different propagation models
Proceedings 04 00057 g006

