Continuous Mapping and Monitoring Framework for Habitat Analysis in the United Arab Emirates †
by
 and
and
Prashanth Reddy Marpu
1,*, 
Marouane Temimi
1, 
Fatima AlAydaroos
2, 
Nazmi Saleous
3 and
Anil Kumar
4 1
Masdar Institute, Khalifa University of Science and Technology, Abu Dhabi, UAE
2
UAE Space Agency, Abu Dhabi, UAE
3
Department of Geography, United Arab Emirates University, Al Ain, UAE
4
Environmental Information, Science & Outreach Management, Environment Agency, Abu Dhabi, UAE
*
Author to whom correspondence should be addressed.
†
Presented at the 2nd International Electronic Conference on Remote Sensing, 22 March–5 April 2018; Available online: https://sciforum.net/conference/ecrs-2.
Proceedings 2018, 2(7), 371; https://doi.org/10.3390/ecrs-2-05185
Published: 27 March 2018
(This article belongs to the Proceedings of The 2nd International Electronic Conference on Remote Sensing)
Abstract
:In 2015, the Environment Agency—Abu Dhabi developed the extensive Abu Dhabi Habitat, Land Use, Land Cover Map based on very high resolution satellite imagery acquired between 2011 and 2013. This was the first integrated effort at such a scale. This information has greatly helped in environmental conservation and preservation activities along with future infrastructure planning. This map has created an excellent baseline and allows efficient monitoring. In this work, we aim to establish a framework for short term updates to the maps to quickly enable efficient planning. We make use of spectral–spatial approaches based on object-based image analysis to adapt the classification scheme. Training examples from the baseline maps and field surveys are used to train classifiers, such as support vector machines (SVM), to build the updated maps. Eventually, the goal is to develop a consistent classification approach and then adapt automatic change detection approaches to extend the baseline maps temporally.
1. Introduction
The United Arab Emirates (UAE) has seen a tremendous growth over the last few decades in the development of advanced urban centers. Such a rapid development has put the environment under significant stress. This creates a need for continuous monitoring of land cover and land use to make informed decisions. With this motivation, Environment Agency-Abu Dhabi (EAD) developed a detailed Habitat, Land Use, Land Cover Map based on very high resolution satellite imagery acquired between 2011 and 2013 [1]. A total land area of 60,000 km2 and a marine area of 30,000 km2 has been mapped on a scale of 1:10,000 with an accuracy of around 87% on average. This is the first integrated effort at such scale in the country and has created a very good baseline for future mapping activities. Following the effort of the EAD, there is ongoing effort to extend the process to cover the entire UAE, with key stakeholders like the UAE Space Agency and the Ministry of Climate Change and Environment leading the initiative. This work summarizes the pilot study that is being carried out to extend the mapping workflow to develop land use, land cover maps of the UAE.
Globally, there are active programs for development and wide area land cover maps that are frequently updated. The Coordination of Information on the Environment (CORINE) Land Cover (CLC) project is a great example of such initiatives [2]. Initiated in 1985 and widely implemented over the complete European Union, updates have been produced in 2000, 2006 and 2012 by defining 44 land use, land cover classes with a 25 ha minimum mapping unit. The CLC maps have proven to be important resources for several sectors, such as risk management [3] environmental impact assessment [4], life cycle analysis [5], biodiversity conservation [6] and urban heat island studies [7]. In the United States of America, a consortium known as Multi-Resolution Land Characteristics Consortium (MRLC) was formed in 1992 with the goal of generating consistent and relevant land cover information [8]. The first National Land Cover Dataset (NLCD) was produced in 1992 and updates were produced in 2001 [9], 2006 [10] and 2011 [11]. It provides a nationwide classification of 16 classes at a spatial resolution of 30 m.
Compared to the above initiatives, UAE aims to generate a highly detailed classification with over 55 classes and at a spatial resolution of less than 5 m for the entire country. In this work, as a part of the ongoing project, a pilot project is being carried out to improve the mapping accuracy obtained by the previous mapping project of the EAD and also to formulate a methodology to extend the mapping exercise to the entire UAE. The work also aims to develop a methodology to perform updates to the maps in short intervals of less than 2 years, as opposed to 5–6 years which is normally accepted globally. Such a rapid frequency of map updating is crucial for the UAE which is developing at a higher rate than other countries.
2. Experiments
2.1. Study Area
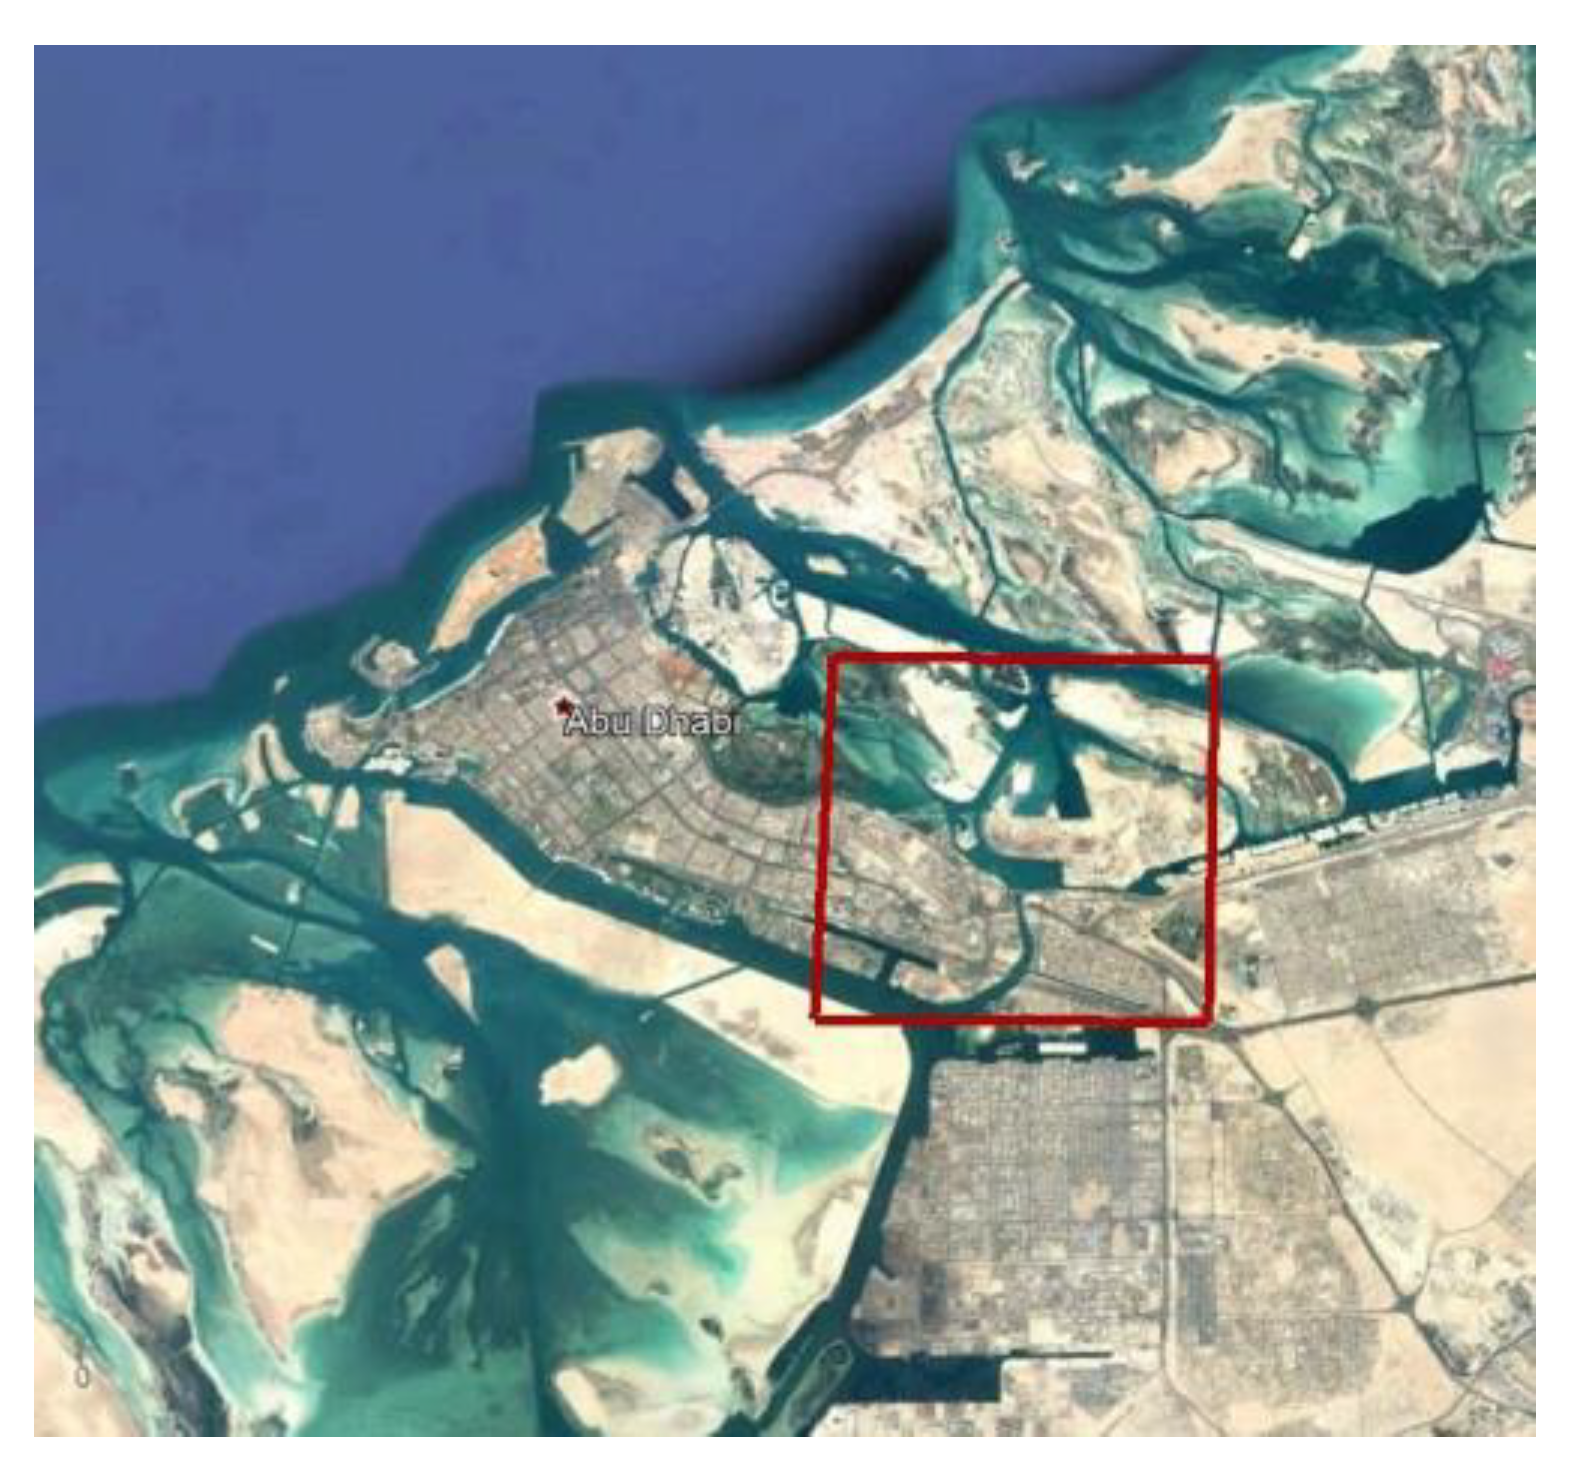
In this study, we considered an area in Abu Dhabi, as shown in Figure 1. The area is represented by 22 land cover/land use classes out of the 54 classes defined by the EAD. It has a diverse setting, with part of Abu Dhabi city in the south and various islands in the north, with significant human activity. The region also consists of mangroves along the Abu Dhabi coast.
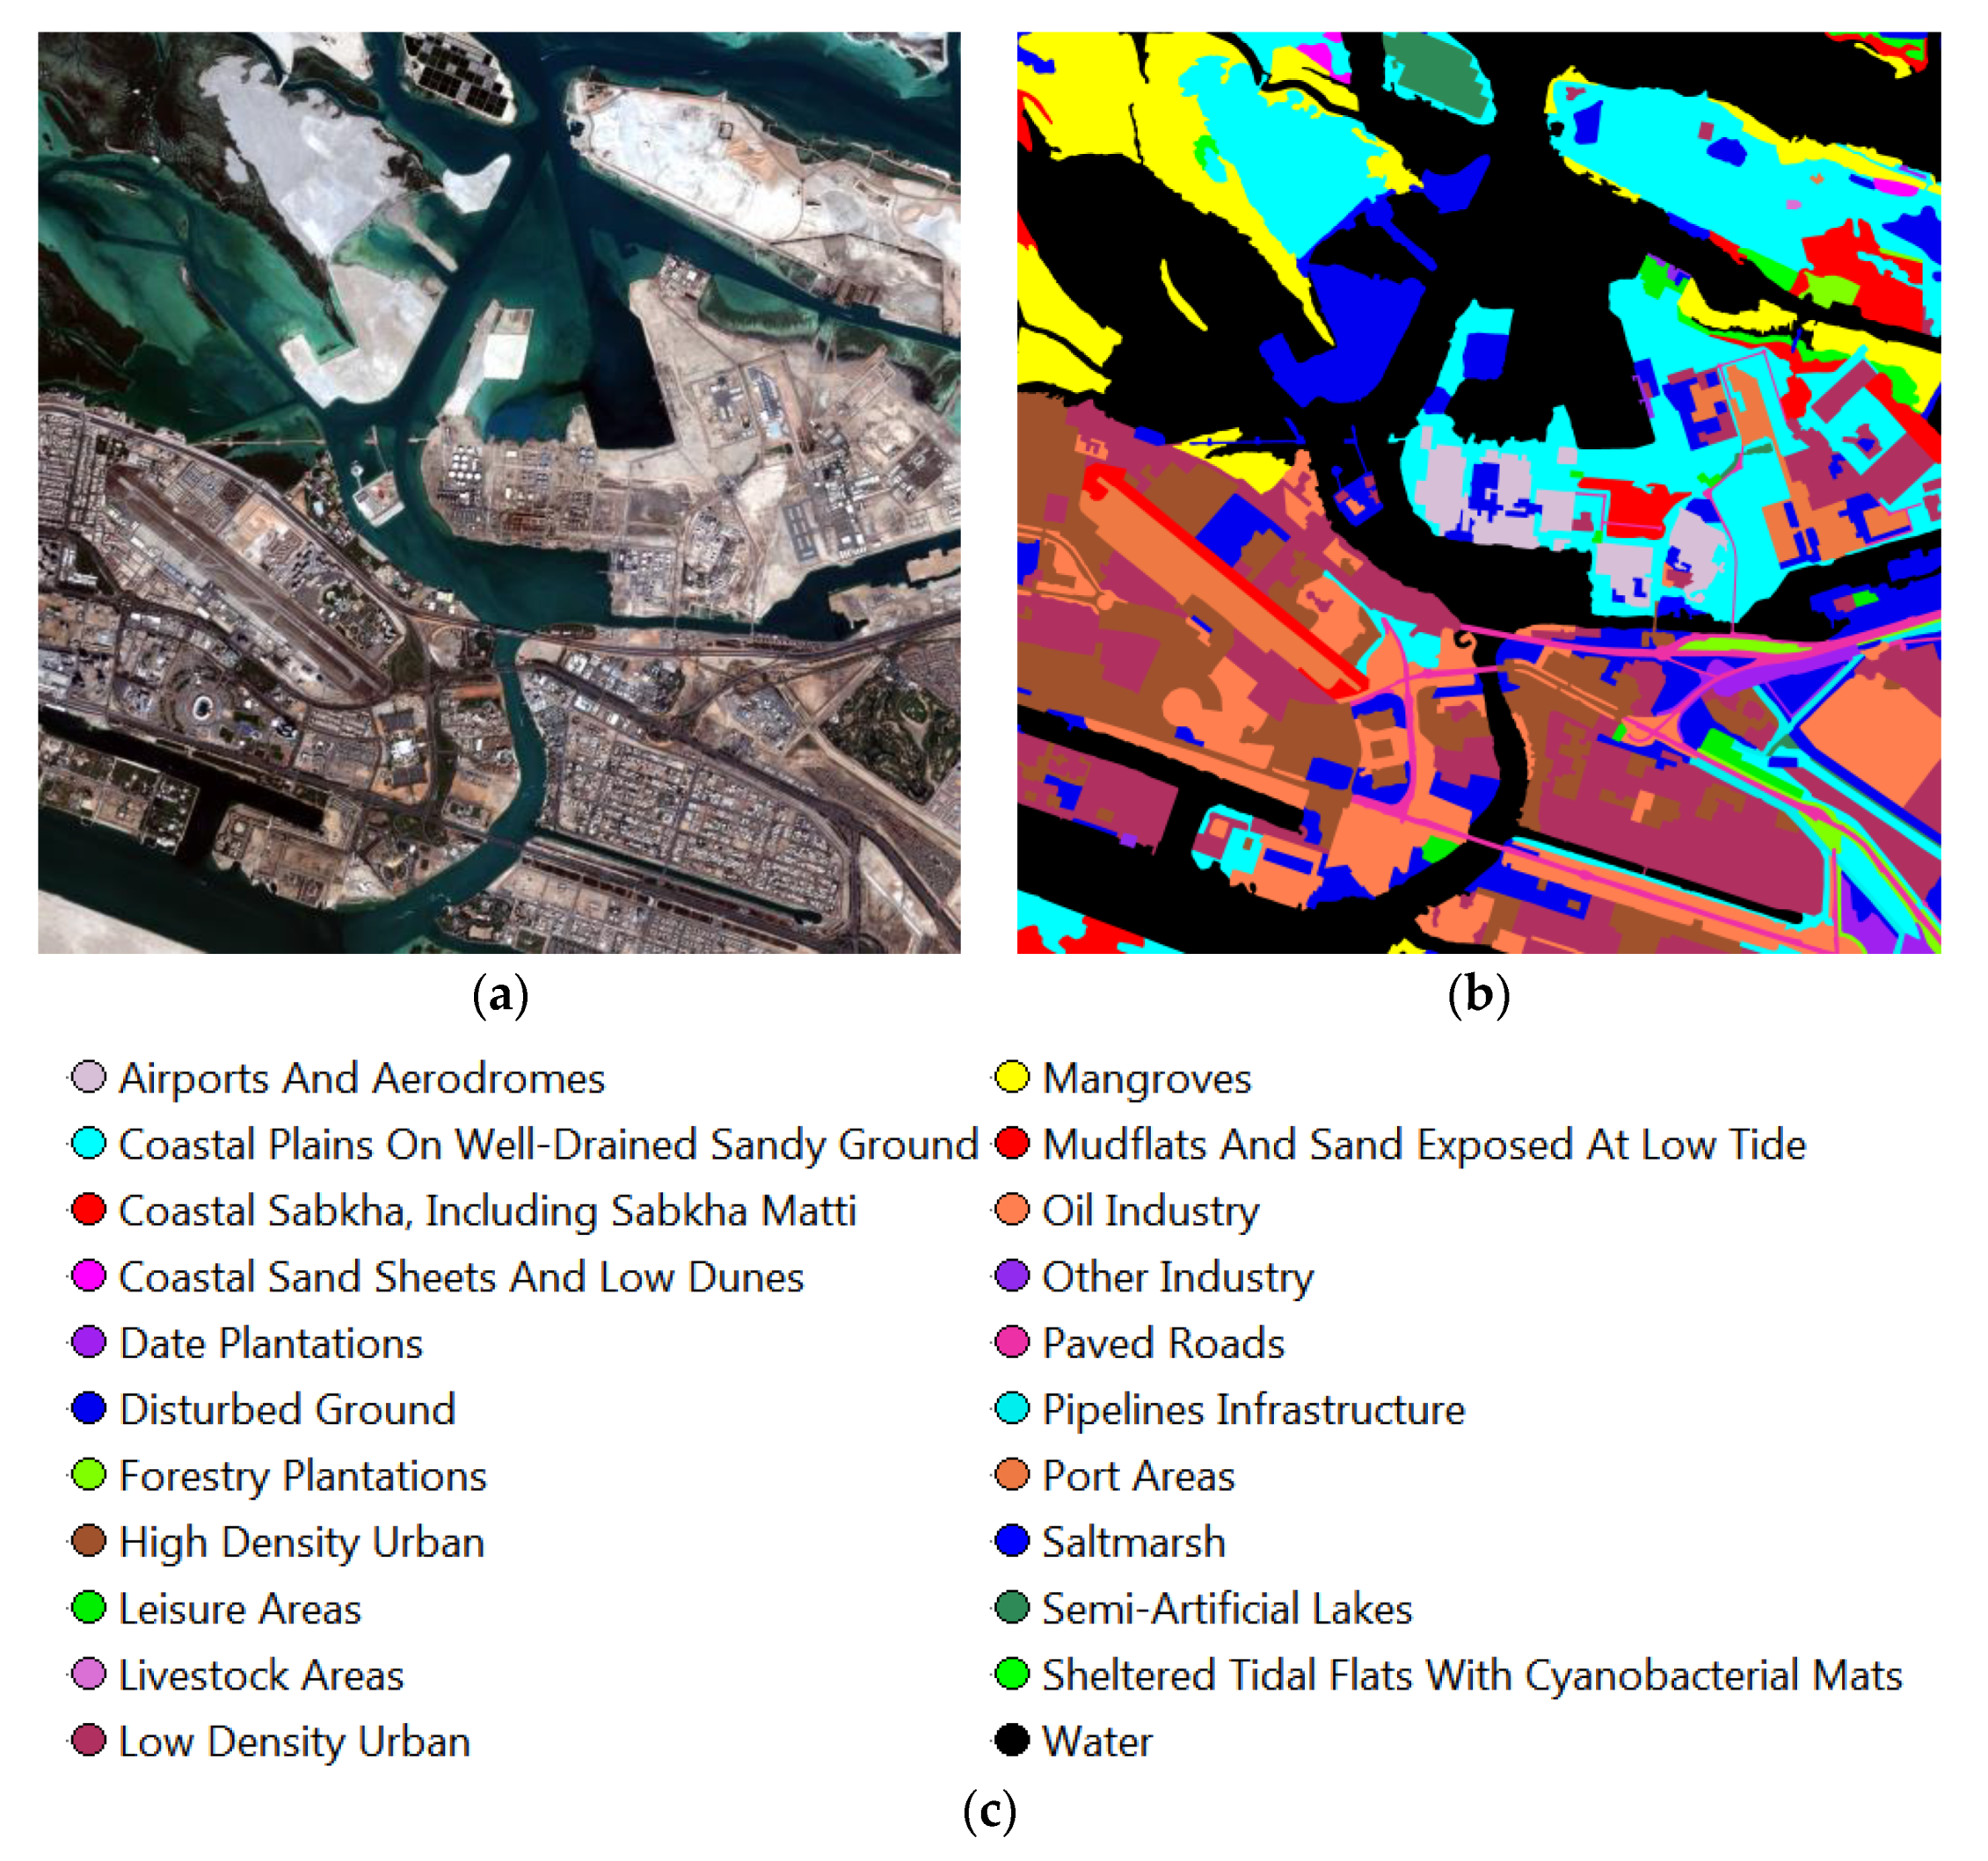
The image was acquired by WorldView-2 satellite in 2012 and consists of data acquired in eight bands in visible, near-infrared (NIR) and shortwave infrared (SWIR) regions at a spatial resolution of 1.85 m for the multispectral images and 46 cm for the panchromatic image. The panchromatic image consists of 20,000 × 20,000 pixels. A snapshot of the image and the corresponding land use/land cover map from the EAD database is shown in Figure 2. The corresponding legend shows the 22 classes considered in the study. It can be clearly observed that several of these classes are highly heterogeneous spatially, e.g., airports and aerodromes, disturbed ground, industry classes, urban classes, etc., as they correspond to land use rather than land cover.
2.2. Materials and Methods
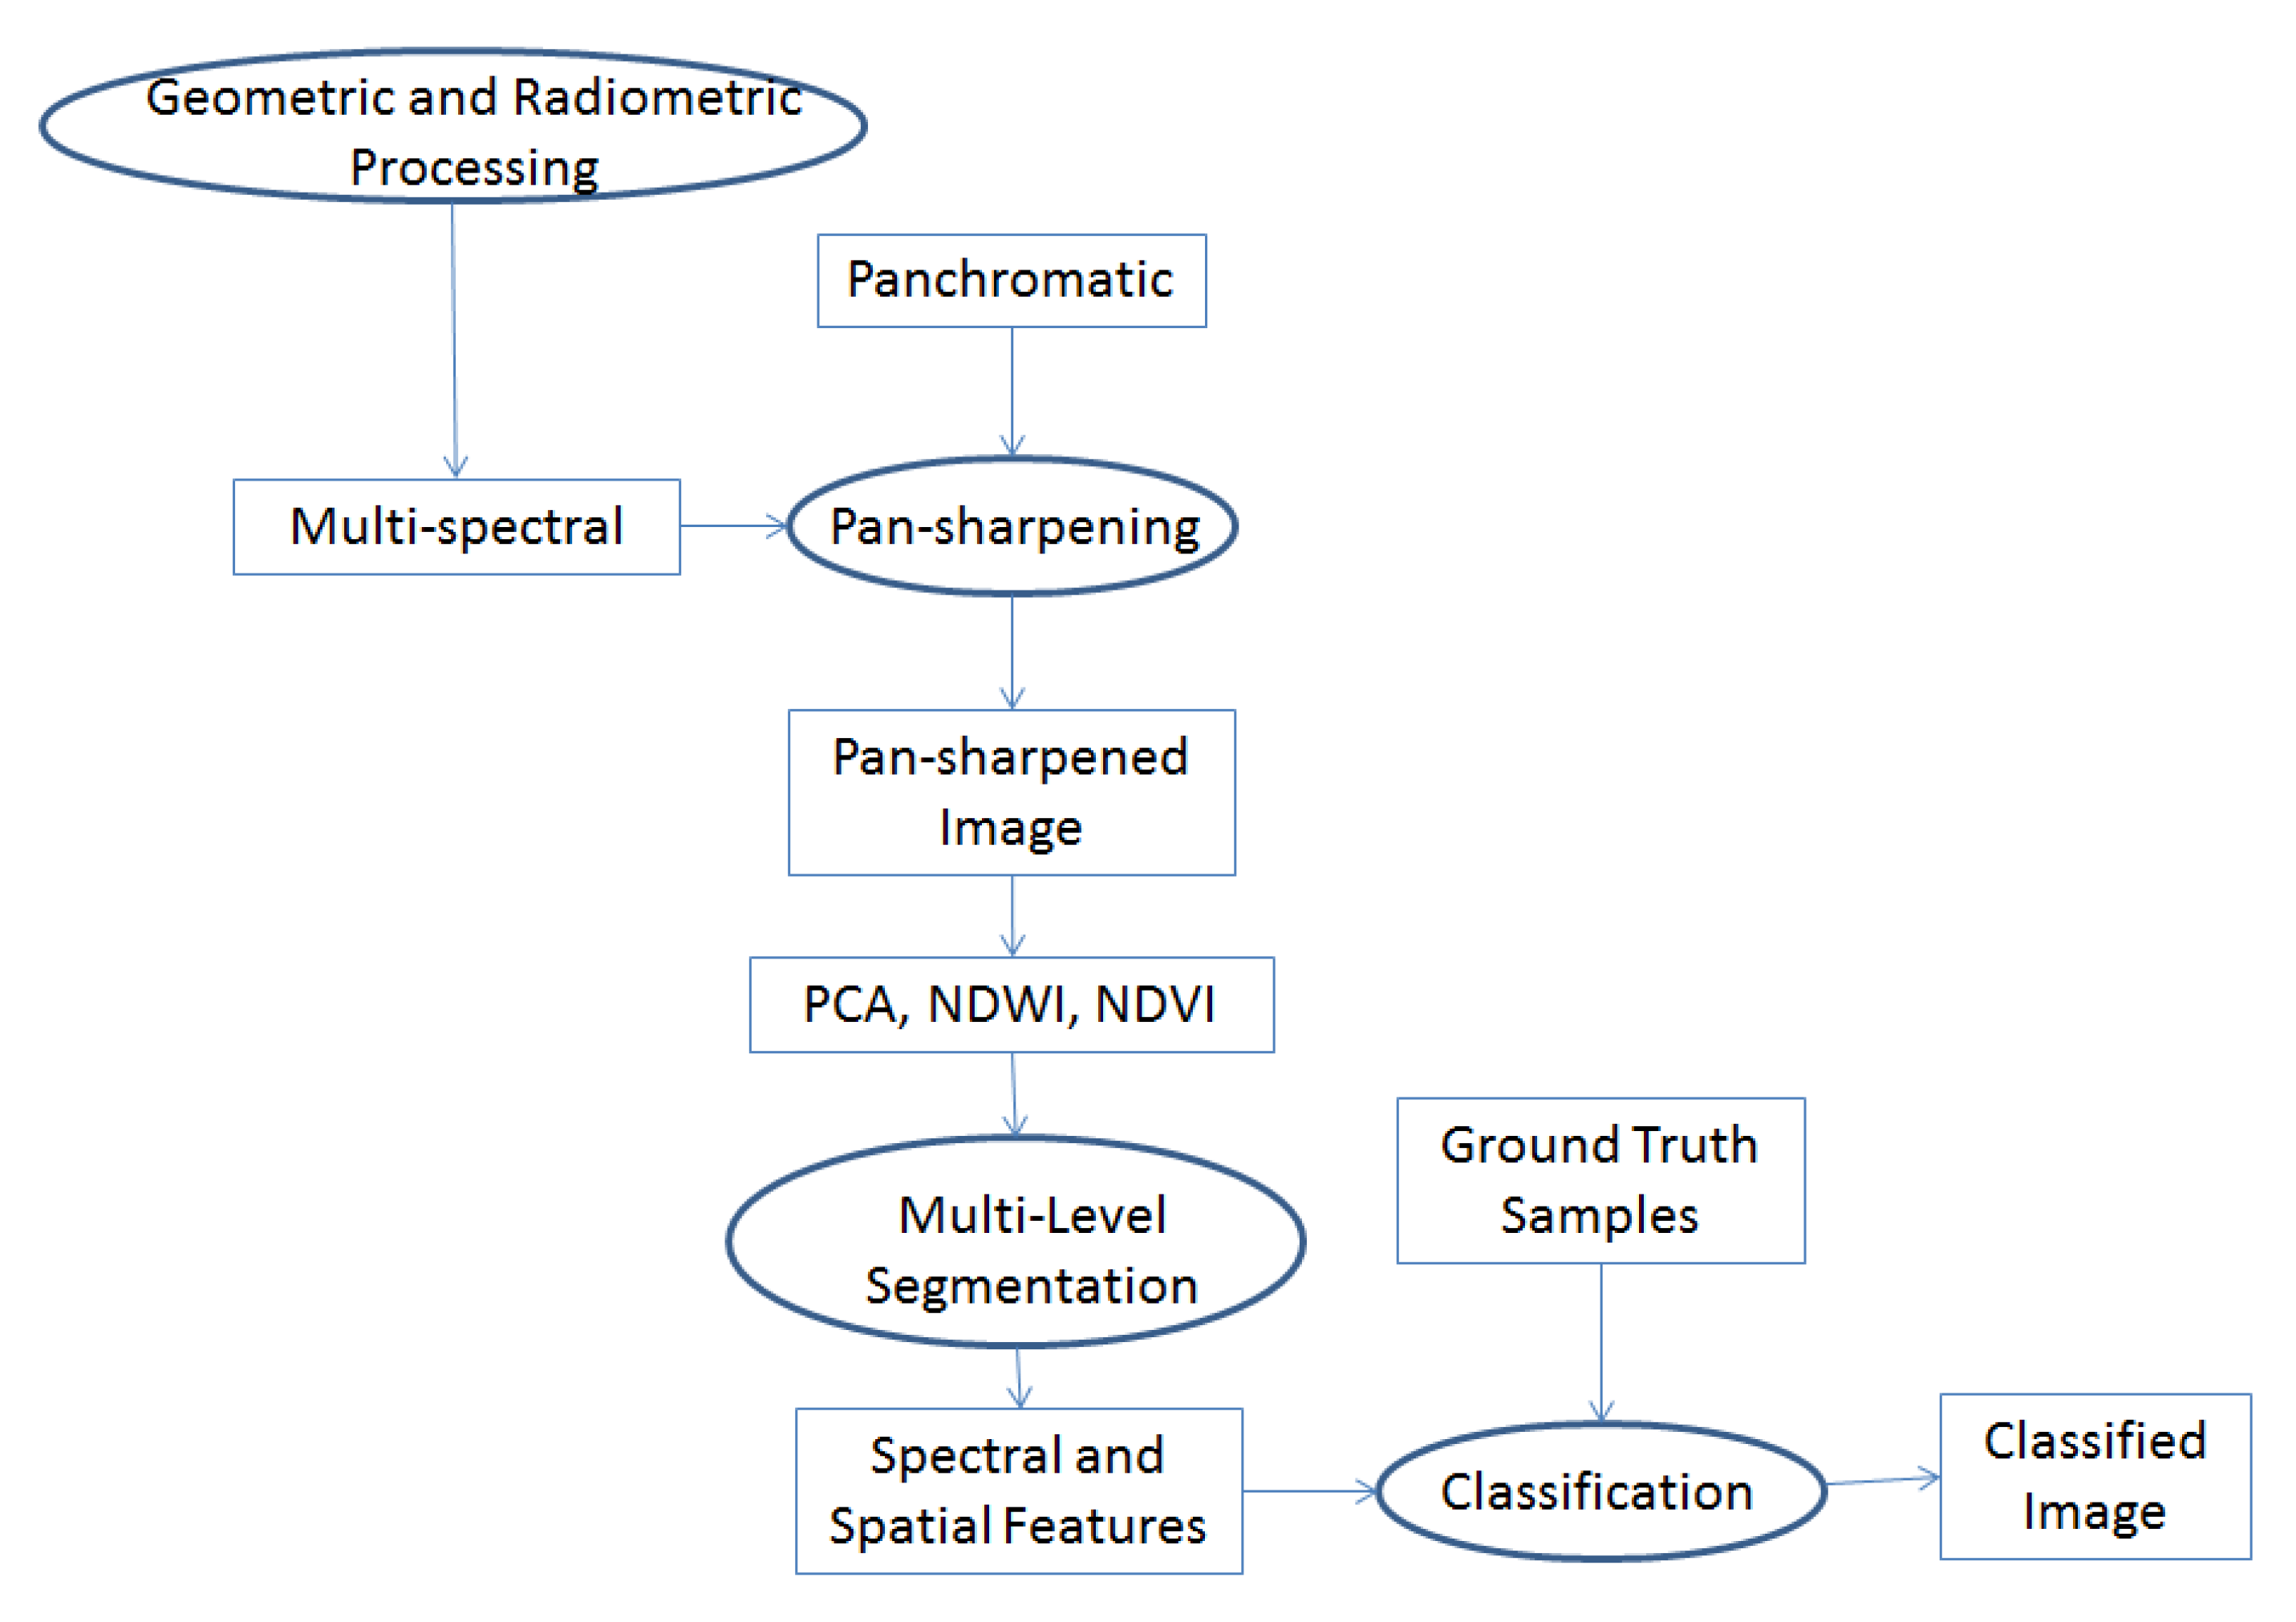
As a part of our initial efforts to experiment with the methods, the first step was to develop a reliable classification approach. Our aim was to see if we could develop a method to make use of the spatial information to deduce the heterogeneous land use classes as well. Recently, several authors have successfully demonstrated the superiority of spectral—spatial approaches such as geographical object-based image analysis (GEOBIA) [12,13], morphological and attribute profiles [14,15], convolutional neural networks (CNNs) [16], etc. Embedding spatial information in the modeling of classes is shown to significantly improve a classification’s accuracy, especially when dealing with highly heterogeneous classes. In this work, as the first attempt, we employed a segmentation-based approach similar to the method that was successfully utilized to map the coral reef environment in the UAE [17]. The flowchart of the proposed method is shown in Figure 3. The lower resolution multispectral image was first geometrically and radiometrically corrected and pan-sharpened using the higher resolution panchromatic image to enhance the spatial information while preserving the spectral information. In this work, the Gram–Schmidt method [18] was employed for pansharpening. The pan-sharpened dataset was used to derive the normalized difference vegetation index (NDVI) and normalized difference water index (NDWI). Principal component analysis (PCA) was performed to extract the top three components accounting for the majority of variance. These five components were stretched and normalized to the same range (0–1000) and stacked to be used in segmentation. The reason behind this processing step was to enhance the contrast between the image segments to allow accurate segmentation of the image. Also, NDWI was used to mask the water regions with a threshold of 0.7. The image was segmented into multiple levels to capture the fact that different objects appear at different scales in the images. Subsequently, object features (e.g., mean value, texture features calculated using gray level co-occurrence matrix, shape features, relational features, etc. [13]) were calculated for all objects at the identified segmentation levels. All the features are stacked and are used as inputs for classification using non-linear classifiers such as Random Forest (RF) [19] or Support Vector Machines (SVM) [20]. In this work, SVM was employed.
3. Results
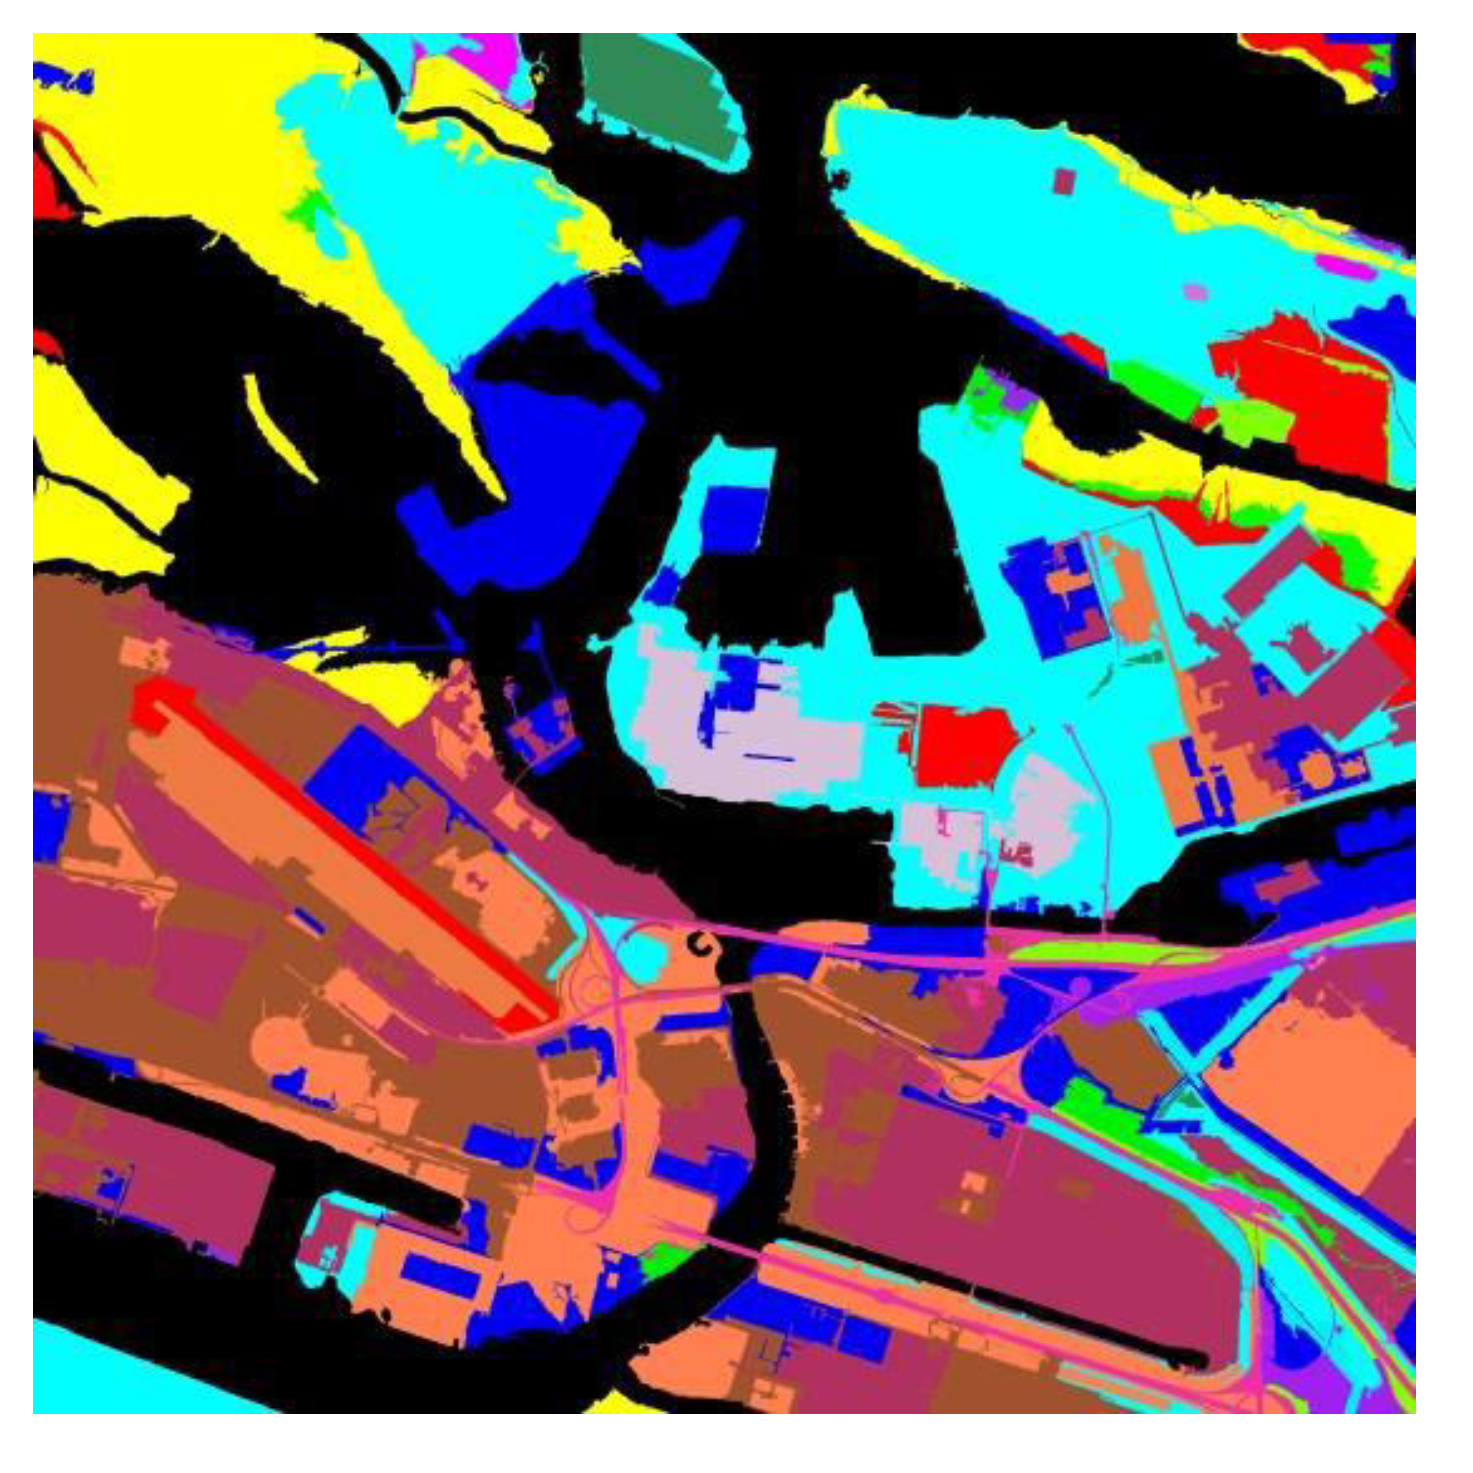
The proposed approach was applied on the dataset shown in Figure 2. Multiresolution segmentation in eCognition software [21] was used in this work for segmentation. Three segmentation levels were used with scale parameters of 100, 200 and 400, respectively, based on visual inspection of the segmentation result. The key to choosing the scale parameter is to abstract land use classes which are often represented at larger scales. Only the layer means and GLCM mean features were used as features in this initial study, where the GLCM features embedded the textural information that could be related to the land use classes. The segmentation profiles were formed by stacking all the features at all segmentation levels and were used as input to the SVM classifier. Ten percent of the pixels were randomly selected from the map in Figure 2b for the purpose of training the classifier and the rest were used for testing. Figure 4 shows the result of the classification using the proposed method. An overall accuracy of 82.76% was achieved. However, some classes with highest ambiguity, such as disturbed ground, mud flats and industry areas, could not be identified properly. This could be due to the high heterogeneity and a low number of samples for the classes.
4. Discussion
In this work, an initial result of the spectral–spatial approach using segmentation was presented. The approach seems to be, in general, sufficiently adaptive to deal with wide areas, even those with high heterogeneity. However, there are some issues that need to be optimized. It is crucial to identify the segmentation parameters correctly for the subsequent steps to achieve a higher level of accuracy. At the same time, the classification seems to be biased towards the classes with higher numbers of samples. Despite these shortcomings, an acceptable overall accuracy was shown, which was comparable to what was achieved during the extensive campaign to produce the Abu Dhabi habitat maps. We intend to extend this work to optimize the framework while also exploring other approaches, like the CNNs. The ongoing work will also explore automatic change detection methods. The idea behind this is to apply change detection to identify no-change regions. These no-change regions can then be used as training samples for the new dataset to update the classification model. This will help in developing a framework for updating landcover maps in shorter time intervals.
5. Conclusions
As a part of the pilot project funded by the UAE Space Agency, there is an ongoing effort to establish the methods that could be used in the development of UAE nationwide land cover maps and also to continuously monitor the changes to update the maps in shorter time intervals. This paper presents the results of the first case study using a spectral–spatial approach for the classification of highly heterogeneous areas. The method which uses GEOBIA framework was able to achieve around 83% accuracy. This work is now being extended to study different approaches, such as convolutional neural networks (CNNs), for classification and also change detection for continuous monitoring applications.
Acknowledgments
This work is funded by United Arab Emirates Space Agency project grant SA01-2016-001.
Conflicts of Interest
The authors declare no conflict of interest.
References
- Abu Dhabi Habitat Mapping—2016. Available online: https://www.ead.ae/Publications/AbuDhabiHabitatMapping2016/HabitatBookEnglishWeb.pdf (accessed on 9 February 2018).
- CORINE Land Cover. Available online: https://land.copernicus.eu/pan-european/corine-land-cover (accessed on 9 February 2018).
- Van der Sande, C.; De Jong, S.; De Roo, A. A segmentation and classification approach of IKONOS-2 imagery for land cover mapping to assist flood risk and flood damage assessment. Int. J. Appl. Earth Obs. Geoinf. 2003, 4, 217–229. [Google Scholar] [CrossRef]
- Koellner, T.; Scholz, R.W. Assessment of land use impacts on the natural environment. Int. J. Life Cycle Assess. 2008, 13, 32–48. [Google Scholar]
- Koellner, T.; de Baan, L.; Beck, T.; Brandão, M.; Civit, B.; Goedkoop, M.; Margni, M.; Milà i Canals, L.; Müller-Wenk, R.; Weidema, B.; et al. Principles for life cycle inventories of land use on a global scale. Int. J. Life Cycle Assess. 2013, 18, 1203–1215. [Google Scholar] [CrossRef]
- Falcucci, A.; Maiorano, L.; Boitani, L. Changes in land-use/land-cover patterns in Italy and their implications for biodiversity conservation. Landsc. Ecol. 2007, 22, 617–631. [Google Scholar] [CrossRef]
- Stathopoulou, M.; Cartalis, C. Daytime urban heat islands from Landsat ETM+ and CORINE land cover data: An application to major cities in Greece. Sol. Energy 2007, 81, 358–368. [Google Scholar] [CrossRef]
- MRLC Consortium. 2013. Available online: http://www.mrlc.gov/about.php (accessed on 9 February 2018).
- Homer, C.; Dewitz, J.; Fry, J.; Coan, M.; Hossain, N.; Larson, C.; Herold, N.; McKerrow, A.; VanDriel, J.N.; Wickham, J. Completion of the 2001 National Land Cover Database for the conterminous United States. Photogramm. Eng. Remote Sens. 2007, 73, 337–341. [Google Scholar]
- Fry, J.; Xian, G.; Jin, S.; Dewitz, J.; Homer, C.; Yang, L.; Barnes, C.; Herold, N.; Wickham, J. Completion of the 2006 National Land Cover Database for the conterminous United States. Photogramm. Eng. Remote Sens. 2011, 77, 858–864. [Google Scholar]
- Jin, S.; Yang, L.; Danielson, P.; Homer, C.; Fry, J.; Xian, G. A comprehensive change detection method for updating the National Land Cover Database to circa 2011. Remote Sens. Environ. 2013, 132, 159–175. [Google Scholar] [CrossRef]
- Blaschke, T.; Hay, G.J.; Kelly, M.; Lang, S.; Hofmann, P.; Addink, E.; Feitosa, R.Q.; van der Meer, F.; van der Werff, H.; van Coillie, F.; et al. Geographic Object-Based Image Analysis—Towards a new paradigm. ISPRS J. Photogramm. Remote Sens. 2014, 87, 180–191. [Google Scholar] [CrossRef] [PubMed]
- Marpu, P.R. Geographic Object-Based Image Analysis; TU Freiberg: Freiberg, Germany, 2009. [Google Scholar]
- Dalla Mura, M.; Benediktsson, J.A.; Waske, B.; Bruzzone, L. Morphological Attribute Profiles for the Analysis of Very High Resolution Images. IEEE Trans. Geosci. Remote Sens. 2010, 48, 3747–3762. [Google Scholar] [CrossRef]
- Bernabe, S.; Marpu, P.R.; Plaza, A.; Dalla Mura, M.; Benediktsson, J.A. Spectral-spatial classification of multispectral images using kernel feature space representation. IEEE Geosci. Remote Sens. Lett. 2014, 11, 288–292. [Google Scholar] [CrossRef]
- Alshehhi, R.; Marpu, P.R.; Woon, W.L.; Dalla Mura, M. Simultaneous extraction of roads and buildings in remote sensing imagery with convolutional neural networks. ISPRS J. Photogramm. Remote Sens. 2017, 130, 139–149. [Google Scholar] [CrossRef]
- Ben-Romdhane, H.; Marpu, P.R.; Ouarda, T.B.M.J.; Ghedira, H. Corals & benthic habitat mapping using DubaiSat-2: A spectral-spatial approach applied to Dalma Island, UAE (Arabian Gulf). Remote Sens. Lett. 2016, 7, 781–789. [Google Scholar]
- Laben, C.A.; Brower, B.V. Process for Enhancing the Spatial Resolution of Multispectral Imagery Using Pan-Sharpening. U.S. Patent 6,011,875, 4 January 2000. [Google Scholar]
- Breiman, L. Random forests. Mach. Learn. 2001, 45, 5–32. [Google Scholar] [CrossRef]
- Cristianini, N.; Shawe-Taylor, J. An Introduction to Support Vector Machines: And Other Kernel-Based Learning Methods; Cambridge University Press: Cambridge, UK, 2000. [Google Scholar]
- Baatz, M.; Schäpe, A. Multiresolution Segmentation—An optimization approach for high quality multi-scale image segmentation. In Angewandte Geographische Informationsverarbeitung XII; Strobl, J., Blaschke, T., Griesbner, G., Eds.; Wichmann: Heidelberg, Germany, 2000; pp. 12–23. [Google Scholar]
Figure 1.
Location of the study area in Abu Dhabi.

Figure 2.
(a) Red, Green and Blue color composite image of the WorldView-2 image; (b) land use/land cover map of the area of study; and (c) list of classes identified in the map.
Figure 2.
(a) Red, Green and Blue color composite image of the WorldView-2 image; (b) land use/land cover map of the area of study; and (c) list of classes identified in the map.

Figure 3.
Flowchart showing the spectral–spatial approach employed in this work.

Figure 4.
Classification result using the proposed approach.

Publisher’s Note: MDPI stays neutral with regard to jurisdictional claims in published maps and institutional affiliations. |
© 2018 by the authors. Licensee MDPI, Basel, Switzerland. This article is an open access article distributed under the terms and conditions of the Creative Commons Attribution (CC BY) license (https://creativecommons.org/licenses/by/4.0/).
Share and Cite
MDPI and ACS Style
Marpu, P.R.; Temimi, M.; AlAydaroos, F.; Saleous, N.; Kumar, A. Continuous Mapping and Monitoring Framework for Habitat Analysis in the United Arab Emirates. Proceedings 2018, 2, 371. https://doi.org/10.3390/ecrs-2-05185
AMA Style
Marpu PR, Temimi M, AlAydaroos F, Saleous N, Kumar A. Continuous Mapping and Monitoring Framework for Habitat Analysis in the United Arab Emirates. Proceedings. 2018; 2(7):371. https://doi.org/10.3390/ecrs-2-05185
Chicago/Turabian StyleMarpu, Prashanth Reddy, Marouane Temimi, Fatima AlAydaroos, Nazmi Saleous, and Anil Kumar. 2018. "Continuous Mapping and Monitoring Framework for Habitat Analysis in the United Arab Emirates" Proceedings 2, no. 7: 371. https://doi.org/10.3390/ecrs-2-05185