Radiometric Calibration of RapidScat Using the GPM Microwave Imager †


Department of Electrical and Computer Engineering, Florida Institute of Technology, Melbourne, FL 32901,USA
*
Author to whom correspondence should be addressed.
†
Presented at the 2nd International Electronic Conference on Remote Sensing, 22 March–5 April 2018; Available online: https://sciforum.net/conference/ecrs-2.
Proceedings 2018, 2(7), 324; https://doi.org/10.3390/ecrs-2-05137
Published: 22 March 2018
(This article belongs to the Proceedings of The 2nd International Electronic Conference on Remote Sensing)
Abstract
:Flying in a non-Sun-synchronous orbit, RapidScat is the first scatterometer capable of measuring ocean vector winds over the full diurnal cycle, instead of observing a given location at a fixed time of day. The non-Sun-synchronous orbit also enables the overlap with other satellite instruments that have been flying in Sun-synchronous orbits. RapidScat covered the latitude range between ±51.6° and was operated on board the International Space Station between September 2014 and August 2016. This paper describes the process that combines RapidScat’s active and passive modes, simultaneously measuring both the radar surface backscatter (active mode) and the microwave emission determining the system noise temperature (passive mode). This work also presents the radiometric (passive mode) cross-calibration using the GPM (Global Precipitation Measurement) Microwave Imager (GMI) as a reference to eliminate the measurement biases of brightness temperature between a pair of radiometer channels that are operating at slightly different frequencies and incidence angles. Since the RapidScat operates at 13.4 GHz, and the closest GMI channel is 10.65 GHz, GMI brightness temperatures were normalized before the calibration. Normalization was based on the radiative transfer model (RTM) to yield an equivalent brightness temperature prior to the direct comparison with RapidScat. The seasonal and systematic biases were calculated for both polarizations as a function of geometry, atmospheric, and ocean brightness temperature models. The calculated biases may be used for measurement correction and for reprocessing of geophysical retrievals.
1. Introduction
The RapidScat (RS) scatterometer was launched in September 2014 installed on the Columbus module of the International Space Station (ISS). It started making measurements over the Earth’s surface in October 2014 and continued until August 2016. The instrument operated in a manner similar to QuikScat, a previous Ku-band scatterometer, as NASA had used the QuikScat’s spare engineering unit to build the follow-up RapidScat instrument [1,2,3]. RapidScat is a dual-beam, conical-scanning, long-pulse radar system. It combines active and passive Ku-band microwave measurements in dual-receiver channels. The backscatter is measured in a narrowband channel, and the brightness temperature (Tb) in a wider band channel, both from the ocean surface and through the intervening atmosphere [4]. The primary use of scatterometer measurements is wind vector retrieval over the sea surface. In the passive mode, the RapidScat measures the linearly polarized microwave emission at 13.4 GHz frequency quantified by Tb. The rotating antenna generates vertically (VV) and horizontally (HH) polarized beams directed at the Earth’s surface at incidence angles of approximately 56° and 49°, respectively. The ground swath of the outer VV beam is approximately 1100 km wide, while the ground swath of the inner HH beam is approximately 900 km wide. Regions between ±58° latitude are sampled uniformly over 24 h periods, as opposed to previous Sun-synchronous scatterometer orbits with fixed diurnal sampling flying over the same land areas at the same time of day [5,6,7,8]. This paper presents the first radiometric calibration work of RapidScat brightness temperature measurements over oceans. To accomplish the calibration, the Radiative Transfer Model (RTM), developed at the Central Florida Remote Sensing Laboratory (CRFSL) at University Central Florida [9], was used to evaluate the corresponding modeled brightness temperatures. The RTM uses the collocated environmental parameters (surface truth) and given sensor parameters (incidence angle, frequency, and polarization), to produce the simulated Tb. In addition, in comparison with the RTM model, GPM Imager measurements were used for radiometer cross-calibration. To facilitate the cross-calibration, the GMI brightness temperatures were translated to yield an equivalent Tb prior to direct comparison with RapidScat using the RTM. The Tb differences were analyzed seasonally as a function of ocean brightness temperature and atmospheric models.
2. Materials and Calibration Method
In this work, RapidScat data have been extracted from the Level 2A (L2A) and Level 2B (L2B). The data products were generated by the Physical Oceanography Distributed Active Archive Center (PODAAC) at the Jet Propulsion Laboratory [10]. The data products come in three versions, 1.1, 1.2, and 1.3, with 1.2 replacing 1.1 after 15 August 2015; version 1.3 is intended as a replacement and continuation of the Version 1.1 and Version 1.2 data from 2 November 2016 [11]. For the Tb modeling, the surface truth parameters were extracted from the Global Data Assimilation System (GDAS) data product. GDAS global grids are updated every six hours at 0:00, 6:00, 12:00, and 18:00 UTC. The parameters listed in GDAS file include temperature, surface pressure, humidity, cloud liquid water, sea surface temperature, and wind vectors [12].
The goal of the RTM is to calculate the brightness temperature at the defined operating frequency and incidence angle. The RTM was used in this work to generate Tb at 13.4 GHz; then, global measured and modeled RapidScat Tbs could be compared for both polarizations. The environmental parameters of the ocean and atmosphere were prepared for the input to the RTM. The most important characteristic of the RTM is that it accurately captures the dynamics of the ocean Tb and environmental parameters. The three main RTM components that contribute to the Tb captured by a space-borne sensor are the apparent brightness temperature from radiometer measurements, the ocean surface brightness temperature, and the ocean surface which reflects the sky brightness with some loss. This is an incoherent summation from the atmosphere and surface [4,9].
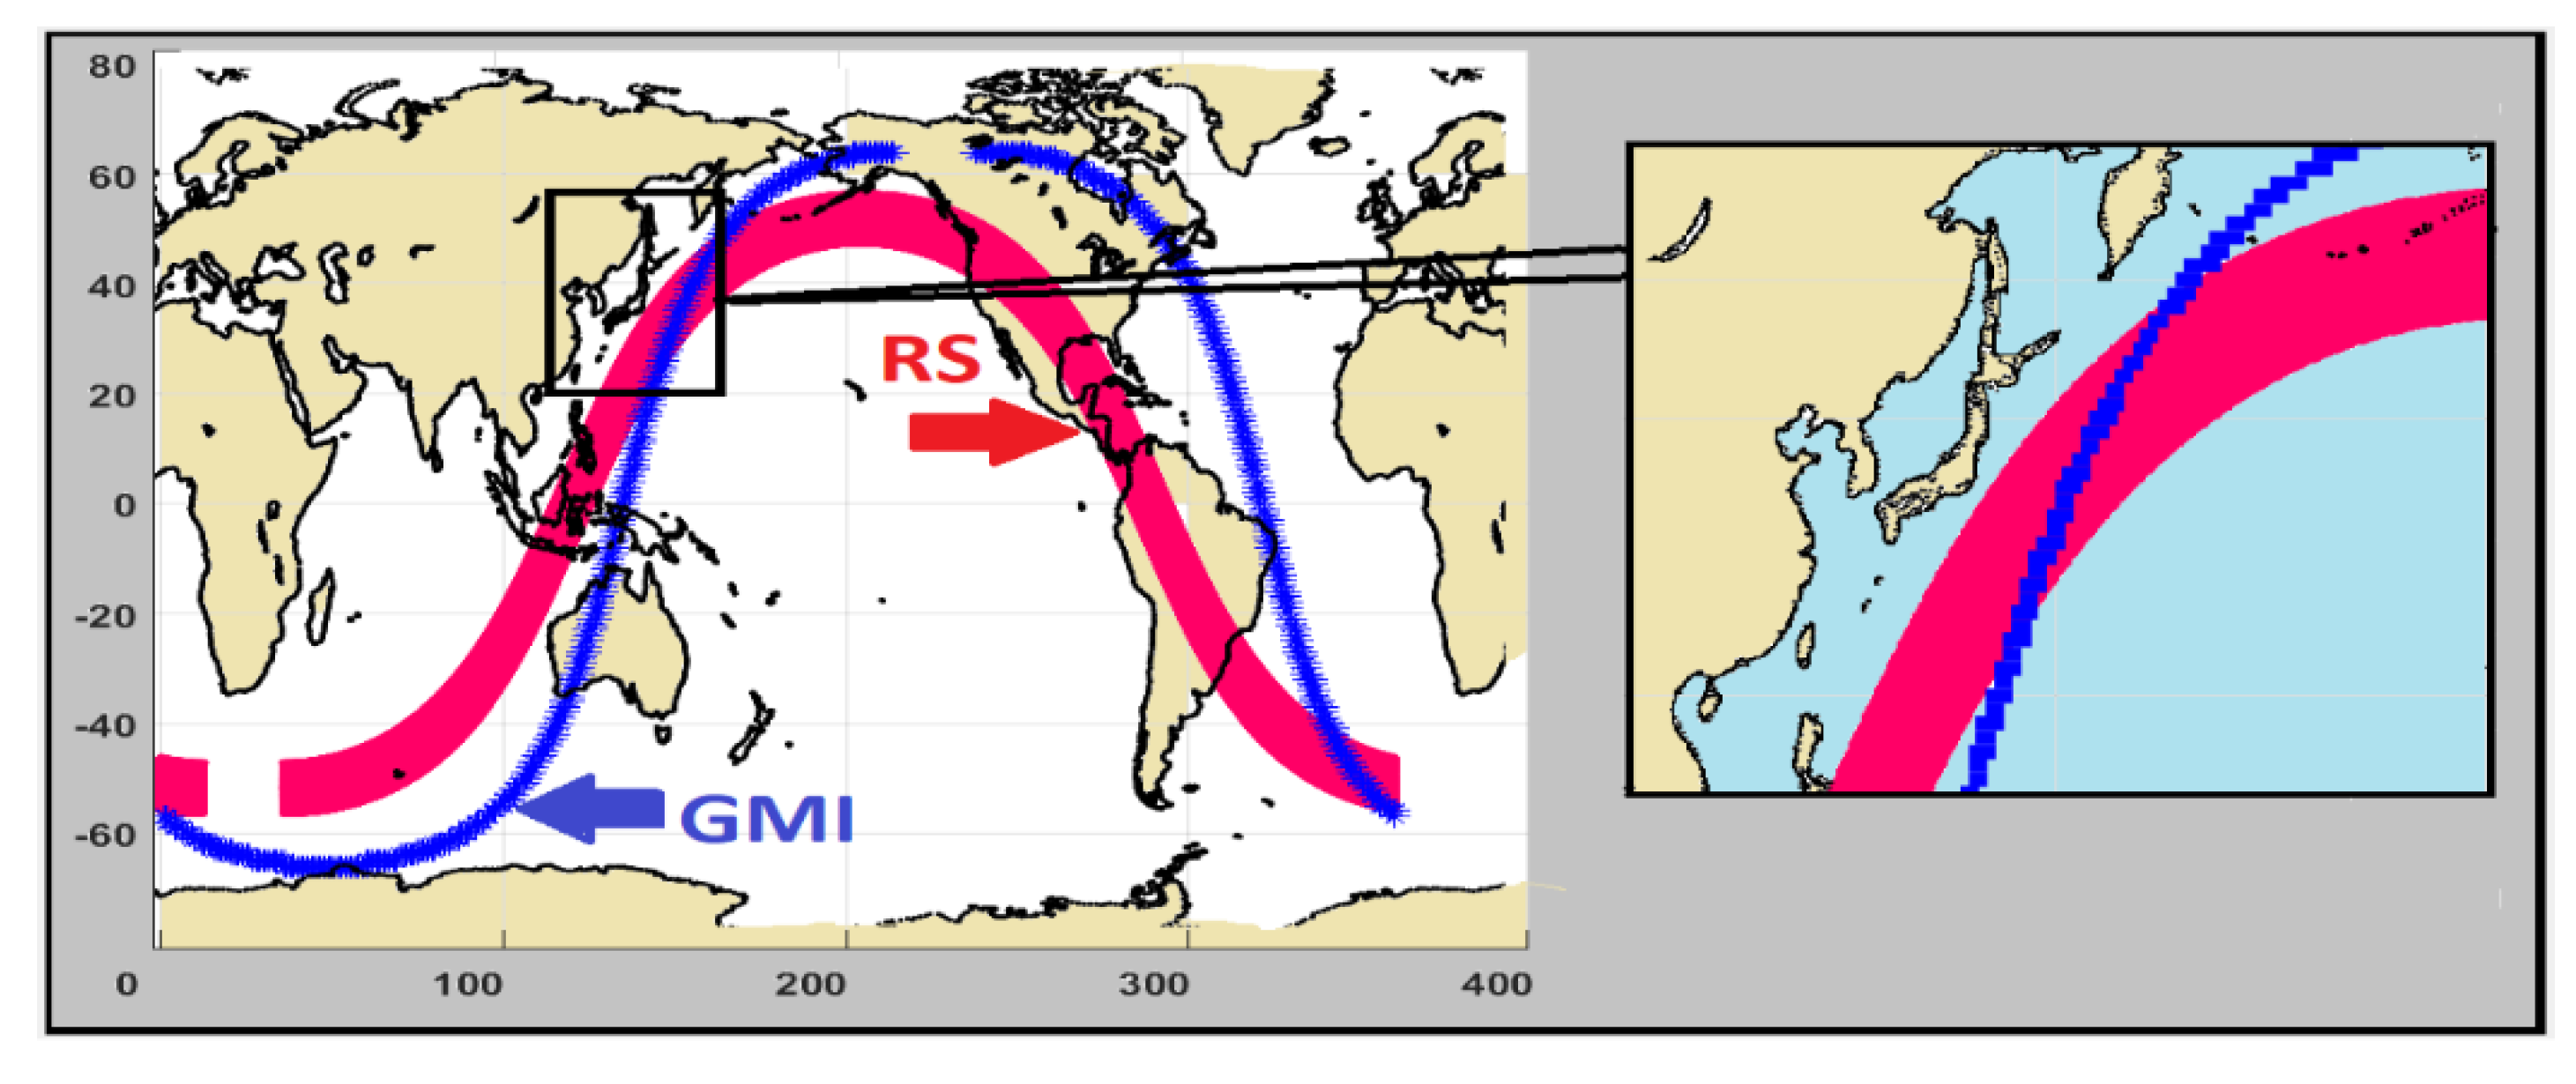
Examples of RapidScat and GMI orbits mapped over the globe are illustrated in Figure 1. This shows a wide RapidScat swath in red and the GMI orbit in blue. The wide RapidScat swath in Sun-asynchronous orbit allows collocation at different latitudes. For each collocated (RapidScat/GMI) data, there must be corresponding GDAS parameters within a ±60 min window. This temporal criterion eliminates about two-thirds of data or all data for which GDAS reference may not be valid (four GDAS daily files spanning in total an 8 h window to collocate with satellites).
The collocated (RS/GMI) brightness temperatures over a two-year period have a wide geographic coverage for ascending and descending passes. To ensure high-quality calibration/validation, this data set was spatially selected within 1° latitude x longitude boxes, using a conservative land, rain, and heavy cloud mask. These boxes were quality controlled and edited to remove non-homogenous ocean scenes and/or transient environmental conditions. The rain flag and rain impact from L2B were used to remove any 1° box with a rain rate higher than zero and when the GDAS indicated high water vapor (>60 mm). The final valid dataset consisted of the environmental parameters (GDAS) with incidence angle and measured vertical and horizontal Tbs (from L2A). Next, the RapidScat brightness temperature was compared to the GMI. The purpose of this technique was to find a radiometric calibration bias from one radiometer to another and thus to reduce the relative biases among the sensors [13].
The GMI is a non-Sun-synchronous, dual-polarization, conical-scanning, multi-channel (ranging from 10 to 183 GHz) radiometer and makes calibrated measurements at different wavelengths and polarizations [14]. For the Imager, the two lowest frequency channels at 10.65 GHz and 18.7 GHz bracket the RapidScat at 13.4 GHz; however, the incidence angles do not match. The GMI incidence angle is 52.8° for all channels; however, for RapidScat, the inner (H-pol) beam is 46°, and the outer (V-pol) beam is 54°. Thus, GMI Tbs were translated to yield an equivalent Tb prior to direct comparison with RapidScat [15,16]. The radiative transfer model was used to calculate the equivalent RS Tbs from GMI channels (10.65 and 18.7 GHz), to produce the equivalent 13.4 GHz at the corresponding RapidScat incidence angles. This process involved using a spectral ratio () parameter for both polarizations calculated as a function of water vapor, cloud liquid water, and sea surface temperature, which is defined by Equation (1):
where , are the modeled brightness temperatures for RS and GMI, respectively [17,18]. Using this ratio, the GMI brightness temperatures (10.65 and 18.7 GHz) were translated to the RapidScat equivalent Tb (13.4 GHz), as shown in Equation (2):
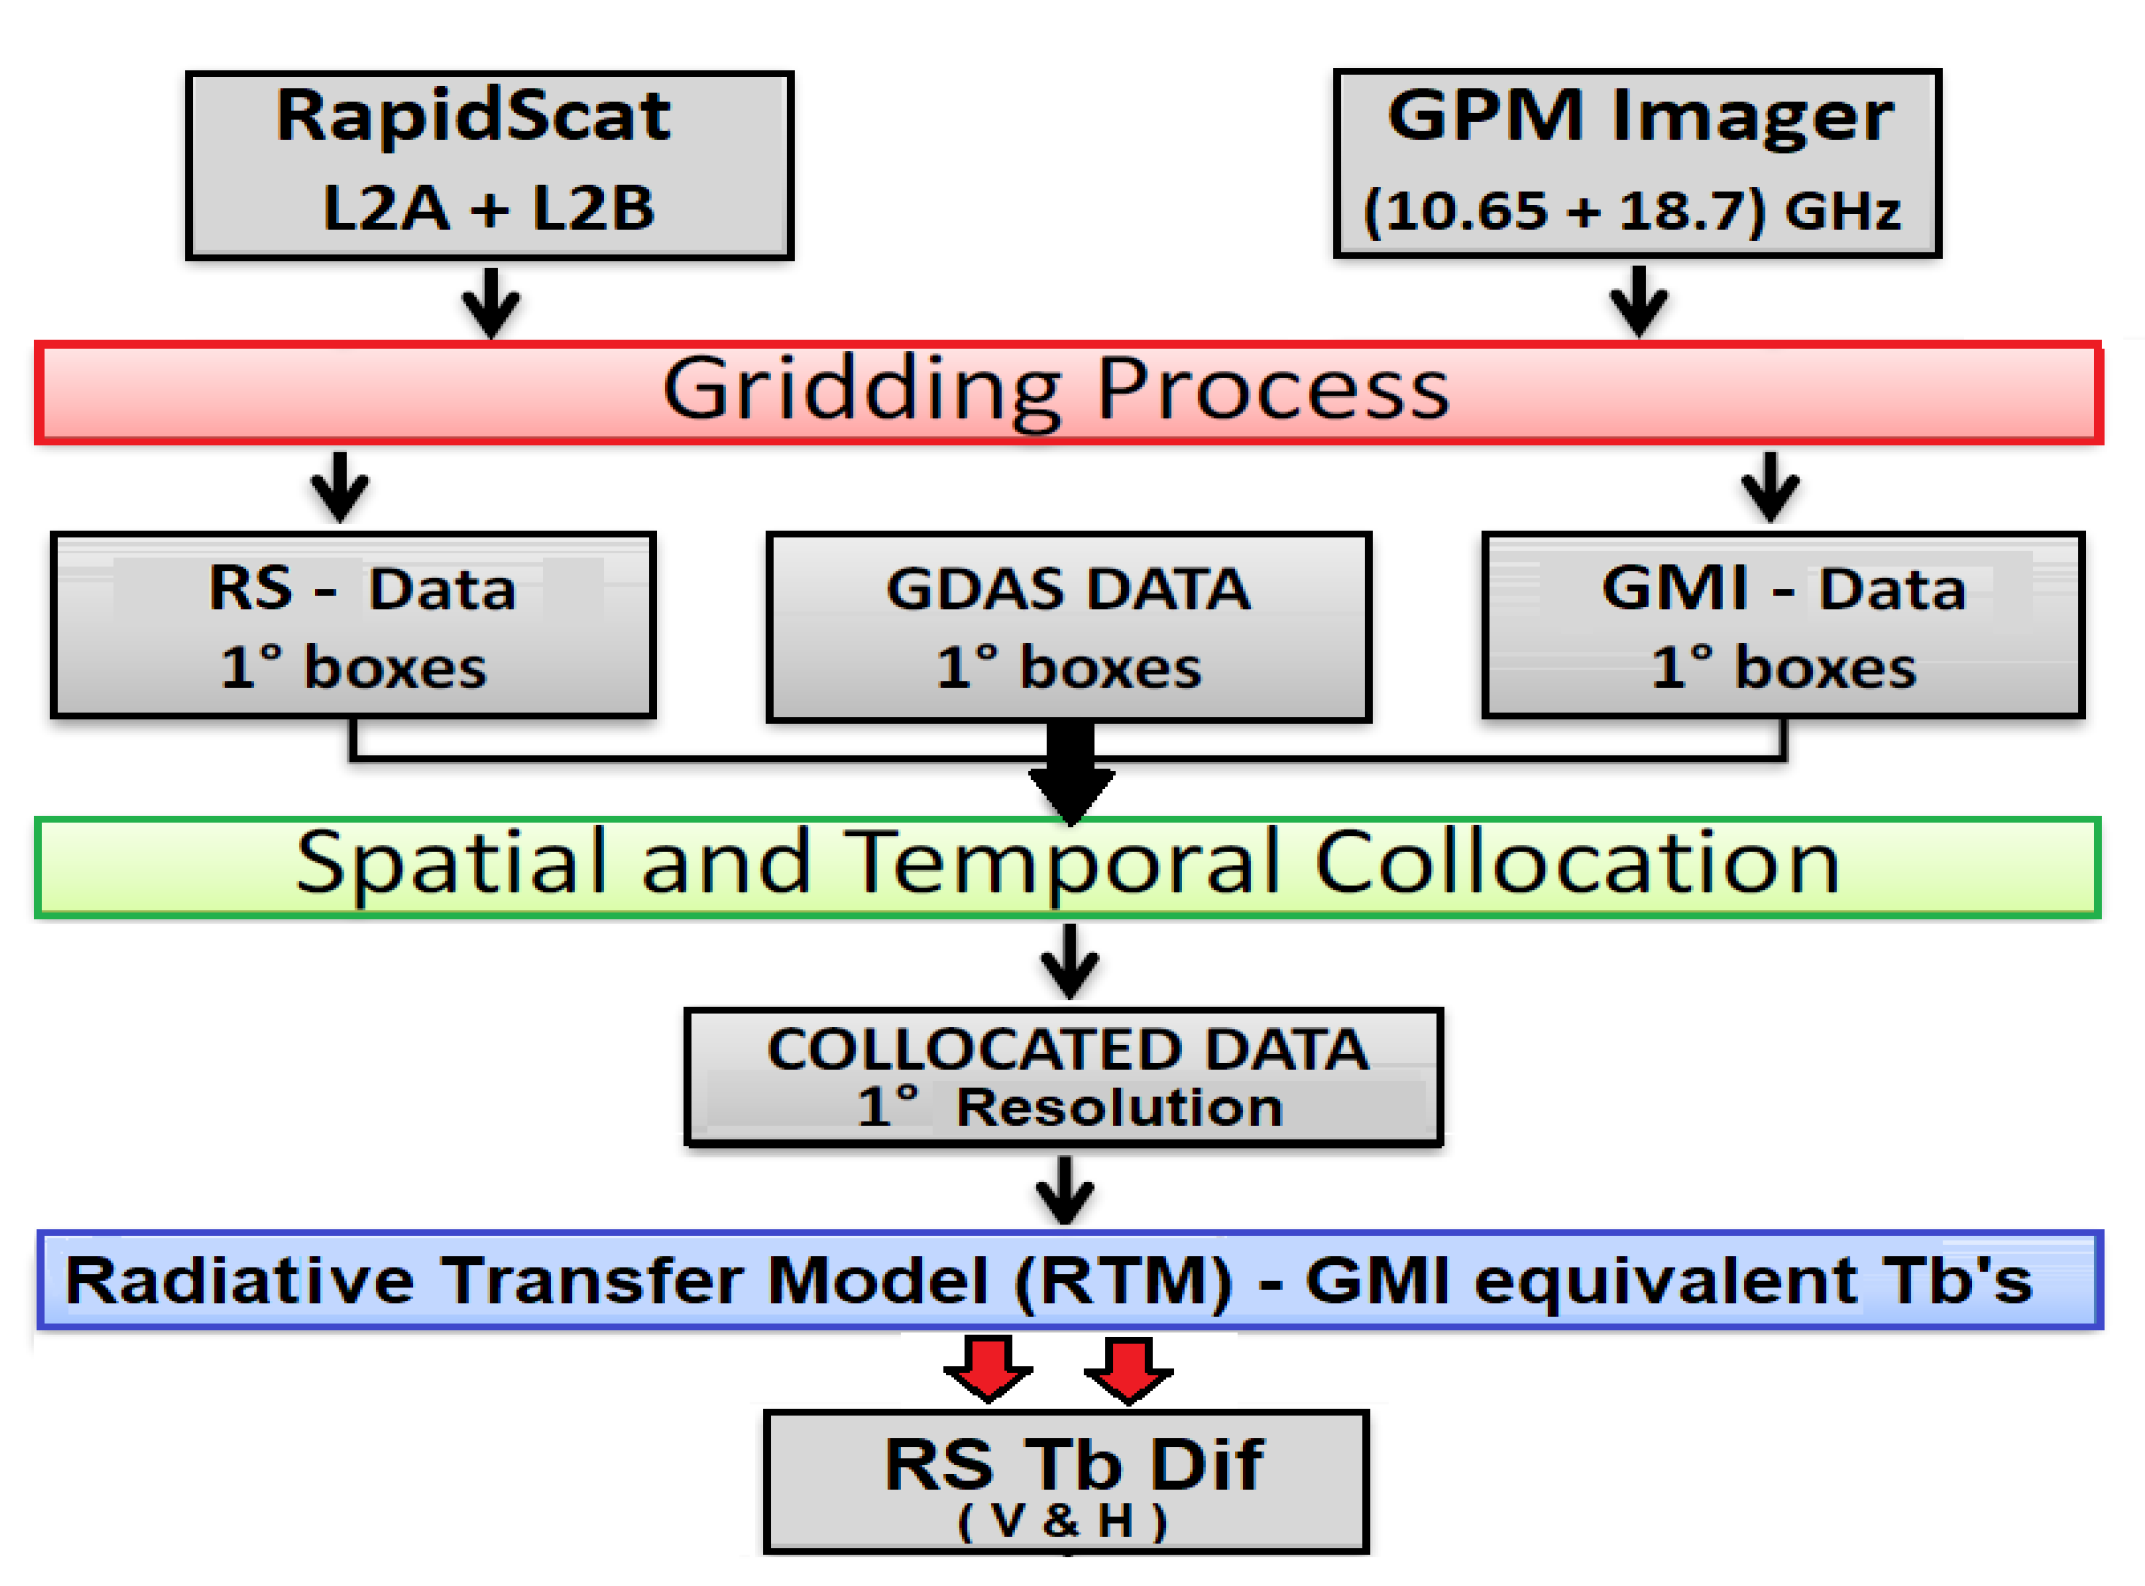
where are the observed brightness temperatures. By having the equivalent GHz Tbs (TB GMI eqv), the difference between the observed RapidScat and the equivalent GMI Tbs could be calculated by the Equation (3). Figure 2 summarizes the calibration procedure in a block diagram.
3. Results
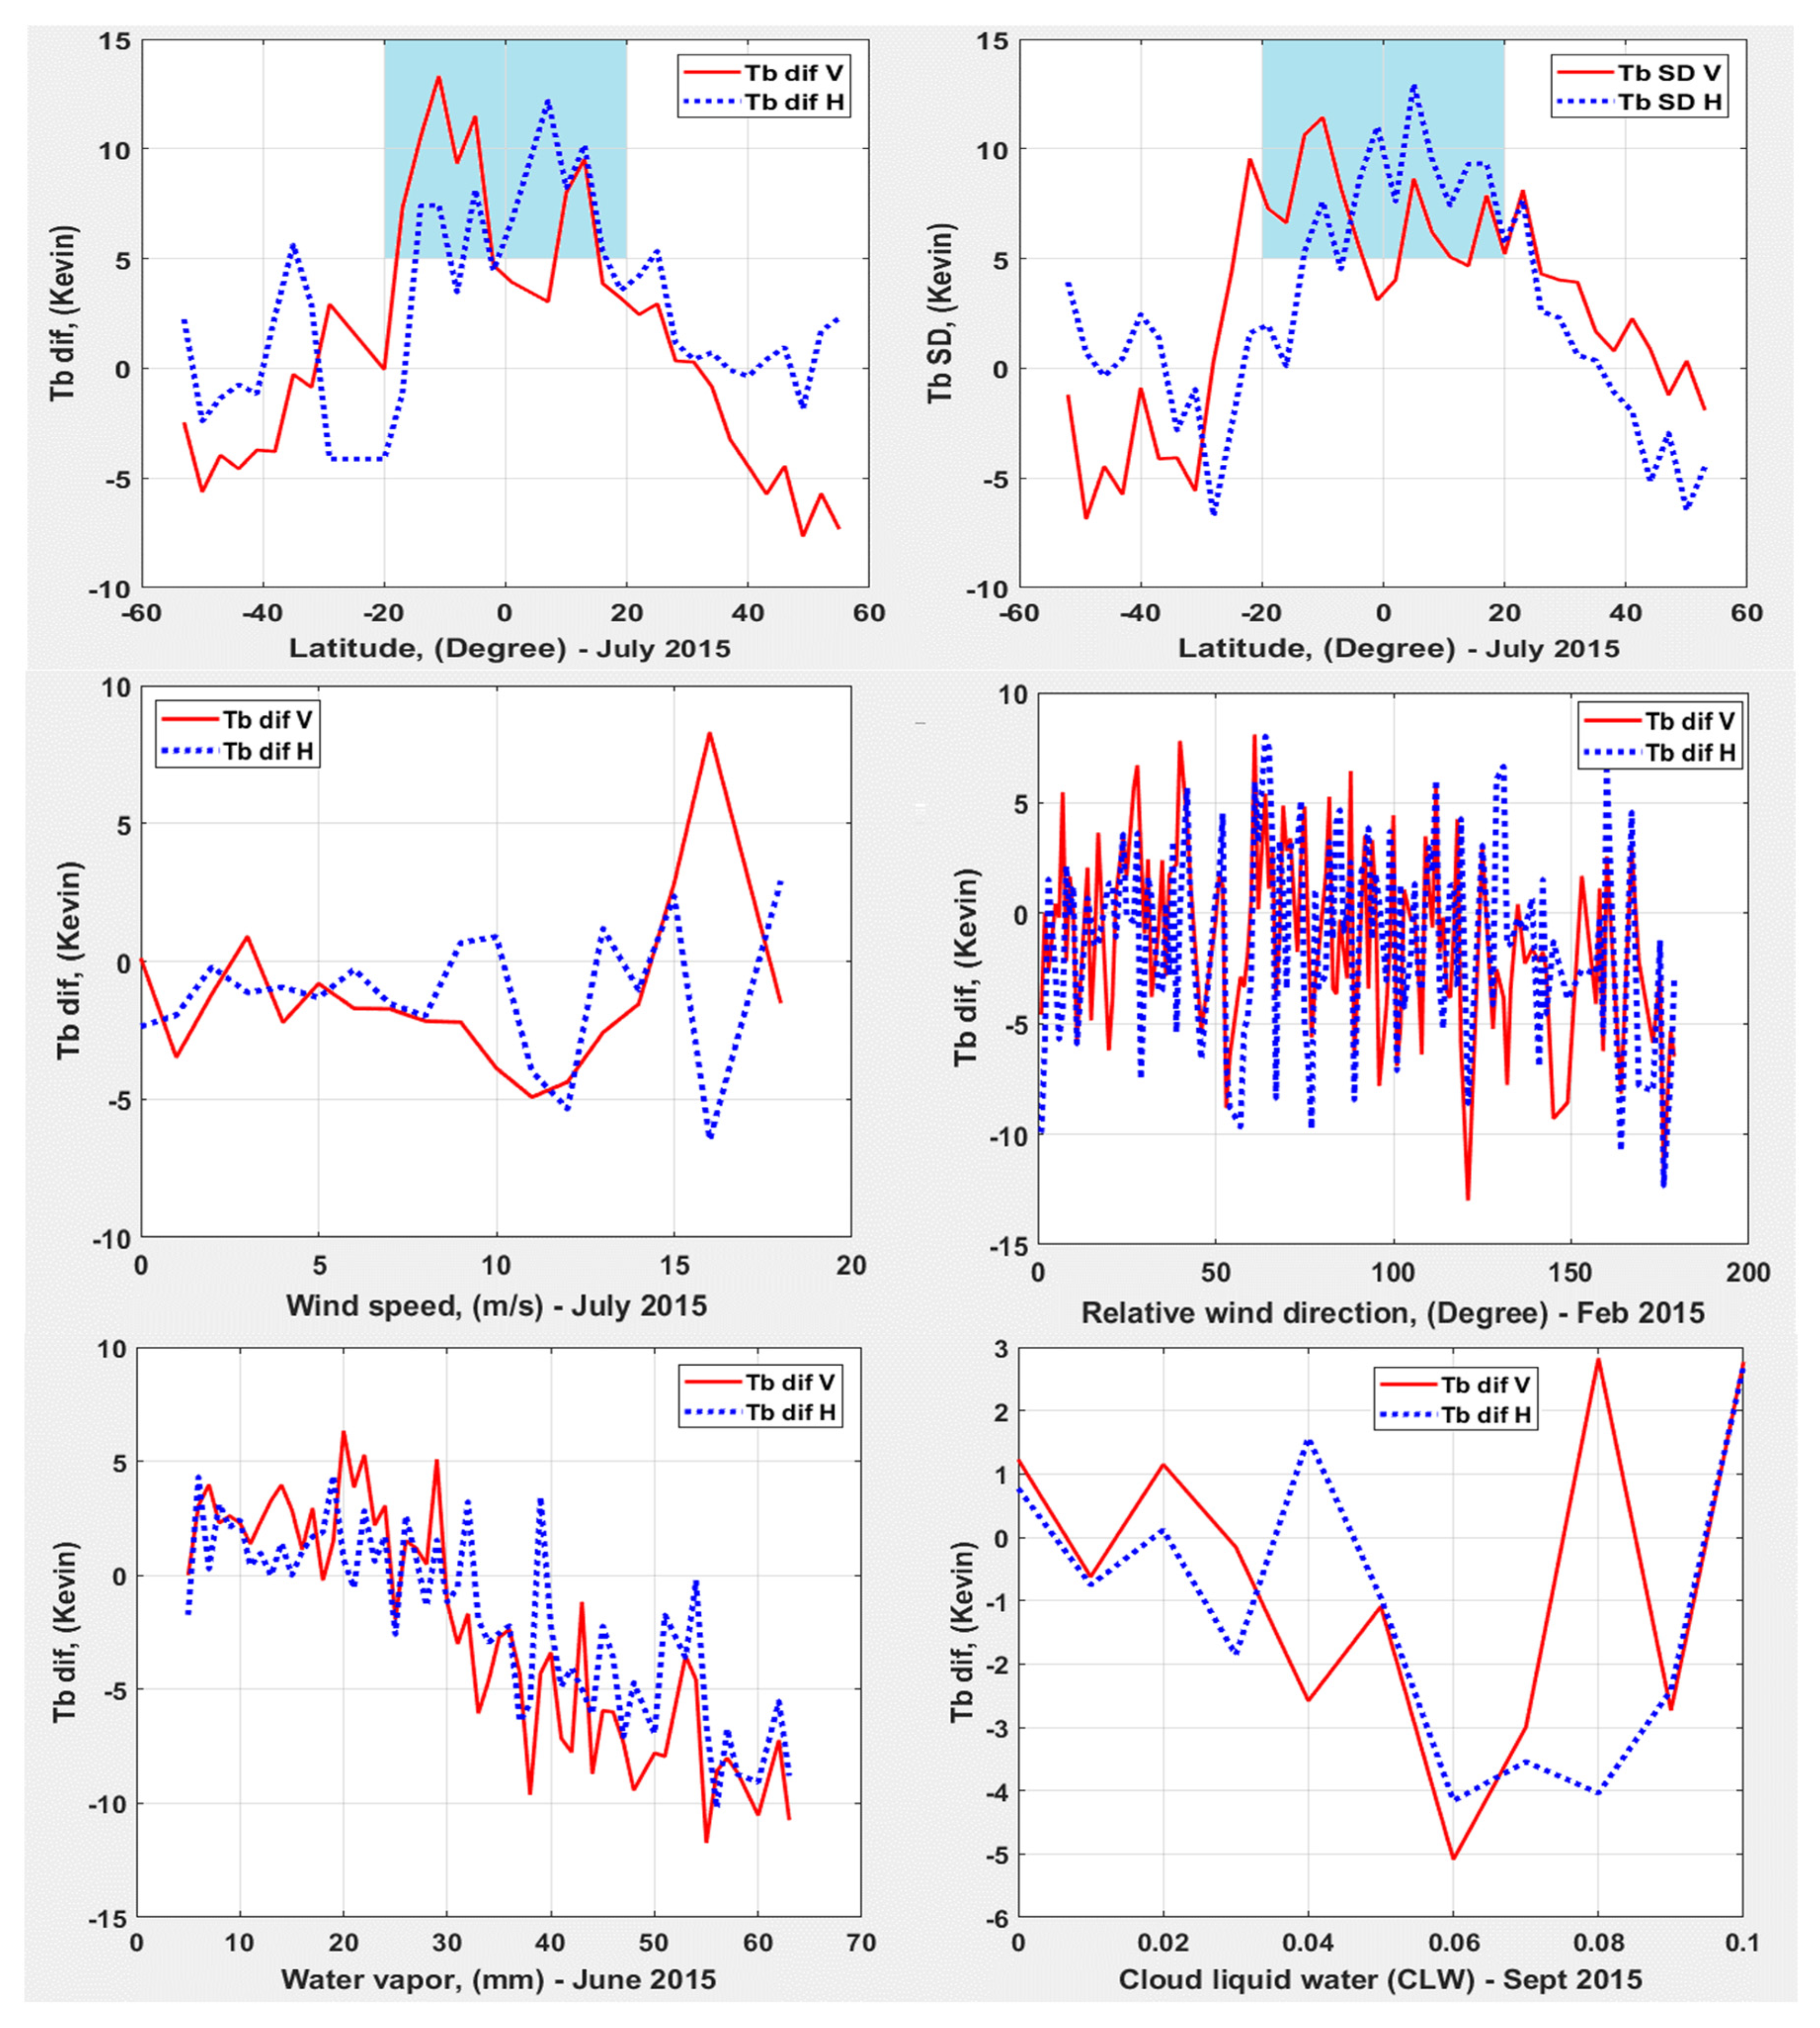
This section presents RapidScat/GMI Tb differences in arbitrary selected periods between January 2015 and August 2016. To assess the Tb difference affected by each parameter, geometry and environmental factors were precisely examined. In each of the processed datasets, an overall agreement between both polarizations was observed. Figure 3 summarizes the Tb differences as a function of wind speed in July 2015, relative wind direction in February 2015, water vapor in June 2015, and cloud liquid water in September 2015. In addition to the atmospheric and ocean brightness temperature models, latitude dependency was also investigated, as shown for July 2015. The horizontal axis represents the latitude over the oceans from 55° latitude south to 55° north (collocation region). The second and bottom windows present the average RapidScat/GMI Tb differences separated in horizontal (blue line) and vertical (red line) polarizations.
4. Discussion
To present latitude dependency, averages over longitude, known as zonal averages, were performed to form a latitude series (to reduce the Tb measurement standard deviation). The top panel in Figure 3 shows the averaged Tb differences of RapidScat/GMI (left), while the right panel presents the RapidScat Tb biases for both beams (Single Difference (SD): Tb measured − Tb modeled). It is noticeable that the highest differences were recorded in the same region between −20° to 20° latitude for both polarizations, as shown in the shaded area.
To evaluate RapidScat/GMI differences as a function of latitude, Tb difference dependence on wind speed (left) and relative wind direction (right) was investigated for both beams and presented in the second row of Figure 3. The difference variation changes in most circumstances were within ±3 K; however, there was an exception, especially for wind speeds above 10 m/s, where the Tb difference became higher. Moreover, the right panel captures the average Tb differences as a function of the relative wind direction. Differences at both polarizations followed the same pattern, and all the radiometric measured data in 2015 showed a good overall average agreement in both inner and outer beams, with the red and blue lines presenting the averaged Tb differences in the inner and outer beam, respectively.
The other environmental factor examined was the water vapor. The presence of water vapor in the atmosphere causes an increase in the brightness temperatures measured by microwave instruments. The bottom panel (left) of Figure 3 illustrates an example for June 2015. The examined periods showed a good agreement between the inner and the outer beam, but the Tb difference changed behavior from positive to negative when the water vapor exceeded 25 mm in both polarizations. Additionally, an analysis of the Tb differences versus the cloud liquid water (CLW) was examined. The plot on the bottom-right in Figure 3 shows Tb differences mostly within ±2 K, except for CLW values higher than 0.05 mm for both beams.
5. Conclusions
This paper describes the RapidScat’s passive mode with radiometer measurements to obtain the brightness temperature while simultaneously collecting normalized radar cross-section measurements by the active mode. This work presents differences between RapidScat and GPM Imager measured Tbs as a function of the main RTM environmental inputs. Wind Speed, relative wind direction, water vapor, and cloud liquid water are four major factors that affect microwave apparent brightness temperatures. To understand their contribution to the RapidScat Tb bias, those environmental factors were examined. The trends of the Tb deviation could be studied by this method to assess the Tb bias affected by each parameter.
The results obtained from two years of observations indicate that most of the measured data in 2015 show good overall average agreement. Also, it can be concluded that RapidScat brightness temperature is a reliable source of data and it satisfies the accuracy requirements, despite Tb not being RapidScat’s primary data product. The data used in the validation were collected from the entire RapidScat’s mission. Further analysis of the RapidScat measurement set may help estimate the relative validity and stability of other scatterometers/radiometers.
Author Contributions
This research was designed and guided by Josko Zec. Ali Al-Sabbagh and Ruaa Alsabah performed, analyzed, and discussed the research data. All authors helped in improving this paper. All authors have read and agreed to the published version of the manuscript.
Acknowledgments
This research was performed under the grant NNX15AT70G from the NASA Headquarters. Both L2A and L2B RapidScat datasets were provided by the NASA Physical Oceanography Distributed Active Archive Center (PODAAC) at the Jet Propulsion Laboratory (https://podaac.jpl.nasa.gov/). The authors also wish to acknowledge the collaboration with W. Linwood Jones at Central Florida Remote Sensing Laboratory, University of Central Florida.
Conflicts of Interest
The authors declare no conflict of interest.
References
- Zec, J.; Jones, W.L.; Alsabah, R.; Al-Sabbagh, A. RapidScat Cross-Calibration Using the Double Difference Technique. Remote Sens. 2017, 9, 1160. [Google Scholar] [CrossRef]
- Alsabah, R.; Al-Sabbagh, A.; Zec, J. Calibration of RapidScat scatterometer. In Proceedings of the IEEE Microwaves, Radar and Remote Sensing Symposium (MRRS), Kiev, Ukraine, 29–31 August 2017; pp. 249–252. [Google Scholar]
- Al-Sabbagh, A.; Alsabah, R.; Zec, J. Calibration of RapidScat Brightness Temperature. In Proceedings of the MIT-15th meeting of Microwave Radiometry and Remote Sensing of the Environment (MicroRad), Cambridge, MA, USA, 27–30 March 2018. [Google Scholar]
- Jones, W.; Mehershahi, L.R.; Zec, J.; Long, D.G. SeaWinds on QuikSCAT radiometric measurements and calibration. In Proceedings of the IEEE International Geoscience and Remote Sensing Symposium, IGARSS 2000, Honolulu, HI, USA, 24–28 July 2000; Volume 3, pp. 1027–1029. [Google Scholar]
- Durden, S.L.; Perkovic-Martin, D. The RapidScat Ocean Winds Scatterometer: A Radar System Engineering Perspective. IEEE Geosci. Remote Sens. Mag. 2017, 5. [Google Scholar] [CrossRef]
- Wentz, F.J.; Ricciardulli, L.; Rodriguez, E.; Stiles, B.W.; Bourassa, M.A.; Long, D.G.; Hoffman, R.N.; Stoffelen, A.; Verhoef, A.; O’Neill, L.W.; et al. Evaluating and extending the ocean wind climate data record. IEEE J. Sel. Top. Appl. Earth Obs. Remote Sens. 2017, 10, 2165–2185. [Google Scholar] [CrossRef] [PubMed]
- Paget, C.A.; Long, G.D.; Madsen, N.M. RapidScat Diurnal Cycles Over Land. IEEE Trans. Geosci. Remote Sens. 2016, 54, 3336–3344. [Google Scholar] [CrossRef]
- Madsen, N.M.; Long, D.G. Calibration and validation of the RapidScat scatterometer using tropical rainforests. IEEE Trans. Geosci. Remote Sens. 2016, 54, 2846–2854. [Google Scholar] [CrossRef]
- Biswas, K.S.; Farrar, S.; Gopalan, K.; Santos-Garcia, A.; Jones, W.L.; Bilanow, S. Intercalibration of microwave radiometer brightness temperatures for the global precipitation measurement mission. IEEE Trans. Geosci. Remote Sens. 2013, 51, 1465–1477. [Google Scholar] [CrossRef]
- Shen, Y. ISS-RapidSca. 2015. Available online: https://www.nasa.gov/mission_pages/station/research/experiments/1067.html (accessed on 20 July 2016).
- RapidScat Project. RapidScat Level 2A Surface Flagged Sigma-0 and Attenuations in 12.5 Km Swath Grid Version 1.2. Ver. 1.2; PO.DAAC: Pasadena, CA, USA, 2016; Available online: http://dx.doi.org/10.5067/RSX12-L2A12 (accessed on 20 July 2016).
- Climate Prediction Center. National Centers for Environmental Prediction. National Oceanic and Atmospheric Administration (NOAA). Available online: http://www.ncep.noaa.gov/ (accessed on 20 July 2016).
- Rafik, H. Validation of QuickSCAT Radiometer (QRad) Microwave Brightness Temperature Measurements. Ph.D. Thesis, University of Central Florida, Orlando, FL, USA, 2009. [Google Scholar]
- Chen, R.; Ebrahimi, H.; Jones, W.L. Creating a Multidecadal Ocean Microwave Brightness Dataset: Three-Way Intersatellite Radiometric Calibration Among GMI, TMI, and WindSat. IEEE J. Sel. Top. Appl. Earth Obs. Remote Sens. 2017, 10, 2623–2630. [Google Scholar] [CrossRef]
- Rafik, H.; Jones, W.L. Brightness temperature validation for SeaWinds radiometer using Advanced Microwave Scanning Radiometer on ADEOS-II. In Proceedings of the IEEE International Geoscience and Remote Sensing Symposium, Barcelona, Spain, 23–28 July 2007. [Google Scholar]
- Rafik, H.; Jones, L. Inter-Satellite Radiometric Calibration for a Satellite Radar Scatterometer. Proc. SPIE 2010, 7691, 769102. [Google Scholar] [CrossRef]
- Mayank, R.; Jones, W.L.; Park, J.D.; Adams, I. Seawinds radiometer (SRad) on ADEOS-II brightness temperature calibration/validation. In Proceedings of the IEEE International Geoscience and Remote Sensing Symposium, IGARSS’05, Seoul, South Korea, 29 July 2005; Volume 5, pp. 3441–3444. [Google Scholar]
- Mayank, R.; Jones, W.L.; Adams, I. SeaWinds radiometer (SRad) brightness temperature calibration and validation. In Proceedings of the IEEE SoutheastCon, Ft. Lauderdale, FL, USA, 8–10 April 2005; pp. 287–295. [Google Scholar]
Figure 1.
RapidScat/GPM Imager collocations.

Figure 2.
Radiometric Calibration Process. RS: RapidScat, GDAS: Global Data Assimilation System, GMI: GPM Microwave Imager, Tb: brightness temperature.
Figure 2.
Radiometric Calibration Process. RS: RapidScat, GDAS: Global Data Assimilation System, GMI: GPM Microwave Imager, Tb: brightness temperature.

Figure 3.
Tb differences/biases as a function of latitude (top), of wind speed and relative wind direction (middle), and of water vapor and cloud liquid water (bottom-right).
Figure 3.
Tb differences/biases as a function of latitude (top), of wind speed and relative wind direction (middle), and of water vapor and cloud liquid water (bottom-right).

Publisher’s Note: MDPI stays neutral with regard to jurisdictional claims in published maps and institutional affiliations. |
© 2018 by the authors. Licensee MDPI, Basel, Switzerland. This article is an open access article distributed under the terms and conditions of the Creative Commons Attribution (CC BY) license (https://creativecommons.org/licenses/by/4.0/).
Share and Cite
MDPI and ACS Style
Al-Sabbagh, A.; Alsabah, R.; Zec, J. Radiometric Calibration of RapidScat Using the GPM Microwave Imager. Proceedings 2018, 2, 324. https://doi.org/10.3390/ecrs-2-05137
AMA Style
Al-Sabbagh A, Alsabah R, Zec J. Radiometric Calibration of RapidScat Using the GPM Microwave Imager. Proceedings. 2018; 2(7):324. https://doi.org/10.3390/ecrs-2-05137
Chicago/Turabian StyleAl-Sabbagh, Ali, Ruaa Alsabah, and Josko Zec. 2018. "Radiometric Calibration of RapidScat Using the GPM Microwave Imager" Proceedings 2, no. 7: 324. https://doi.org/10.3390/ecrs-2-05137