Reverse Weighted-Permutation Entropy: A Novel Complexity Metric Incorporating Distance and Amplitude Information †


School of Automation and Information Engineering, Xi’an University of Technology, Xi’an 710048, Shaanxi, China
†
Presented at the 5th International Electronic Conference on Entropy and Its Applications, 18–30 November 2019; Available online: https://ecea-5.sciforum.net/.
Proceedings 2020, 46(1), 1; https://doi.org/10.3390/ecea-5-06688
Published: 17 November 2019
(This article belongs to the Proceedings of The 5th International Electronic Conference on Entropy and Its Applications)
Abstract
:Permutation entropy (PE), as one of the effective complexity metrics to represent the complexity of time series, has the merits of simple calculation and high calculation efficiency. In view of the limitations of PE, weighted-permutation entropy (WPE) and reverse permutation entropy (RPE) were proposed to improve the performance of PE. WPE introduces amplitude information to weigh each arrangement pattern, it can not only better reveal the complexity of time series with a sudden change of amplitude, but it also has better robustness to noise; by introducing distance information, RPE is defined as the distance to white noise, it has the reverse trend to traditional PE and has better stability for time series of different lengths. In this paper, we propose a novel complexity metric incorporating distance and amplitude information, and name it reverse weighted-permutation entropy (RWPE), which incorporates the advantages of both WPE and RPE. Three simulation experiments were conducted, including mutation signal detection testing, robustness testing to noise based on complexity, and complexity testing of time series with various lengths. The simulation results show that RWPE can be used as a complexity metric, which has the ability to accurately detect the abrupt amplitudes of time series and has better robustness to noise. Moreover, it also shows greater stability than the other three kinds of PE for time series with various lengths.
1. Introduction
Permutation entropy (PE) was first brought forward by
Bandt and Pompe in a seminal paper [1]. It introduced
a simple and robust symbolic method that takes into account arrangement
patterns of time series by comparing neighboring values of time series. The
theoretical advantages of PE promote its application in practical problems [2]. Some typical applications of PE can be found in
the medical
area [3], where it has been used to represent different
states of human organs, including neuron, brain and heart. In addition, more
applications can also be found in the fields of economics [4,5], mechanical engineering [6,7] and underwater acoustics [8,9]. The development of PE includes two aspects: One
is the expansion of its application in different fields, the other is the
improvement of PE theory. Many researchers have proposed improved PEs based on
the limitations of PE.
In 2013, weighted-permutation entropy (WPE) was proposed
and applied to electroencephalogram (EEG) data analysis by Fadlallah [10]. In 2017, Bandt proposed a new version of PE
with a reverse trend to existing PEs—we name it reverse PE (RPE) [11] in this paper. RPE is defined as the distance
to white noise and has better stability for time series of different lengths. WPE
and RPE have their own edges in indicating the complexity of time series from different
angles. In order to keep and enhance the advantages of WPE and RPE, we propose
a novel complexity metric incorporating distance and amplitude information and
name it reverse weighted-permutation entropy (RWPE). Three simulation
experiments have been carried out to demonstrate validity of RWPE by analysis
and comparison with PE, WPE and RPE.
2. Reverse Weighted-Permutation Entropy
The specific steps of RWPE are as follows:
- Step 1: Phase space reconstruction.
For a time series with values, we reconstruct into , embedding vectors with the time delay and embedding dimension , respectively. The matrix consisting of all
embedding vectors can be represented as follows:
In Formula (1), each row vector of the matrix corresponds to an embedding vector successively, and the number of embedding vectors is .
- Step 2: Ascending order.
We can rearrange each embedding vector in ascending order as follows:
When two values of the
same embedding vector are equal as follows:
Their arrangement depends
on their own temporal order as follows:
Hence, we can obtain original
patterns of embedding vectors as follows:
where is one of the original patterns.
- Step 3: Entropy calculation.
- (1)
- Probability calculation.
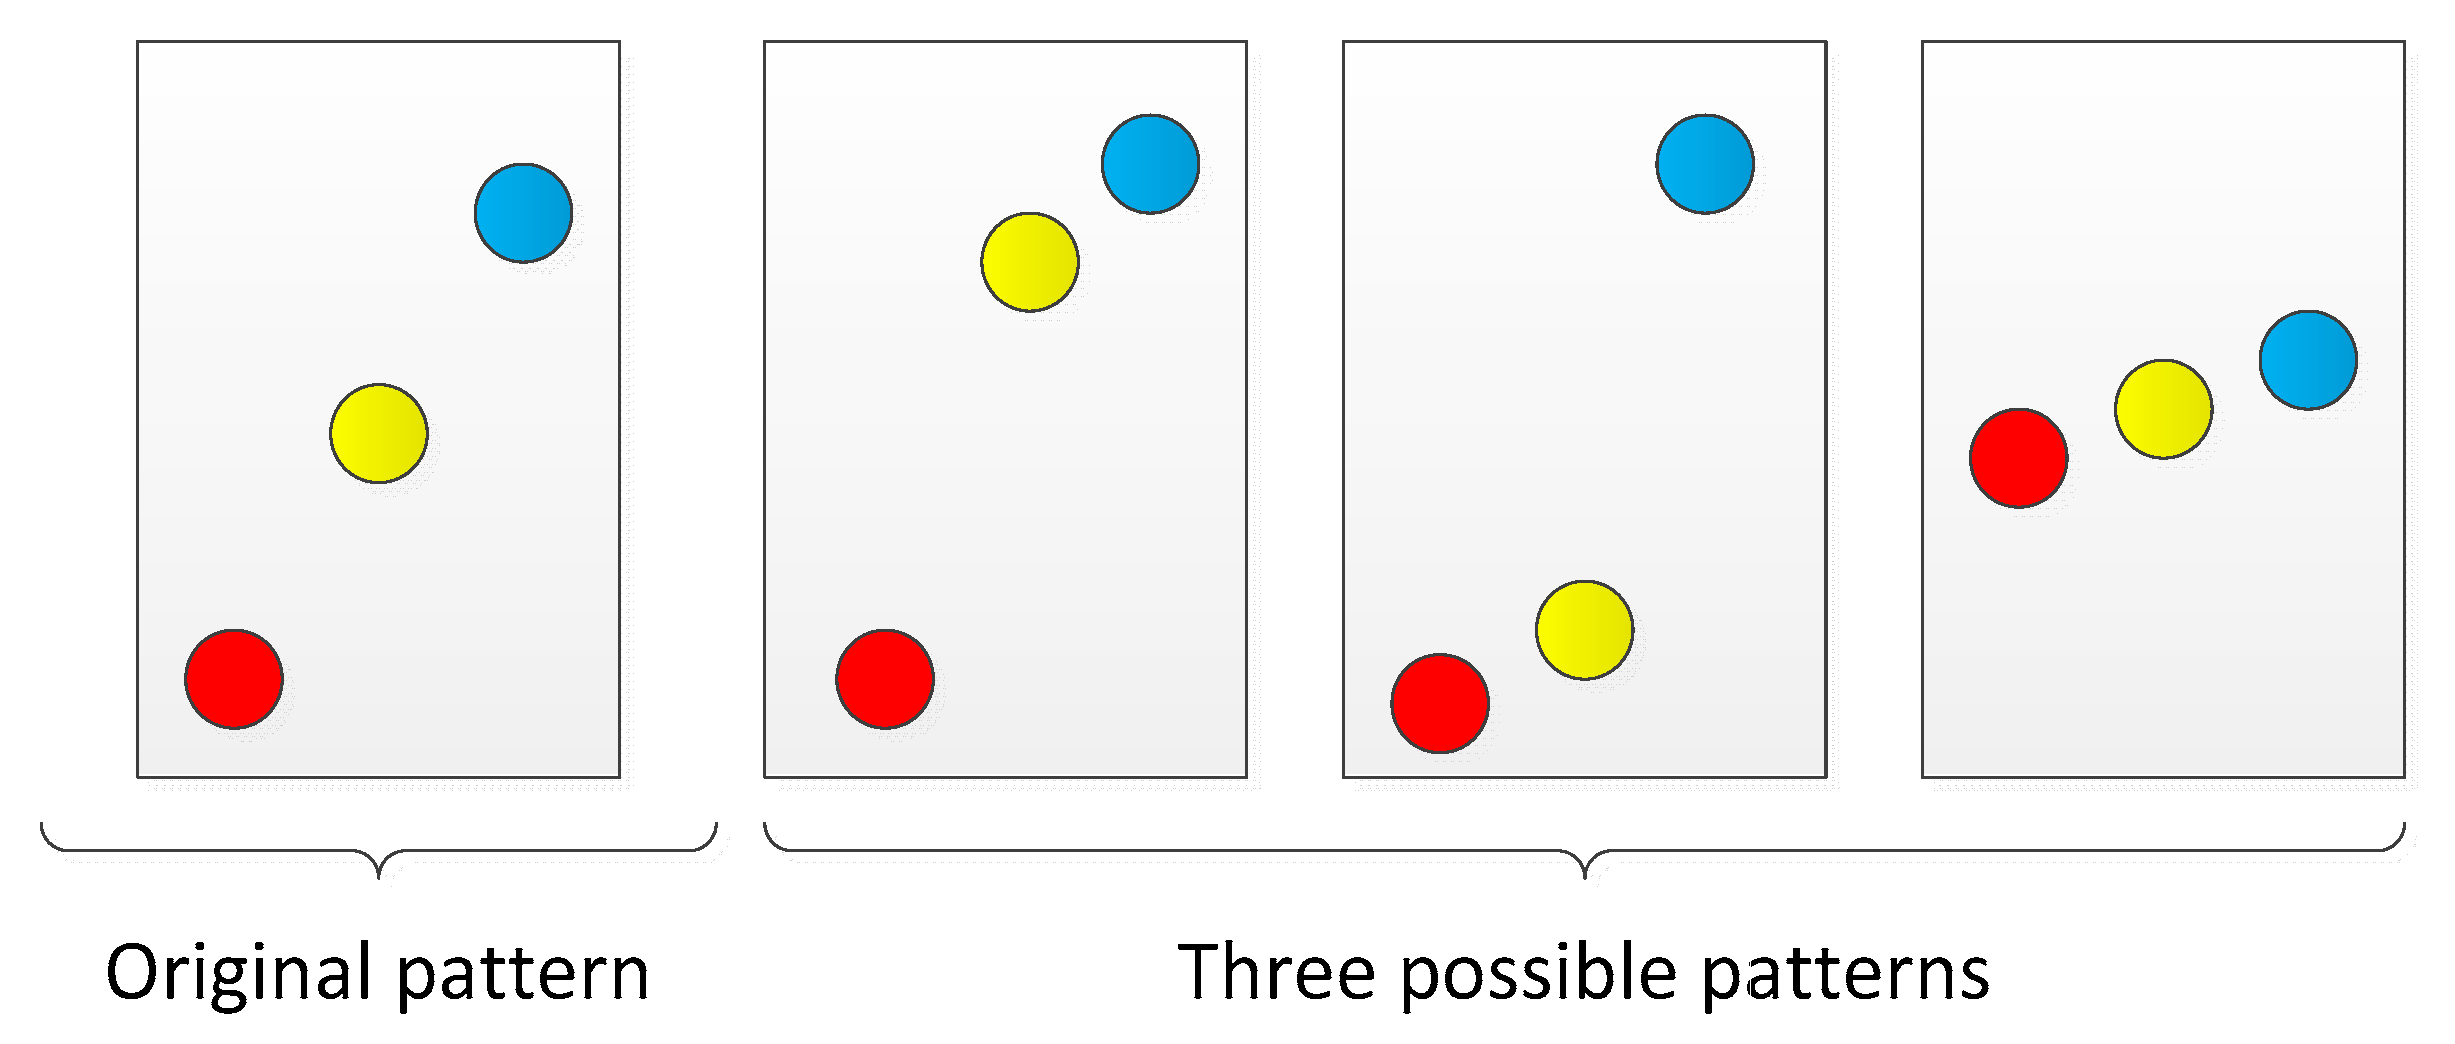
Since an original pattern corresponds to several possible patterns, we introduce amplitude information to calculate the probabilities of original patterns on the basis of WPE. For example, Figure 1 is an original pattern and its corresponding three possible patterns ().
We introduce amplitude information by weighting each embedding vector, weight value of the embedding vector can be expressed as
follows:
where corresponds to the -th possible pattern of the -th original pattern, is the mean of , and is the weight value of by calculating the variance of . The frequency for the -th original pattern can be
expressed as:
where is the number of possible patterns of the -th original pattern, and is the frequency of the -th possible pattern. Then, the probability of the -th original pattern can be
represented as:
- (2)
- Calculation formula.
We define RWPE as the
distance to white noise based on RPE by introducing distance information. Therefore,
RWPE can be expressed as:
When , the value of is 0 (minimum value).
3. Simulations
3.1. Simulation 1
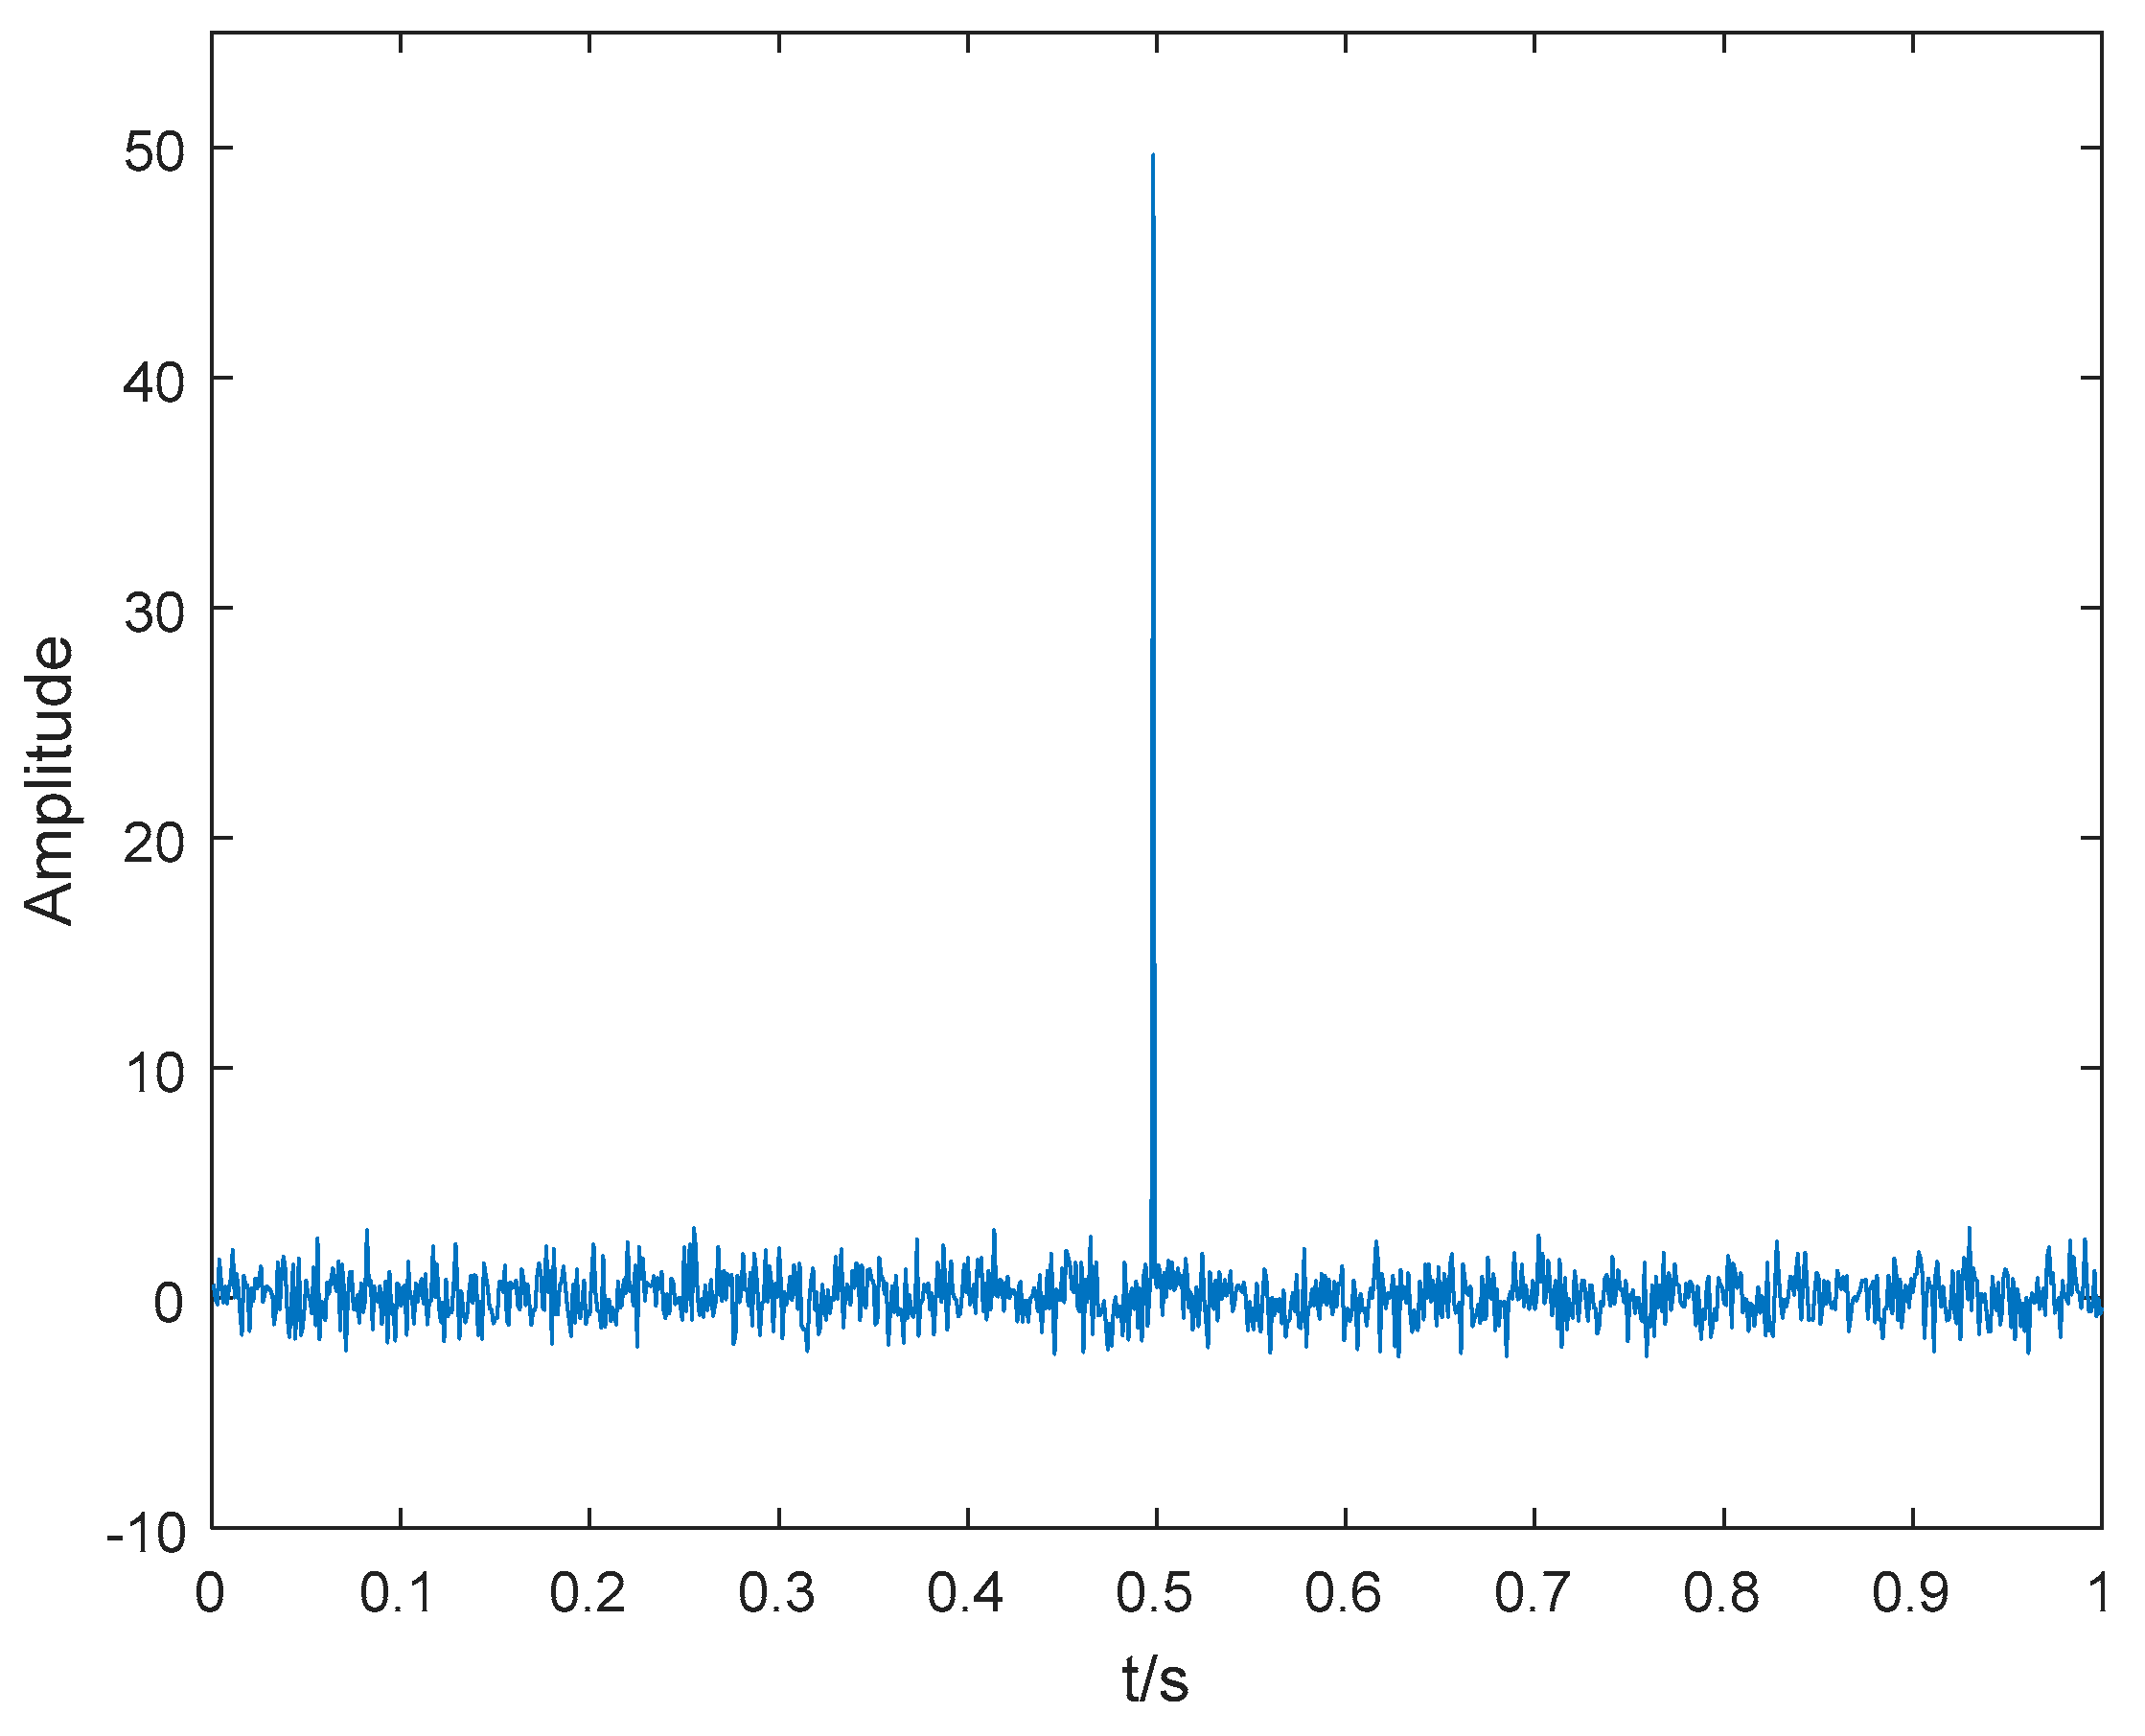
Mutation signal detection is carried out to verify the performance of RWPE. The synthetic signals are as follows:
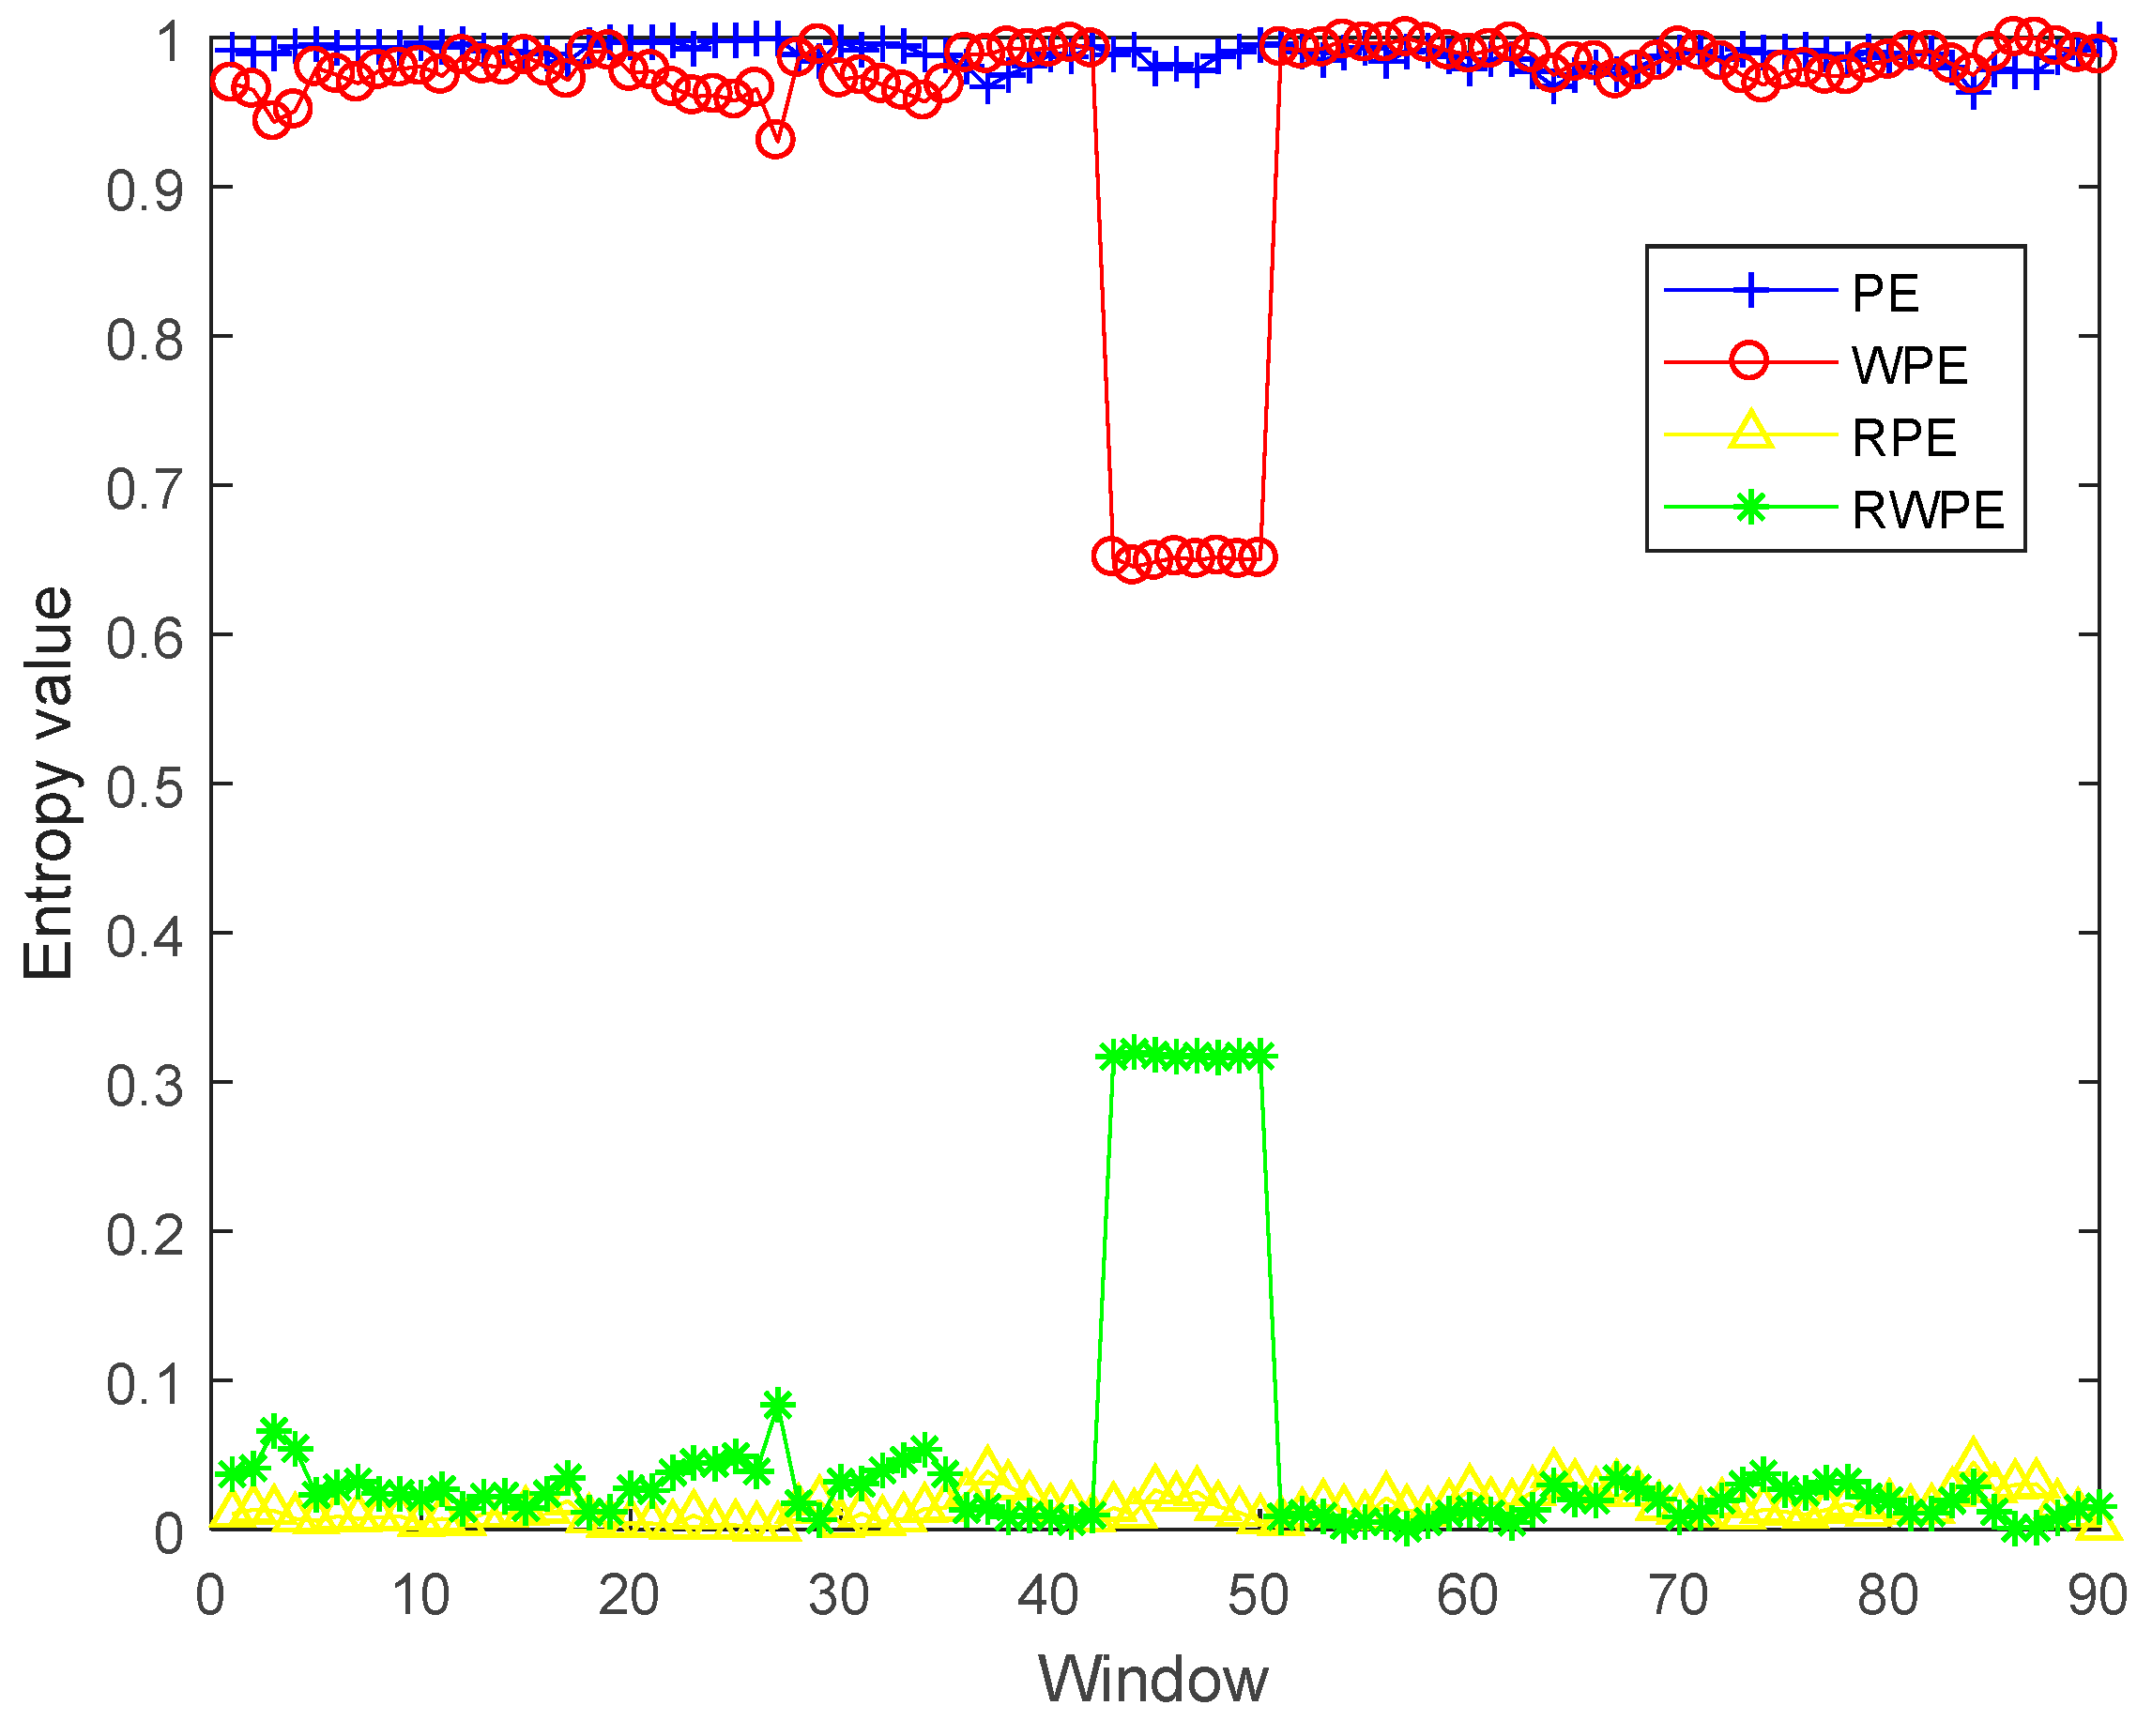
where the synthetic signal consists of impulse signal and white Gaussian noise with the sampling frequency of 1 KHz. The time domain waveform of synthetic signal is shown in Figure 2. We compute the values of PE, WPE, RPE and RWPE using sliding windows of 80 samples with 70 overlapped samples, the embedding dimension and time delay are 3 and 1, respectively. Figure 3 shows the four entropies of synthetic signal . As seen in Figure 3, the values of WPE and RWPE decrease and increase significantly in the windows containing the impulse signal, the values of PE and RPE remain steady in all windows. Table 1 shows the four entropies in the windows from 42 to 51. As seen in Figure 3 and Table 1, the impulse signal is in the windows from 43 to 50, the entropies incorporating amplitude information are obviously different from the ones without amplitude information, and WPE change is in the opposite direction from RWPE. The simulation results show that WPE and RWPE have better performance than PE and RPE in mutation signal detection.
3.2. Simulation 2
Robustness testing to noise is carried out to verify the performance of RWPE. We use the same impulse signal in the Simulation 1, the synthetic signals with different signal-to-noise ratios (SNRs) can be obtained by adding white Gaussian noise to . The embedding dimension and time delays are 3 and 1, respectively. Figure 4 shows the four entropies of synthetic signal under different SNRs, each entropy value is the average of 1000 calculations. As seen in Figure 4, the values of PE and RPE are relatively stable under different SNRs and close to 1 and 0, respectively; the entropies incorporating amplitude information respond to changes in SNR, the influence of noise on complexity decreases with the increase of SNR, the values of WPE and RWPE are monotonically decreasing and increasing. The testing results indicate that RWPE and WPE have better robustness to noise than PE and RPE.
3.3. Simulation 3
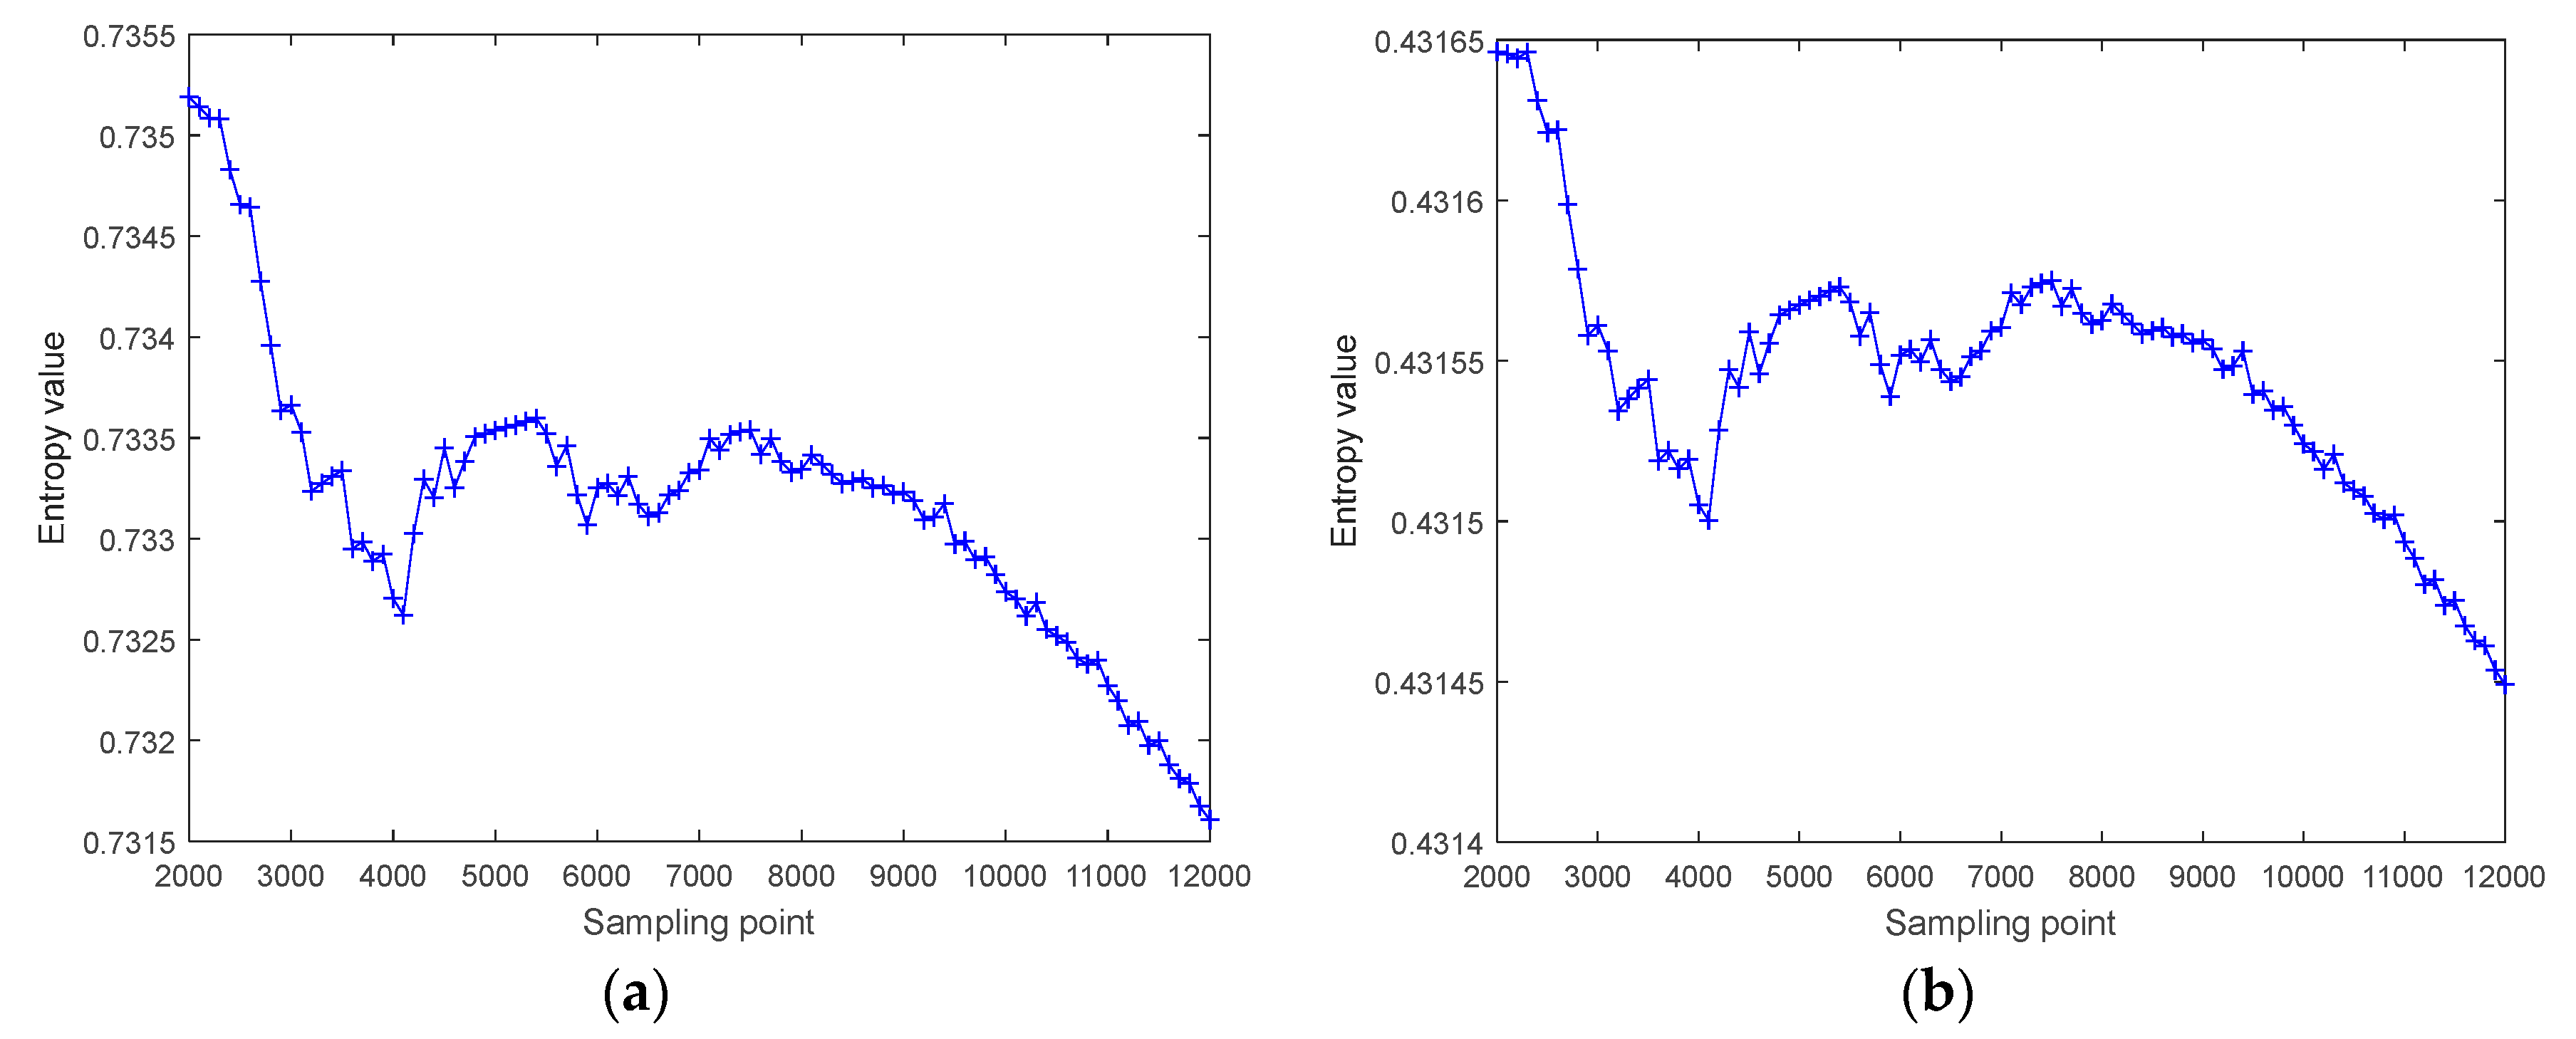
Complexity testing of time series with various lengths is carried out to prove the stability of RWPE. We calculate four entropies of cosine signals with frequencies of 100 Hz. The embedding dimension and time delay are set to 3 and 1. The initial data length is 2000 sampling points, and 100 sampling points are added each time until the data length reaches 12,000 sampling points. Figure 5 shows the four entropies of cosine signals with frequencies of 100 Hz.
As seen in Figure 5, the four entropies of two cosine signals change in varying degrees with the increase of data length, the variation ranges of WPE are one order of magnitude lower than the ones of PE and RPE, and the variation ranges of RWPE are the smallest than the ones of WPE. The complexity testing results indicate that RWPE has better stability than the other three entropies in the case of different length data.
4. Conclusions
This paper proposes a novel complexity metric incorporating distance and amplitude information and names it RWPE. Three simulation experiments were carried out to validate this approach. Firstly, like WPE, RWPE has the ability to accurately detect the abrupt amplitudes of time series and has the opposite trend with WPE. Secondly, RWPE has better robustness to noise than PE and RPE. Lastly, RWPE has better stability for time series with different lengths than PE, WPE and RPE. RWPE, as an effective complexity metric, could be used to solve practical problems in different fields in future work.
Funding
The author gratefully acknowledges the support from the National Natural Science Foundation of China (No. 61603296).
Conflicts of Interest
The author declares no conflict of interest.
References
- Bandt, C.; Pompe, B. Permutation entropy: A natural complexity measure for time series. Phys. Rev. Lett. 2001, 88, 174102. [Google Scholar] [CrossRef] [PubMed]
- Zanin, M.; Zunino, L.; Rosso, O.A.; Papo, D. Permutation Entropy and Its Main Biomedical and Econophysics Applications: A Review. Entropy 2012, 14, 1553–1577. [Google Scholar] [CrossRef]
- Nicolaou, N.; Georgiou, J. Detection of epileptic electroencephalogram based on Permutation Entropy and Support Vector Machines. Expert Syst. Appl. 2012, 39, 202–209. [Google Scholar] [CrossRef]
- Zunino, L.; Zanin, M.; Tabak, B.; Perez, D.; Rosso, O. Forbidden patterns, permutation entropy and stock market inefficiency. Phys. A 2009, 388, 2854–2864. [Google Scholar] [CrossRef]
- Hou, Y.; Liu, F.; Gao, J.; Cheng, C.; Song, C. Characterizing Complexity Changes in Chinese Stock Markets by Permutation Entropy. Entropy 2017, 19, 514. [Google Scholar] [CrossRef]
- Zhang, X.; Liang, Y.; Zhou, J.; Zang, Y. A novel bearing fault diagnosis model integrated permutation entropy, ensemble empirical mode decomposition and optimized SVM. Measurement 2015, 69, 164–179. [Google Scholar] [CrossRef]
- Yan, R.; Liu, Y.; Gao, R. Permutation entropy: A nonlinear statistical measure for status characterization of rotary machines. Mech. Syst. Signal Process. 2012, 29, 474–484. [Google Scholar] [CrossRef]
- Li, Y.-X.; Li, Y.-A.; Chen, Z.; Chen, X. Feature Extraction of Ship-Radiated Noise Based on Permutation Entropy of the Intrinsic Mode Function with the Highest Energy. Entropy 2016, 18, 393. [Google Scholar] [CrossRef]
- Li, Y.; Li, Y.; Chen, X.; Yu, J. A Novel Feature Extraction Method for Ship-Radiated Noise Based on Variational Mode Decomposition and Multi-Scale Permutation Entropy. Entropy 2017, 19, 342. [Google Scholar] [CrossRef]
- Fadlallah, B.; Chen, B.; Keil, A.; Principe, J. Weighted-permutation entropy: A complexity measure for time series incorporating amplitude information. Phys. Rev. E 2013, 87, 022911. [Google Scholar] [CrossRef] [PubMed]
- Bandt, C. A New Kind of Permutation Entropy Used to Classify Sleep Stages from Invisible EEG Microstructure. Entropy 2017, 19, 197. [Google Scholar] [CrossRef]
Figure 1.
An original pattern and its corresponding three possible patterns ().

Figure 2.
The time domain waveform of synthetic signal .

Figure 3.
The four entropies of synthetic signal .

Figure 4.
The four entropies of synthetic signal under different SNRs.

Figure 5.
The four entropies of cosine signals with frequencies of 100 Hz. (a) PE; (b) WPE; (c) RPE; (d) RWPE.
Figure 5.
The four entropies of cosine signals with frequencies of 100 Hz. (a) PE; (b) WPE; (c) RPE; (d) RWPE.


Table 1.
The four entropies in the windows from 42 to 51.
| Window | 42 | 43 | 44 | 45 | 46 | 47 | 48 | 49 | 50 | 51 |
|---|---|---|---|---|---|---|---|---|---|---|
| PE | 0.994 | 0.988 | 0.992 | 0.979 | 0.982 | 0.978 | 0.987 | 0.990 | 0.995 | 0.995 |
| WPE | 0.992 | 0.651 | 0.645 | 0.648 | 0.651 | 0.649 | 0.652 | 0.649 | 0.650 | 0.993 |
| RPE | 0.007 | 0.014 | 0.010 | 0.026 | 0.021 | 0.025 | 0.015 | 0.011 | 0.006 | 0.005 |
| RWPE | 0.009 | 0.317 | 0.319 | 0.318 | 0.317 | 0.317 | 0.316 | 0.317 | 0.317 | 0.009 |
Publisher’s Note: MDPI stays neutral with regard to jurisdictional claims in published maps and institutional affiliations. |
© 2019 by the author. Licensee MDPI, Basel, Switzerland. This article is an open access article distributed under the terms and conditions of the Creative Commons Attribution (CC BY) license (https://creativecommons.org/licenses/by/4.0/).
Share and Cite
MDPI and ACS Style
Li, Y. Reverse Weighted-Permutation Entropy: A Novel Complexity Metric Incorporating Distance and Amplitude Information. Proceedings 2020, 46, 1. https://doi.org/10.3390/ecea-5-06688
AMA Style
Li Y. Reverse Weighted-Permutation Entropy: A Novel Complexity Metric Incorporating Distance and Amplitude Information. Proceedings. 2020; 46(1):1. https://doi.org/10.3390/ecea-5-06688
Chicago/Turabian StyleLi, Yuxing. 2020. "Reverse Weighted-Permutation Entropy: A Novel Complexity Metric Incorporating Distance and Amplitude Information" Proceedings 46, no. 1: 1. https://doi.org/10.3390/ecea-5-06688