
Research on the Robustness of the Chinese Input–Output Network Based on Relative Entropy Theory

1
Institute of Mineral Resources, Chinese Academy of Geological Sciences, Beijing 100037, China
2
Research Center for Strategy of Global Mineral Resources, Chinese Academy of Geological Sciences, Beijing 100037, China
3
Development and Research Center, Chinese Geological Survey, Beijing 100037, China
*
Authors to whom correspondence should be addressed.
Entropy 2022, 24(8), 1043; https://doi.org/10.3390/e24081043
Submission received: 23 June 2022
/
Revised: 21 July 2022
/
Accepted: 23 July 2022
/
Published: 29 July 2022
(This article belongs to the Special Issue Complex Network Analysis in Econometrics)
Abstract
:The input–output (IO) network is the quantitative description of an IO-based economy in which nodes represent industries and edges connecting nodes represent the economic connection between industries. Robustness refers to the ability of tolerating perturbations that might affect the system’s functional body. There is both practical and theoretical significance to explore the robustness of the IO network for economic development. In this paper, we probe the robustness of the Chinese IO network based on the relative entropy of the probability distribution of network parameters (node degree, strongest path betweenness, downstream closeness and upstream closeness) under random node or edge failure and intentional node or edge attack. It is found that the Chinese IO network shows relatively weak robustness when it is under intentional attack, but relatively strong robustness when it is under random failure. Our experiment also verifies the applicability and effectiveness of the relative entropy model in measuring the robustness of the IO network.
1. Introduction
Industrial relation is the basic relation in economic activity. With the rapid development of economic globalization and network information technology, the dependence and restriction relationship between industries has strengthened, and the interaction and division of labor among industries have played an increasingly prominent role in regional economic development. The input–output model established by Leontief [1] is a basic method to describe industrial correlation and is committed to quantitatively measuring the correlation between different industries.
The national economy is regarded as an organic whole in input–output analysis, in which a series of industrial sectors are mapped into a crisscrossed input–output table according to the input–output relationship in a certain period. Then, scholars can comprehensively study the quantitative relationship between each specific sector and make an economic analysis and prediction based on the input–output table. In essence, the intermediate matrix of the input–output table is a complex network in the sense that industries as nodes are linked with the exchange of products between industries whose structure can be characterized by power–law distributions or similar ones [2,3,4,5,6]. The complex network theory is employed by a large number of scholars to detect key industries [7,8] and industrial communities [9,10] and probe the risks of the transmission mechanism [11,12] in the input–output system.
Robustness is an important feature of complex networks which describes the ability to maintain structural integrity and function in the case of random failure or intentional attack for nodes or edges. Initially, Albert et al. [13] compared the robustness characteristics of random networks and scale-free networks under node attack through analogue simulation. Holme et al. [14] further comprehensively summarized that there are four main types of intentional attack against complex networks, namely, “ID removal”, “RD removal”, “IB removal” and “RB removal”, which are based on different attack strategies, initial degree distribution, initial betweenness, recalculated degree distribution and recalculated betweenness. Subsequently, research on robustness for the complex network is widely applied to the power network [15,16], biological molecular network [17] and trade network [18,19]. At present, studies on robustness are mainly focused on robustness measures [14,20,21] and robust control [15,17,19]. The former mainly quantitatively measures robustness by using various indicators to solve the problem of “which network has better robustness”, while the latter mainly tends to improve the network robustness by designing reasonable and effective measures, so as to achieve the purpose of controlling network robustness.
Information entropy, first proposed by Shannon, is used to measure the randomness of a system. The bigger the information entropy is, the more chaotic the system is, and vice versa. As an important branch of information entropy, relative entropy is a new concept developed by Kullback and Leibler [22] on the basis of information entropy. It is powerful in measuring the distance or similarity between two random distributions, and has been applied to hierarchical policy search by many scholars [23,24], key nodes identification [25,26] and node similarity measurement [27,28].
However, distinguished from other complex networks, the current research on the robustness of the input–output network is relatively weak. For example, while the “fragility” of the global input–output network mentioned by Grazzini and Spelta [12] is similar to its robustness, there are no relevant experiments under random failure or intentional attack that systemically measure the robustness of the input–output network using traditional methods. Thus, in this paper, we evaluate the robustness of the Chinese input–output network under random failure or intentional attack based on the relative entropy model.
2. Relative Entropy Model
2.1. Relative Entropy Theory
Relative entropy, known as Kullback–Leibler divergence (KLD), is a way of describing the difference between two probability distributions P and Q, shown in Equations (1) and (2). The former is the definition of relative entropy for the discrete random variables, and the latter is the definition for the continuous random variables.
where the base is generally omitted, which is usually set to 2, e, or 10 if needed. As long as the base is greater than 1, the above equations can be used to calculate the relative entropy.
In the field of information, relative entropy is used to measure the number of bits required to encode the average sample from P using Q-based encoding. In particular, P is the real distribution of data and Q is the theoretical distribution, model distribution or approximate distribution of P. The distance between two random distributions can be measured by relative entropy. The more similar the two distributions are, the smaller the relative entropy is. As the difference between the two distributions increases, the relative entropy value also increases. Therefore, relative entropy can compare the similarity of the distributions of something, and evaluate the relative size of change.
2.2. Relative Entropy Model on the Network Robustness
Robustness is used to characterize the insensitivity of the control system to characteristic or parameter disturbance, that is, the anti-interference ability of the system. In this paper, the robustness is used to characterize the degree of the structural characteristic changes in the input–output network under random failure or intentional attack, namely, network anti-interference.
As for the types of attack, complex networks are generally under random failure or intentional attack [18,20,29]. In this paper, the distribution range [Lmin, Lmax] of the relevant indicators of each node is divided into m segments. The probability of the relevant indicators of each node falling in each interval is P(xi) = (i = 1, 2, …, m) before random failure or intentional attack, Q(xi) = (i = 1, 2, …, m) after random failure and R(xi) = (i = 1, 2, …, m) after intentional attack. Thus, Equation (1) for the discrete random variables is adopted to calculate the relative entropy.
3. Relevant Indicators of the Input–Output Network
3.1. Node Degree Distribution
For the input–output network, G = (N, E), where N is the number of nodes, E is the number of connected edges, and node degree is the number of edges connecting to a node. For a directional and weighted network, the weighted degree is the sum of the weighted indegree and the weighted outdegree,
where is the weighted degree, is the weight of edges of node i pointing to node j, and is the weight of edges of node j pointing to node i.
Once the network is under attack and nodes or edges are deleted, the weighted degree of each node will change, and the relative size of the change can be used as an indicator to measure the robustness of the input–output network.
3.2. Centrality Based on the Strongest Path (SP)
Different from the traditional concept of the shortest path, which is the path connecting two particular nodes in the network with the least number of steps among all possible paths, Xu and Liang [5] put forward the concept of the SP rooted from SPA in the IO model, and redefined three new concepts of centrality: SP betweenness, downstream closeness and upstream closeness.
3.2.1. Strongest Path
Structural path analysis (SPA) is a method to find supply chain paths that contribute most to a particular consumption-based account (CBA). In particular, to supply the production of sector j, there are multiple paths originating from all other sectors in the economy. Contributions of particular paths to the unitary output of sector j can be measured using the Taylor expansion of the Leontief inverse matrix [30].
The SP can be defined as a particular path that contributes the most to the unitary output of industry j among all possible paths from industry i to industry j, which represents the most important path of all possible paths of supply from one particular industry to another. The strength of a particular SP from industry i to industry j is measured as
where indicates the technical coefficient, and the SP from industry i to j is identified as i→→……→→j.
3.2.2. SP Betweenness
The SP betweenness of nodes or links indicates their ability as centers of transforming resources from all over the economic system into finished products to supply the whole economy. For a particular industry, the SP betweenness is defined as the weighted sum of strengths of all SPs in the IO network passing through it, not including those SPs that start or end at it:
Similarly, the SP betweenness for a particular link i→j (all of which can be coalesced into the SP matrix) is
3.2.3. Downstream Closeness and Upstream Closeness
Closeness in network analysis measures how far a particular node is to all other nodes based on their shortest paths. In IO networks, two SP-based closeness measures are defined including downstream closeness and upstream closeness. The former represents an important role as the supplier to downstream industries, has the ability to drive economic development, and is the average value of all SPs starting from a particular industry i:
Similarly, the latter represents the important role as the consumer of downstream industries, drives economic development, and is defined as the average value of all SPs ending at a particular industry j:
where and represent the output of industries i and j, respectively.
Once the input–output network is under attack and node or edge fails occur, the value of SP betweenness, downstream closeness and upstream closeness will change. The magnitude of the change can be used to measure the robustness of the network.
4. Experiment
4.1. Chinese Input–Output Network Model
The Chinese input–output network model (Figure 1) was built by the Chinese input–output table for the year 2018 from the most recent OECD input–output database (2021 edition, https://www.oecd.org/, accessed on 26 December 2021), which has 45 unique industries based on ISIC Revision 4 (while modeling, the 45th industry is deleted because all its data are zero). A list of OECD industries and corresponding abbreviations are in Appendix A Table A1. We will replace the full names of these industries with corresponding abbreviations in the following paragraphs.
Table 1 shows the node degree, SP betweenness, downstream closeness and upstream closeness of all the industries in the Chinese input–output network. It can be seen that the relative ordering of the four kinds of parameters is different. The top five industries by degree are the basic metals industry, the agriculture, hunting, and forestry industry, the construction industry, the computer, electronic and optical equipment industry and the textiles, textile products, leather and footwear industry, indicating the strength of connections between them and other nodes (industries). The top five industries by SP betweenness are the mining, quarrying, and energy-producing products industry, the basic metals industry, the coke and refined petroleum products industry, the food products, beverages and tobacco industry and the agriculture, hunting and forestry industry, indicating their ability to transform resources from all over the economic system into finished products to supply the whole economy. The top five industries by downstream closeness are the wholesale and retail trade and motor vehicle repair industry, the basic metals industry, the agriculture, hunting and forestry industry, the mining, quarrying, and energy-producing products industry and the chemical and chemical products industry, indicating their important role as suppliers to downstream industries and their ability to drive economic development. The top five industries by upstream closeness are the construction industry, the food products, beverages and tobacco industry, the basic metals industry, the machinery and equipment NEC industry and the wholesale and retail trade and motor vehicle repair industry, indicating their important role as consumers of downstream industries that then drive economic development.
4.2. Robustness Analysis
Complex networks usually face two types of attack: random failure and intentional attack. Random failure means that nodes or edges are attacked randomly with a certain probability and then become invalid. Intentional attack means that nodes or edges are attacked according to certain strategies and then become invalid. In this paper, the distribution range of the network parameters of each node is divided into 10 segments, and the original probability falling in each interval is P(xi) = (i = 1, 2,…, 10), before random failure or intentional attack (Table 1, Figure 2). The subsequent probability falling into each interval is Q(xi) = (i = 1, 2,…, 10) after random failure, and R(xi) = (i = 1, 2,…, 10) after intentional attack. After each attack, we can calculate the relative entropy according to the subsequent probability distribution of the network parameters and the original probability distribution.
4.2.1. Node Attack
In the case of random node failure, nodes are deleted randomly in corresponding proportions, and then the average value of node degree, SP betweenness, downstream closeness and upstream closeness are calculated with 100 simulations, respectively. In the case of intentional node attack, nodes are deleted in corresponding proportions according to node degree, SP betweenness, downstream closeness and upstream closeness, respectively, and then the probability distributions of three network parameters (node degree, node clustering coefficient and intermediary centrality under the strongest path) are calculated. Based on the relative entropy theory, the relative entropy of the probability distribution of the relevant parameters before and after random attack and intentional attack of the Chinese input–output network are calculated, respectively (Figure 3).
As can be seen from Figure 3a, the relative entropy of the node degree distribution of the Chinese input–output network gradually increases with the increase in the proportion of nodes under random failure and intentional attack. Under random node failure, the relative entropy of node degree distribution increases slowly. Under intentional node attack, the relative entropy of node degree distribution increases rapidly, and remains stable when the number of nodes exceeds 33. When the Chinese input–output network is under intentional attack, the relative entropy of node degree distribution is always larger than when the Chinese input–output network is under random failure, indicating that intentional node attack on the node degree distribution of the Chinese input–output network may make an even stronger impact than random node failure.
As can be seen from Figure 3b, the relative entropy of SP betweenness distribution of the Chinese input–output network gradually increases with the increase in the proportion of nodes under random failure and intentional attack, which is similar to node degree. Under random node failure, the relative entropy of SP betweenness distribution increases slowly. Under intentional node attack, the relative entropy of SP betweenness distribution increases rapidly, and remains stable when the number of nodes exceeds 29. When the Chinese input–output network is under intentional attack, the relative entropy of SP betweenness distribution is always larger than when the Chinese input–output network is under random failure, indicating that intentional node attack on the SP betweenness of the Chinese input–output network may make an even stronger impact than random node failure.
As can be seen from Figure 3c, the relative entropy of the downstream closeness distribution of the Chinese input–output network gradually increases with the increase in the proportion of nodes under random failure and intentional attack. Under random node failure, the relative entropy of downstream closeness distribution increases slowly at first and rapidly afterwards. Under intentional node attack, the relative entropy of downstream closeness distribution increases with a circle variation, and tends to coincide with that of random failure when the number of nodes exceeds 40. When the Chinese input–output network is under intentional attack, the relative entropy of downstream closeness distribution is always larger than when the Chinese input–output network is under random failure, indicating that intentional node attack on the downstream closeness of the Chinese input–output network may make an even stronger impact than random node failure.
As can be seen from Figure 3d, the relative entropy of the upstream closeness distribution of the Chinese input–output network gradually increases with the increase in the proportion of nodes under random failure and intentional attack. When the Chinese input–output network is under intentional attack, the relative entropy of upstream closeness distribution increases with a circle variation, which is similar to downstream closeness, and it is always larger than when the Chinese input–output network is under random failure, indicating that intentional node attack on the upstream closeness of the Chinese input–output network may make an even stronger impact than random node failure.
In general, when the Chinese input–output network is under intentional node attack, the relative entropy of network node parameters is higher than that under random node attack, and increases faster. Therefore, when the Chinese input–output network is under intentional node attack, its structure and function change greatly, that is, the robustness is weak. When subjected to random node failure, the economic structural characteristics remain good within a certain range, and the damage degree of the structure shows a slow trend, which indicates that the robustness is strong.
4.2.2. Edge Attack
The SP betweenness for links (namely, the SP matrix) between all industries in the Chinese input–output network using Equations (6) and (8) can also reflect the ability to transform resources.
In the case of intentional edge attack, we delete the corresponding edges in the input–output matrix according to the data size of the SP matrix, and then calculate the node probability distribution of four types of network parameters (node degree, SP between, downstream closeness and upstream closeness), respectively. In the case of random edge failure, we randomly delete the edges in corresponding proportion, run 100 simulations to calculate the average value of node degree, SP betweenness, downstream closeness and upstream closeness, respectively, and then calculate the probability distribution of three network parameters (node degree, node clustering coefficient and intermediary centrality under the strongest path). Based on the relative entropy theory, the relative entropy of the probability distribution of relevant parameters before and after random attack and the intentional attack of the Chinese input–output network is calculated, respectively (Figure 4).
As can be seen from Figure 4b, the relative entropy of SP betweenness distribution of the Chinese input–output network gradually increases with the increase in the proportion of edges under random failure and intentional attack. The relative entropy of SP betweenness distribution under random edge failure increases with a circle variation, and is apparently higher than that under random edge failure, indicating that the intentional edge attack on SP betweenness of the Chinese input–output network may make an even stronger impact than random edge failure.
As can be seen from Figure 4c, the relative entropy of downstream closeness distribution of the Chinese input–output network gradually increases with a circle variation with an increase in the proportion of edges under random failure and intentional attack. The relative entropy of downstream closeness distribution hits a plateau when the 400th–1600th edges are under intentional attack, and then increases quickly. Overall, when the Chinese input–output network is under intentional edge attack, the relative entropy of downstream closeness distribution is always larger than when the Chinese input–output network is under random edge failure, indicating that intentional edge attack on the downstream closeness of the Chinese input–output network may make an even stronger impact than random edge failure.
As can be seen from Figure 4d, the relative entropy of the upstream closeness distribution of the Chinese input–output network gradually increases with the increase in the proportion of edges under random failure and intentional attack. The relative entropy of upstream closeness distribution hits a plateau when the 400th–1600th edges are under intentional attack, and then increases quickly, which is quite similar to that of downstream closeness. When the Chinese input–output network is under intentional edge attack, the relative entropy of upstream closeness distribution is always larger than that under random edge failure, indicating that intentional edge attack on the upstream closeness of the Chinese input–output network may make an even stronger impact than random edge failure.
In general, when the Chinese input–output network is under intentional edge attack, the relative entropy of the network node parameters is higher than that under random edge attack, and increases faster. Therefore, when the Chinese input–output network is under intentional edge attack, its structure and function change greatly, that is, the robustness is weak. When subjected to random edge failure, the economic structural characteristics remain good within a certain range, and the damage degree of the structure shows a slow trend, which indicates that the robustness is strong.
5. Conclusions
(1) The relative entropy of network node parameters (node degree, SP betweenness, downstream closeness and upstream closeness) is relatively large, and increases relatively quickly when the Chinese input–output network is under intentional node or edge attack, indicating strong robustness.
(2) The relative entropy of network node parameters (node degree, SP betweenness, downstream closeness and upstream closeness) is relatively small, and increases relatively slowly when the Chinese input–output network is under random node or edge failure, indicating weak robustness.
(3) Meanwhile, our experiments show that the relative entropy model is applicative and effective in measuring the robustness of the IO network.
Author Contributions
Software, W.X.; Supervision, A.W.; Writing–original draft, W.L. All authors have read and agreed to the published version of the manuscript.
Funding
This research was funded by grants from the National Natural Science Foundation of China (Grant No. 71991485, No. 71991480), and Basic Science Center Project for National Natural Science Foundation of China (No. 72088101, the Theory and Application of Resource and Environment Management in the Digital Economy Era). The APC was funded by the Basic Science Center Project for National Natural Science Foundation of China (No. 72088101).
Conflicts of Interest
The authors declare no conflict of interest.
Appendix A

Table A1.
List of OECD industries and corresponding abbreviations.
| Serial Number | ISIC Rev.4 | Industry | Abbreviation |
|---|---|---|---|
| 1 | D01T02 | Agriculture, hunting, forestry | AGR |
| 2 | D03 | Fishing and aquaculture | FA |
| 3 | D05T06 | Mining and quarrying, energy producing products | MQE |
| 4 | D07T08 | Mining and quarrying, non-energy producing products | MQN |
| 5 | D09 | Mining support service activities | MSS |
| 6 | D10T12 | Food products, beverages and tobacco | FBT |
| 7 | D13T15 | Textiles, textile products, leather and footwear | TTP |
| 8 | D16 | Wood and products of wood and cork | WWC |
| 9 | D17T18 | Paper products and printing | PPP |
| 10 | D19 | Coke and refined petroleum products | CRP |
| 11 | D20 | Chemical and chemical products | CCP |
| 12 | D21 | Pharmaceuticals, medicinal chemical and botanical products | PMB |
| 13 | D22 | Rubber and plastics products | RPP |
| 14 | D23 | Other non-metallic mineral products | OMP |
| 15 | D24 | Basic metals | BM |
| 16 | D25 | Fabricated metal products | FMP |
| 17 | D26 | Computer, electronic and optical equipment | CEO |
| 18 | D27 | Electrical equipment | EE |
| 19 | D28 | Machinery and equipment, nec | MAC |
| 20 | D29 | Motor vehicles, trailers and semi-trailers | MTS |
| 21 | D30 | Other transport equipment | OTE |
| 22 | D31T33 | Manufacturing nec; repair and installation of machinery and equipment | MAN |
| 23 | D35 | Electricity, gas, steam and air conditioning supply | EGS |
| 24 | D36T39 | Water supply; sewerage, waste management and remediation activities | WSW |
| 25 | D41T43 | Construction | CON |
| 26 | D45T47 | Wholesale and retail trade; repair of motor vehicles | WRR |
| 27 | D49 | Land transport and transport via pipelines | LR |
| 28 | D50 | Water transport | WR |
| 29 | D51 | Air transport | AR |
| 30 | D52 | Warehousing and support activities for transportation | TS |
| 31 | D53 | Postal and courier activities | PCA |
| 32 | D55T56 | Accommodation and food service activities | AFS |
| 33 | D58T60 | Publishing, audiovisual and broadcasting activities | PAB |
| 34 | D61 | Telecommunications | TEL |
| 35 | D62T63 | IT and other information services | IT |
| 36 | D64T66 | Financial and insurance activities | FIA |
| 37 | D68 | Real estate activities | RS |
| 38 | D69T75 | Professional, scientific and technical activities | PST |
| 39 | D77T82 | Administrative and support services | ASS |
| 40 | D84 | Public administration and defence; compulsory social security | PD |
| 41 | D85 | Education | EDU |
| 42 | D86T88 | Human health and social work activities | HS |
| 43 | D90T93 | Arts, entertainment and recreation | AER |
| 44 | D94T96 | Other service activities | OS |
| 45 | D97T98 | Activities of households as employers; undifferentiated goods- and services-producing activities of households for own use | HOU |
References
- Leontief, W. Quantitative Input and Output Relations in the Economic Systems of the United States. Rev. Econ. Stat. 1936, 18, 105–125. [Google Scholar] [CrossRef] [Green Version]
- James, M.; Brian, D.F.; Gerald, S. Network structure of inter-industry flows. Phys. A Stat. Mech. Appl. 2013, 392, 6427–6441. [Google Scholar]
- Blochl, F.; Theis, F.J.; Vega-Redondo, F.; Fisher, E.O.N. Vertex centralities in input–output networks reveal the structure of modern economies. Phys. Rev. E Stat. Nonlinear Soft Matter Phys. 2011, 83, 046127. [Google Scholar] [CrossRef] [PubMed] [Green Version]
- McNerney, J. Network Properties of Economic-Input Output Networks; lnternational lnstitute for Applied Systems Analysis: Laxenburg, Austria, 2009. [Google Scholar]
- Xu, M.; Liang, S. Input–output networks offer new insights of economic structure. Phys. A Stat. Mech. Appl. 2019, 527, 121178. [Google Scholar] [CrossRef]
- Gonçalves, J.; Matsushita, R.; Da Silva, S. The asymmetric Brazilian input–output network. J. Econ. Stud. 2021, 48, 604–615. [Google Scholar] [CrossRef]
- Cerina, F.; Zhu, Z.; Chessa, A.; Riccaboni, M. World Input-Output Network. PLoS ONE 2015, 10, e0134025. [Google Scholar] [CrossRef] [Green Version]
- Theodore, T. Network analysis of inter-sectoral relationships and key sectors in the Greek economy. J. Econ. Interact. Coord. 2017, 12, 413–435. [Google Scholar]
- He, X.; Dong, Y.; Wu, Y.; Wei, G.; Xing, L.; Yan, J. Structure analysis and core community detection of embodied resources networks among regional industries. Phys. A Stat. Mech. Appl. 2017, 479, 137–150. [Google Scholar] [CrossRef]
- Li, W.; Wang, A.; Zhong, W.; Xing, W.; Liu, J. The role of mineral-related industries in Chinese industrial pattern. Resour. Policy 2022, 76, 102590. [Google Scholar] [CrossRef]
- Acemoglu, D.; Carvalho, V.M.; Ozdaglar, A.; Tahbaz-Salehi, A. The Network Origins of Aggregate Fluctuations. Econometrica 2012, 80, 1977–2016. [Google Scholar] [CrossRef] [Green Version]
- Grazzini, J.; Spelta, A. An empirical analysis of the global input–output network and its evolution. Phys. A Stat. Mech. Appl. 2022, 594, 126993. [Google Scholar] [CrossRef]
- Albert, R.; Jeong, H.; Barabási, A.-L. Error and attack tolerance of complex networks. Nature 2000, 406, 378–382. [Google Scholar] [CrossRef] [Green Version]
- Holme, P.; Kim, B.J.; Yoon, C.N.; Han, S.K. Attack vulnerability of complex networks. Phys. Rev. E 2002, 65, 056109. [Google Scholar] [CrossRef] [Green Version]
- Schneider, C.M.; Moreira, A.A.; Andrade, J.S.; Havlin, S.; Herrmann, H.J. Mitigation of malicious attacks on networks. Proc. Natl. Acad. Sci. USA 2011, 108, 3838–3841. [Google Scholar] [CrossRef] [Green Version]
- Sen, A.; Mazumder, A.; Banerjee, J.; Das, A.; Compton, R. Identification of K most vulnerable nodes in multi-layered network using a new model of interdependency. In Proceedings of the 2014 IEEE Conference on Computer Communications Workshops (INFOCOM WKSHPS), Toronto, ON, Canada, 27 April–2 May 2014; pp. 831–836. [Google Scholar]
- Liu, X.; Maiorino, E.; Halu, A.; Glass, K.; Prasad, R.B.; Loscalzo, J.; Gao, J.; Sharma, A. Robustness and lethality in multilayer biological molecular networks. Nat. Commun. 2020, 11, 6043. [Google Scholar] [CrossRef]
- Foti, N.J.; Pauls, S.; Rockmore, D.N. Stability of the World Trade Web over time—An extinction analysis. J. Econ. Dyn. Control 2013, 37, 1889–1910. [Google Scholar] [CrossRef] [Green Version]
- Liu, X.; Stanley, H.E.; Gao, J. Breakdown of interdependent directed networks. Proc. Natl. Acad. Sci. USA 2016, 113, 1138–1143. [Google Scholar] [CrossRef] [Green Version]
- Dorogovtsev, S.N.; Mendes, J.F.; Samukhin, A.N. Giant strongly connected component of directed networks. Phys. Rev. E Stat. Nonlin. Soft Matter Phys. 2001, 64 Pt 2, 025101. [Google Scholar] [CrossRef] [Green Version]
- Qin, J.; Wu, H.; Tong, X.; Zheng, B. A quantitative method for determining the robustness of complex networks. Phys. D Nonlinear Phenom. 2013, 253, 85–90. [Google Scholar] [CrossRef] [Green Version]
- Kullback, S.; Leibler, R.A. On Information and Sufficiency. Ann. Math. Stat. 1951, 22, 79–86, 88. [Google Scholar] [CrossRef]
- Izadi, N.H.; Palhang, M.; Safayani, M. Layered Relative Entropy Policy Search. Knowl.-Based Syst. 2021, 223, 107025. [Google Scholar] [CrossRef]
- Mahdavi, M.; Fesanghary, M.; Damangir, E. An improved harmony search algorithm for solving optimization problems. Appl. Math. Comput. 2007, 188, 1567–1579. [Google Scholar] [CrossRef]
- Fei, L.G.; Deng, Y. A new method to identify influential nodes based on relative entropy. Chaos Solitons Fractals 2017, 104, 257–267. [Google Scholar] [CrossRef]
- Chen, B.; Wang, Z.X.; Luo, C. Integrated evaluation approach for node importance of complex networks based on relative entropy. J. Syst. Eng. Electron. 2016, 27, 1219–1226. [Google Scholar] [CrossRef]
- Wen, T.; Duan, S.Y.; Jiang, W. Node similarity measuring in complex networks with relative entropy. Commun. Nonlinear Sci. Numer. Simul. 2019, 78, 104867. [Google Scholar] [CrossRef]
- Zhang, Q.; Li, M.Z.; Deng, Y. Measure the structure similarity of nodes in complex networks based on relative entropy. Phys. A Stat. Mech. Appl. 2018, 491, 749–763. [Google Scholar] [CrossRef]
- Hong, C.; He, N.; Lordan, O.; Liang, B.-Y.; Yin, N.-Y. Efficient calculation of the robustness measure R for complex networks. Phys. A Stat. Mech. Appl. 2017, 478, 63–68. [Google Scholar] [CrossRef]
- Defourny, J.; Thorbecke, E. Structural path analysis and multiplier decomposition within a social accounting matrix framework. Econ. J. 1984, 94, 111–136. [Google Scholar] [CrossRef]
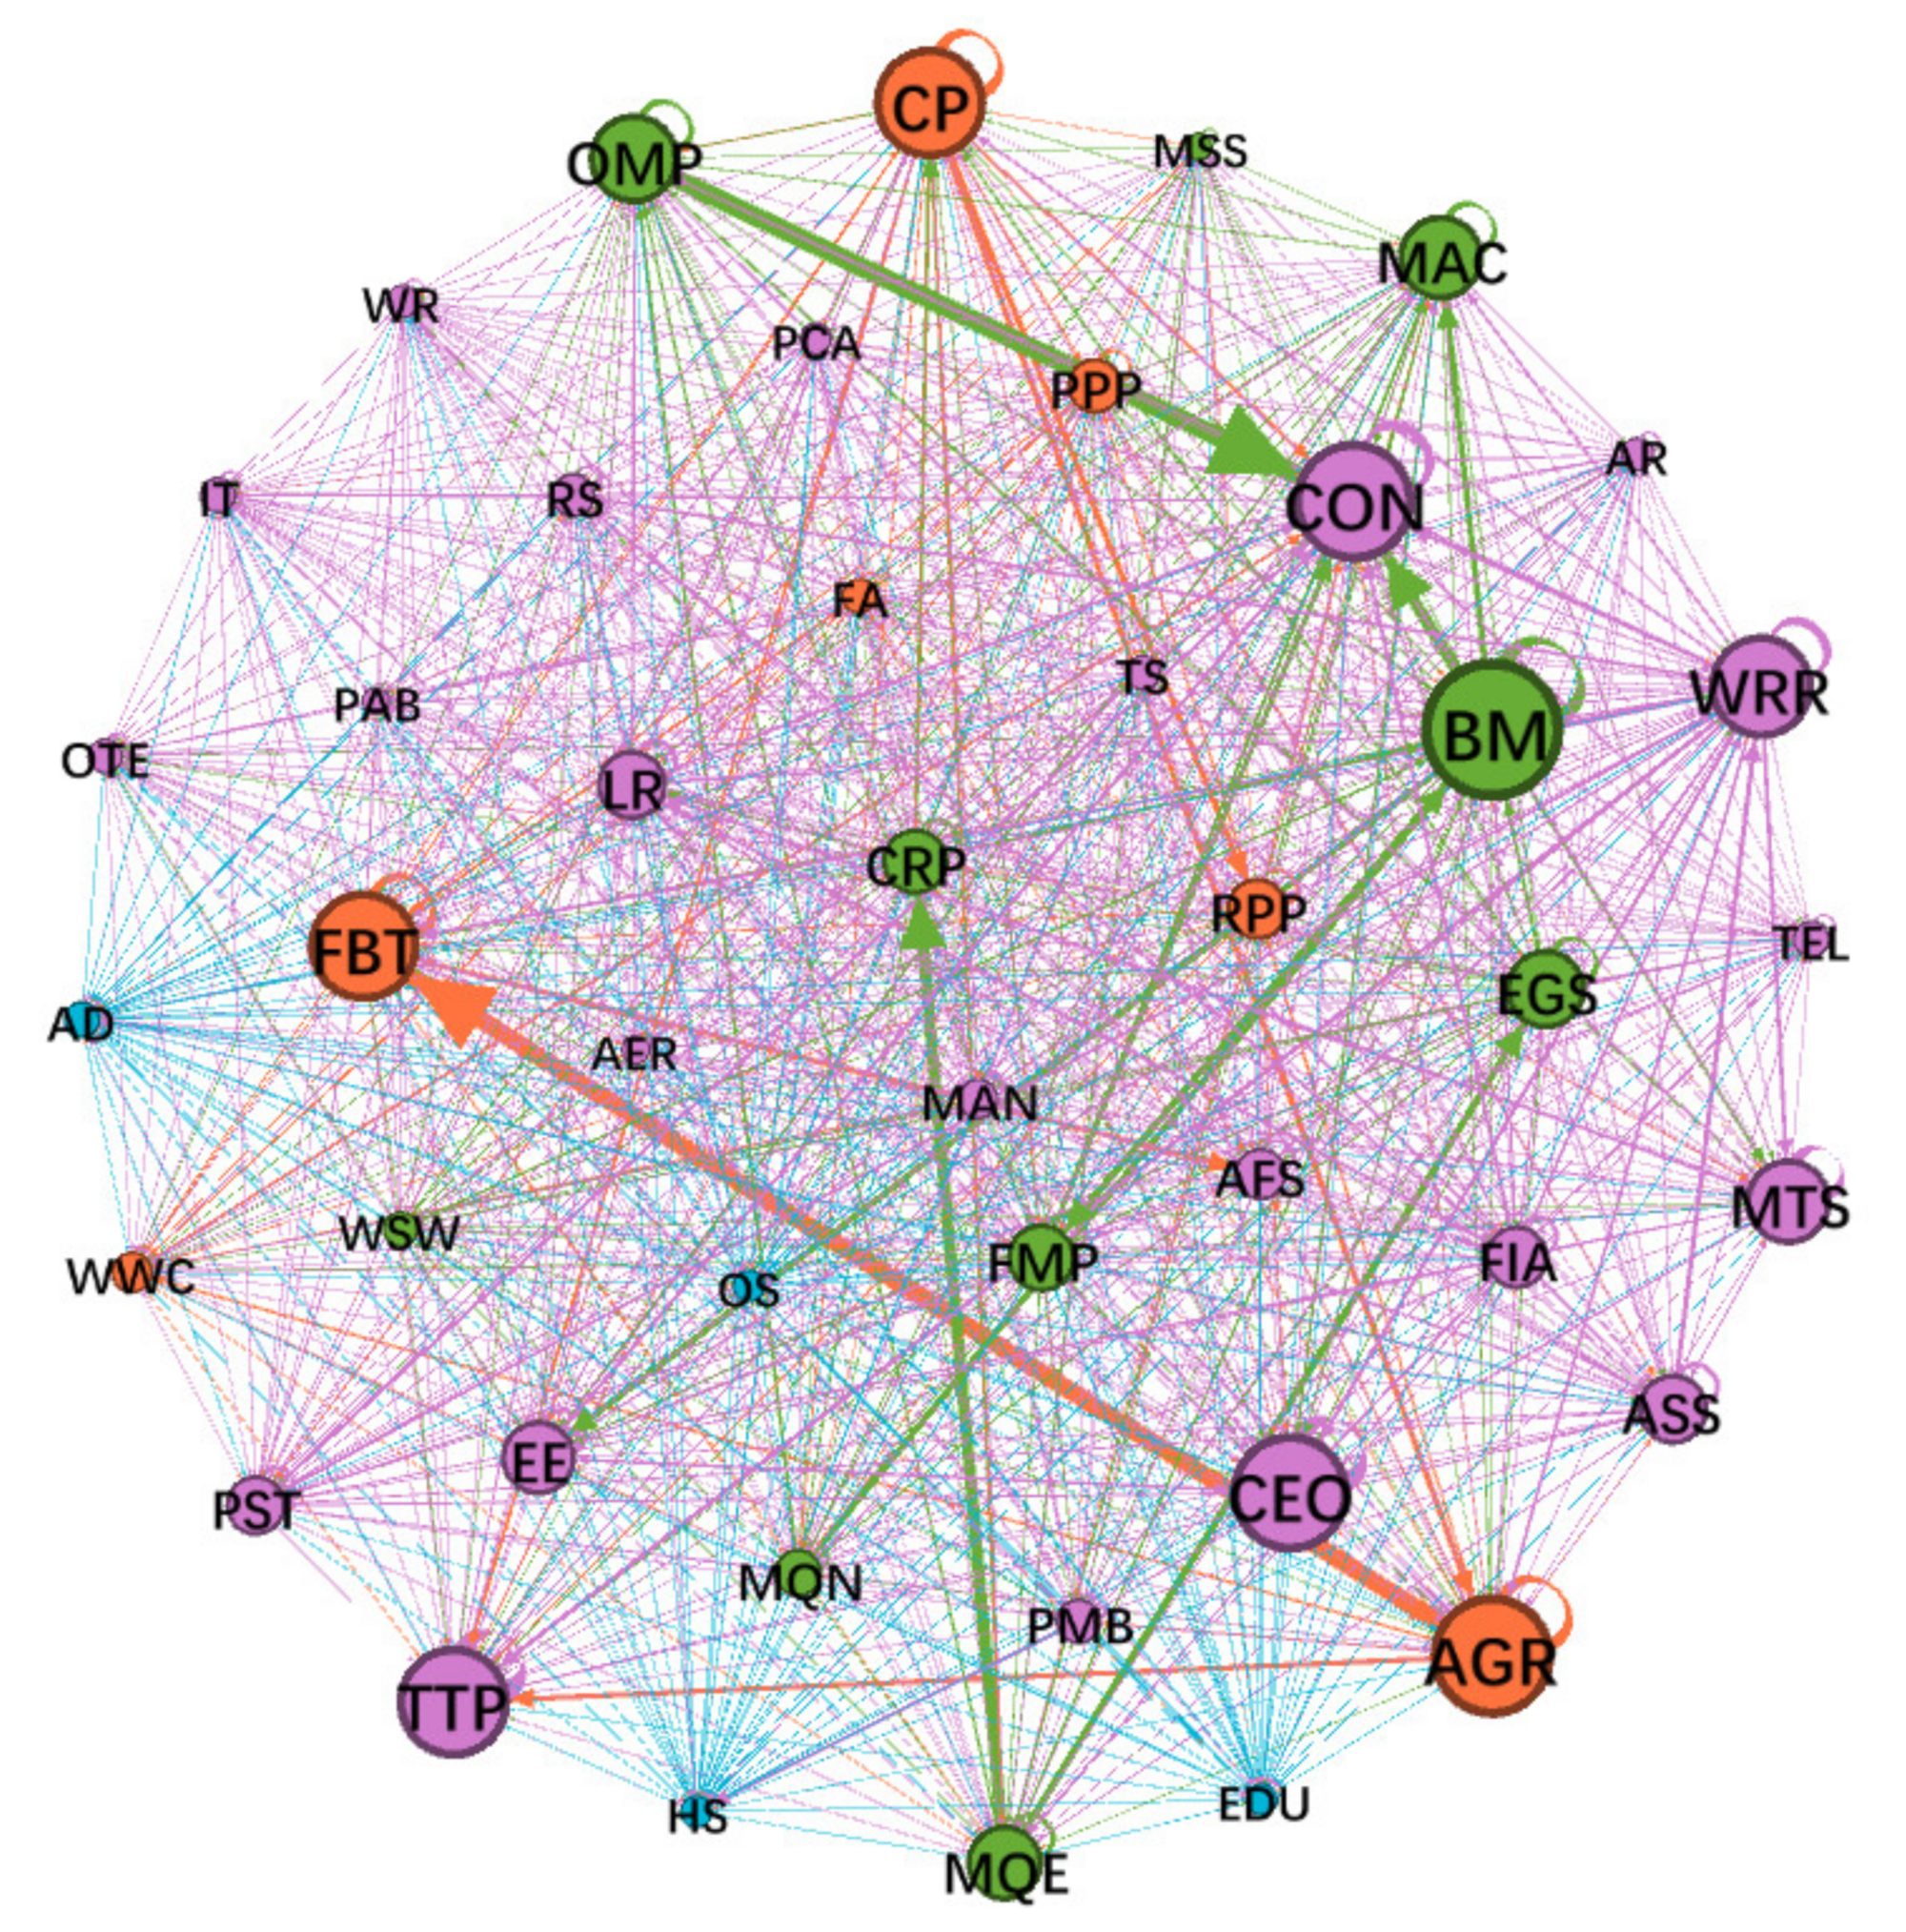
Figure 1.
The Chinese input–output network model in 2018 (size per node indicates the weighted degree and width per edge indicates the edge weight).
Figure 1.
The Chinese input–output network model in 2018 (size per node indicates the weighted degree and width per edge indicates the edge weight).

Figure 2.
The original probability distribution of (a) node degree, (b) SP betweenness, (c) downstream closeness and (d) upstream closeness.
Figure 2.
The original probability distribution of (a) node degree, (b) SP betweenness, (c) downstream closeness and (d) upstream closeness.

Figure 3.
The changing situation of entropy under node random failure and intentional attack according to (a) node degree, (b) SP betweenness, (c) downstream closeness and (d) upstream closeness.
Figure 3.
The changing situation of entropy under node random failure and intentional attack according to (a) node degree, (b) SP betweenness, (c) downstream closeness and (d) upstream closeness.

Figure 4.
The changing situation of entropy under edge random failure and intentional attack according to (a) node degree, (b) SP betweenness, (c) downstream closeness and (d) upstream closeness.As can be seen from Figure 4a, the relative entropy of node degree distribution of the Chinese input–output network gradually increases slowly at first and quickly afterwards, with an increase in the proportion of edges under random failure and intentional attack. Overall, the relative entropy of node degree distribution under intentional edge attack is slightly larger than under random edge attack, except when the 1300th–1600th edges are under attack, indicating that an intentional edge attack on the node degree of the Chinese input–output network may make an even stronger impact than random edge failure.

Table 1.
Relevant parameters (node degree, SP betweenness, downstream closeness and upstream closeness) in the Chinese input–output network.
Table 1.
Relevant parameters (node degree, SP betweenness, downstream closeness and upstream closeness) in the Chinese input–output network.
| Serial Number | Industrial Abbreviation | Weighted Degree | SP Betweenness | Downstream Closeness | Upstream Closeness |
|---|---|---|---|---|---|
| 1 | AGR | 2,562,629 | 92,472 | 26,293 | 16,338 |
| 2 | FA | 256,312 | 2461 | 3340 | 2338 |
| 3 | MQE | 1,339,448 | 245,831 | 24,536 | 7366 |
| 4 | MQN | 587,029 | 8003 | 10,456 | 4708 |
| 5 | MSS | 49,156 | 0 | 1724 | 505 |
| 6 | FBT | 2,255,791 | 131,243 | 15,269 | 25,130 |
| 7 | TTP | 2,297,492 | 711 | 6788 | 12,821 |
| 8 | WWC | 415,010 | 2724 | 4125 | 2791 |
| 9 | PPP | 789,608 | 7407 | 7092 | 4918 |
| 10 | CRP | 1,069,326 | 152,486 | 14,323 | 13,828 |
| 11 | CCP | 2,283,824 | 85,214 | 23,024 | 13,646 |
| 12 | PMB | 517,523 | 26,165 | 3523 | 4108 |
| 13 | RPP | 969,176 | 19,281 | 9262 | 8350 |
| 14 | OMP | 1,713,398 | 89,729 | 18,940 | 11,706 |
| 15 | BM | 3,072,146 | 185,195 | 30,339 | 18,371 |
| 16 | FMP | 1,142,253 | 13,689 | 11,234 | 11,366 |
| 17 | CEO | 2,471,357 | 3147 | 8713 | 14,210 |
| 18 | EE | 1,301,461 | 23,716 | 10,668 | 14,316 |
| 19 | MAC | 1,578,061 | 7072 | 9637 | 17,375 |
| 20 | MTS | 1,596,877 | 16,268 | 6142 | 12,870 |
| 21 | OTE | 256,789 | 4996 | 1272 | 3352 |
| 22 | MAN | 392,986 | 9027 | 2860 | 5779 |
| 23 | EGS | 1,443,474 | 21,102 | 13,240 | 11,682 |
| 24 | WSW | 257,270 | 211 | 2869 | 2204 |
| 25 | CON | 2,516,932 | 4015 | 676 | 55,852 |
| 26 | WRR | 2,082,205 | 65,849 | 31,445 | 16,458 |
| 27 | LR | 1,171,919 | 64,100 | 15,539 | 11,879 |
| 28 | WR | 206,296 | 2067 | 2490 | 2408 |
| 29 | AR | 204,366 | 1227 | 2582 | 1987 |
| 30 | TS | 258,371 | 0 | 3526 | 2831 |
| 31 | PCA | 165,302 | 127 | 2257 | 1390 |
| 32 | AFS | 708,324 | 40,696 | 7459 | 9312 |
| 33 | PAB | 70,715 | 0 | 606 | 981 |
| 34 | TEL | 299,942 | 0 | 2722 | 2831 |
| 35 | IT | 277,840 | 0 | 2850 | 2721 |
| 36 | FIA | 998,099 | 4019 | 18,777 | 3434 |
| 37 | RS | 489,535 | 82 | 7268 | 4375 |
| 38 | PST | 911,260 | 3791 | 11,206 | 8695 |
| 39 | ASS | 1,190,835 | 6898 | 14,674 | 10,311 |
| 40 | PD | 282,407 | 0 | 251 | 6113 |
| 41 | EDU | 170,692 | 0 | 357 | 3498 |
| 42 | HS | 177,786 | 354 | 192 | 4433 |
| 43 | AER | 79,489 | 0 | 410 | 994 |
| 44 | OS | 176,348 | 0 | 1752 | 2129 |
Publisher’s Note: MDPI stays neutral with regard to jurisdictional claims in published maps and institutional affiliations. |
© 2022 by the authors. Licensee MDPI, Basel, Switzerland. This article is an open access article distributed under the terms and conditions of the Creative Commons Attribution (CC BY) license (https://creativecommons.org/licenses/by/4.0/).
Share and Cite
MDPI and ACS Style
Li, W.; Wang, A.; Xing, W. Research on the Robustness of the Chinese Input–Output Network Based on Relative Entropy Theory. Entropy 2022, 24, 1043. https://doi.org/10.3390/e24081043
AMA Style
Li W, Wang A, Xing W. Research on the Robustness of the Chinese Input–Output Network Based on Relative Entropy Theory. Entropy. 2022; 24(8):1043. https://doi.org/10.3390/e24081043
Chicago/Turabian StyleLi, Weidong, Anjian Wang, and Wanli Xing. 2022. "Research on the Robustness of the Chinese Input–Output Network Based on Relative Entropy Theory" Entropy 24, no. 8: 1043. https://doi.org/10.3390/e24081043
Note that from the first issue of 2016, this journal uses article numbers instead of page numbers. See further details here.