Rainfall Network Optimization Using Radar and Entropy


1
Department of Natural Resources, Chinese Culture University, Taipei 11114, Taiwan
2
Department of Civil Engineering, National Taipei University of Technology, Taipei 10608, Taiwan
3
Experimental Forest, National Taiwan University, NanTou 55750, Taiwan
*
Author to whom correspondence should be addressed.
Entropy 2017, 19(10), 553; https://doi.org/10.3390/e19100553
Submission received: 9 September 2017
/
Revised: 14 October 2017
/
Accepted: 16 October 2017
/
Published: 19 October 2017
(This article belongs to the Special Issue Entropy Applications in Environmental and Water Engineering)
Abstract
:In this study, a method combining radar and entropy was proposed to design a rainfall network. Owing to the shortage of rain gauges in mountain areas, weather radars are used to measure rainfall over catchments. The major advantage of radar is that it is possible to observe rainfall widely in a short time. However, the rainfall data obtained by radar do not necessarily correspond to that observed by ground-based rain gauges. The in-situ rainfall data from telemetering rain gauges were used to calibrate a radar system. Therefore, the rainfall intensity; as well as its distribution over the catchment can be obtained using radar. Once the rainfall data of past years at the desired locations over the catchment were generated, the entropy based on probability was applied to optimize the rainfall network. This method is applicable in remote and mountain areas. Its most important utility is to construct an optimal rainfall network in an ungauged catchment. The design of a rainfall network in the catchment of the Feitsui Reservoir was used to illustrate the various steps as well as the reliability of the method.
1. Introduction
Rainfall data form the fundamental basis for hydraulic and hydrological engineering. Adequate and long-term rainfall data are essential in planning and management of water resources. The definition of rainfall is any product of atmospheric water that reaches the surface of Earth in the form of droplets of water [1]. Thus, rain gauges are the gold standard of precipitation measurement [2]. They are the principal source of rainfall data for rainfall network design. However, accurate and reliable rainfall data of catchments depend on well-designed rainfall networks. Ideally, a higher number of rainfall gauges in a catchment provides a clearer picture of the aerial distribution of the rainfall. Usually, network density and rainfall gauge distribution depend on the particular application. Many factors may affect the number and locations of rain gauges. However, there is no definite rule for constructing a rainfall network. The actual density of a rainfall network is significantly poorer than the values recommended by the World Meteorological Organization (WMO) [3]. Therefore, various methods have been used in the past to investigate the density of rainfall networks and the optimization of these networks. The WMO recommends certain densities of rain gauge stations for different types of catchments. In flat regions of temperate zones, 500 km2 per station is recommended. For small mountainous islands with irregular precipitation, 25 km2 per station is recommended [3]. Langbein [4] suggested that the densities of rain gauge stations are usually proportional to population density. The use of statistical characteristics is generally desirable in the design of rainfall networks; Rodriguez-Iturbe and Mejia [5] used a random process technique to develop design curves for estimating the mean of a rainfall event. Shih [6] introduced various steps based on a covariance factor among rain gauge stations to design a rainfall network. Patra [1] applied the coefficient of variance and allowable percentage of error to estimate the optimal number of rain gauge stations. Basalirwa et al. [7] attempted to design a minimum rainfall network by using principal component analysis. Likewise, geostatistics is frequently used in the design of rainfall networks. Kassim and Kottegoda [8] prioritized rain gauges with respect to their contribution in error reduction in the network through comparative Kriging methods. Chen et al. [9] developed a method by using Kriging and entropy that can determine the optimum number and spatial distribution of rain gauge stations in a catchment. Chebbi et al. [10] proposed an algorithm composed of a geostatistical variance-reduction method and simulated annealing to expand the existing rainfall network. Ridolfi et al. [11] introduce an entropy approach for evaluating the maximum information content achievable by an urban rainfall network. Shaghaghian and Abedini [12] selected an optimal subset of stations in the network by using Kriging, factor analysis, and clustering techniques to achieve the optimum rainfall network. Chebbi et al. [13] identified the optimal network using an intensity-duration-frequency curve and a variance-reduction method. Related works based on entropy since Krstanovic and Singh [14] is widen and undergoing [15,16,17,18]. Wei et al. [19] introduced entropy to evaluate the effect of spatiotemporal scaling on rainfall network design.
Two major scientific problems need to be addressed in studies on rainfall networks: the first problem is the number of rain gauge stations required to provide adequate representation of a catchment’s rainfall characteristics, and the second problem is that the positioning of these rain gauge stations. These two issues are essential to the optimal network design and addressed by previous studies in river points [20], water level networks in polders [21,22], cross-section spacing for river modeling [23], groundwater quality monitoring [24,25], monitoring network design [26,27], and the homogeneity of the study region, also discussed by new clustering method based on entropy [28]. As these are interrelated problems, they need to be considered in conjunction during the design of rainfall networks. In this work, the data of Project Quantitative Precipitation Estimation and Segregation Using Multiple Sensors (QPESUMS) were used to estimate the spatial distribution of rainfall, whereas entropy was used to evaluate the uncertainty of each rain gauge station and to determine how the uncertainty and spatial distribution of rainfall interact with each other. For this purpose, a comprehensive evaluation of the Feitsui Reservoir’s rain gauge station locations and distribution were performed using a three-step procedure: the first step was to use the currently available rainfall data to calibrate the radar parameters of the QPESUMS. The second step was to apply the radar to estimate the rainfall data of the candidate rain gauge stations. The third step was to use information entropy to determine the priority of the candidate rain gauge stations and to estimate the minimum required number of rain gauge stations. By combining the use of the radar of the QPESUMS and information entropy, we can determine the locations where new stations should be set up and the number of rain gauge stations required for a rainfall network. Therefore, during the determination of rain gauge station locations using this method, new rain gauge stations will be suggested if a rainfall network has fewer stations than the saturation number determined by our method, to provide an adequate quantity of catchment rainfall data. Conversely, if a rainfall network has a higher number of rain gauge stations than the saturation number, the rainfall data provided by the excess rain gauge stations will be limited, thus the removal of rain gauge stations would be suggested to improve the cost efficiency of hydrological information systems.
In this study, the Feitsui Reservoir’s catchment was used to demonstrate how the proposed method can be used to construct an optimal rainfall network. As global climate change may have altered the hydrological characteristics of the Feitsui Reservoir’s catchment, long-term hydrological data was used to assess whether an adjustment was needed for the rain gauge stations in this area, so that rain gauge stations may be added to ensure the operational safety of the reservoir. For this purpose, the measured rainfall data of the rain gauge stations were used to calibrate the parameters of the weather radar in this area, which was subsequently used to estimate the spatial distribution of rainfall in the reservoir catchment and the historical rainfall data of the candidate stations. In addition, the information transfer theories of information entropy were used to derive the importance of each candidate station and to construct an optimal rainfall network for the catchment after information was accumulated up to a specified saturation level. Finally, suggestions were provided on the appropriateness of rain gauge station additions.
2. Methodology
2.1. Radar Estimation of Rainfall
Radar was recognized for the measurement of precipitation in the late 1940s. An equation that relates the intensity of rainfall with radar echo factors was constructed after the Second World War, which gave birth to studies on the application of radar in the observation of rainfall. Radar observation is based on the scattering and reflection of high-power electromagnetic waves (emitted by radar antennas towards the atmosphere) when they encounter droplets of water or ice in clouds or raindrops. The energy of the reflected electromagnetic waves received by the radar antennas may then be used to estimate the quantity of rainfall.
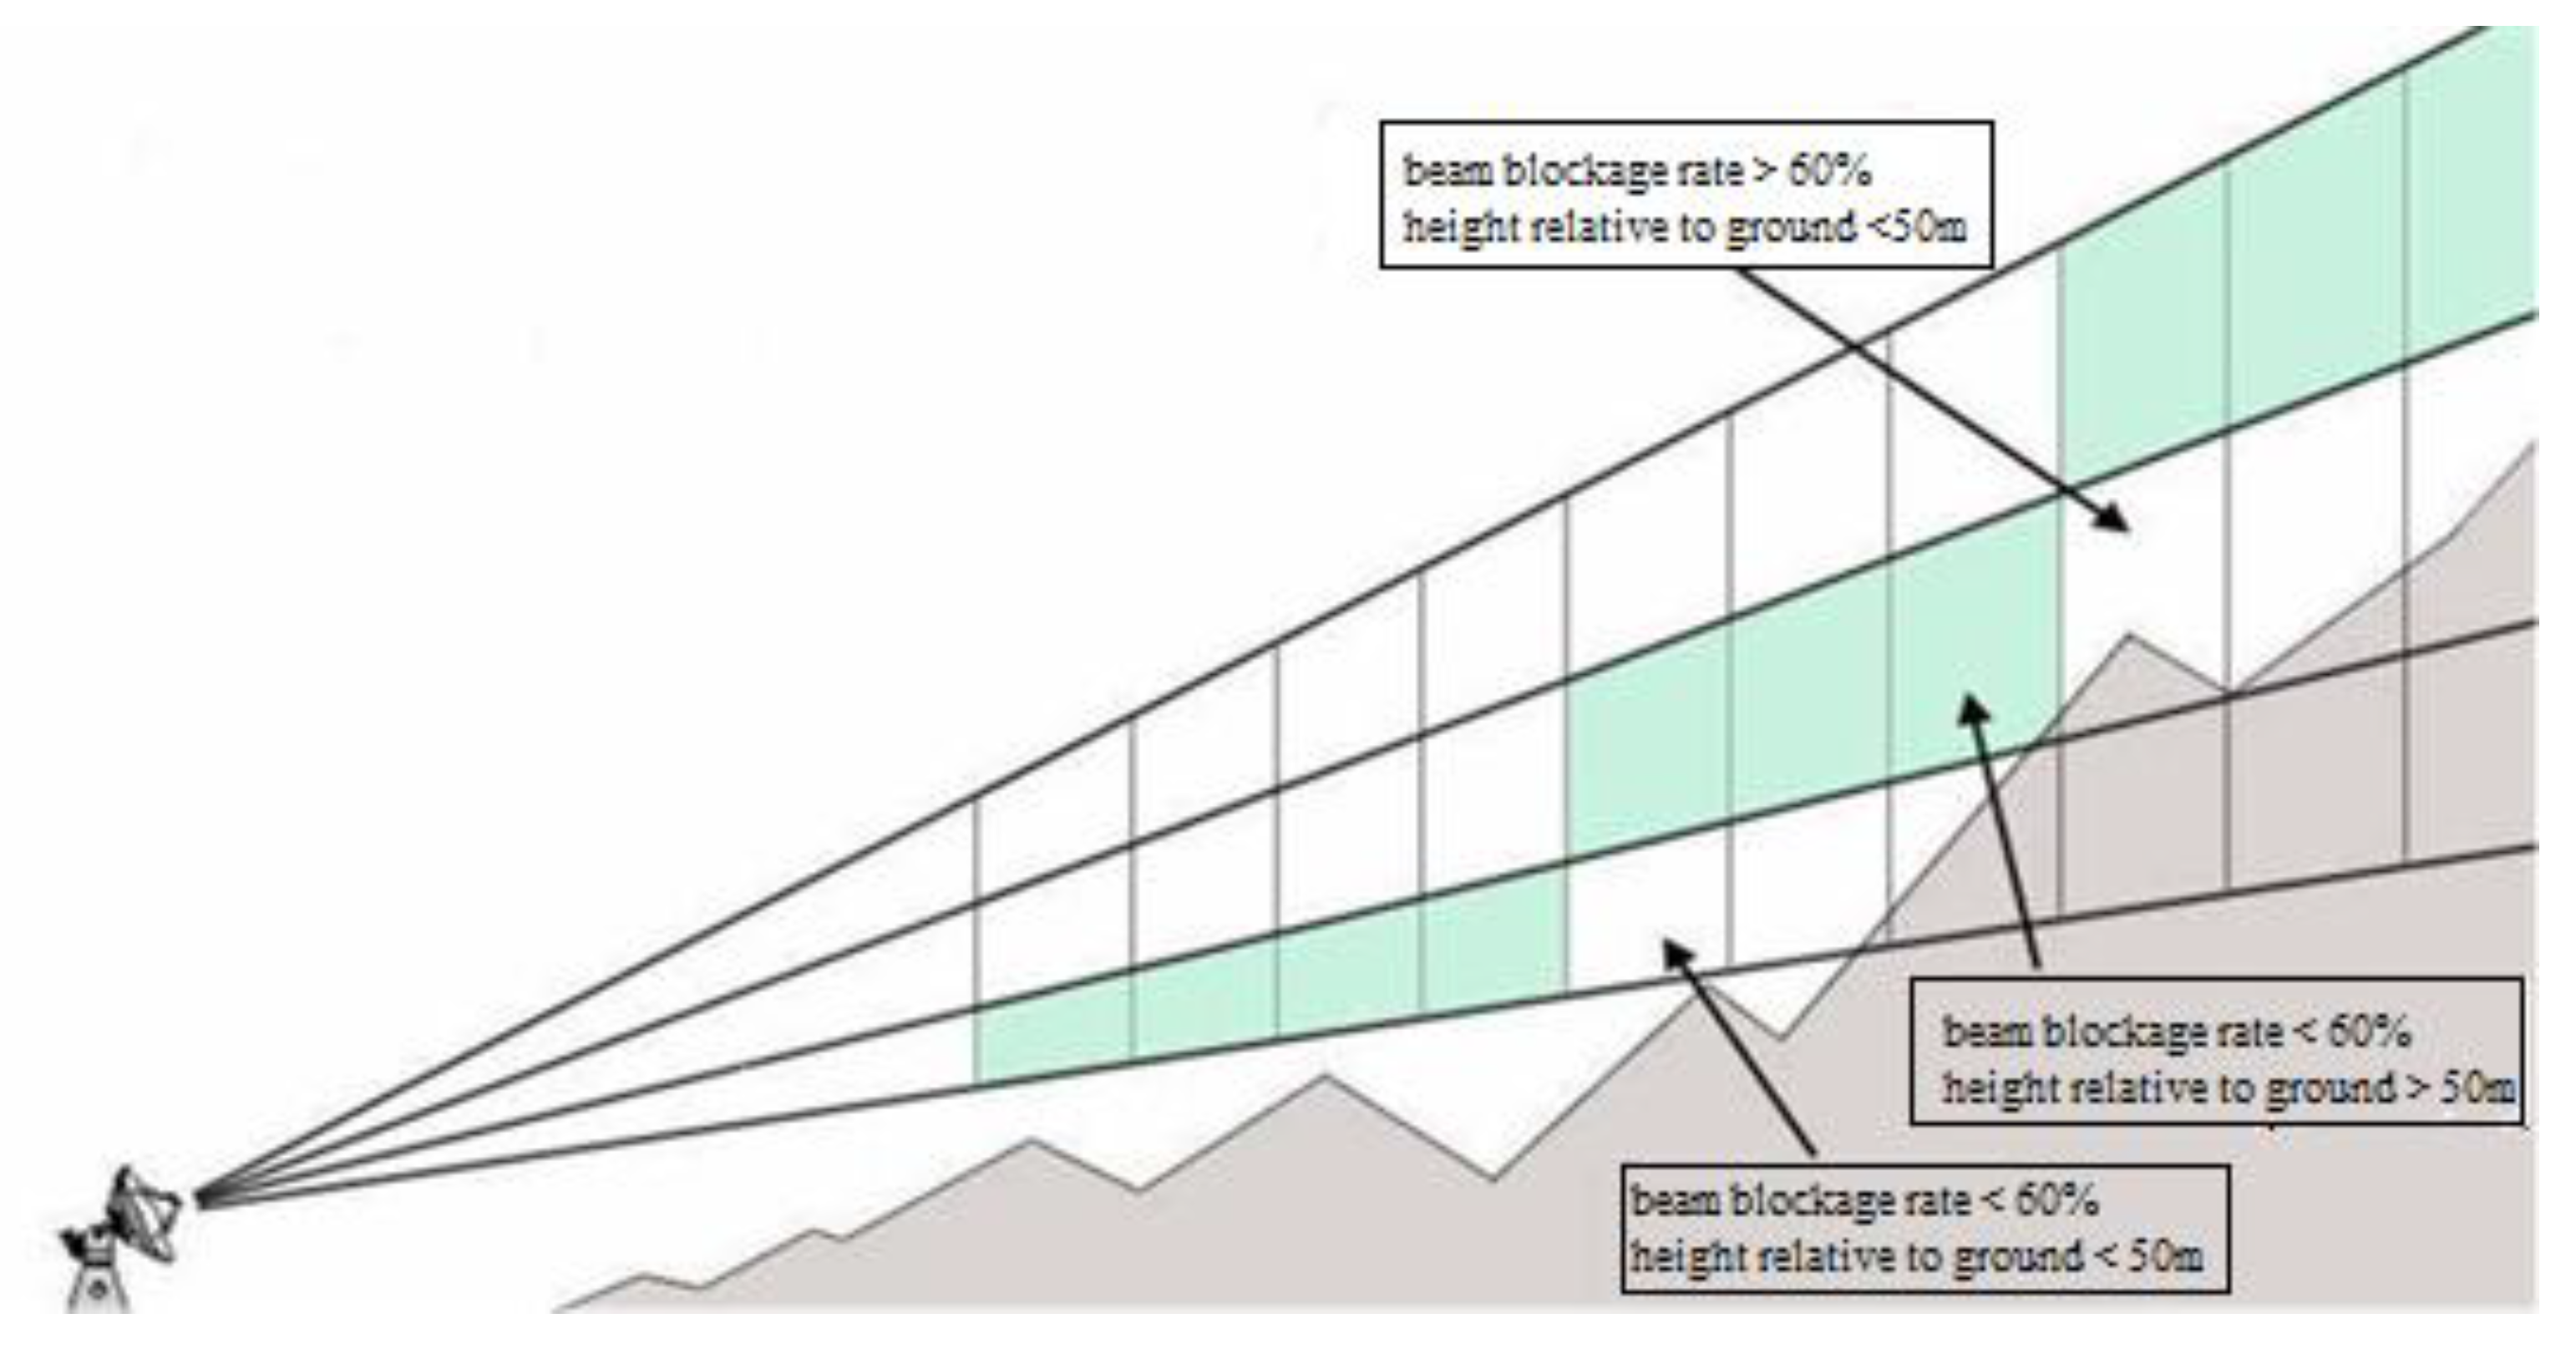
The operation of radars is based on the Doppler effect, and radar is mainly used in meteorology to measure rainfall and track storms. Radars operate by performing 360° scans at different elevation angles (from the highest to lowest elevation angles), and the observation of precipitation may then be performed using the Doppler principle. As the topography of Taiwan is highly complex and mountainous, radar scans at low elevation angles are often blocked by mountains. The current solution for circumventing this issue is to use radar echo data from higher elevations to replace the data of topographically obstructed regions, i.e., by selecting echo factors with the lowest (unobstructed) elevation angle for an obstructed region, as shown in Figure 1.
The basic meteorological radar equation for the quantification of rainfall is
In this equation, Pr is the power of the echoes received by the radar antenna, Pt is the transmission power of the radar antenna, g is the radar antenna’s gain, θ is the beam width, h is the spatial pulse length, kw is the dielectric constant of the medium, r0 is the distance from the radar to the area of precipitation, and Z is the radar reflectivity factor.
When the raindrops are very small in diameter and homogeneously distributed in space, the radar reflectivity factor and the raindrop diameter within a unit volume of the radar beam are proportionally related by a power of 6. Hence, the echo factor (the value of Z) may be expressed as
In this equation, ΔV is the unit volume, D is the diameter of the raindrops, N(D) is the raindrop diameter distribution function for a diameter, D (i.e., the raindrop density). The raindrop diameter distribution proposed by Marshall & Palmer [29] is
Here, N0 is a constant, and Λ is the rainfall rate function. Therefore, the function for the total number of raindrops may be expressed as
The rainfall intensity (R) (mm/h) of the rainfall rate is the total rainfall on each unit of surface area per unit time. Hence, the relationship between rainfall intensity and raindrop diameter is
In this equation, σw is the density of liquid water, Wt is the terminal velocity of the raindrops, and W is the flow rate of ascending airflows.
Equations (2) and (5) demonstrate that Z and R are both related to the raindrop density function; according to statistical analyses of the observed rainfall intensity and rainfall density data, the empirical function that relates rainfall intensity to the radar echo wave is
In this equation, a and b are parameters that may be derived from regression analysis with the rainfall data collected on the ground. In this study a and b are 32.5 and 1.65, respectively [30].
2.2. Information Transfer by Using Entropy
In 1948, Shannon proposed the probability-based concept of information entropy, which is quite different from thermodynamic entropy [31].
In this equation, H(x) is the entropy value. x represents an event, and p(x) represents the probability of this event.
The data acquired by the rain gauge stations of a rainfall network may overlap with each other. If we treat the data of two rain gauge stations as two variables, x and y, the joint probability of x and y, pij, may then be expressed as
The total information content may be deduced from the joint entropy, which is
Equation (9) represents the uncertainty between two rain gauge stations. Like the characteristics of the joint probability distribution, the sum of the marginal entropies of x and y should be larger than, or equal to, the joint probability
Similarly, the joint probability of three rain gauge stations (x, y, and z) is
In this equation, pijk is the joint probability between rain gauge stations x, y and z.
When a rainfall signal is measured by station x, the residual uncertainty of station y may be expressed by the conditional entropy. The conditional probability for an event occurring at x when an event has occurred at y may be expressed as
Hence,
The first term of Equation (13) is the conditional entropy, H(x|y), while the second term is the conditional probability; therefore, becomes the entropy value of y.. Equation (12) may then be written as
and
Therefore,
It may be inferred from Equations (13) and (16) that
Furthermore, the conditional entropy may be inferred from the equation below
In the conditional entropy of a single rain gauge station, there will be no uncertainty. Hence, the conditional entropy of a single station is
The calculation of transferable information may be used to determine whether two rain gauge stations will possess shared or redundant information, which would allow the rainfall at Station y to be deduced from the data of Station x. The equation for calculating the transferable information is
or
The importance of each rain gauge station in a rainfall network is described by its entropy value, and the priority of the rain gauge stations may be displayed by sorting the stations by entropy. The rain gauge station that has the largest entropy value will have the highest uncertainties, and it should be the first station selected for entry into the rainfall network. After the first rain gauge station has been determined, the rain gauge stations with the lowest quantity of redundant information should be systematically added to the rainfall network one after another, to reduce the uncertainty of the system. Hence, the criterion for determining the second most important rain gauge station for addition to the rainfall network is
This selects for the station with the highest H(x1|x2) value. The selection criterion for the j-th most important rain gauge station is then
The stations with the highest value of may then be selected from the calculations. This yields a ranking of all of the rain gauge stations in a rainfall network by the redundancy of their data, and the station with the highest redundancy will be the last station to be added to the network.
The ranking of rain gauge stations by importance derived from their entropy values may be used as an ordering for the removal of stations, and the increase in uncertainty may be used as a criterion for determining the removal of a station. After a certain number of stations have been added to the network, the value of will no longer increase or change significantly, and the information provided by further additions will be limited. Hence, an exponential model may be defined using the number of rain gauge stations and the value of to find the critical quantity of information and the required number of rain gauge stations, as shown below
where ω and c are to-be-determined parameters.
If the number of rain gauge stations in a rainfall network is larger than the required number of stations, then the stations that rank lower than the required number may then be removed. Conversely, if the number of rain gauge stations in a rainfall network is lower than the required number of stations, more stations then need to be added.
The ranking of rain gauge stations by importance based on their entropy values may be used as an ordering for the removal of stations. The maximization of entropy is the objective of each station selection stage. The addition of each station should increase the joint entropy, but after a certain number of stations have been added to the network, it may be observed that the entropy value, H(n) no longer increases or changes significantly, and converges to a fixed value instead. This indicates that all further additions to the system will only be able to provide a limited quantity of information. The index model of this study was used to plot the relationship between and the number of rain gauge stations, to find the critical quantity of information and the number of required stations. Here, we define a km coefficient, which represents the ratio between the entropy value of the m-th station added to the system and the total entropy of the study area. Hence, km may be used to represent the quantity of information provided by the m-th station added to the network.
Suppose that the study area has n measurement stations; after the base station has been selected, each subsequent addition is performed with the objective of maximizing entropy. The definition of km is then
and k1, k2, …, km, …, kn−1, kn < 1.
When determining the number of rain gauge stations for an area, a threshold value, also needs to be determined. When km > , the number of rain gauge stations for a study area may then be obtained. The determination of the threshold value may be determined by the increase in efficacy, as revealed by the increase in km. The threshold is usually defined as km = 0.95, i.e., 95% of the information content. If the number of rain gauge stations in a rainfall network is larger than the required number of stations, the stations that rank lower than the required number may then be removed. Conversely, if the number of rain gauge stations in a rainfall network is smaller than the required number of stations, more stations then need to be added.
3. Study Area and Data Description
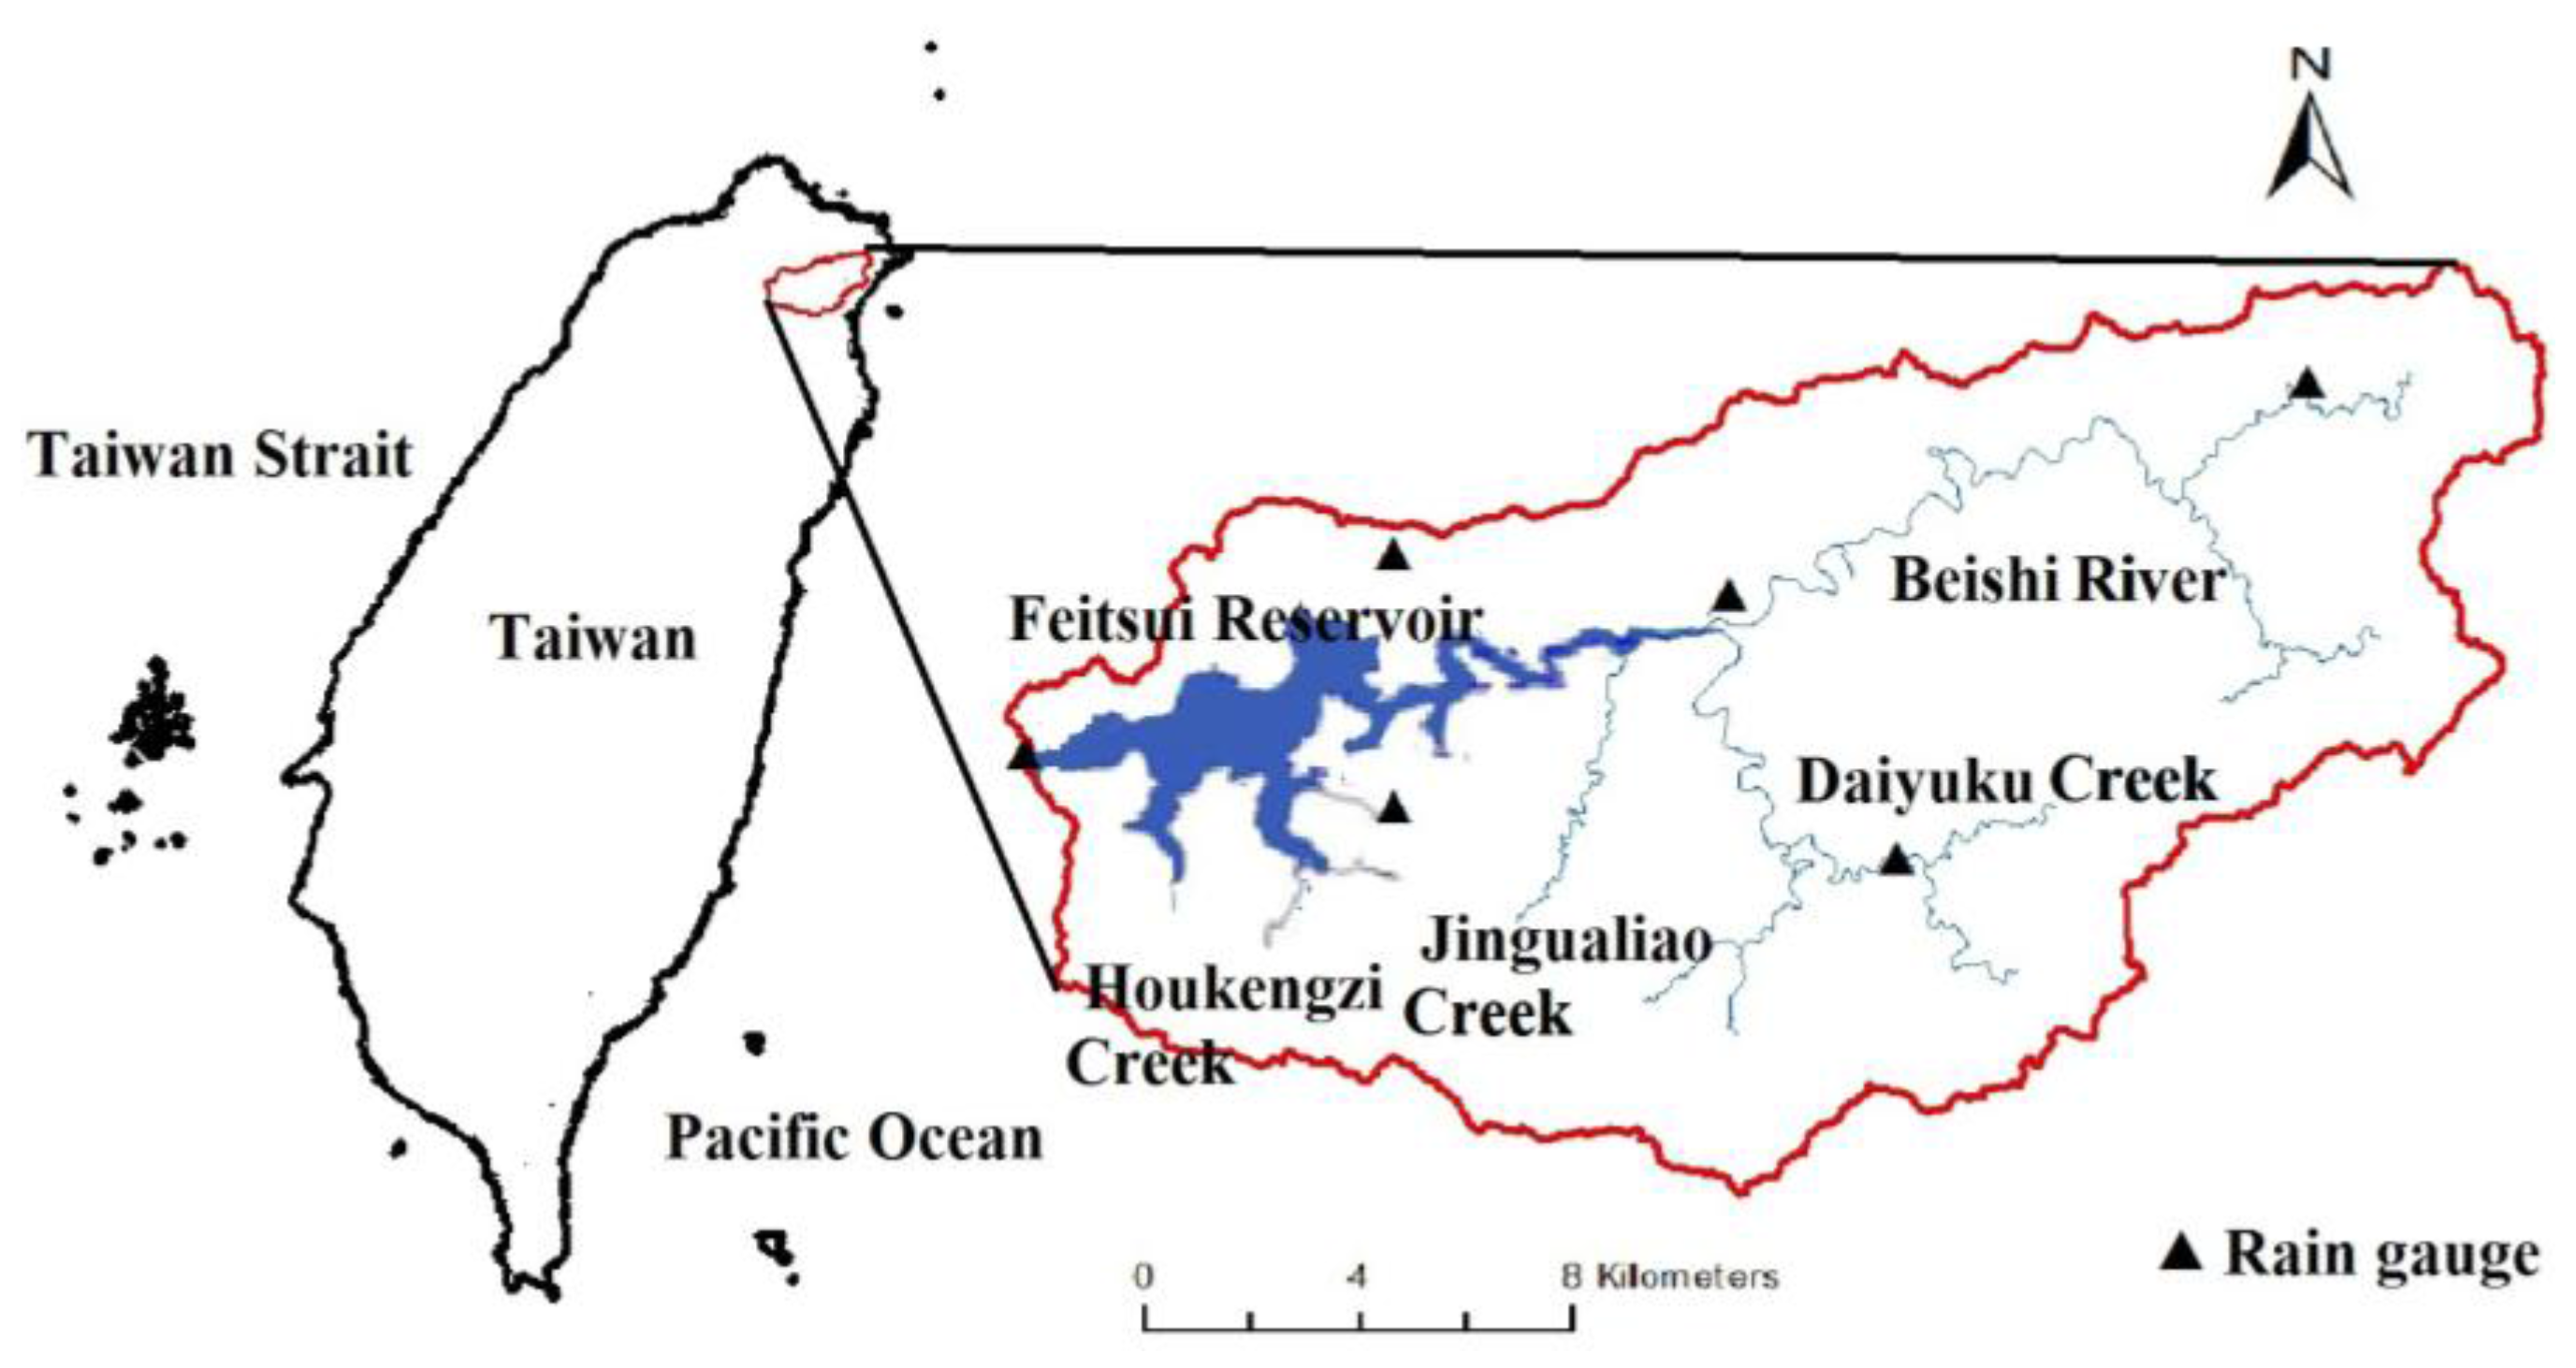
The Feitsui Reservoir is located southeast of Taipei. The main river of the Feitsui Reservoir’s catchment is approximately 50 km long, with a drainage area of about 303 km2 (Figure 2). The dendritic drainage system of this catchment includes four tributaries (the Daiyuku Creek, the Jingualiao Creek, the Houkengzi Creek, and the Huoshaozhang Creek) joined together into the main river, the Beishi River. The source of the Beishi River lies in the western slope at the northern end of the Xueshan Range, and it flows into Pinglin before feeding into the Daiyuku Creek and Jingualiao Creek. After this point, the Beishi River broadens and slows before it flows westward into the Feitsui Reservoir.
The Feitsui Reservoir catchment is within the subtropical climate zone. Cold and wet northeasterly monsoons prevail in winter, and the cold Arctic air will invade southwards from time to time. Cold snaps, low clouds and drizzles thus have a high probability of occurrence in winter. The southwesterly monsoons in summer have a minimal impact on this region, due to the obstruction of the Xueshan range. However, local showers often occur in the afternoon since solar radiation on the river valleys and hillsides has a significant impact on local convection. During the transition between summer and autumn, typhoons will bring about warm and highly humid airflows, and extremely heavy and intense rainfalls. The temporal and spatial distributions of rainfall were already taken into consideration during the initial design of the current rain gauge stations. For this reason, the Taipei Feitsui Reservoir Administration has established an integrated weather station for the Feitsui Reservoir in one location, and rain gauge stations in five locations, as shown in Figure 2.
The maximum, minimum and standard deviation of the monthly rainfall in the watershed are shown in Table 1. The rainy season is from August to November, and the variance in mean monthly rainfall often exceeds 100 mm. The rainfall tends to fluctuate from year to year; the annual rainfall ranges between 2520 and 5740 mm, and the mean annual rainfall is approximately 3760 mm. From August to October, this area is impacted by typhoons and storms that frequently bring about heavy rainfall, whereas the rainfall frequency peaks in the period between October and January, due to the impacts of the northeasterly monsoon. During 2006–2015, at least 30 typhoons invaded Taiwan. The rainfall data during 2006 and 2015, including the heavy rain coming with the typhoons, is used for this study.
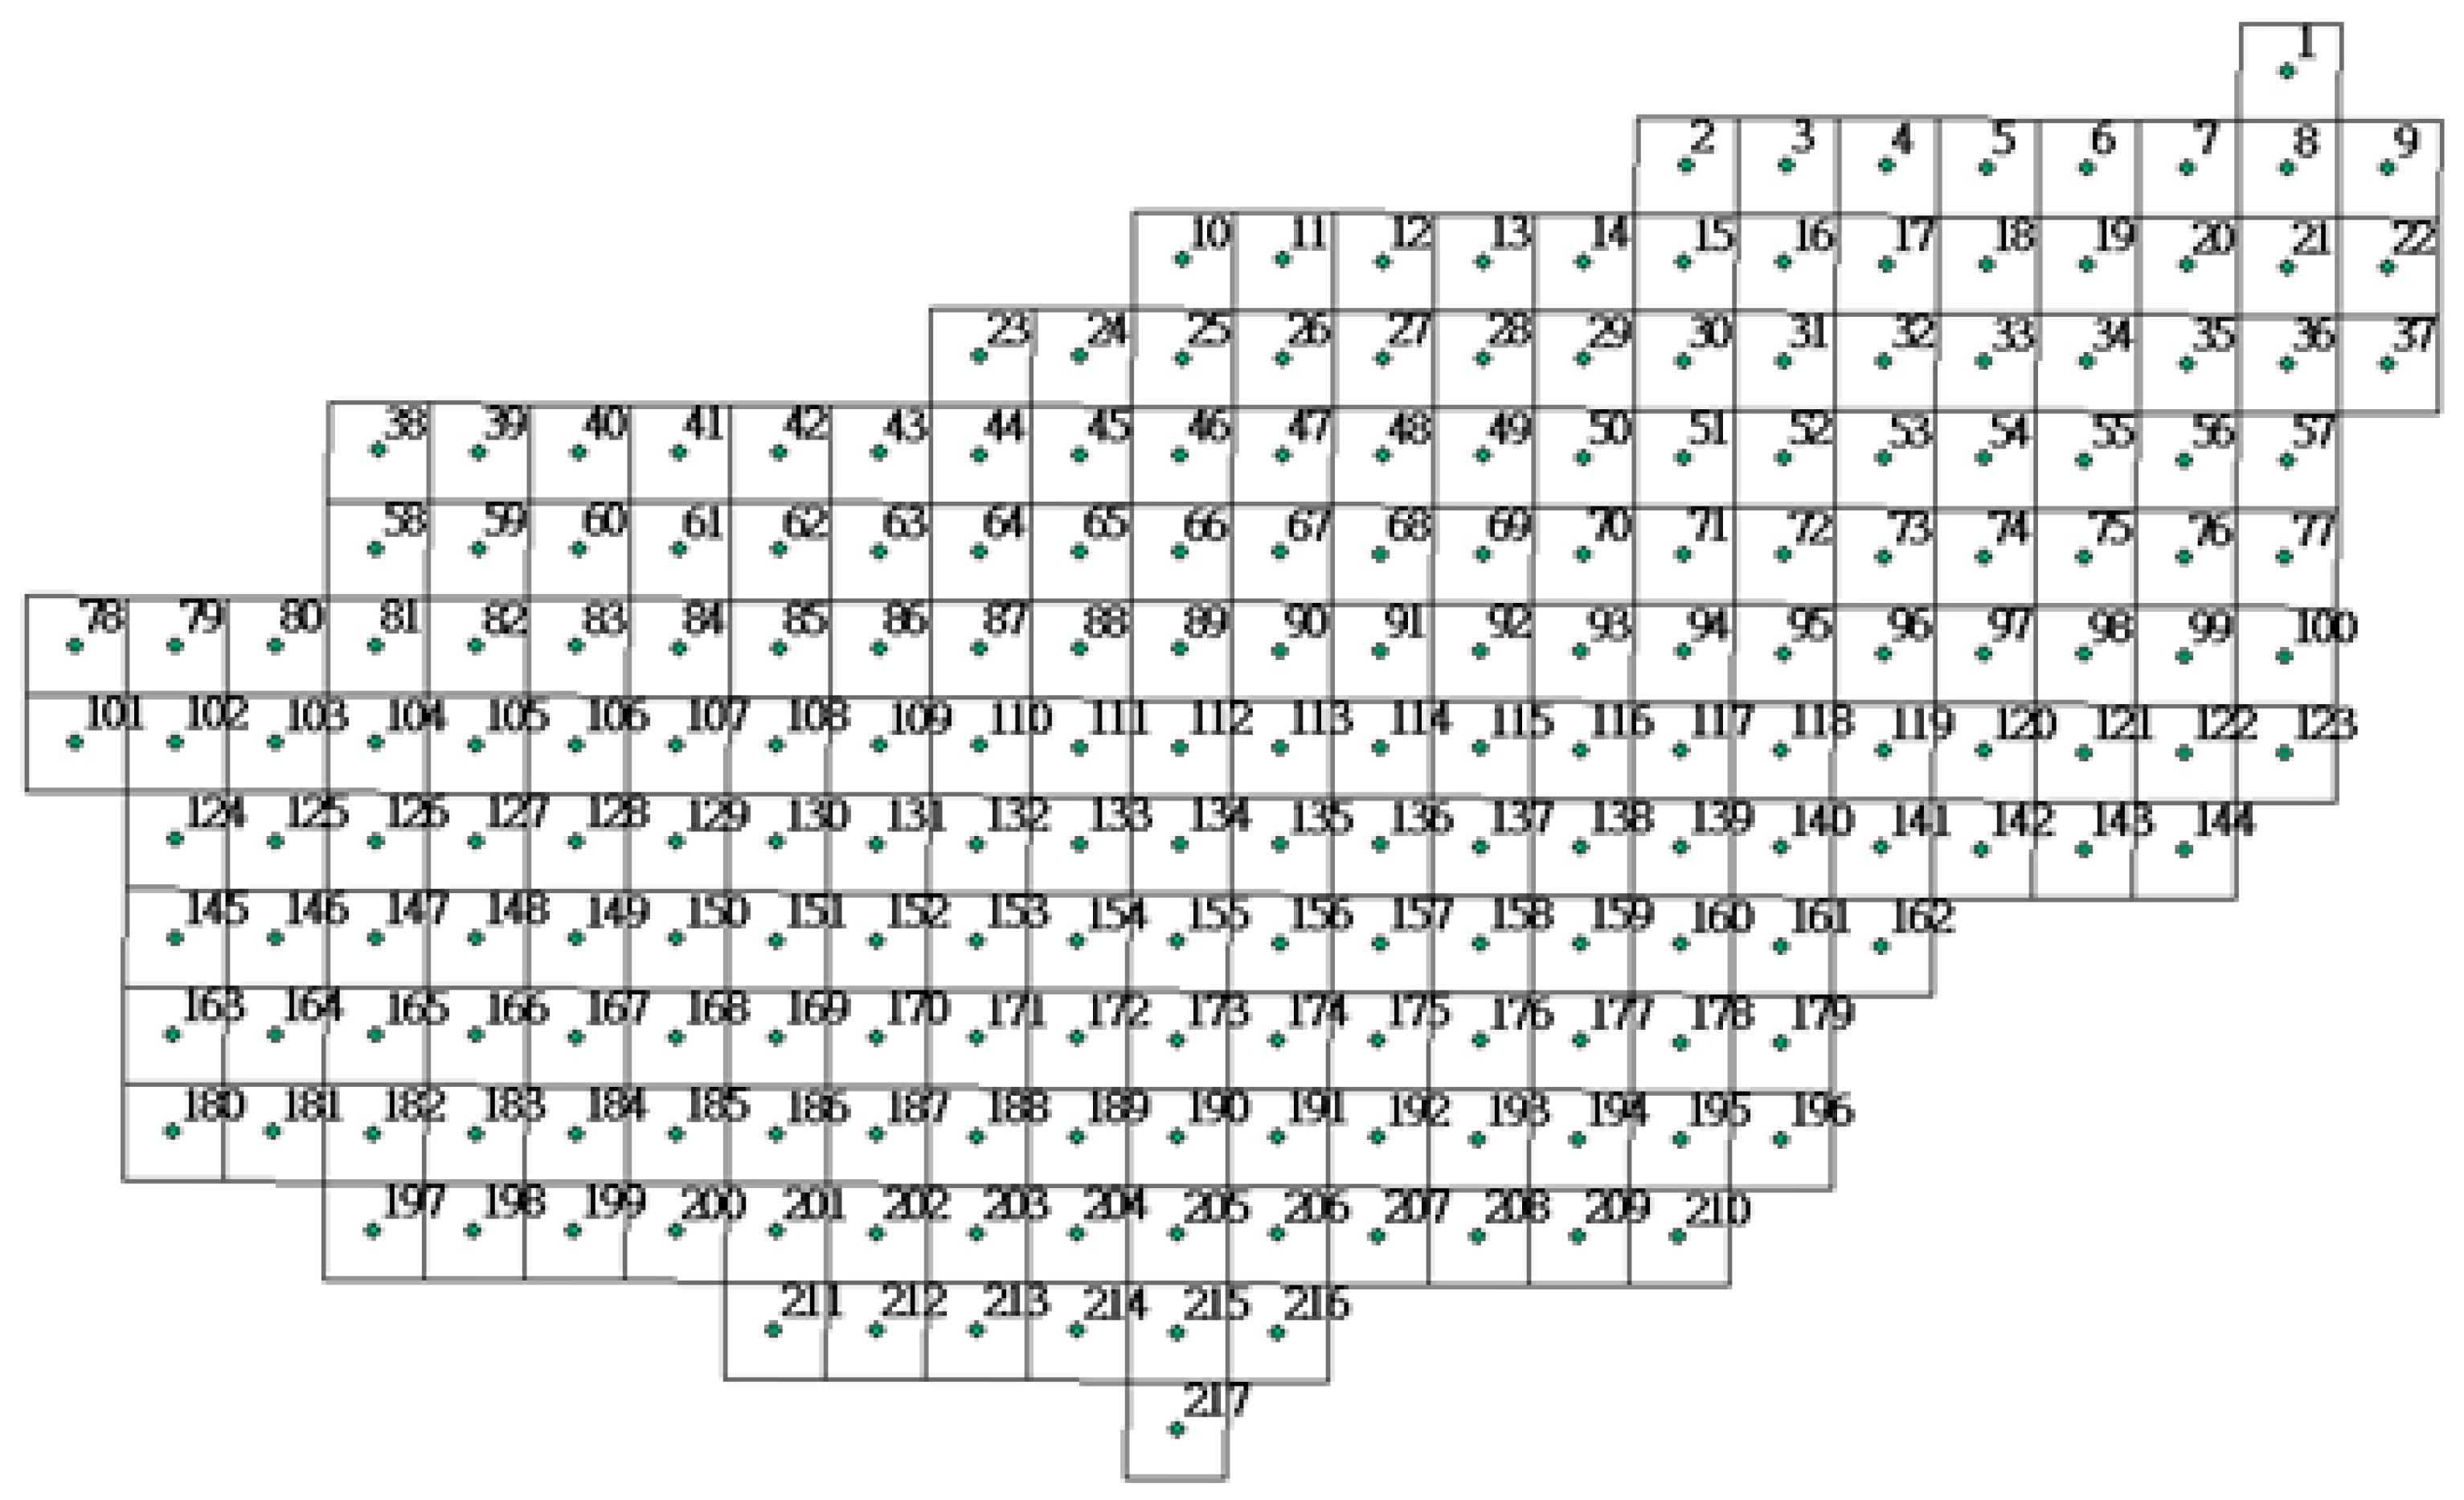
The weather radar station was installed by the Central Weather Bureau of Taiwan to provide real-time severe weather information. It is located around the most northeastern Taiwan. The radar was tested in July 1996, however it was destroyed by a typhoon in August 1996. The radar was repaired in 1998, and the data acquisition system was upgraded in 2006. In order to make the data consistent, only the data after 2006 is used in this study. The radar has a wavelength of 10 cm, a spatial resolution of 1.3 × 1.3 km2, and makes rainfall observations once every 10 min. Therefore, the catchment of the Feitsui Reservoir may be divided into 217 grids according to the radar’s spatial resolution, with the center of each grid being the location of a candidate rain gauge station, as shown in Figure 3. The 19th, 61st, 66th, 102nd, 129th, and 157th grids in Figure 3 correspond to the locations of the six currently existing rain gauge stations.
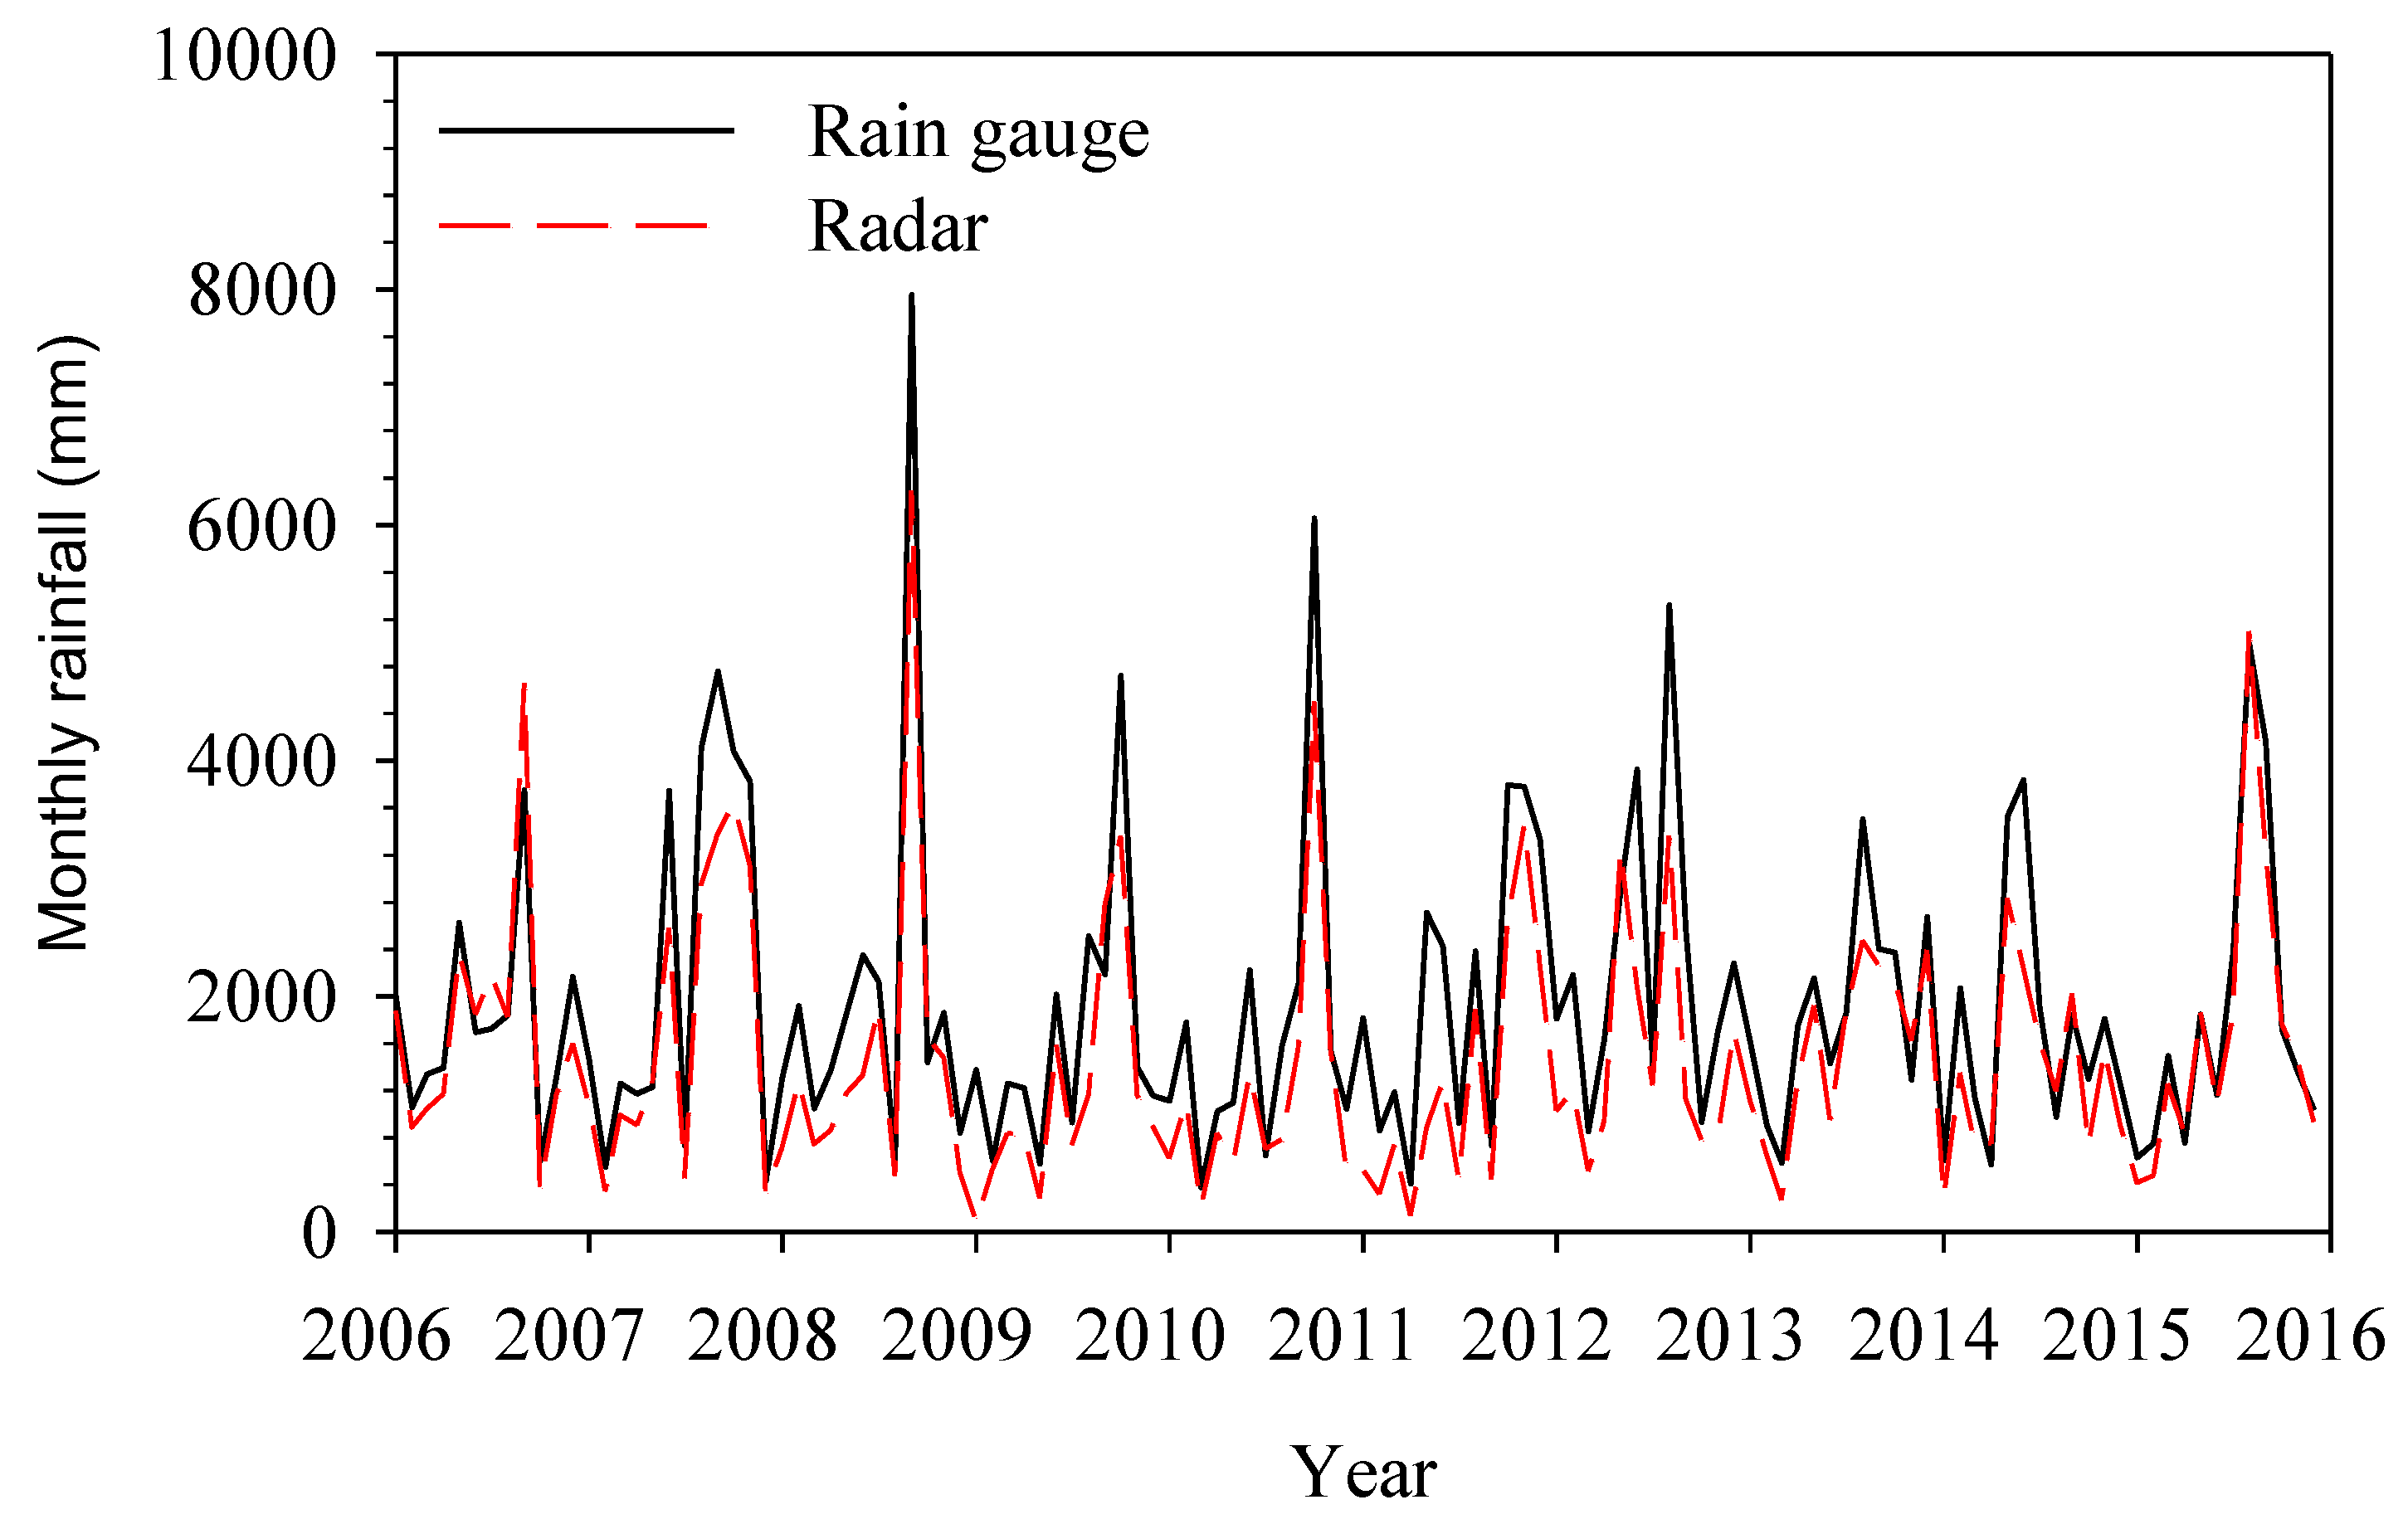
Prior to this study, it has not been assessed whether increases in the number of rain gauge stations are necessary in light of alterations to the spatial and temporal distribution of rainfall induced by global climate changes, to ensure that the rainfall data being acquired is sufficient for the smooth operation of the reservoir. To address this shortfall, the mean monthly rainfall data from January 2006 up to December 2015 (120 months in total) was used to evaluate the efficacy of the current rainfall network. Figure 4 illustrates the monthly rainfall map of the Feitsui Reservoir’s catchment from 2006 to 2015. Heavy rainfalls always occur in summer due to the arrival of typhoons, while the Meiyu front brings rain in spring, and the northeasterly monsoon also brings rain in winter, thus resulting in rainfall over long periods of the year. The minimum in rainfall usually occurs in autumn. The Feitsui Reservoir provides the water supply and usually operates a regulation line for 10-days. According to this, the rainfall temporal period for six-month/year seems too long for the reservoir operation and the analysis, hourly data may contribute to the flood control, while the month scale is reasonable for reservoir operation and also reflecting the variation during dry and wet seasons.
4. Results and Discussion
As rainfall network evaluations will require considerations on the long-term temporal and spatial distributions of rainfall, the monthly rainfall data was selected for data analysis in this work. The arithmetic mean was used to estimate the mean rainfall of the catchment to minimize the impact of the spatial distribution of rainfall, and because the six currently existing rain gauge stations are spatially distributed in a uniform manner.
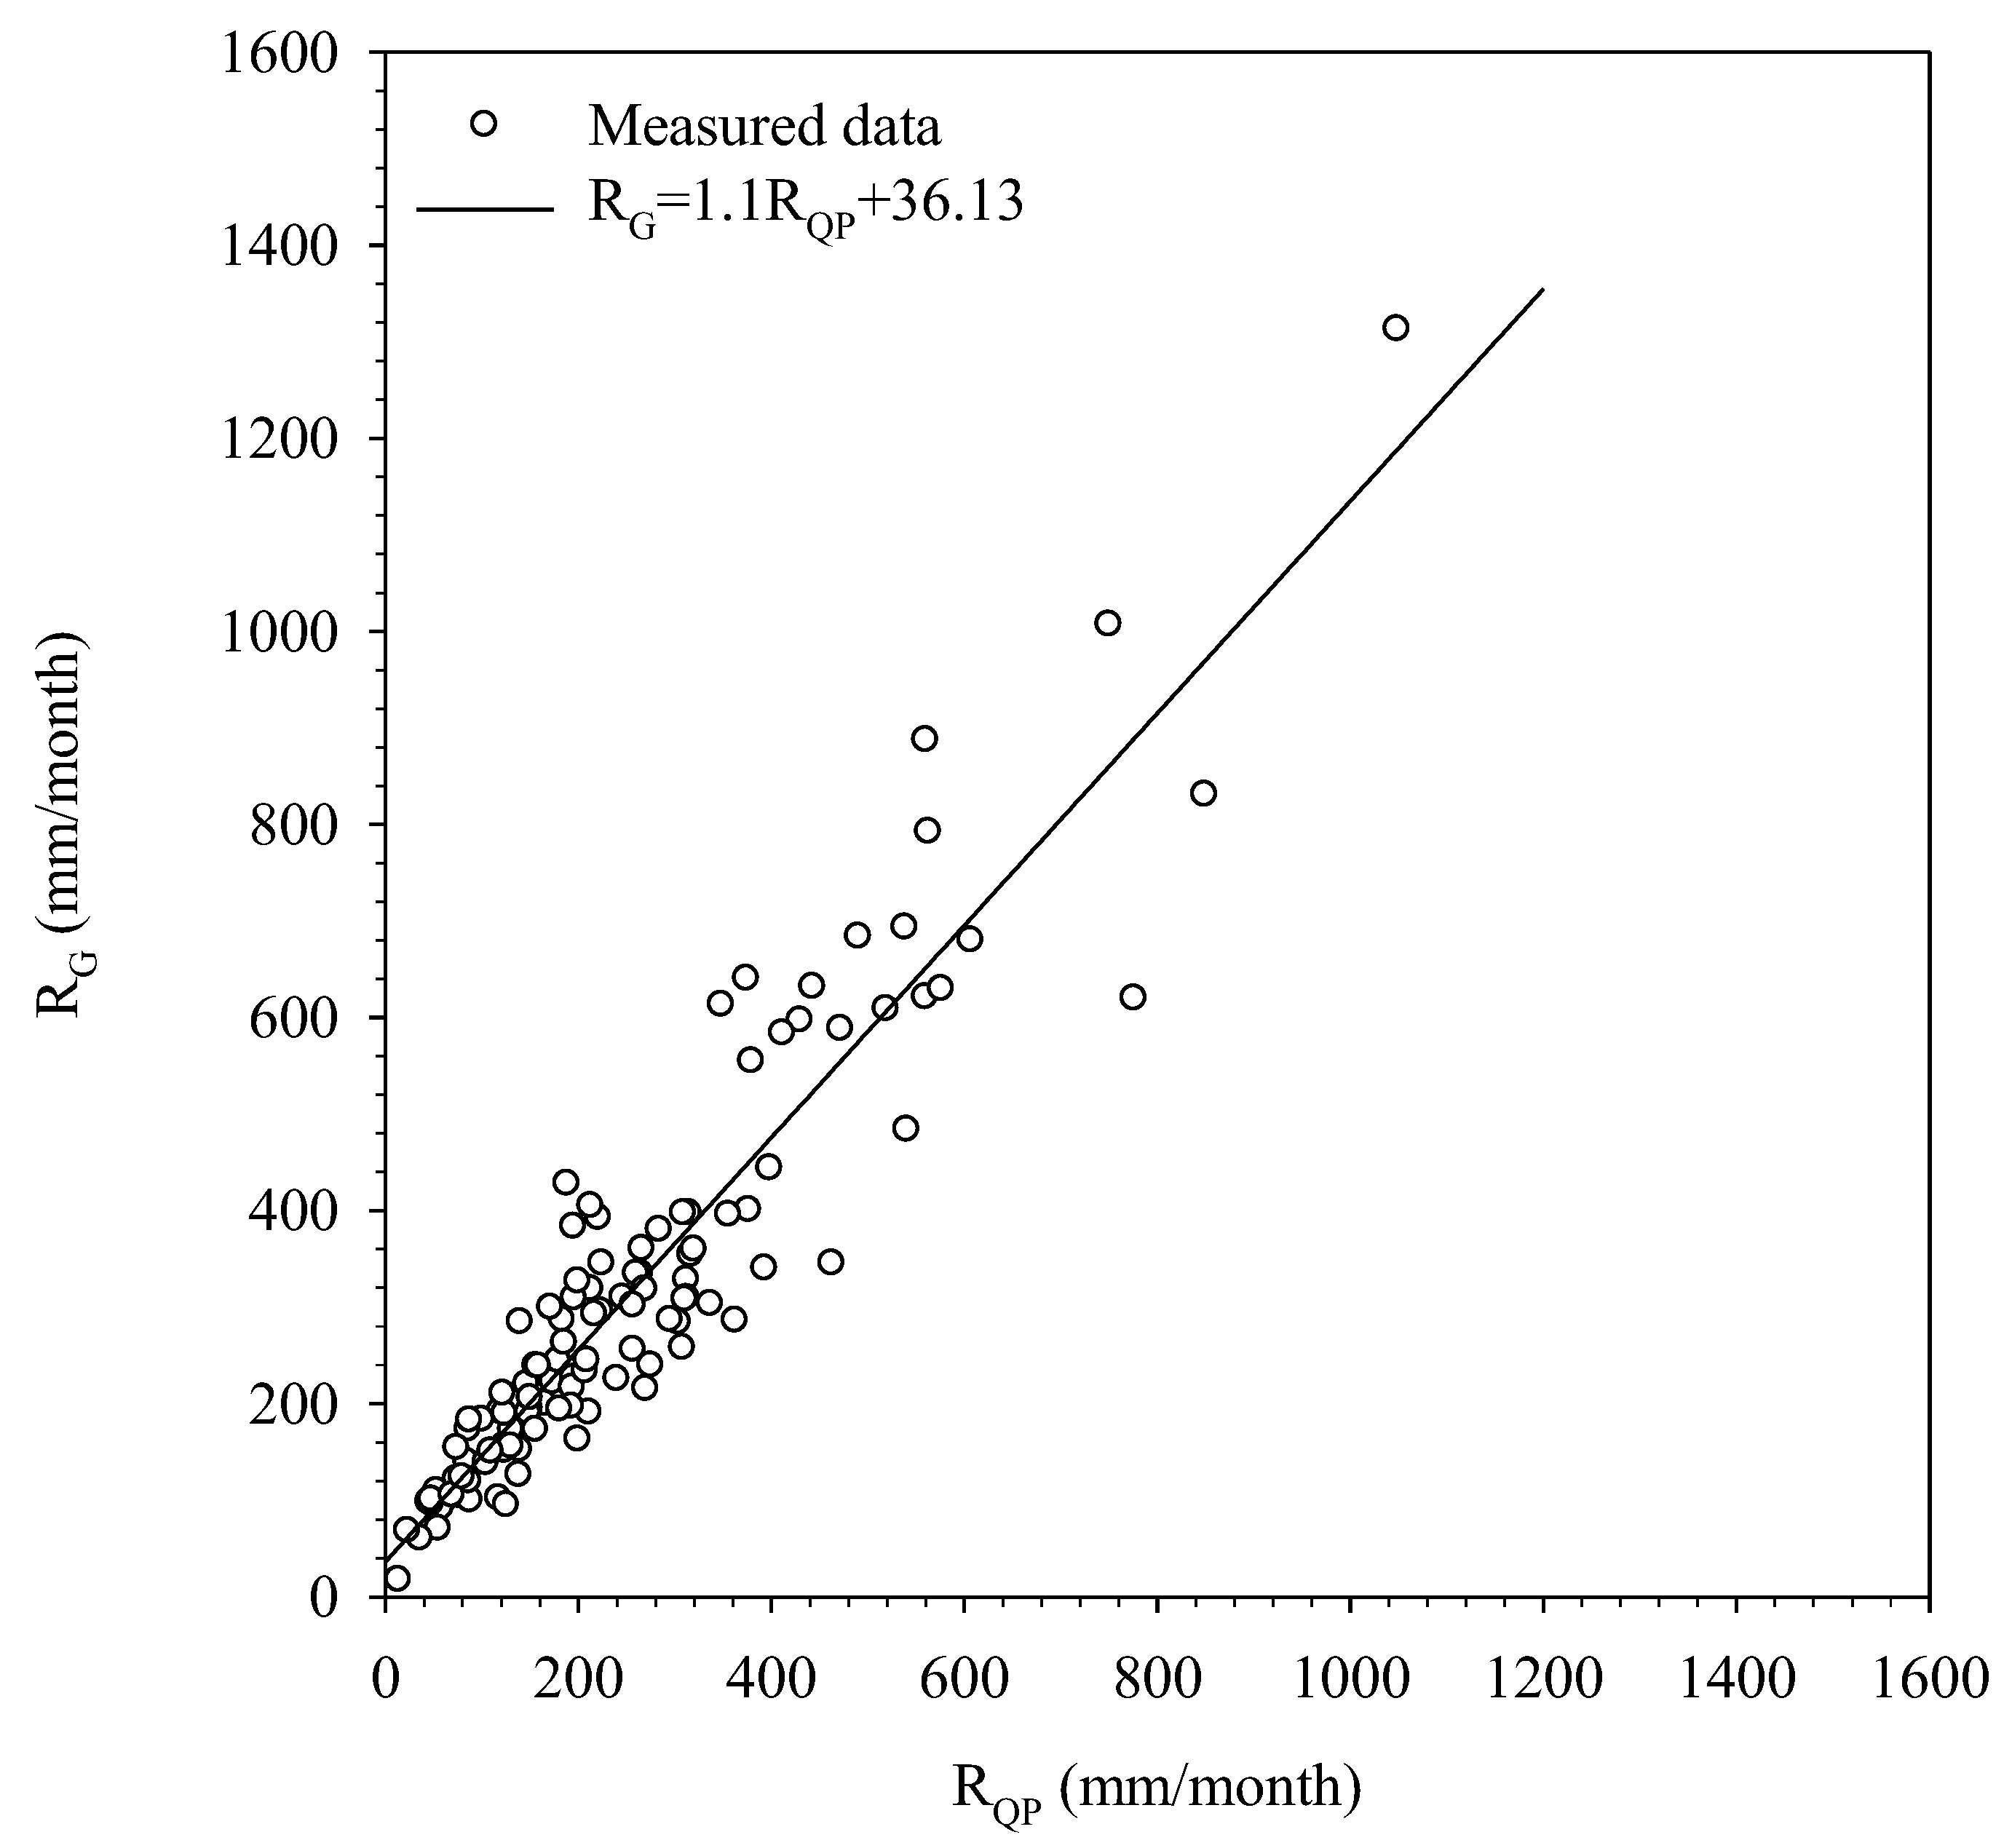
To estimate the rainfall data of the candidate rain gauge stations for the evaluation of the rainfall network, the observed mean monthly rainfall of the catchment was derived from the rainfall data of the six currently existing rain gauge stations, while the radar of QPESUMS was used to estimate the monthly rainfall at these six locations to obtain the radar-derived mean monthly rainfall. A linear regression was then used to probe the relationship between these quantities. Figure 5 displays the relationship between the rainfalls measured by the six currently existing rain gauge stations and the rainfalls estimated using the radar system. The horizontal axis (RQP) indicates the monthly rainfall observed by the radar, while the vertical axis (RG) represents the mean monthly rainfall of the catchment measured by the rain gauge stations. It was found that these quantities were related by RG = 1.1RQP + 36.13, with a correlation coefficient of 0.87. Since the correlation is quite strong, this equation and the radar’s rainfall data may then be used to estimate the mean monthly rainfalls of all the candidate rain gauge stations in the 211 grids of the catchment, over the last 20 years.
In the study area, stations were selected according to transferable information calculations and joint entropy-based ordering. Hence, the entropy values of the selected stations in the study area were calculated using joint entropy and transferable information, and the stations were then ordered by sorting the calculated values. The ranking of rain gauge stations by importance based on their entropy values may be used as an ordering for the removal of stations. The maximization of entropy is the objective of each station selection stage. Each station addition should increase the joint entropy, but after the number of added stations has reached a certain value, it may be observed that the entropy value, H(n), no longer increases or changes significantly, and converges to a fixed value; this indicates that all further additions to the system will only provide a limited quantity of information.
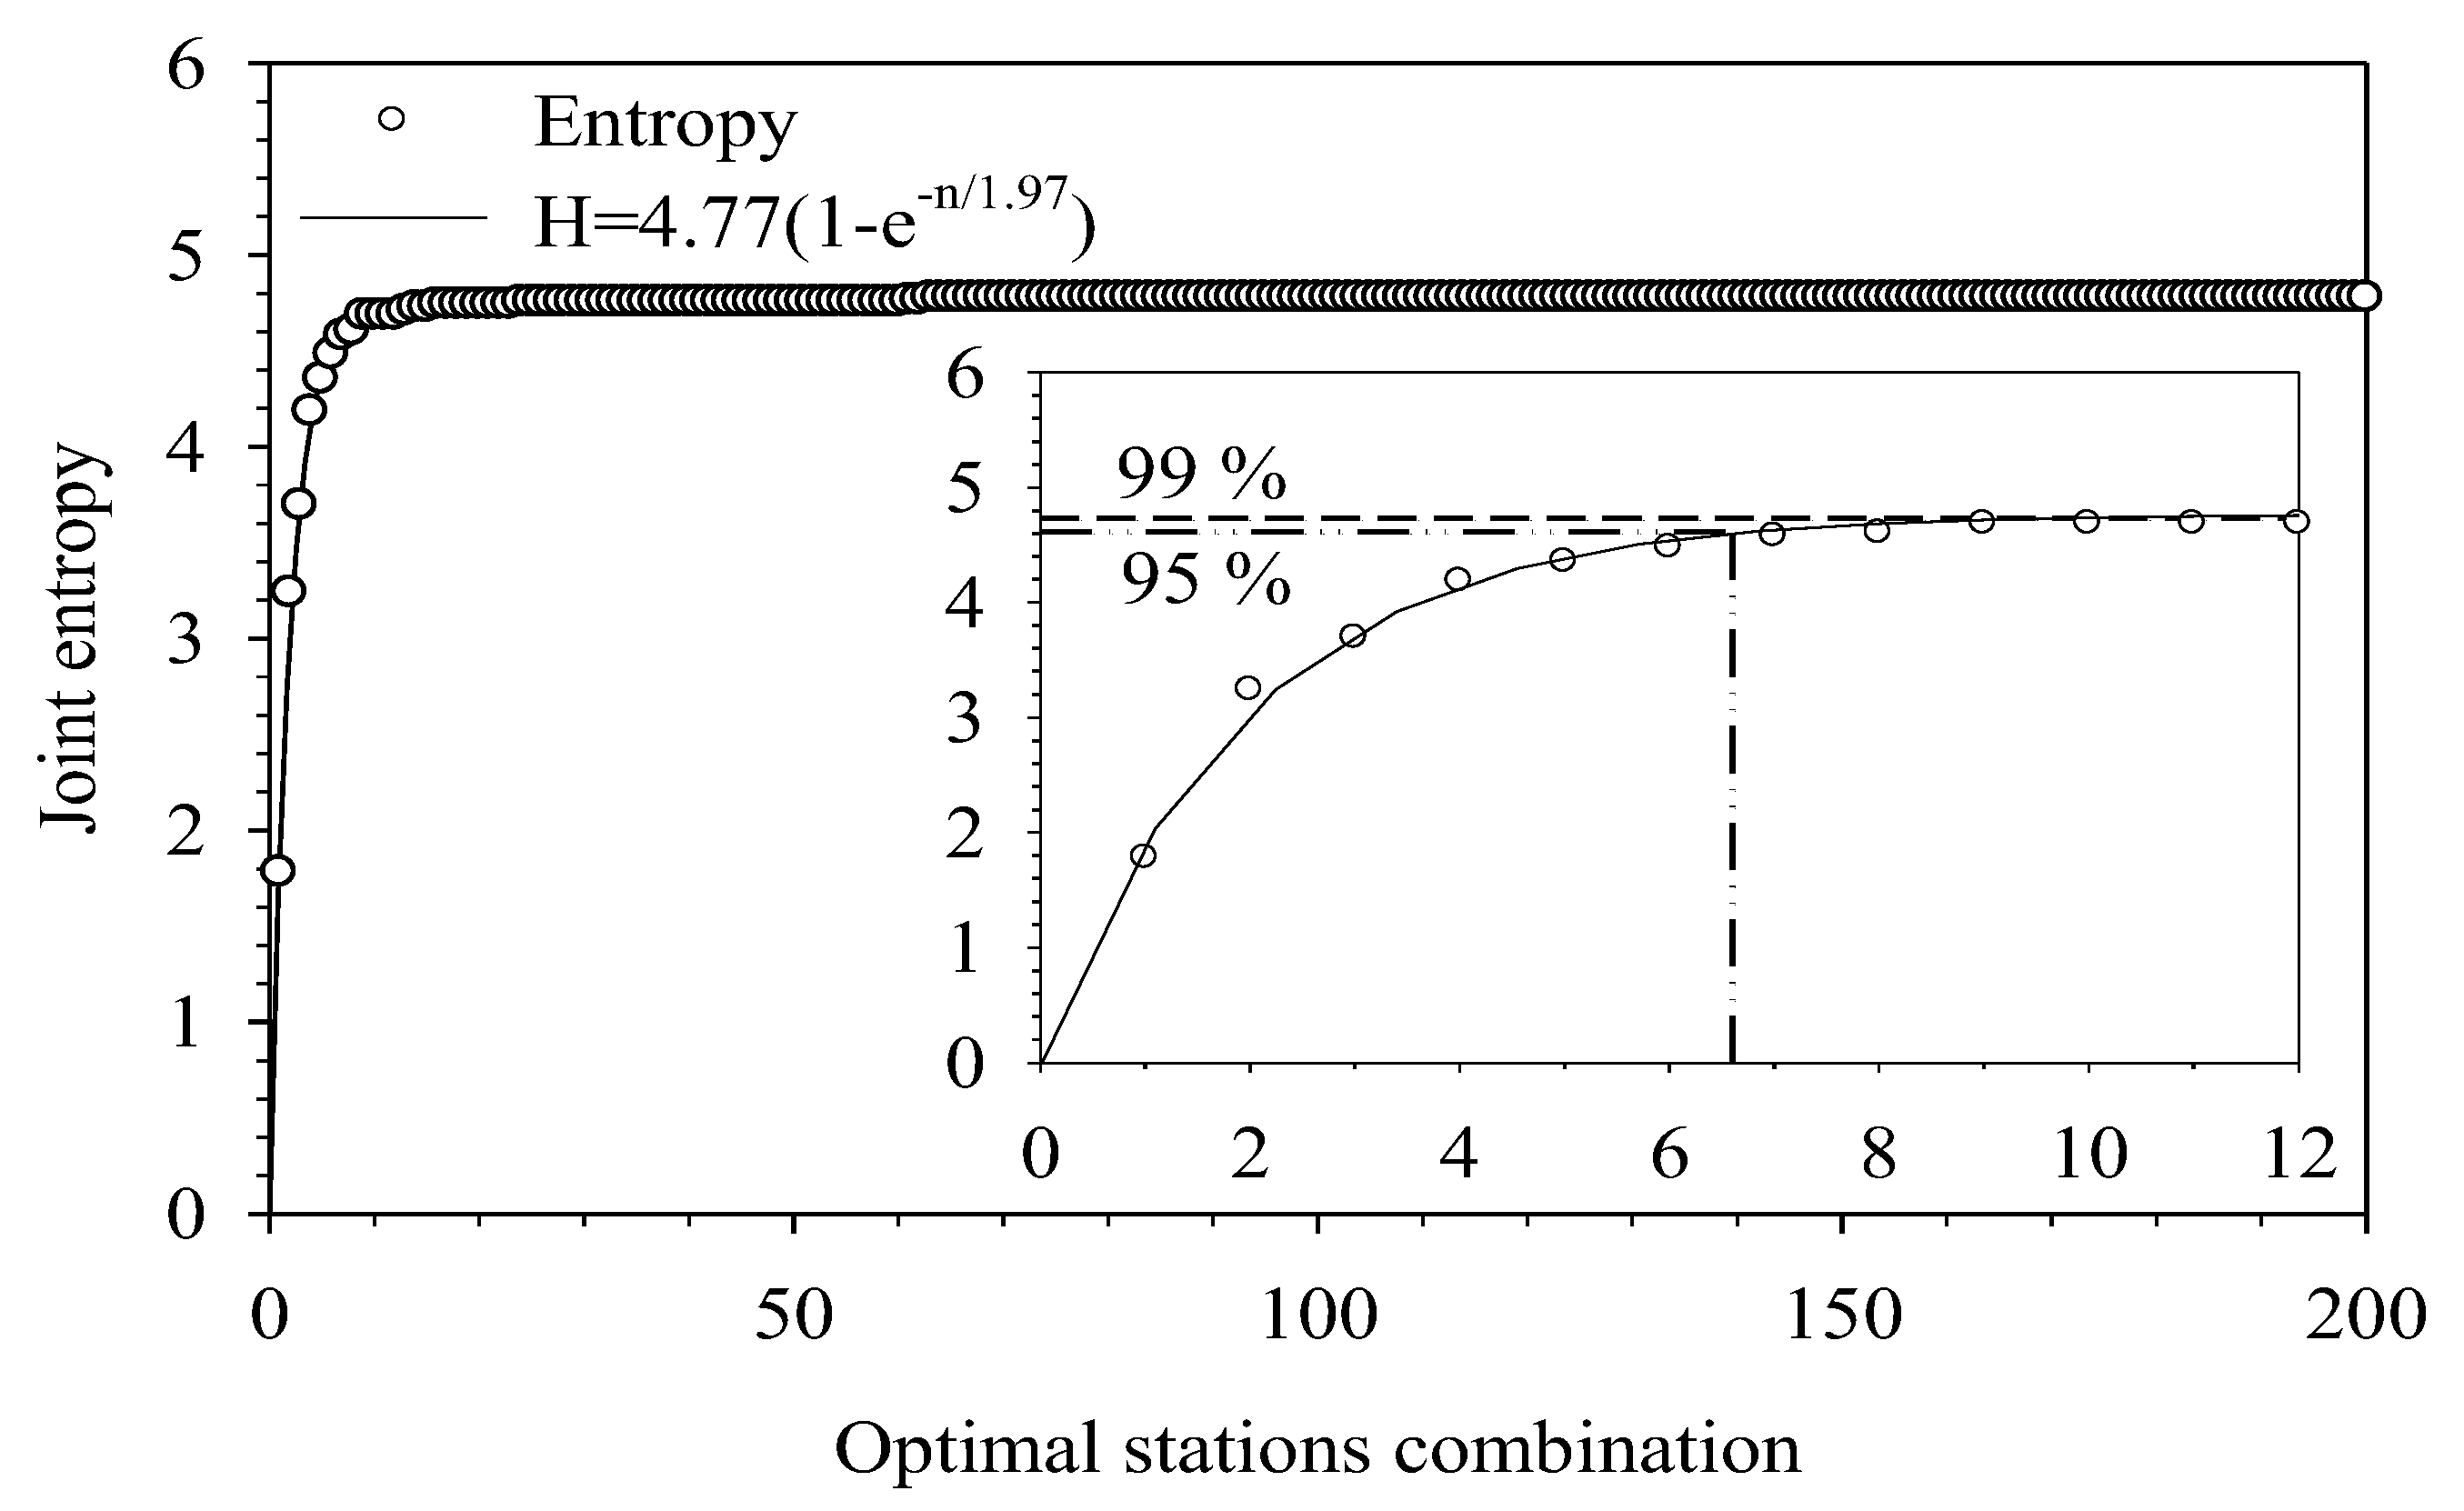
The study area has 217 grids. The grids corresponding to the six currently existing stations were selected as necessary locations for the reservoir’s operation, while the remaining grids were added one after another, based on the principle of entropy maximization. A threshold value is usually defined to determine the number of stations required by some area. In this case, the threshold, , was defined as 0.95, which corresponds to a threshold value of 95%. By doing so, almost all of the rainfall information of a region can be acquired using only a few rain gauge stations. Hence, when , the number of stations that need to be added to the study area and the location of these stations may then be obtained. The relationship between the entropy value and the optimal number of stations is illustrated in Figure 6; an index function was used in this work (as shown in Equation (24)) to obtain an estimate for the optimal number of stations.
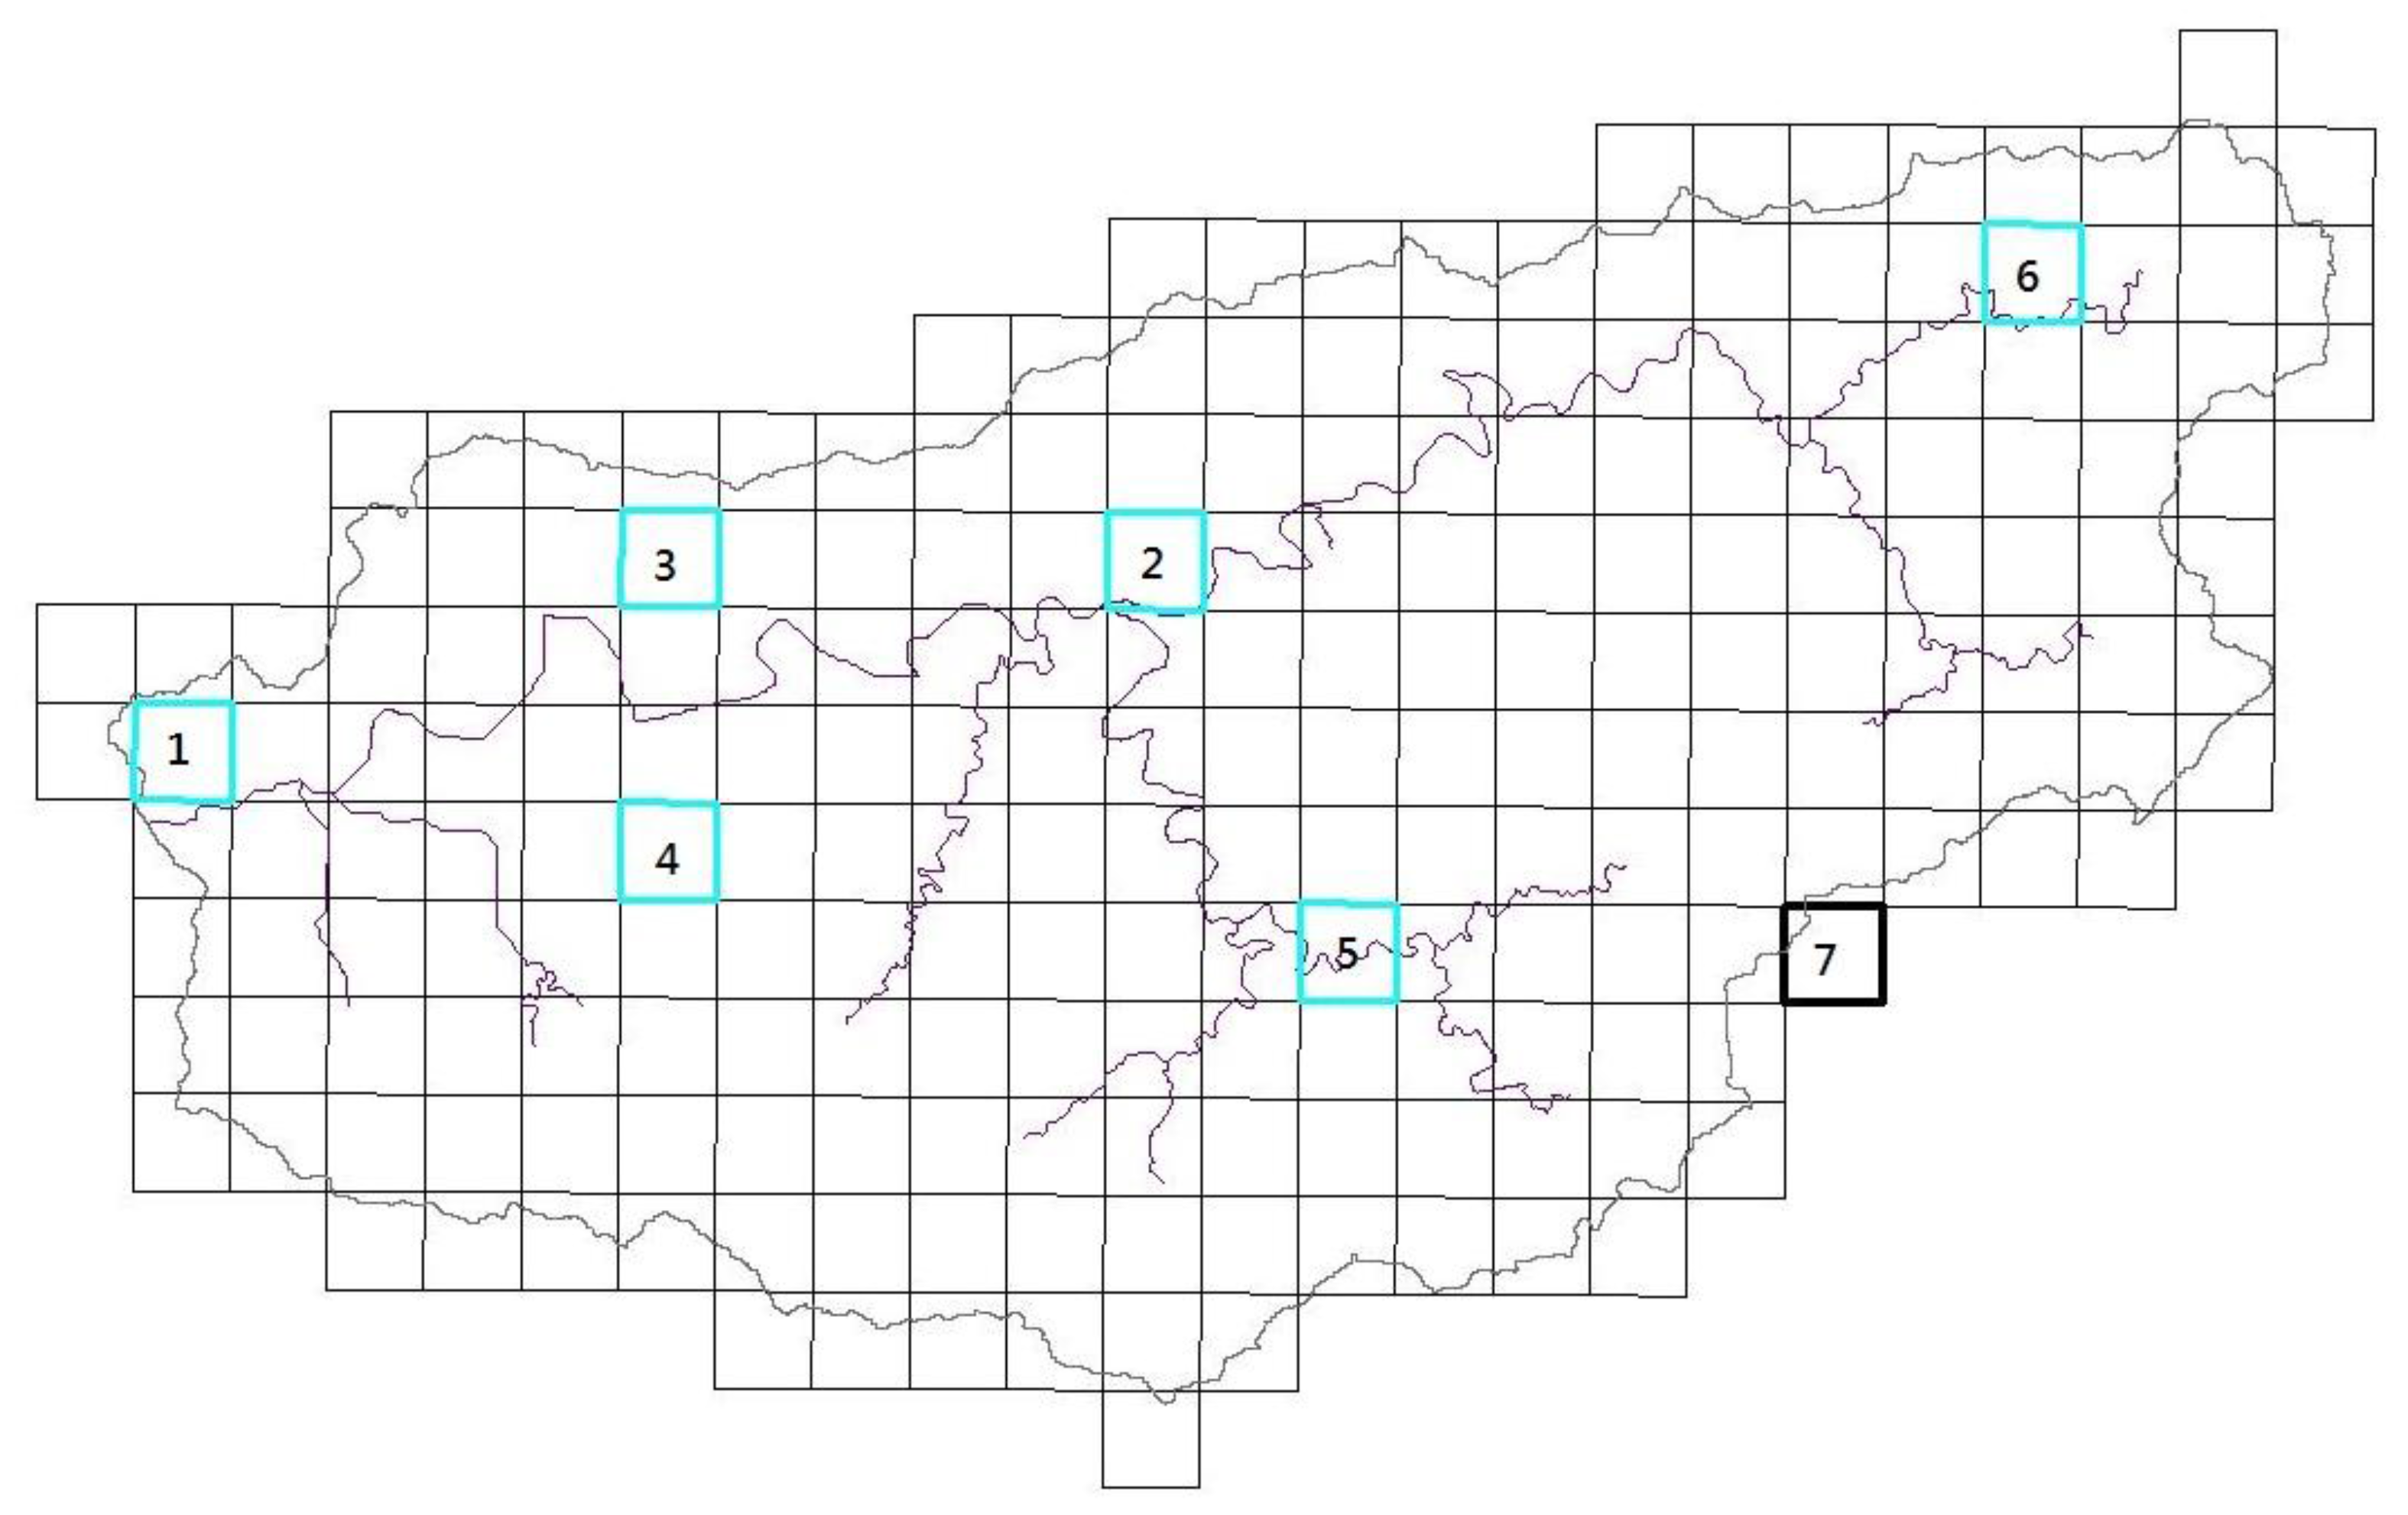
The grids labeled 1–6 in Figure 7 correspond to the locations of the six currently existing rain gauge stations in the catchment. The entropy value of these six stations is already ~94%, which indicates that these stations are sufficient for normal operation of the water reservoir. Nonetheless, if an improvement in the completeness of the data is desired, the addition of a station at Grid 7 will increase km from 0.938 to 0.958, which is larger than the = 0.95 threshold. Therefore, we propose that one more rain gauge station should be added to the study area, in addition to the pre-existing rain gauge stations. The location of this station is indicated by Grid 7 in Figure 7, and it is located at the boundary of the catchment in the southeastern part of the study area.
5. Conclusions
In this study, surface and radar rainfall data were employed in unison to estimate the rainfall data of the candidate rain gauge sites, and information entropy was used to evaluate the information content and uncertainty of each rain gauge station. An optimal rainfall network may then be constructed by combining these methods. Unlike previous estimations of rainfall based on the Kriging method, the rainfall data obtained using radar is an actual measurement, whereas rainfalls estimated using statistical methods are at best, estimated values, which may not accurately reflect on the temporal and spatial distributions of rainfall in a catchment. Previously, it was impossible to obtain an exact answer for the location of rain gauge stations and the minimum required number of stations; with information entropy, it is now possible to simultaneously obtain an answer for both of these questions. This method will provide an important basis for the management of watersheds and the establishment of rain gauge stations. Furthermore, this method may also be used to assess the sufficiency of the rainfall data provided by currently existing rain gauge stations. More stations need to be added to a rainfall network if the data is insufficient, whereas stations need to be removed if the redundancy in data is too high. It is hoped that this method will be used to evaluate or adjust currently existing rainfall networks in the catchment.
To identify and test the robustness of this method of rainfall network design in catchments, the rainfall network at the Feitsui Reservoir’s catchment was evaluated to highlight the applicability and reliability of our method. A grid was defined every 1.3 km in the study area, and actual radar data was used to reconstruct the historical rainfall data of these grids. Information entropy was then used to evaluate the spatial information content and the uncertainty of the information, and the estimated entropy values were used to add stations to the network one after another. It was shown that seven stations is the optimal number of rain gauge stations for the selected study area, as this is the number of stations required to obtain 95% of the study area’s rainfall information, additional manpower and resources for initial establishing and maintaining more stations can be saved.
Acknowledgments
This paper is based on work partially supported by Ministry of Science and Technology, Taiwan (Grant No. MOST 106-2221-E-027-031-). The authors would like to thank the Taipei Feitsui Reservoir Administration for providing the fundamental, rainfall data and related assistance.
Author Contributions
Hui-Chung Yeh and Yen-Chang Chen conceived and designed the experiments; Che-Hao Chang analyzed the radar data; Cheng-Hsuan Ho performed the materials/analysis tools; Chiang Wei performed the analysis and wrote the manuscript. All authors have read and approved the final manuscript.
Conflicts of Interest
The authors declare no conflict of interest.
References
- Patra, K.C. Hydrology and Water Resources Engineering; Alpha Science: Oxford, UK, 2010. [Google Scholar]
- Strangeways, I. Precipitation: Theory, Measurement and Distribution; Cambridge University Press: Cambridge, UK, 2007. [Google Scholar]
- WMO. Guide to Hydrological Practices, WMO-164; WMO: Geneva, Switzerland, 1994. [Google Scholar]
- Langbein, W.B. Hydrologic data networks and methods of extrapolating or extending available hydrologic data. In Hydrologic Networks and Method; United Nations: Bangkok, Thailand, 1960. [Google Scholar]
- Rodriguez-Iturbe, I.; Mejia, J.M. The design of rainfall networks in time and space. Water Resour. Res. 1974, 23, 181–190. [Google Scholar] [CrossRef]
- Shih, S.F. Rainfall variation analysis and optimization of gaging systems. Water Resour. Res. 1982, 18, 1269–1277. [Google Scholar] [CrossRef]
- Basalirwa, C.P.K.; Ogallo, L.J.; Mutua, F.M. The design of regional minimum rain gauge network. Int. J. Water Resour. Dev. 2007, 9, 411–424. [Google Scholar] [CrossRef]
- Kassim, A.H.M.; Kottegoda, N.T. Rainfall network design through comparative kriging methods. Hydrol. Sci. J. 1991, 36, 223–240. [Google Scholar] [CrossRef]
- Chen, Y.C.; Wei, C.; Yeh, H.C. Rainfall network design using kriging and entropy. Hydrol. Process. 2008, 22, 340–346. [Google Scholar] [CrossRef]
- Chebbi, A.; Bargaoui, Z.K.; Cunha, M.D.C. Optimal extension of rain gauge monitoring network for rainfall intensity and erosivity index interpolation. J. Hydrol. Eng. ASCE 2011, 16, 665–676. [Google Scholar] [CrossRef]
- Ridolfi, E.; Montesarchio, V.; Russo, F.; Napolitano, F. An entropy approach for evaluating the maximum information content achievable by an urban rainfall network. Nat. Hazards Earth Syst. Sci. 2011, 11, 2075–2083. [Google Scholar] [CrossRef]
- Shaghaghian, M.R.; Abedini, M.J. Rain gauge network design using coupled geostatistical and multivariate techniques. Sci. Iran. 2013, 20, 259–269. [Google Scholar] [CrossRef]
- Chebbi, A.; Bargaoui, Z.K.; Cunha, M.D.C. Development of a method of robust rain gauge network optimization based on intensity-duration-frequency results. Hydrol. Earth Syst. Sci. 2013, 17, 4259–4268. [Google Scholar] [CrossRef] [Green Version]
- Krstanovic, P.F.; Singh, V.P. Evaluation of rainfall networks using entropy: I. Theoretical development. Water Resour. Manag. 1992, 6, 279–293. [Google Scholar] [CrossRef]
- Yoo, C.; Jung, K.; Lee, J. Evaluation of Rain Gauge Network Using Entropy Theory: Comparison of Mixed and Continuous Distribution Function Applications. J. Hydrol. Eng. 2008, 13, 226–235. [Google Scholar] [CrossRef]
- Leach, J.M.; Kornelsen, K.C.; Samuel, J.; Coulibaly, P. Hydrometric network design using streamflow signatures and indicators of hydrologic alteration. J. Hydrol. 2015, 529, 1350–1359. [Google Scholar] [CrossRef]
- Chacon-Hurtado, J.C.; Alfonso, L.; Solomatine, D.P. Rainfall and streamflow sensor network design: A review of applications, classification, and a proposed framework. Hydrol. Earth Syst. Sci. Discuss. 2017, 21, 3071–3091. [Google Scholar] [CrossRef]
- Stosic, T.; Stosic, B.; Singh, V.P. Optimizing streamflow monitoring networks using joint permutation entropy. J. Hydrol. 2017, 552, 306–312. [Google Scholar] [CrossRef]
- Wei, C.; Yeh, H.C.; Chen, Y.C. Spatiotemporal scaling effect on rainfall network design using entropy. Entropy 2014, 16, 4626–4647. [Google Scholar] [CrossRef]
- Harmancioglu, N.; Yevjevich, V. Transfer of hydrologic information among river points. J. Hydrol. 1987, 91, 103–118. [Google Scholar] [CrossRef]
- Alfonso, L.; Lobbrecht, A.; Price, R. Information theory-based approach for location of monitoring water level gauges in polders. Water Resour. Res. 2010, 46. [Google Scholar] [CrossRef]
- Alfonso, L.; Lobbrecht, A.; Price, R. Optimization of water level monitoring network in polder systems using information theory. Water Resour. Res. 2010, 46, W12553. [Google Scholar] [CrossRef]
- Ridolfi, E.; Alfonso, L.; Baldassarre, G.D.; Dottori, F.; Russo, F.; Napolitano, F. An entropy approach for the optimization of cross-section spacing for river modelling. Hydrol. Sci. J. 2013, 59, 126–137. [Google Scholar] [CrossRef]
- Mogheir, Y.; Singh, V.P. Application of information theory to groundwater quality monitoring networks. Water Resour. Manag. 2002, 16, 37–49. [Google Scholar] [CrossRef]
- Mogheir, Y.; de Lima, J.L.M.P.; Singh, V.P. Assessment of spatial structure of groundwater quality variables based on the entropy theory. Hydrol. Earth Syst. Sci. 2003, 7, 707–721. [Google Scholar] [CrossRef]
- Alfonso, L.; Ridolfi, E.; Gaytan-Aguilar, S.; Napolitano, F.; Russo, F. Ensemble entropy for monitoring network design. Entropy 2014, 16, 1365–1375. [Google Scholar] [CrossRef]
- Ridolfi, E.; Yan, K.; Alfonso, L.; Baldassarre, G.D.; Napolitano, F.; Russo, F.; Bates, P.D. An entropy method for floodplain monitoring network design. AIP Conf. Proc. 2012, 1479, 1780–1783. [Google Scholar] [CrossRef]
- Ridolfi, F.; Rianna, E.; Trani, G.; Alfonso, L.; Baldassarre, G.D.; Napolitano, G.; Russo, F. A new methodology to define homogeneous regions through an entropy based clustering method. Adv. Water Resour. 2016, 96, 237–250. [Google Scholar] [CrossRef]
- Marshall, J.S.; Palmer, W.M. The distribution of raindrops with size. J. Meteorol. 1948, 5, 165–166. [Google Scholar] [CrossRef]
- Xin, L.; Reuter, G.; Larochelle, B. Reflectivity-rain rate relationships for convective rainshowers in Edmonton: Research note. Atmos. Ocean 1997, 35, 513–521. [Google Scholar] [CrossRef]
- Shannon, C.E. A mathematical theory of communication. Bell Syst. Tech. J. 1948, 27, 623–656. [Google Scholar] [CrossRef]
Figure 1.
Schematic diagram of radar echoes with elevation (Zhang, 2006). When the beam blockage of a pulse volume’s echo factor exceeds 60%, or if the central point of a pulse volume is less than 50 m above ground, its data is then replaced by the echo factor of the next (higher) elevation angle.
Figure 1.
Schematic diagram of radar echoes with elevation (Zhang, 2006). When the beam blockage of a pulse volume’s echo factor exceeds 60%, or if the central point of a pulse volume is less than 50 m above ground, its data is then replaced by the echo factor of the next (higher) elevation angle.

Figure 2.
The Feitsui Reservoir’s catchment and the locations of the rain gauge stations.

Figure 3.
The positions and numbering of the candidate rain gauges in the Feitsui Reservoir’s catchment.
Figure 3.
The positions and numbering of the candidate rain gauges in the Feitsui Reservoir’s catchment.

Figure 4.
The monthly rainfall in the Feitsui Reservoir’s catchment from 2006 to 2015.

Figure 5.
The relationship between the measured mean monthly rainfall and the estimated mean monthly rainfall.
Figure 5.
The relationship between the measured mean monthly rainfall and the estimated mean monthly rainfall.

Figure 6.
The relationship between joint entropy value and the optimal number of stations; all of the grids and the first 12 grids within the graph.
Figure 6.
The relationship between joint entropy value and the optimal number of stations; all of the grids and the first 12 grids within the graph.

Figure 7.
The position of the recommended rain gauge station (the bold grid) for addition to the rainfall network; Blue grids 1 to 6 are the existed rainfall stations.
Figure 7.
The position of the recommended rain gauge station (the bold grid) for addition to the rainfall network; Blue grids 1 to 6 are the existed rainfall stations.


Table 1.
The maximum, minimum and standard deviation of the monthly rainfall of six rain gauges in Feitsui Reservoir’s catchment.
Table 1.
The maximum, minimum and standard deviation of the monthly rainfall of six rain gauges in Feitsui Reservoir’s catchment.
| Station | Taiping | Sirsangoo | Pingling | Feitsui | Geochungan | Beefu |
|---|---|---|---|---|---|---|
| Grid number | 19 | 61 | 66 | 102 | 129 | 157 |
| Maximum (mm/M) | 2668.5 | 1723.0 | 2113.5 | 1902.0 | 1925.5 | 2330.0 |
| Minimum (mm/M) | 0.5 | 0.0 | 12.0 | 43.0 | 26.5 | 0.0 |
| Mean (mm/M) | 449.3 | 282.3 | 294.7 | 299.0 | 302.5 | 333.2 |
| Std. Dev. (mm/M) | 358.1 | 218.4 | 263.0 | 234.1 | 234.4 | 234.4 |
© 2017 by the authors. Licensee MDPI, Basel, Switzerland. This article is an open access article distributed under the terms and conditions of the Creative Commons Attribution (CC BY) license (http://creativecommons.org/licenses/by/4.0/).
Share and Cite
MDPI and ACS Style
Yeh, H.-C.; Chen, Y.-C.; Chang, C.-H.; Ho, C.-H.; Wei, C. Rainfall Network Optimization Using Radar and Entropy. Entropy 2017, 19, 553. https://doi.org/10.3390/e19100553
AMA Style
Yeh H-C, Chen Y-C, Chang C-H, Ho C-H, Wei C. Rainfall Network Optimization Using Radar and Entropy. Entropy. 2017; 19(10):553. https://doi.org/10.3390/e19100553
Chicago/Turabian StyleYeh, Hui-Chung, Yen-Chang Chen, Che-Hao Chang, Cheng-Hsuan Ho, and Chiang Wei. 2017. "Rainfall Network Optimization Using Radar and Entropy" Entropy 19, no. 10: 553. https://doi.org/10.3390/e19100553
Note that from the first issue of 2016, this journal uses article numbers instead of page numbers. See further details here.