2.1. Traces and Modes of Droplet Movement
Traces of single droplet movement in time revealed characteristic patterns depending mainly on their size (volume) and time.
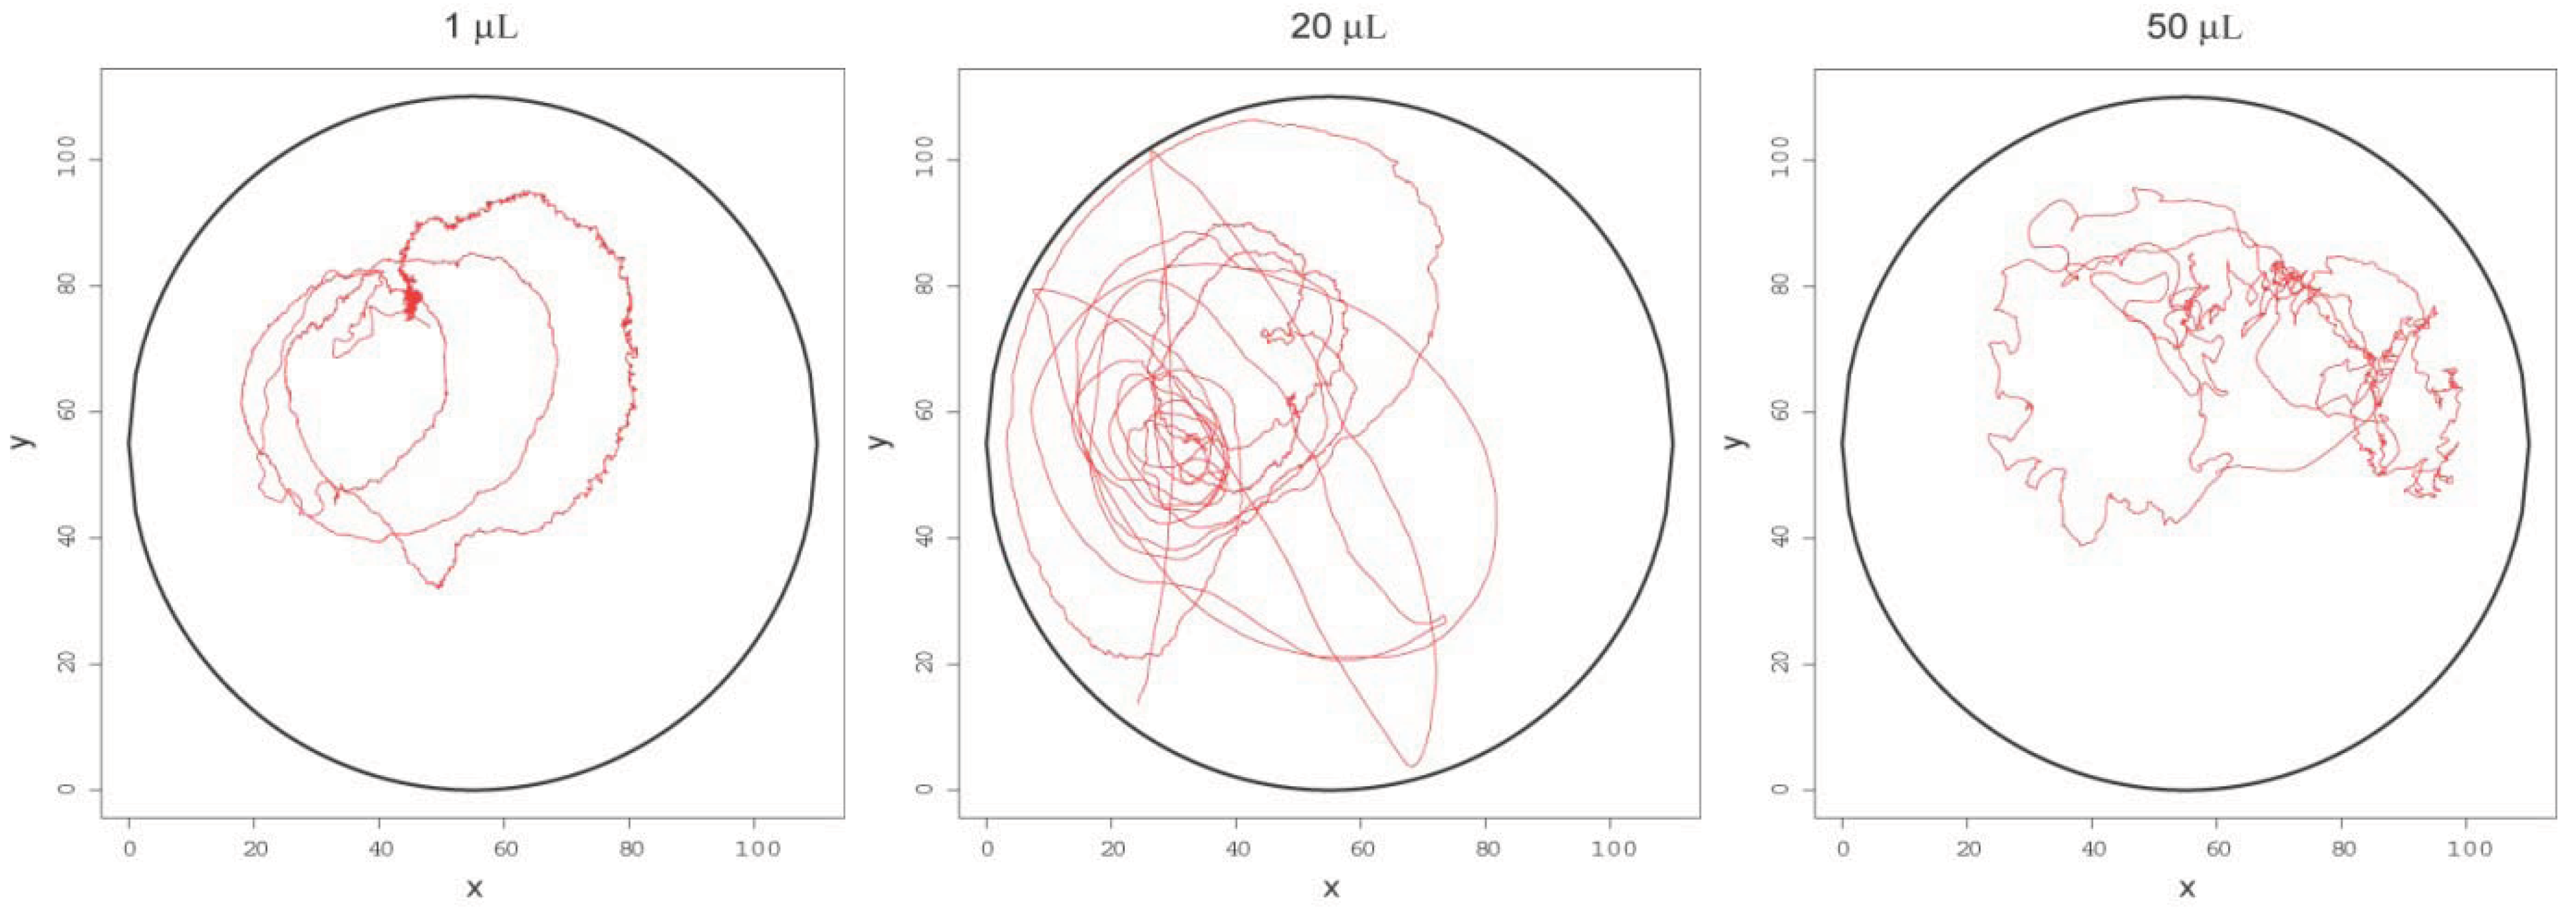
Figure 1 shows the traces of droplets of different sizes. For example, 1 µL droplets showed circular and fluctuating behavior; 20 µL droplets showed directional, circular and fluctuating behavior; 50 µL droplets showed vibrational, circular and fluctuating behavior.
Figure 1.
Paths of droplets. The red lines indicate the paths of single droplets of varying volume (1 µL, 20 µL and 50 µL) traced over the entire lifetime of an experiment.
Figure 1.
Paths of droplets. The red lines indicate the paths of single droplets of varying volume (1 µL, 20 µL and 50 µL) traced over the entire lifetime of an experiment.
As shown in
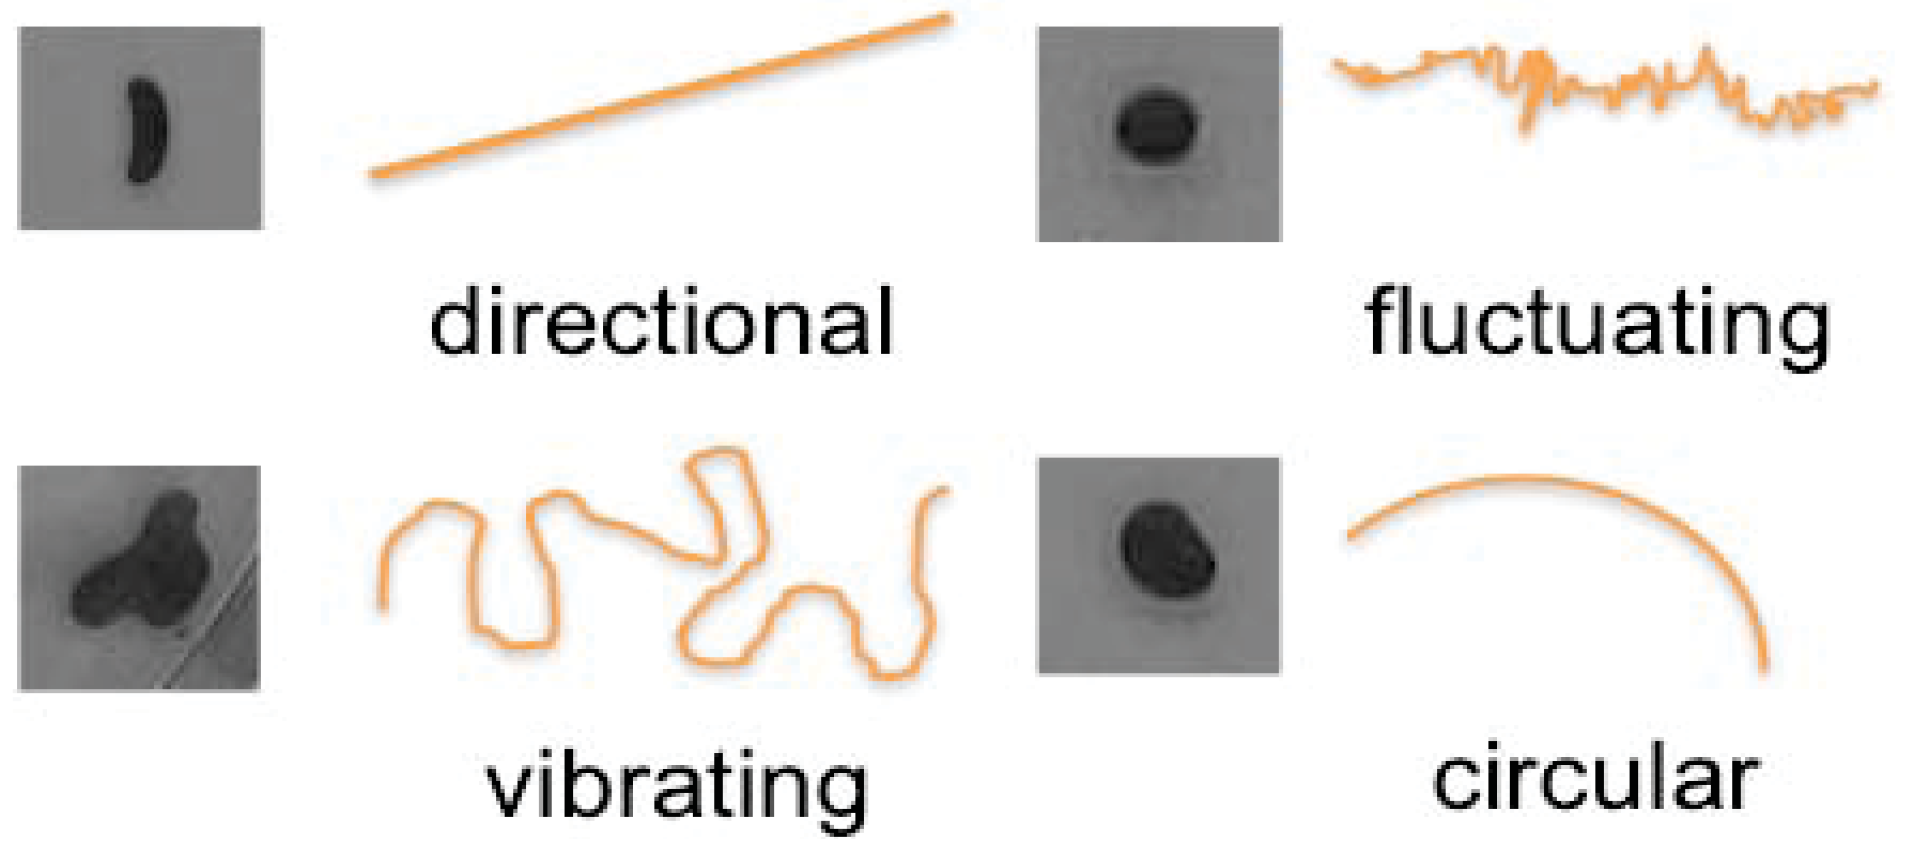
Figure 2, droplets showed complex paths consisting of at least four behavioral modes, namely directional, vibrational, fluctuating and circular modes. Because the reaction occurs at the surface of the droplet, the rate of reaction is largely determined by the size of droplet, with stronger reaction in larger droplets. In addition, the typically spherical droplet shape can often be distorted by flow structures occurring inside the oil droplet. The droplet shape and convection flow of the largest droplets tested (50 µL volume) became unstable and the droplets showed vibrational mode. Over time both the oil volume decreased and the reaction became weaker, and concurrently the droplets made a transition from one mode to another (e.g., vibrating mode to circular mode). In the directional mode, both droplet shape and convection flow were stable and the rate of chemical reaction was strong. When the reaction became much weaker, convection flow became unstable and this instability correlated with fluctuating behavior. More detailed analyses of mode identification and mode switching are presented below in
Section 2.4.
Figure 2.
Four major behavioral modes identified and corresponding droplet shape.
Figure 2.
Four major behavioral modes identified and corresponding droplet shape.
2.2. Spontaneous Change in Direction and Velocity
Once a droplet started moving, it often stopped and then started to move again. We characterized this apparently spontaneous change in direction and velocity of moving droplets by quantifying the both the turning angle and velocity of the droplet (
Figure 3). The data showed a decrease in velocity and increase in turning angle over time as the droplet aged. As also shown in
Figure 3, turning angle was negatively correlated with velocity. This suggested that the droplets often changed their direction while stopped. This applied to all droplet sizes tested. Droplets showed fluctuating mode in the stop duration, and we found from numerical simulation that this mode has an unstable axis of convection flow resulting in spontaneous changes in the direction of movement [
7]. This was also corroborated with microscopic observation of flow structures in the oil droplets (data not shown).
Previously we reported on how droplets react to chemical gradients [
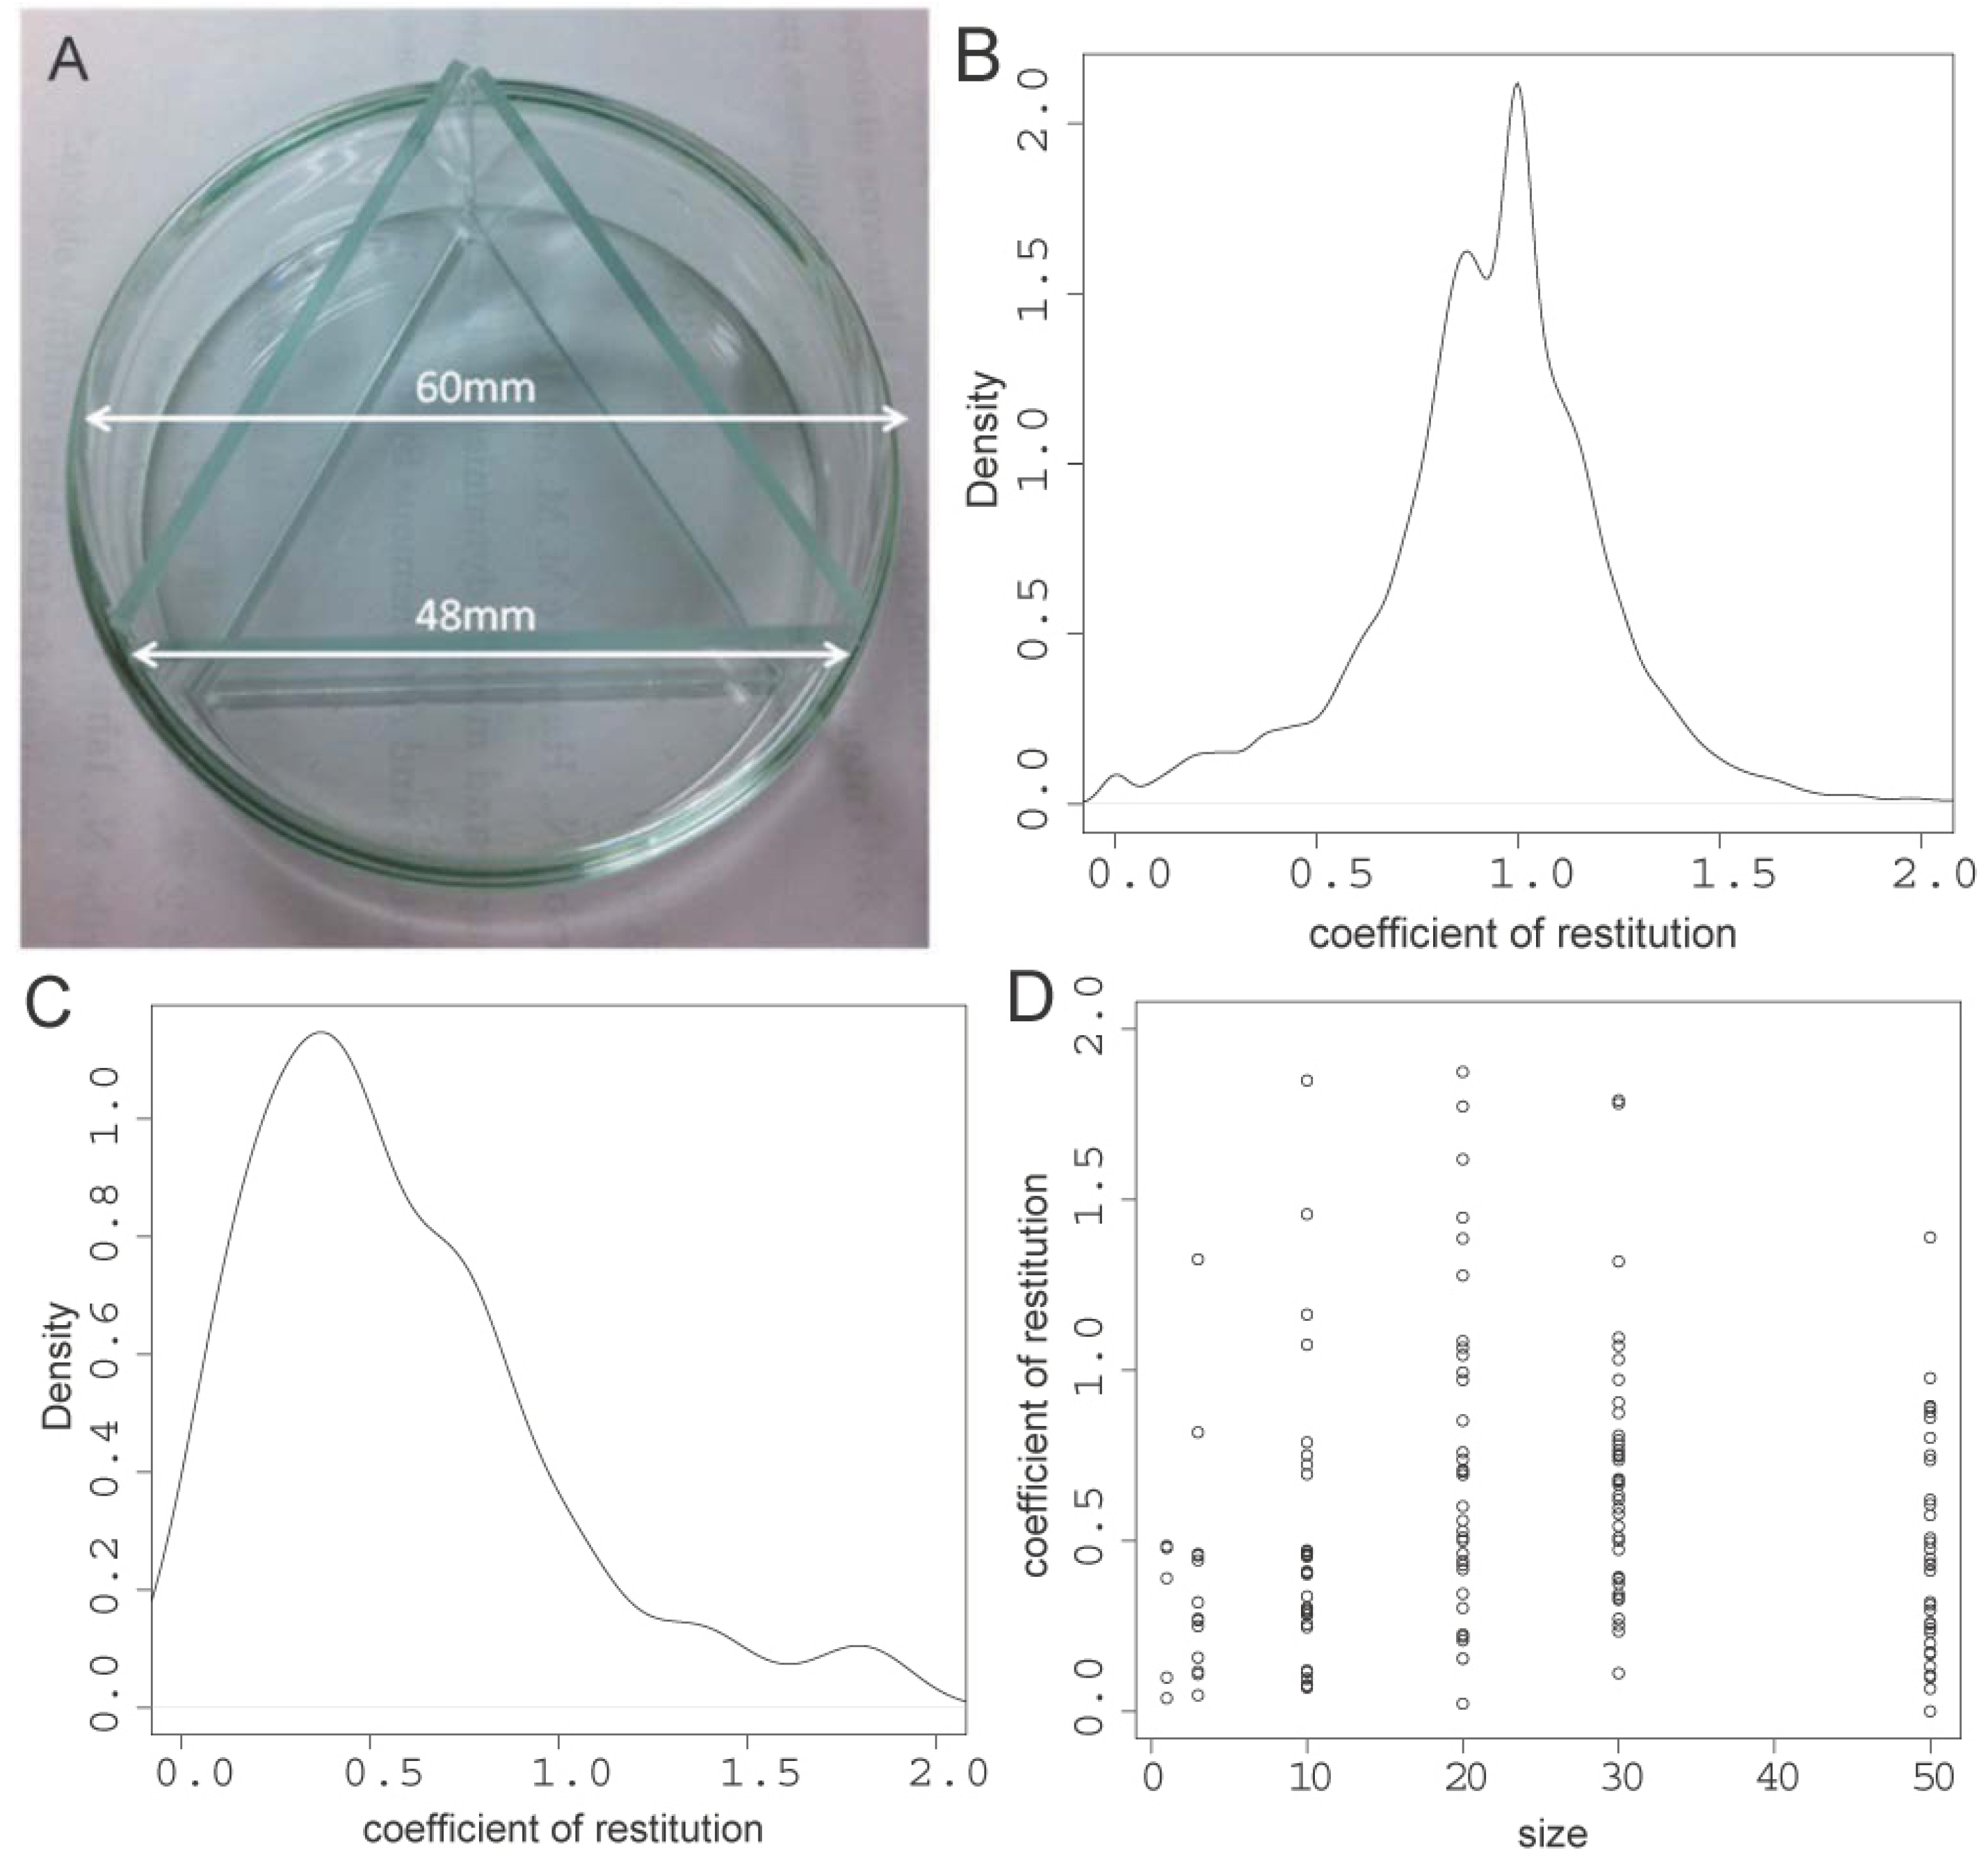
8]. Here we tested how droplets react to a collision with an immovable physical object. We calculated the coefficient of restitution (COR) of droplets placed into the dish with a glass triangle providing a flat surface for the droplets to collide with, as shown in
Figure 4A. We defined COR as ||v(t + 1)|| /||vt||.The COR indicates elasticity by comparing the velocities of objects before and after an event, such as a collision. For comparison, we calculated the density distribution of the COR for droplets not undergoing collisions (
Figure 4B). This data showed spontaneous production or consumption of kinetic energy with mean values around 1. The chemical reaction on the surface could be converted to kinetic energy possibly through shape change and/or fluid dynamics where COR values were >1. A COR larger than 1 indicates that the chemical reaction was re-activated or enhanced. However when droplets underwent collisions, then distribution changed as shown in
Figure 4C, with generally lower COR and even a few values indicating a perfectly inelastic system. In this case, kinetic energy could be consumed to distort the droplet shape during the collision.
Figure 3.
Correlation between velocity and turning angle showing a strong negative correlation. Data are shown for 20 µL droplets only.
Figure 3.
Correlation between velocity and turning angle showing a strong negative correlation. Data are shown for 20 µL droplets only.
Figure 4.
Coefficient of restitution measurements. (A). The droplets were tested in a glass dish of 60 mm diameter with glass separators of 48 mm length to serve as flat walls; (B). The coefficients for all droplets tested where there was no collision but spontaneous change in velocity; (C). The coefficients for all droplets tested where there was a collision with a wall; (D). The coefficients according to droplet size (in µL).
2.4. Behavioral Modes and Their Transitions in Relation to Size
We used a self-organizing map (SOM) and identified behavioral modes using a U-matrix [
11]. The standard algorithm for the SOM is as follows. We defined the data set S = {X
1, X
2, X
3, …, X
N} where Xk is a n-dimensional vector (x
1, x
2, x
3, … , x
n) and nodes on a SOM, which are connected with the neighboring nodes, W
i,j where i, j indicate the position of the node on the SOM having a weight vector with the same dimension as the data vector (w
1, w
2, w
3, … , w
n). One data vector from the data set was randomly chosen and the node that satisfied
was determined. Then the weight for the node W
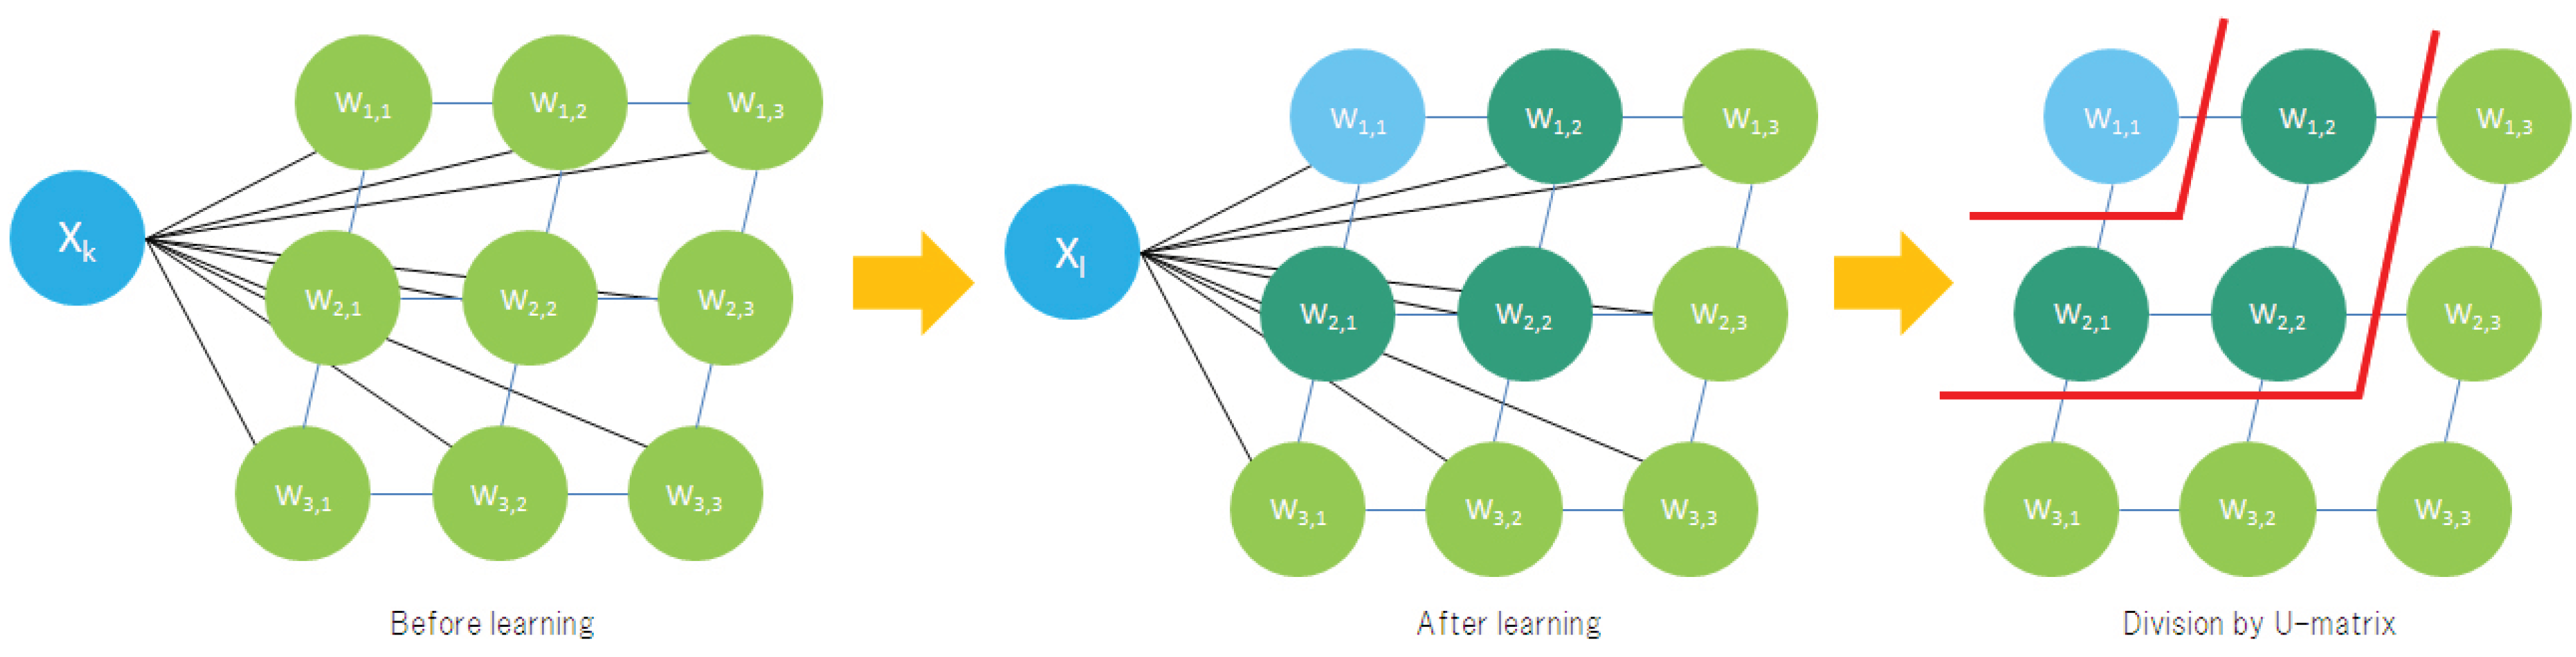
i,j and the neighboring nodes were updated with a certain learning rate ϵ (the node) and η (the neighboring node, ϵ > η). Iterating this process, we obtained a self-organized network where the neighboring nodes had similar weights (
Figure 5). Finishing the update of the weights on the nodes, we calculated the distance between nodes and then obtained a U-matrix containing information on the distance between nodes
. Finally, we divided SOM into several parts containing similar nodes using the U-matrix.
Figure 5.
The standard algorithm of SOM is illustrated. Each color represents different weights on each node. Weights are randomly attributed at first (left) and modified through unsupervised learning process. Finishing the learning (center) of SOM, nodes with similar weights make clusters and they can be divided into several parts by using the U-matrix (right).
The velocity and turning angle of the droplets were recorded every second, binned into 20-second intervals, and then normalized. The data was used for unsupervised learning of SOM. The SOM was then divided into several parts using the U-matrix and data mapped on it. We used a threshold for the U-matrix so that the SOM would identify only main clusters.
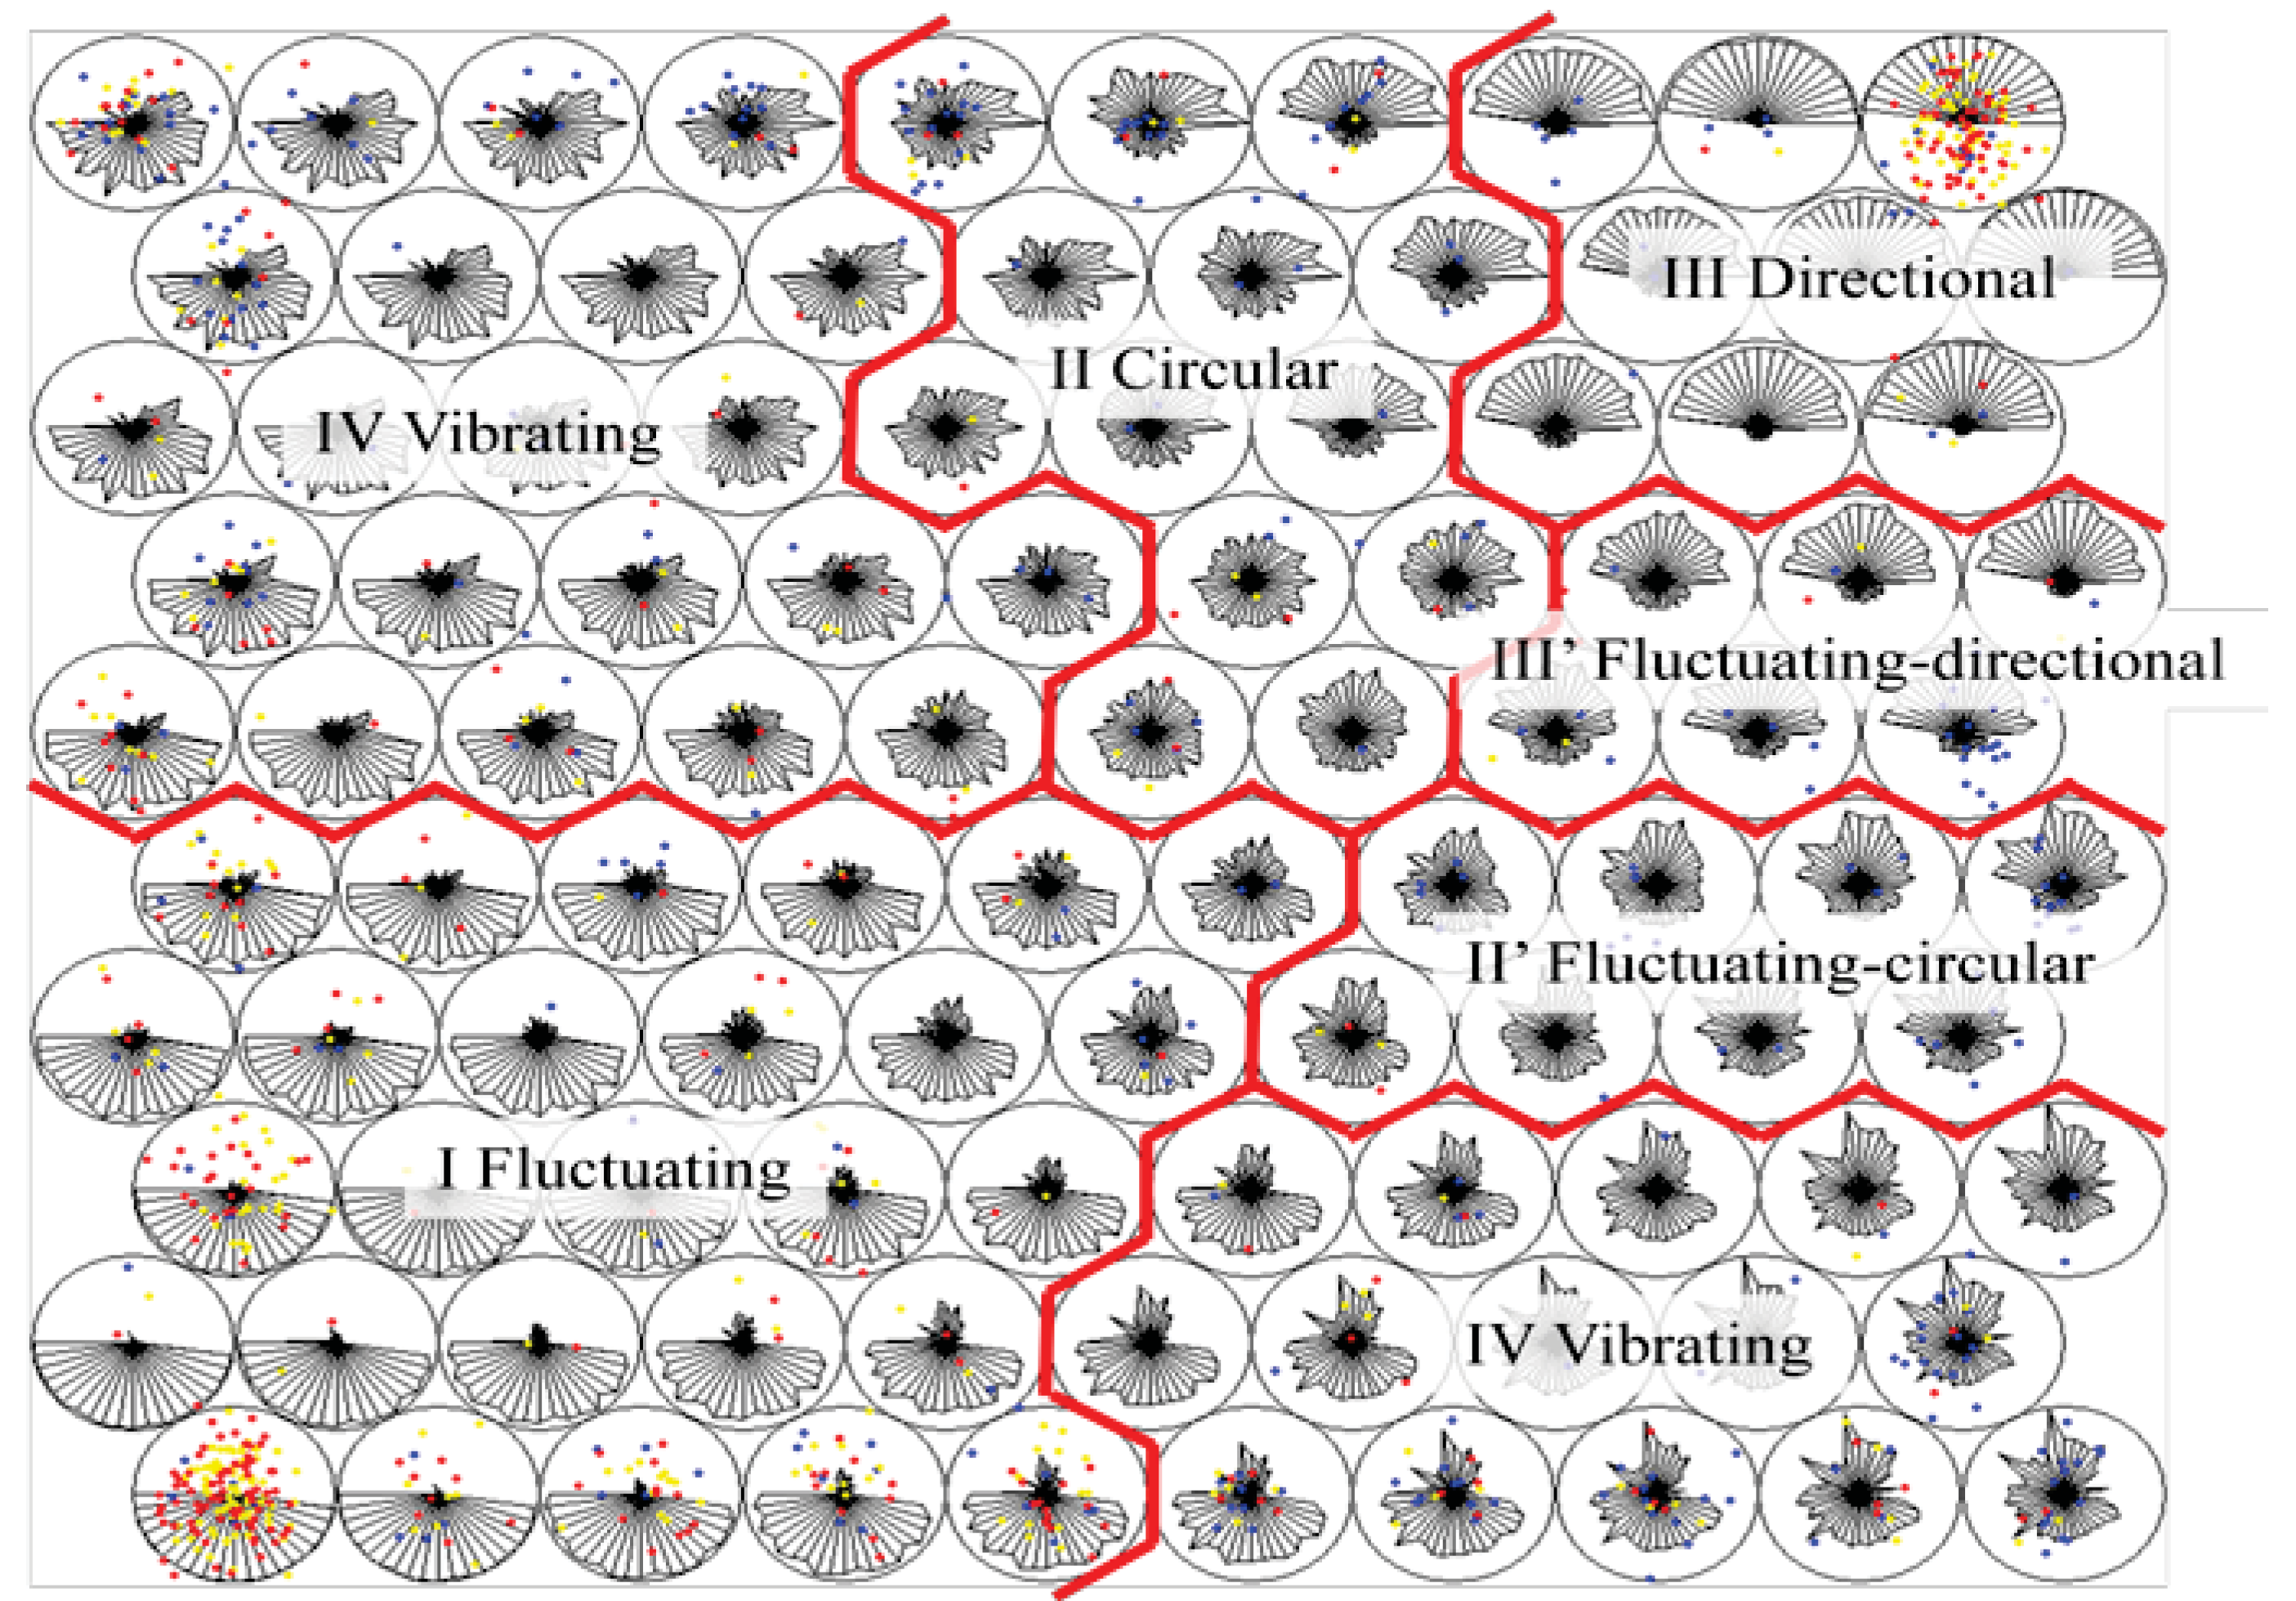
Four types of main modes were identified (
Figure 6). They were fluctuating, circular, directional and vibrating mode. Small velocity and large turning angle were observed in fluctuating mode. On the other hand, large velocity and small turning angle were observed in directional mode. Circular and vibrating mode showed intermediate velocity and turning angle but they were unstable in vibrating mode. In smaller droplets (1 µL volume), velocity was relatively unstable compared to larger droplets (50 µL). Such behaviors were identified as the other modes on the SOM. However, they were partly directional and circular mode, so we named those mixed modes as fluctuating directional mode (III’) and fluctuating circular mode (II’).
Figure 6.
Identification of the behavioral modes using SOM. Each polygon in the circle represents the weights for the node, where the upper half shows velocity and the lower half shows turning angle. Red lines define the borders of the each behavioral mode, which are determined from U-matrix, and four behavioral modes are identified: fluctuating mode (I), circular mode (II), directional mode (III) and vibrating mode (IV), along with two mixed modes: fluctuating directional mode (III’) and fluctuating circular mode (II’). The dots on the SOM represent motion of the droplet in 20 seconds intervals and the colors represent sizes of droplets: blue for 1 µL, yellow for 20 µL and red for 50 µL.
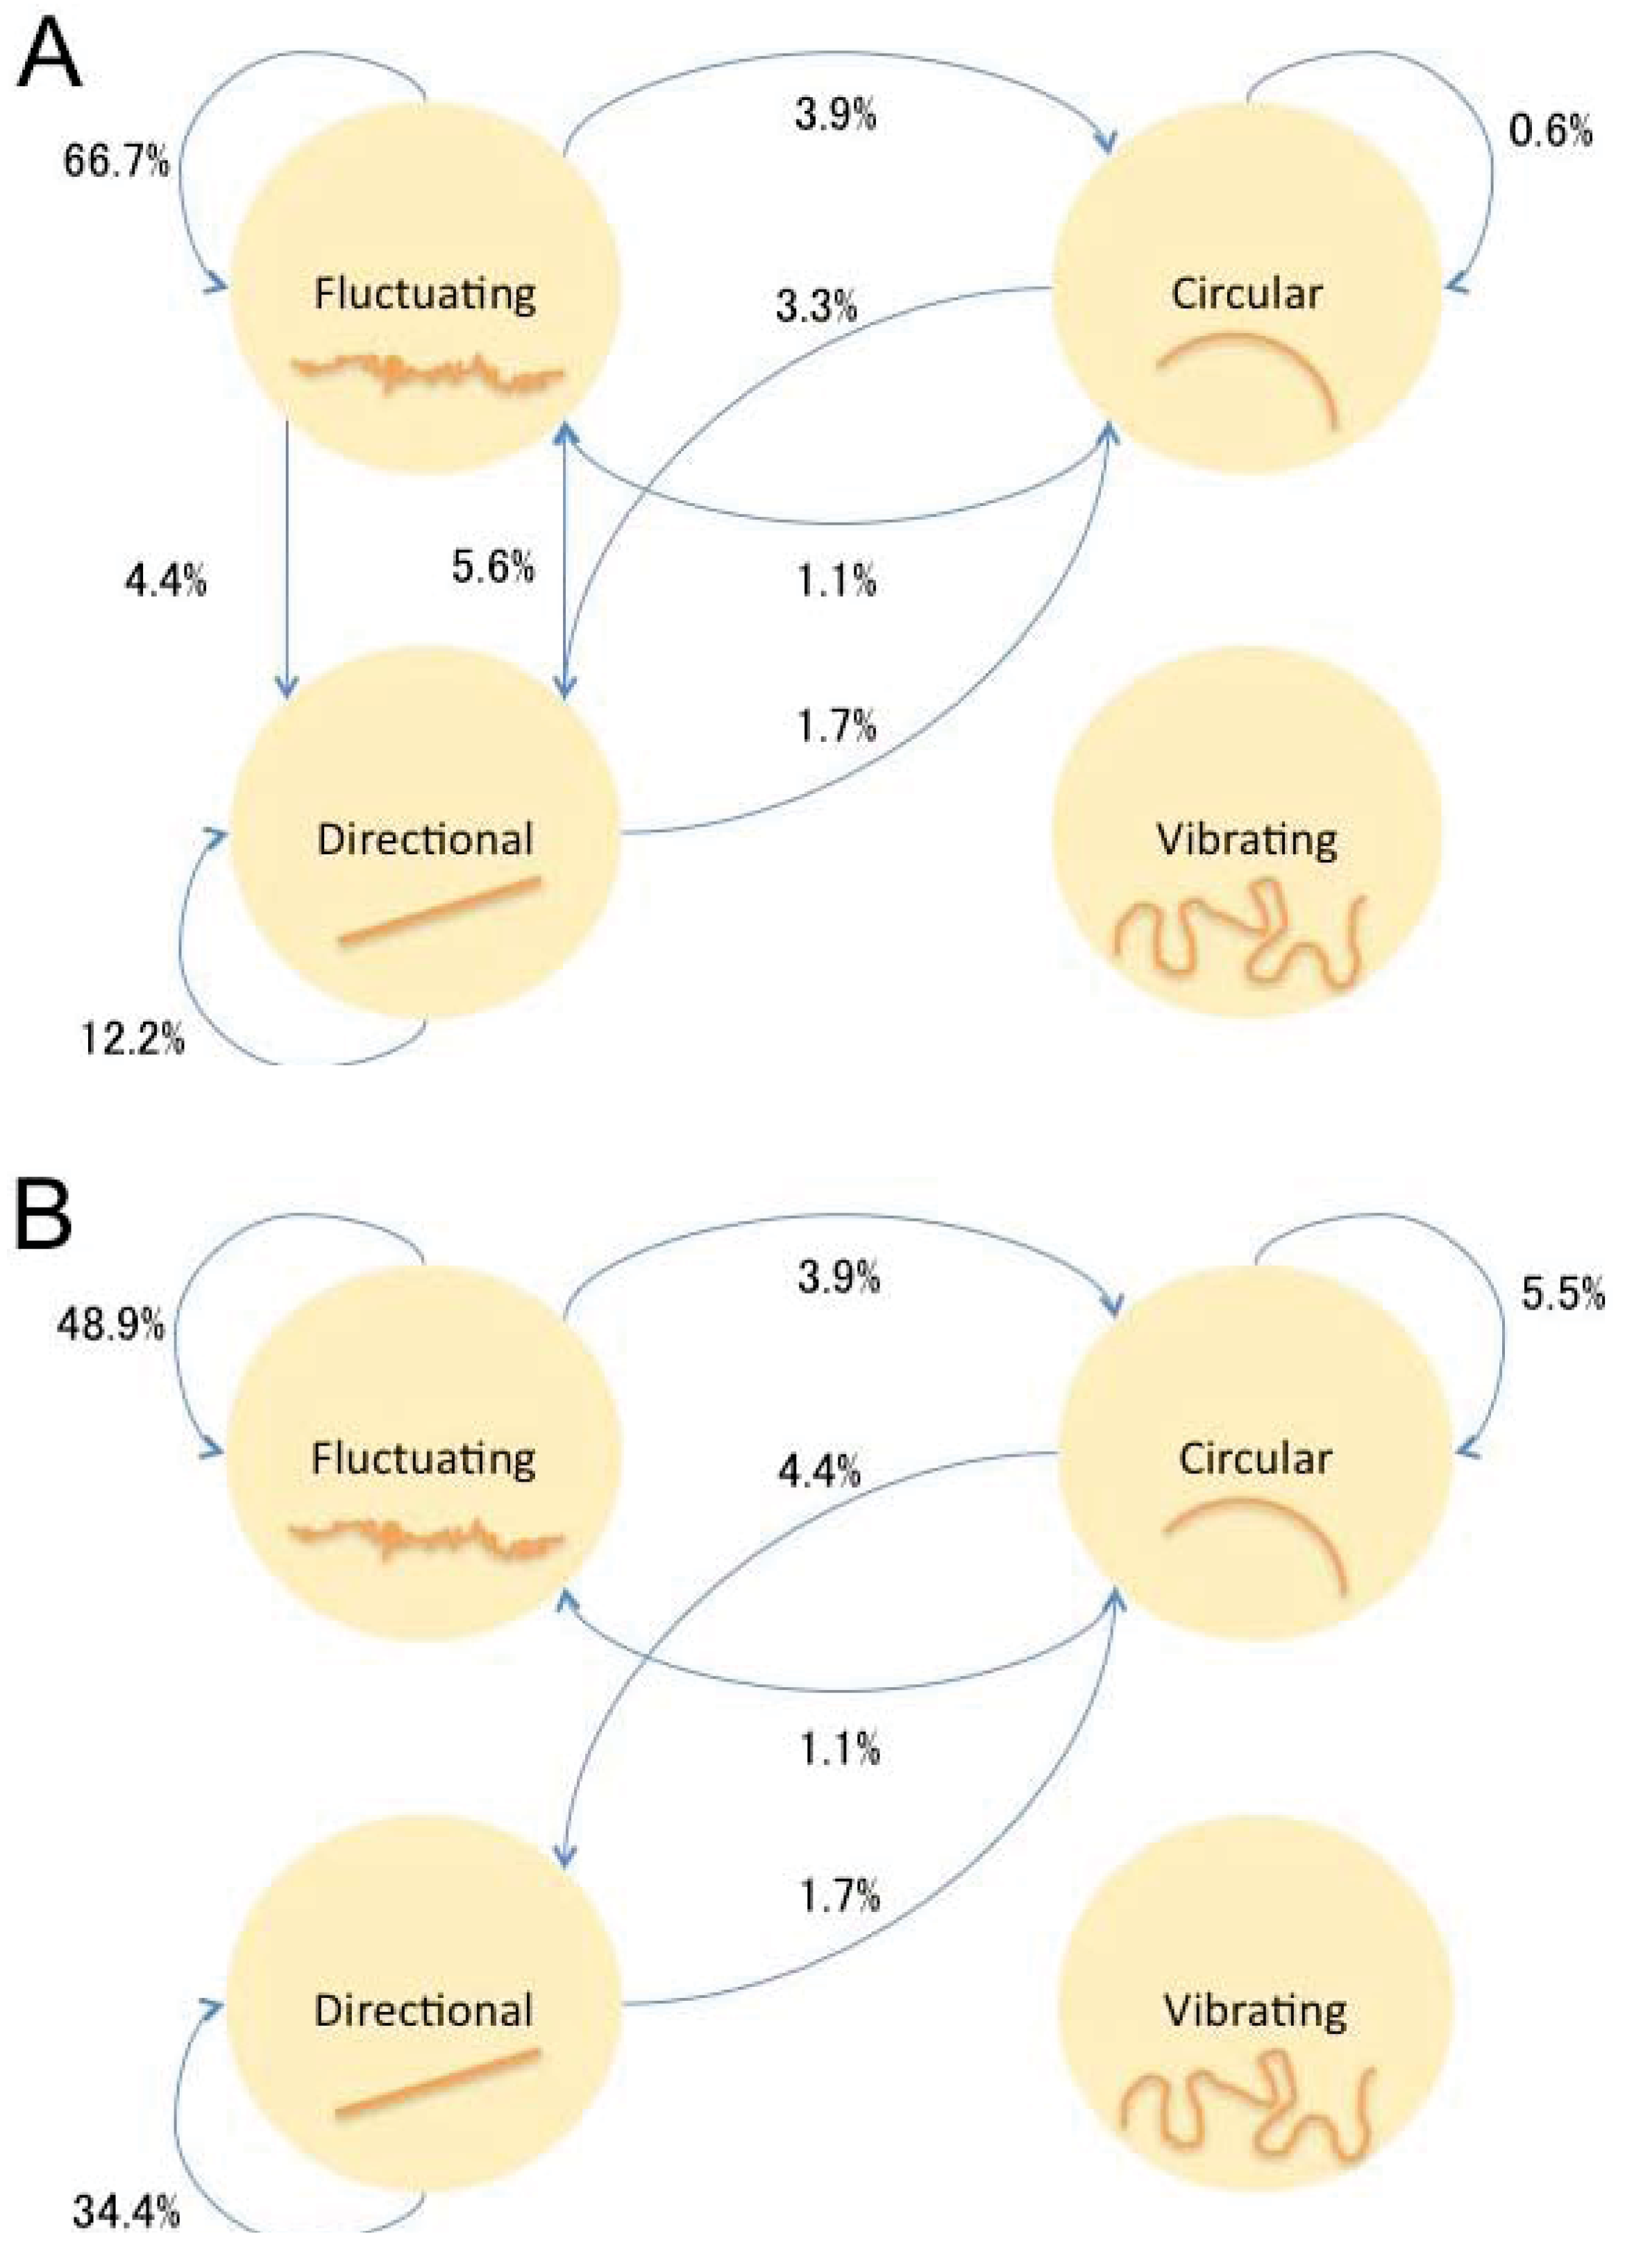
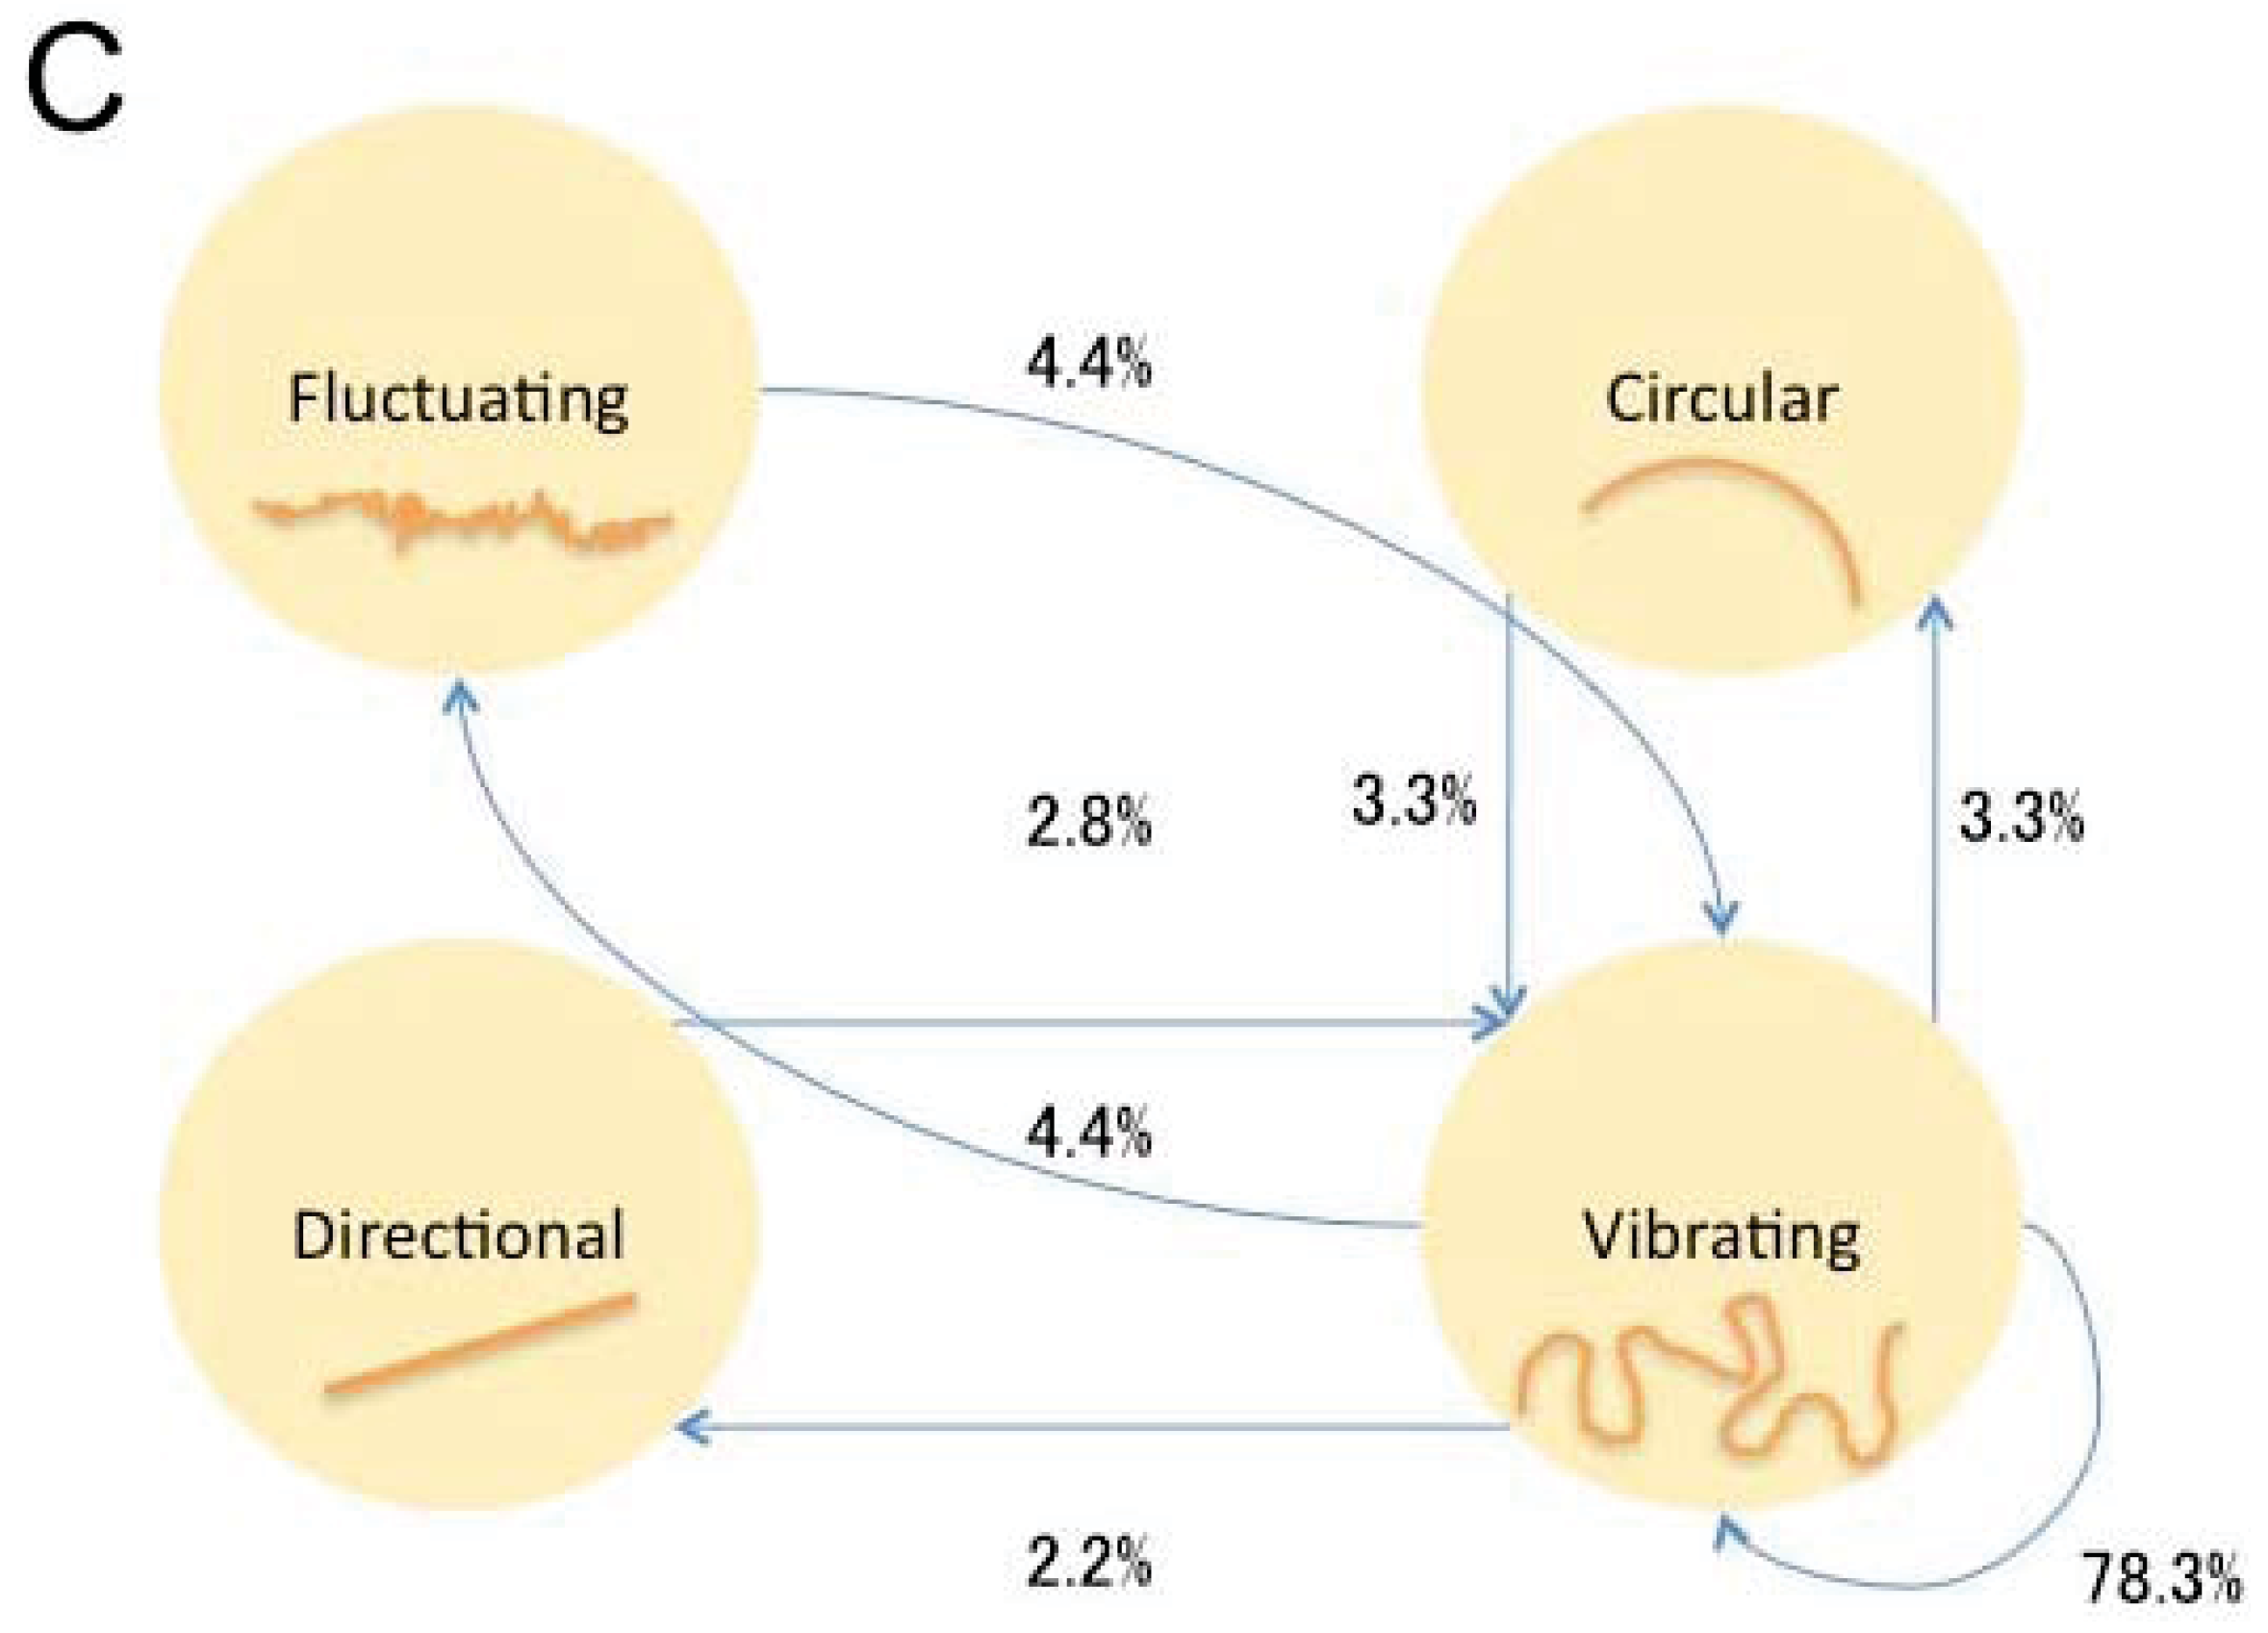
The mixture percentiles of behavioral modes were calculated from mapping on SOM and transition probability and transition pattern were calculated from SOM (
Figure 7). The components of the paths were different depending on the droplet size. Small droplets (<10 µL) mainly showed directional and fluctuating mode and the duration for staying in the directional mode became shorter as time passed. Middle-sized droplets (10–30 µL) showed directional mode in its former stage and switching between circular and fluctuating mode in its later stage. Both small (1 µL) and middle size (20 µL) droplets did not show vibrating mode. Large droplets (50 µL) had a tendency to stay in vibrating mode but occasionally switched to the other three modes.
2.5. Collective Behavior
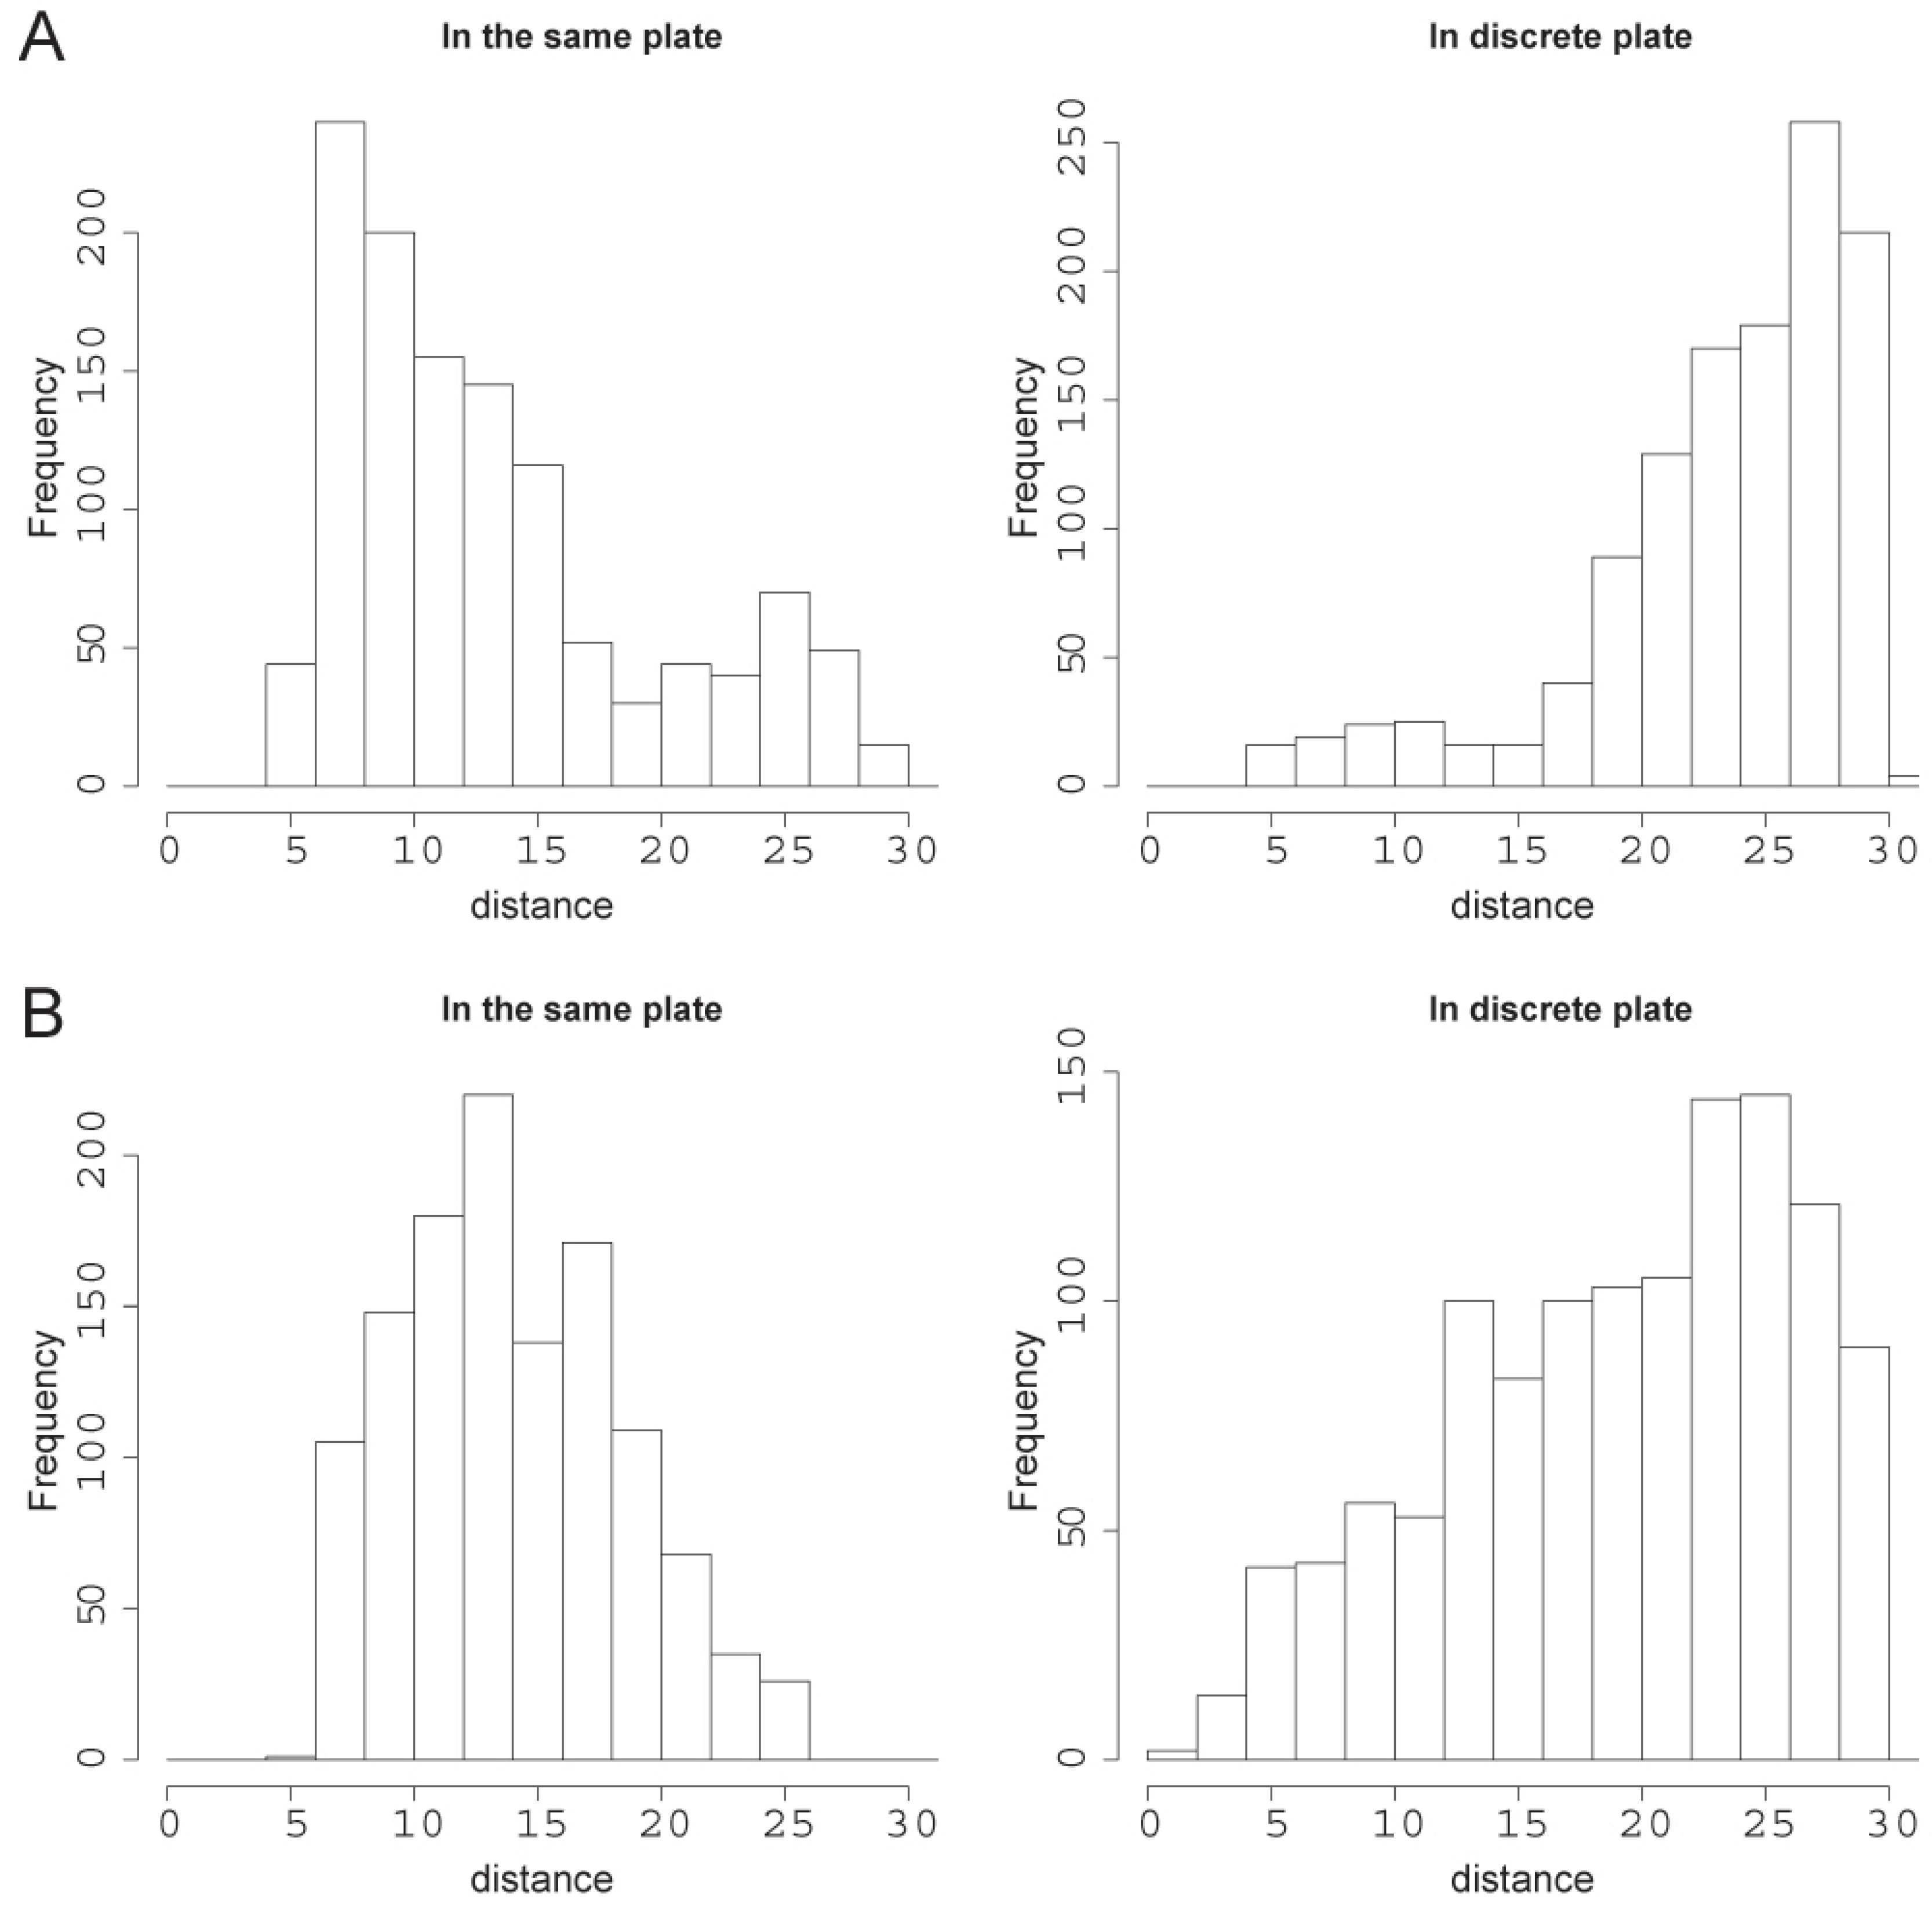
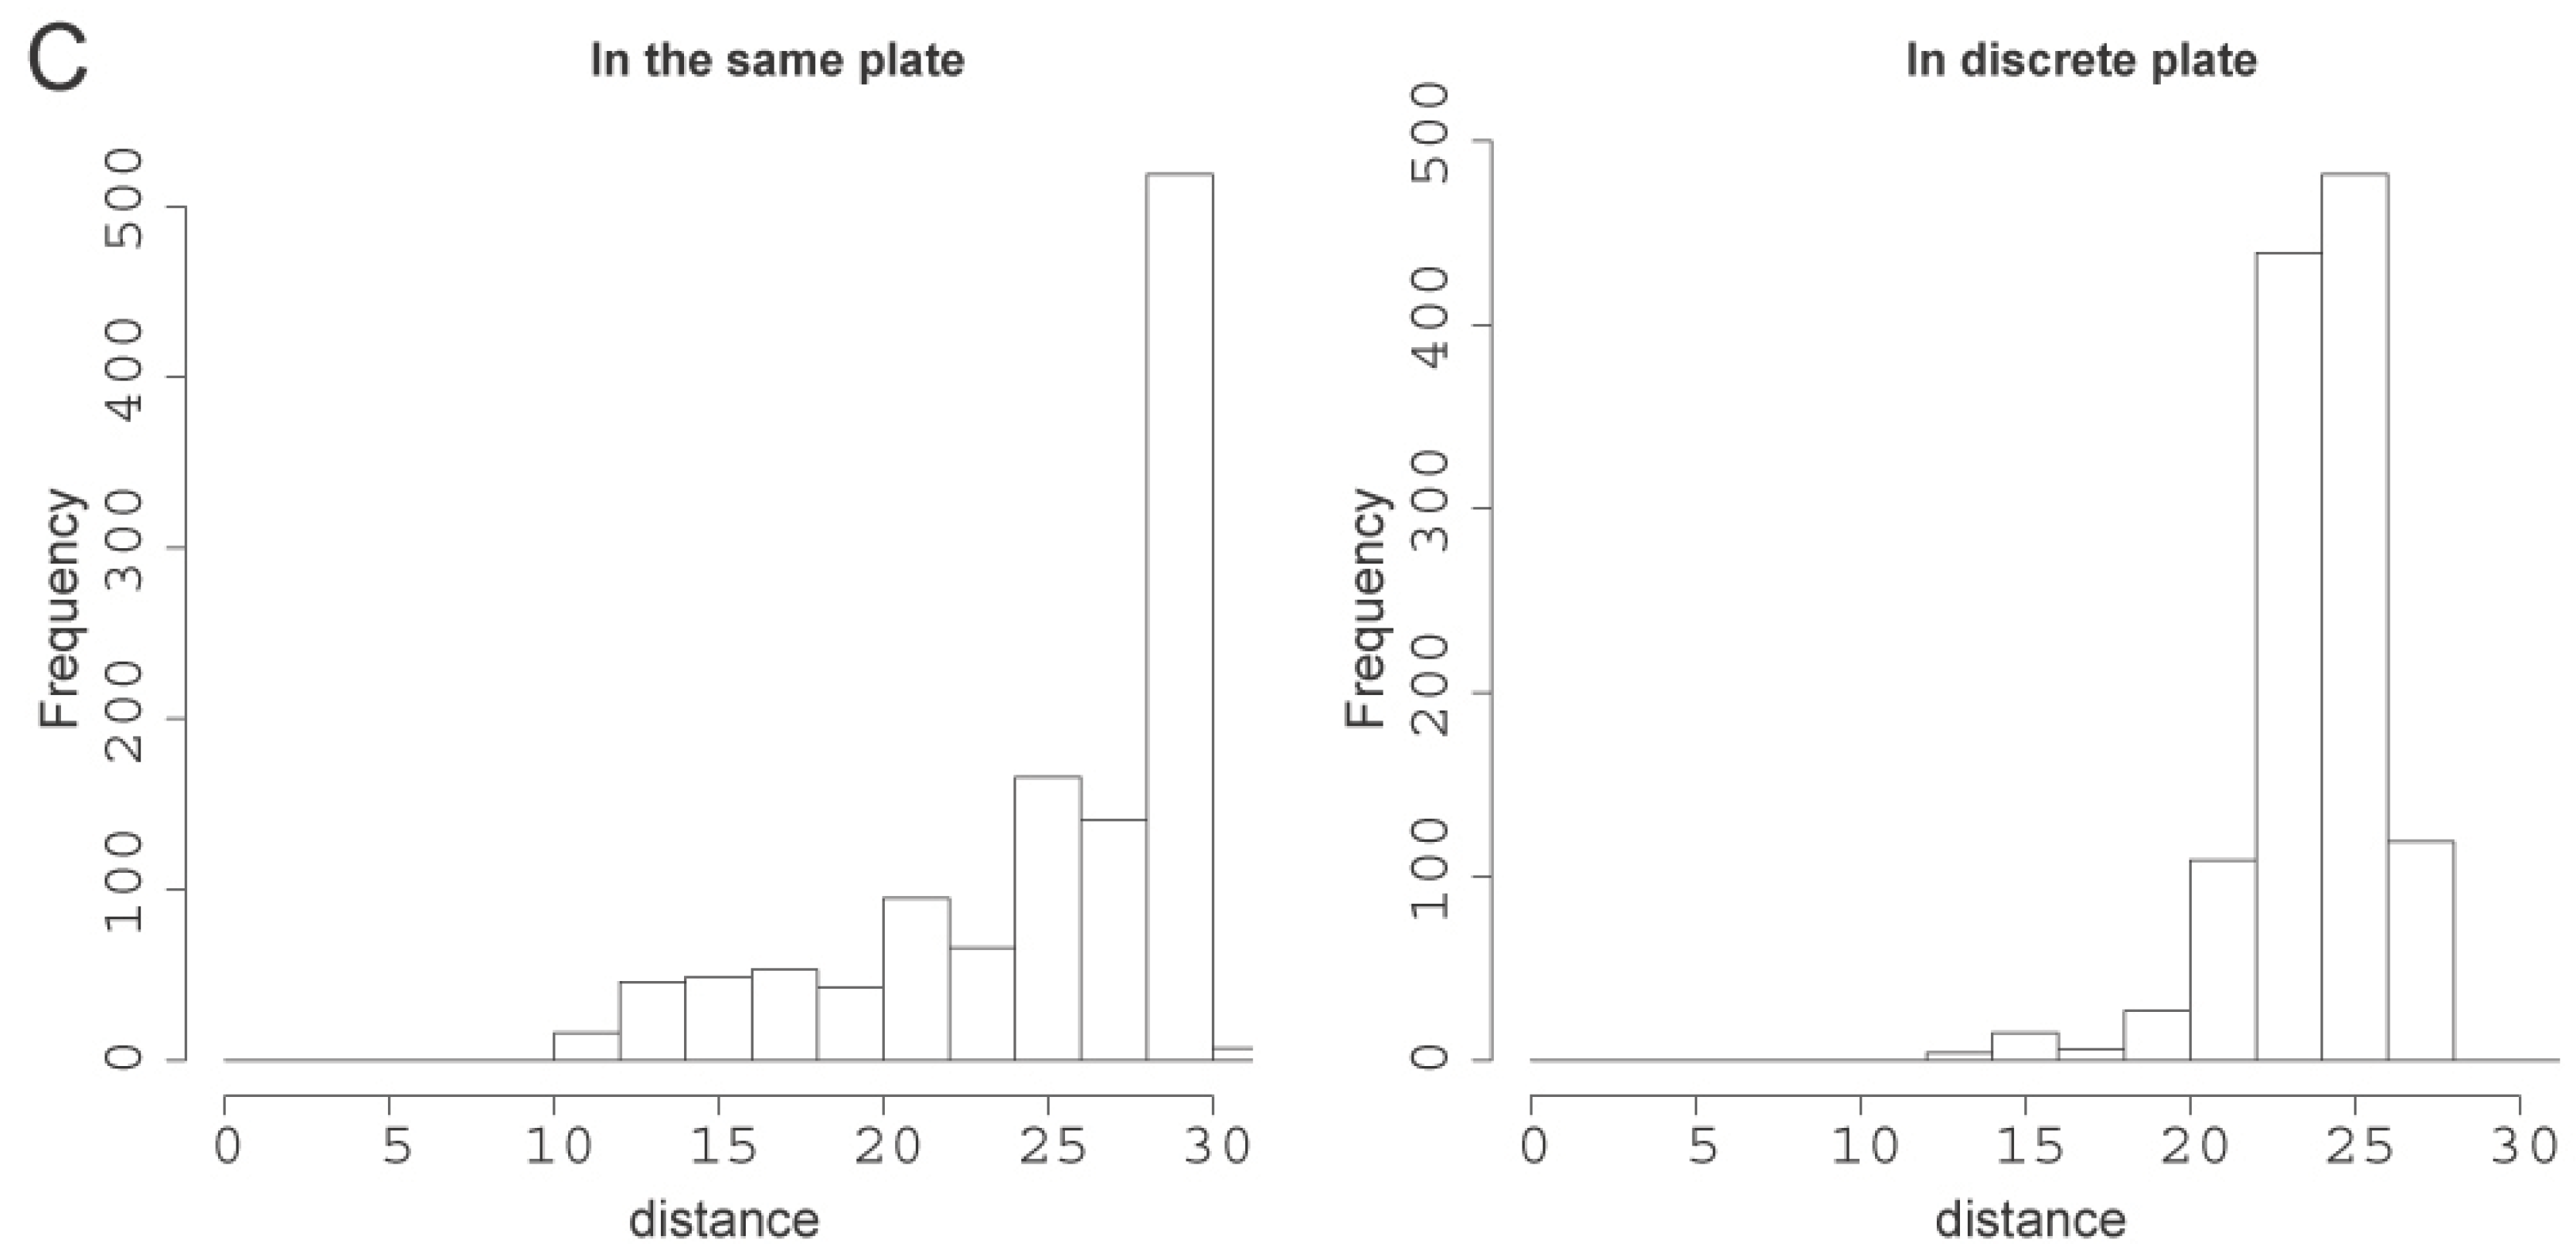
To see the relation between behavioral mode and collective behavior in droplets, we placed two droplets in one glass plate and recorded their paths for 60 min. As a control, we superimposed the trails of two single droplets of the same size selected at random from discrete plates. We conducted the experiment for three different sizes of the droplets: 3, 20 and 50 µL, because their dominant behavioral modes were completely different from one another (
Figure 6 and
Figure 7). The result for the first 20 min of movement for 20 µL droplets is shown in
Figure 8A. We found that the distance between the droplets was smaller when the droplets were in the same plate. This is evidence of an attracting force. The attracting force became weaker over time (
Figure 8B and
Figure 7C). Larger droplets (50 µL) did not show collective behavior even in the first 20 min (data not shown). The 3 µL droplets showed an attracting behavior similar to the 20 µL droplets that dissipated over time. We noted that convection flow was weak in older droplets and unstable in the larger droplets, which may account for their inability to show attracting behavior. Droplets that sustained strong organized convection flow also displayed attracting behavior.
Figure 7.
Transition probabilities between four behavioral modes for droplets of different volumes. (A). 1 µL droplet; (B). 20 µL droplet; (C). 50 µL droplet.
Figure 7.
Transition probabilities between four behavioral modes for droplets of different volumes. (A). 1 µL droplet; (B). 20 µL droplet; (C). 50 µL droplet.
Figure 8.
Mutual distance measurements between two droplets in two discrete plates (control) or in the same plate. (A). Mutual distance between two droplets of the size 20 µL in the first 20 min if the experiment; (B). The next 20 min and (C). the final 20 min.
Figure 8.
Mutual distance measurements between two droplets in two discrete plates (control) or in the same plate. (A). Mutual distance between two droplets of the size 20 µL in the first 20 min if the experiment; (B). The next 20 min and (C). the final 20 min.
2.6. Droplet Size and Behavior
The size of the droplet is responsible for its shape, convection flow and reaction rate, and these together influenced the behavioral mode as well and transitions between behavioral modes. This also influenced how a droplet physically interacted with an inanimate wall or another animate droplet.
Here we analyzed the movement or behavior of single droplets and noted that there were several types of motion for this system, depending on both size and age of the droplet. This was most apparent when mapping out the different modes of behavior for droplets of different size along with the intermodal transition frequencies (
Figure 7). It was also noted that the behavior of a droplet was not robust but shows fluctuation. This was most apparent in the COR data (
Figure 4) where both the smallest (1–10 µL) and largest (50 µL) droplets tested exhibited non-elastic properties. But this was not strictly observed with at least a few droplets from each size class exhibiting elastic behavior. Therefore a droplet from each size class may exhibit different modes of behavior and interaction depending on factors that affect the state of the droplet. For example, we have reported elsewhere that the behavioral mode transition probabilities were also affected by the previous mode due to a memory effect [
12].
We also characterized the behavior of two droplets moving in the same system and show that there was an attracting effect where two droplets tended to cluster together in space. We hypothesize that this attraction was due to droplet hydrodynamics influenced by local chemical signals produced by the droplets. The source of the attraction force may come from reciprocal enforcement of convection flows. Because convection flow in some sizes of droplets was unstable, they could not reinforce their flows and therefore they did not exhibit this attractive force (for example, large 50 µL droplets). It was clear from previous studies that single droplets produced chemical gradients and that single droplets sensed and responded chemotactically to such gradients [
8]. Here we showed the ability to sense and respond resulted in higher order collective behavior from such a simple chemical system.


