1. Introduction
The majority of deaths from gynecological cancer are caused by ovarian cancer. High-grade serous ovarian cancer (HGSOC) is the most prevalent and lethal histological form, accounting for 70% of all fatalities [
1,
2,
3]. At the time of therapy, 60% of ovarian cancer patients were in an advanced state [
3]. Currently, procaine-platinum chemotherapy, followed by tumor cell reduction, is the principal course of treatment for patients with HGSOC [
1,
4]. This course of treatment is beneficial for roughly 80% of HGSOC patients [
5]. The median progression-free survival (PFS) of patients with advanced HGSOC patients is just 18 months, and most HGSOC patients still experience tumor recurrence. Recurrence is thought to be the primary factor in these individuals’ deaths [
6,
7,
8]. Therefore, it is crucial to anticipate the recurrence of patients with advanced HGSOC in order to develop a precise and individualized treatment strategy and extend the patients’ survival time. Predicting postoperative recurrence is currently difficult. To enhance the prognosis of these individuals, prognostic indicators for advanced HGSOC must be developed. The diagnosis of ovarian disorders frequently uses magnetic resonance imaging (MRI). Some of its benefits include high soft-tissue resolution, multi-planar and multi-parameter imaging, non-invasiveness, radiation-free, and reasonable pricing. It also gives additional insight into the prognosis of HGSOC [
9,
10]. Deep learning, an artificial intelligence technique, has produced positive outcomes in the detection of important features from medical images [
11,
12,
13,
14]. Numerous studies in the field of medicine have used deep learning with considerable results [
15,
16,
17,
18,
19,
20]. Through convolutional operations and a hierarchical neural network topology, deep learning extracts tumors’ intrinsic properties, which has strong prognostic value [
21].
In this retrospective study, we investigated the deep learning technique to extract the prognostic biomarkers of HGSOC from preoperative MRI scans in order to provide a non-invasive individualized HGSOC recurrence prediction model. Additionally, a novel prognostic analysis approach is provided by the deep learning method, which can only identify prognostic indicators from tumor image data. This allows us to use a vast amount of data without further analysis. Overall, these data may offer crucial insights into designing personalized treatments and post-treatment planning.
2. Materials and Methods
2.1. Patients
The 185 patients with surgically and pathologically confirmed HGSOC who underwent pelvic MRI exams at the First Affiliated Hospital of Chongqing Medical University between January 2013 and December 2019 were retrospectively examined.
The inclusion criteria were: (1) Stages III or IV of HGSOC, as determined by pathology, according to the International Federation of Obstetrics and Gynecology; (2) the initial tumor cell reduction operation being performed on all patients; (3) pelvic MRI being carried out prior to surgery; (4) follow-up information being available (including MRI and tumor markers); (5) platinum with taxol medicines being used in postoperative chemotherapy.
The exclusion criteria were: (1) preoperative increasing cancer antigen 125(CA-125), human epididymis protein 4(He4), age, or FIGO staging being absent; (2) recurrence within 2 months of the decrease in the initial tumor cells; (3) there being no follow-up for less than 18 months; (4) patients having treatment prior to their baseline MRI; (5) clear MRI picture artifacts; and (6) patients with other cancers besides HGSOC, such as breast cancer.
To achieve the best possible cytoreduction in all pelvic, abdominal, and retroperitoneal lesions, all included patients with advanced HGSOC (n = 185) received primary debulking surgery performed by skilled gynecologic oncologists.
Every patient was checked on every two to four months for the first two years, then every three to six months starting in year three, and then annually starting in year five [
22].
Recurrence was the study’s endpoint, and it was determined by combining radiological findings, CA-125 levels, and clinical symptoms. Recurrence-free survival (RFS) is the period of time between clinical remission and the first recurrence [
23]. Age, preoperative CA-125, HE4, residual tumor status, FIGO stage, tumor location and maximum tumor diameter, metastases, Ki67, and progesterone receptors (PR) were among the preoperative clinical parameters that were gathered from the institutional picture archiving and communication system (PACS) (
Table 1).
2.2. MRI Parameters
Two separate scanners (GE, Signa HDxt 1.5 T, and Siemens, MAGNETOM Skyra 3.0 T) were used for the MRI exams. Prior to the examination, the patient had to fast for at least 4 h and fill their bladder with moderate amounts of water. The 1.5 T scanning parameters were as follows: T2FSE:TR/TE 6680 ms/130 ms; slice thickness, 4 mm; gap, 1 mm; field of view, 35–40 cm; DWI (TR/TE, 7000 ms/77.5 ms), b value, 1000 s/mm2; and contrast-enhanced T1WI (LAVA, T1CE):TR/TE, 4.2 ms/2.1 ms) gadopentetate dimeglumine (Magnevist, Bayer Schering) was injected at a rate of 2.0 mL/s for the contrast-enhanced pictures. The 3.0 T scanning parameters were as follows: T2FSE:TR/TE 3000 ms/87 ms; slice thickness, 5 mm; field of view, 35 cm; DWI (TR/TE, 5700 ms/92 ms), b value, 800 s/mm2; and contrast-enhanced T1WI (VIBE, T1CE):TR/TE 3.5 ms/1.4 ms; slice thickness, 2 mm; gadopentetate dimeglumine (Magnevist, Bayer Schering) was injected at a rate of 2.0 mL/s and then repeated at 25–30, 60–90, and 180 s into the examination.
2.3. Development of the Deep Learning Network
We proposed a novel neural network based on ResNet34-CBAM to extract internal features from preoperative MRI images of ovarian cancer patients and assess them from several perspectives in conjunction with clinical data. Preoperative MRI imaging and relevant clinical features of patients can be used to predict the suggested model.
Dr. He Kaiming suggested ResNet [
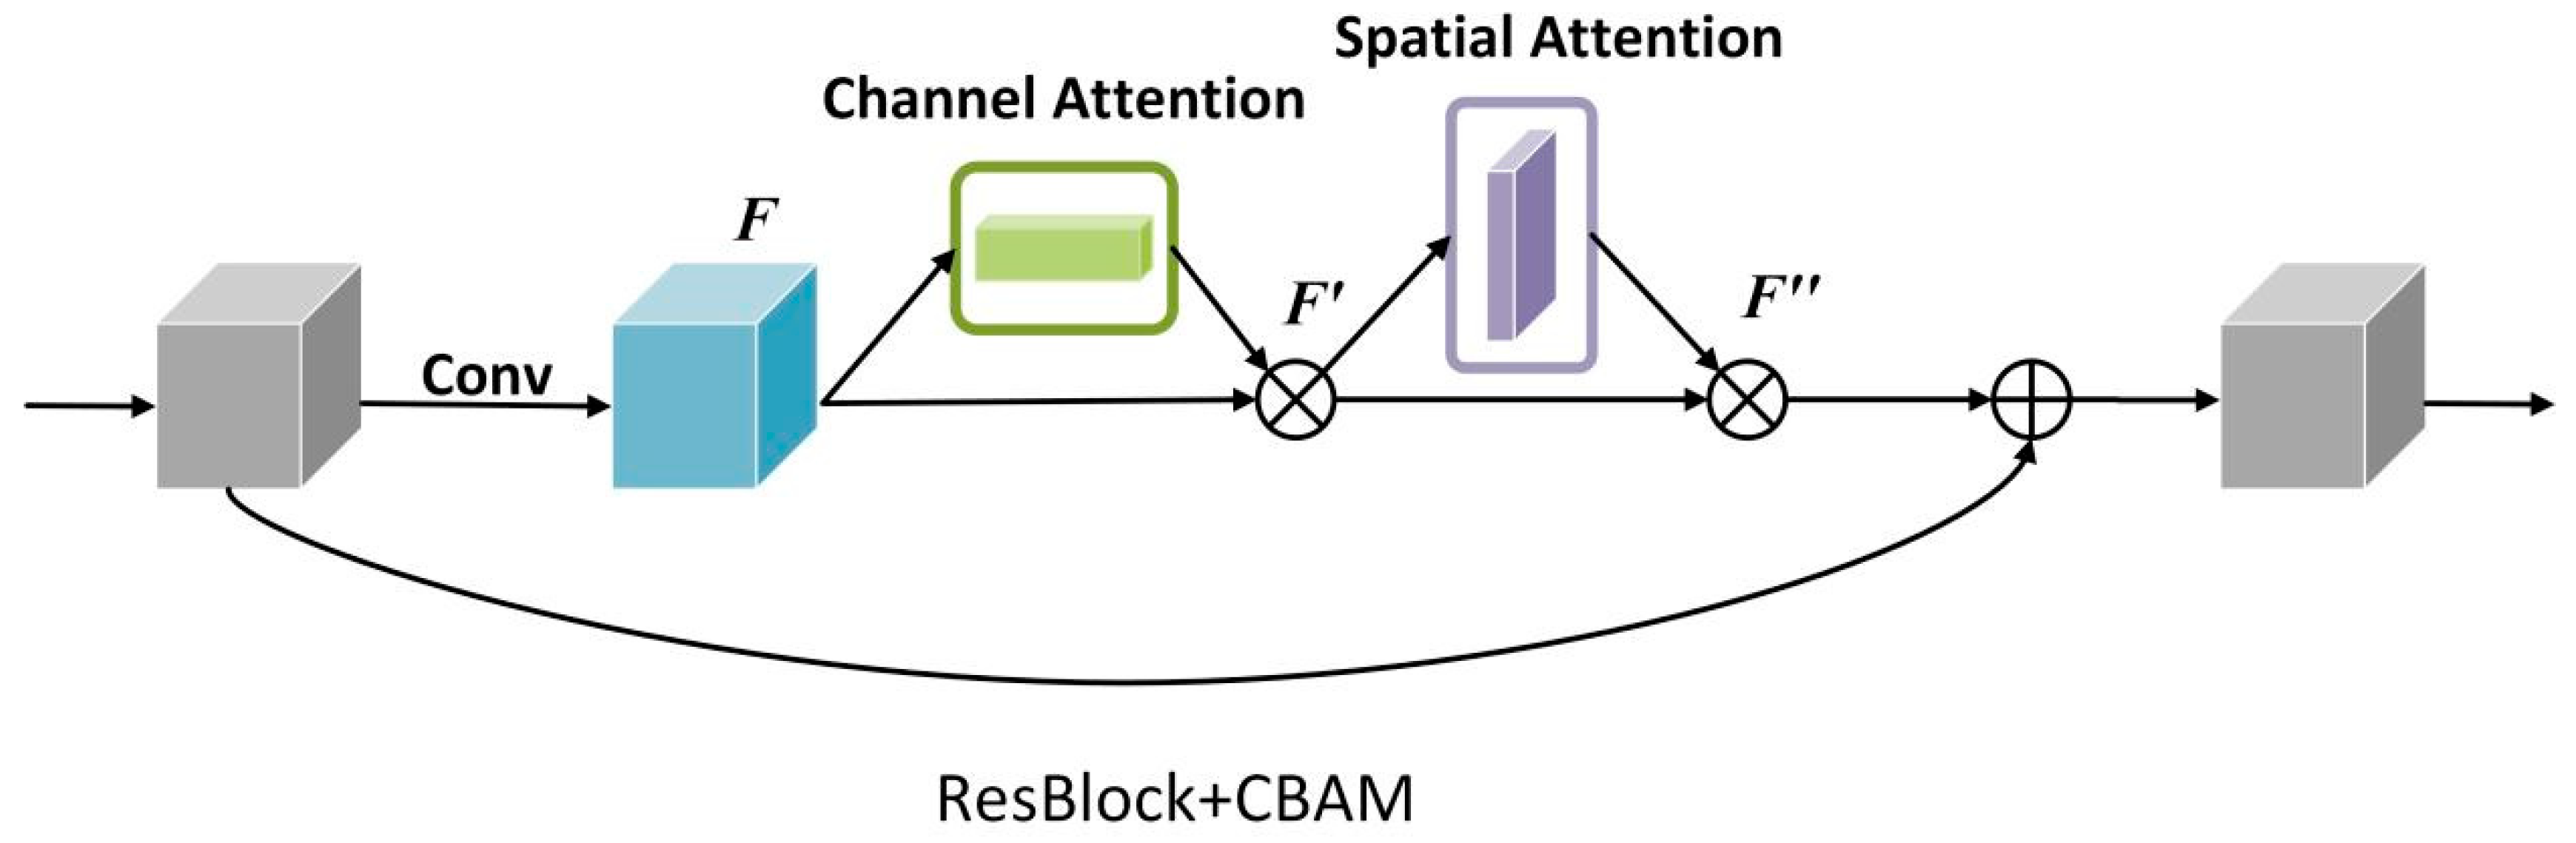
24] in 2016. The model employs residual connections to address the degradation phenomena that occur as the depth of the deep neural network increases; as the network depth increases, the network’s accuracy saturates or even falls. The residual connection supplements the possible loss in image feature extraction and eliminates the problem of the depth neural network is too deep to learn by adding the extracted image features to the original input. ResNet CBAM extends ResNet’s capacity to learn images by incorporating channel attention and spatial attention (
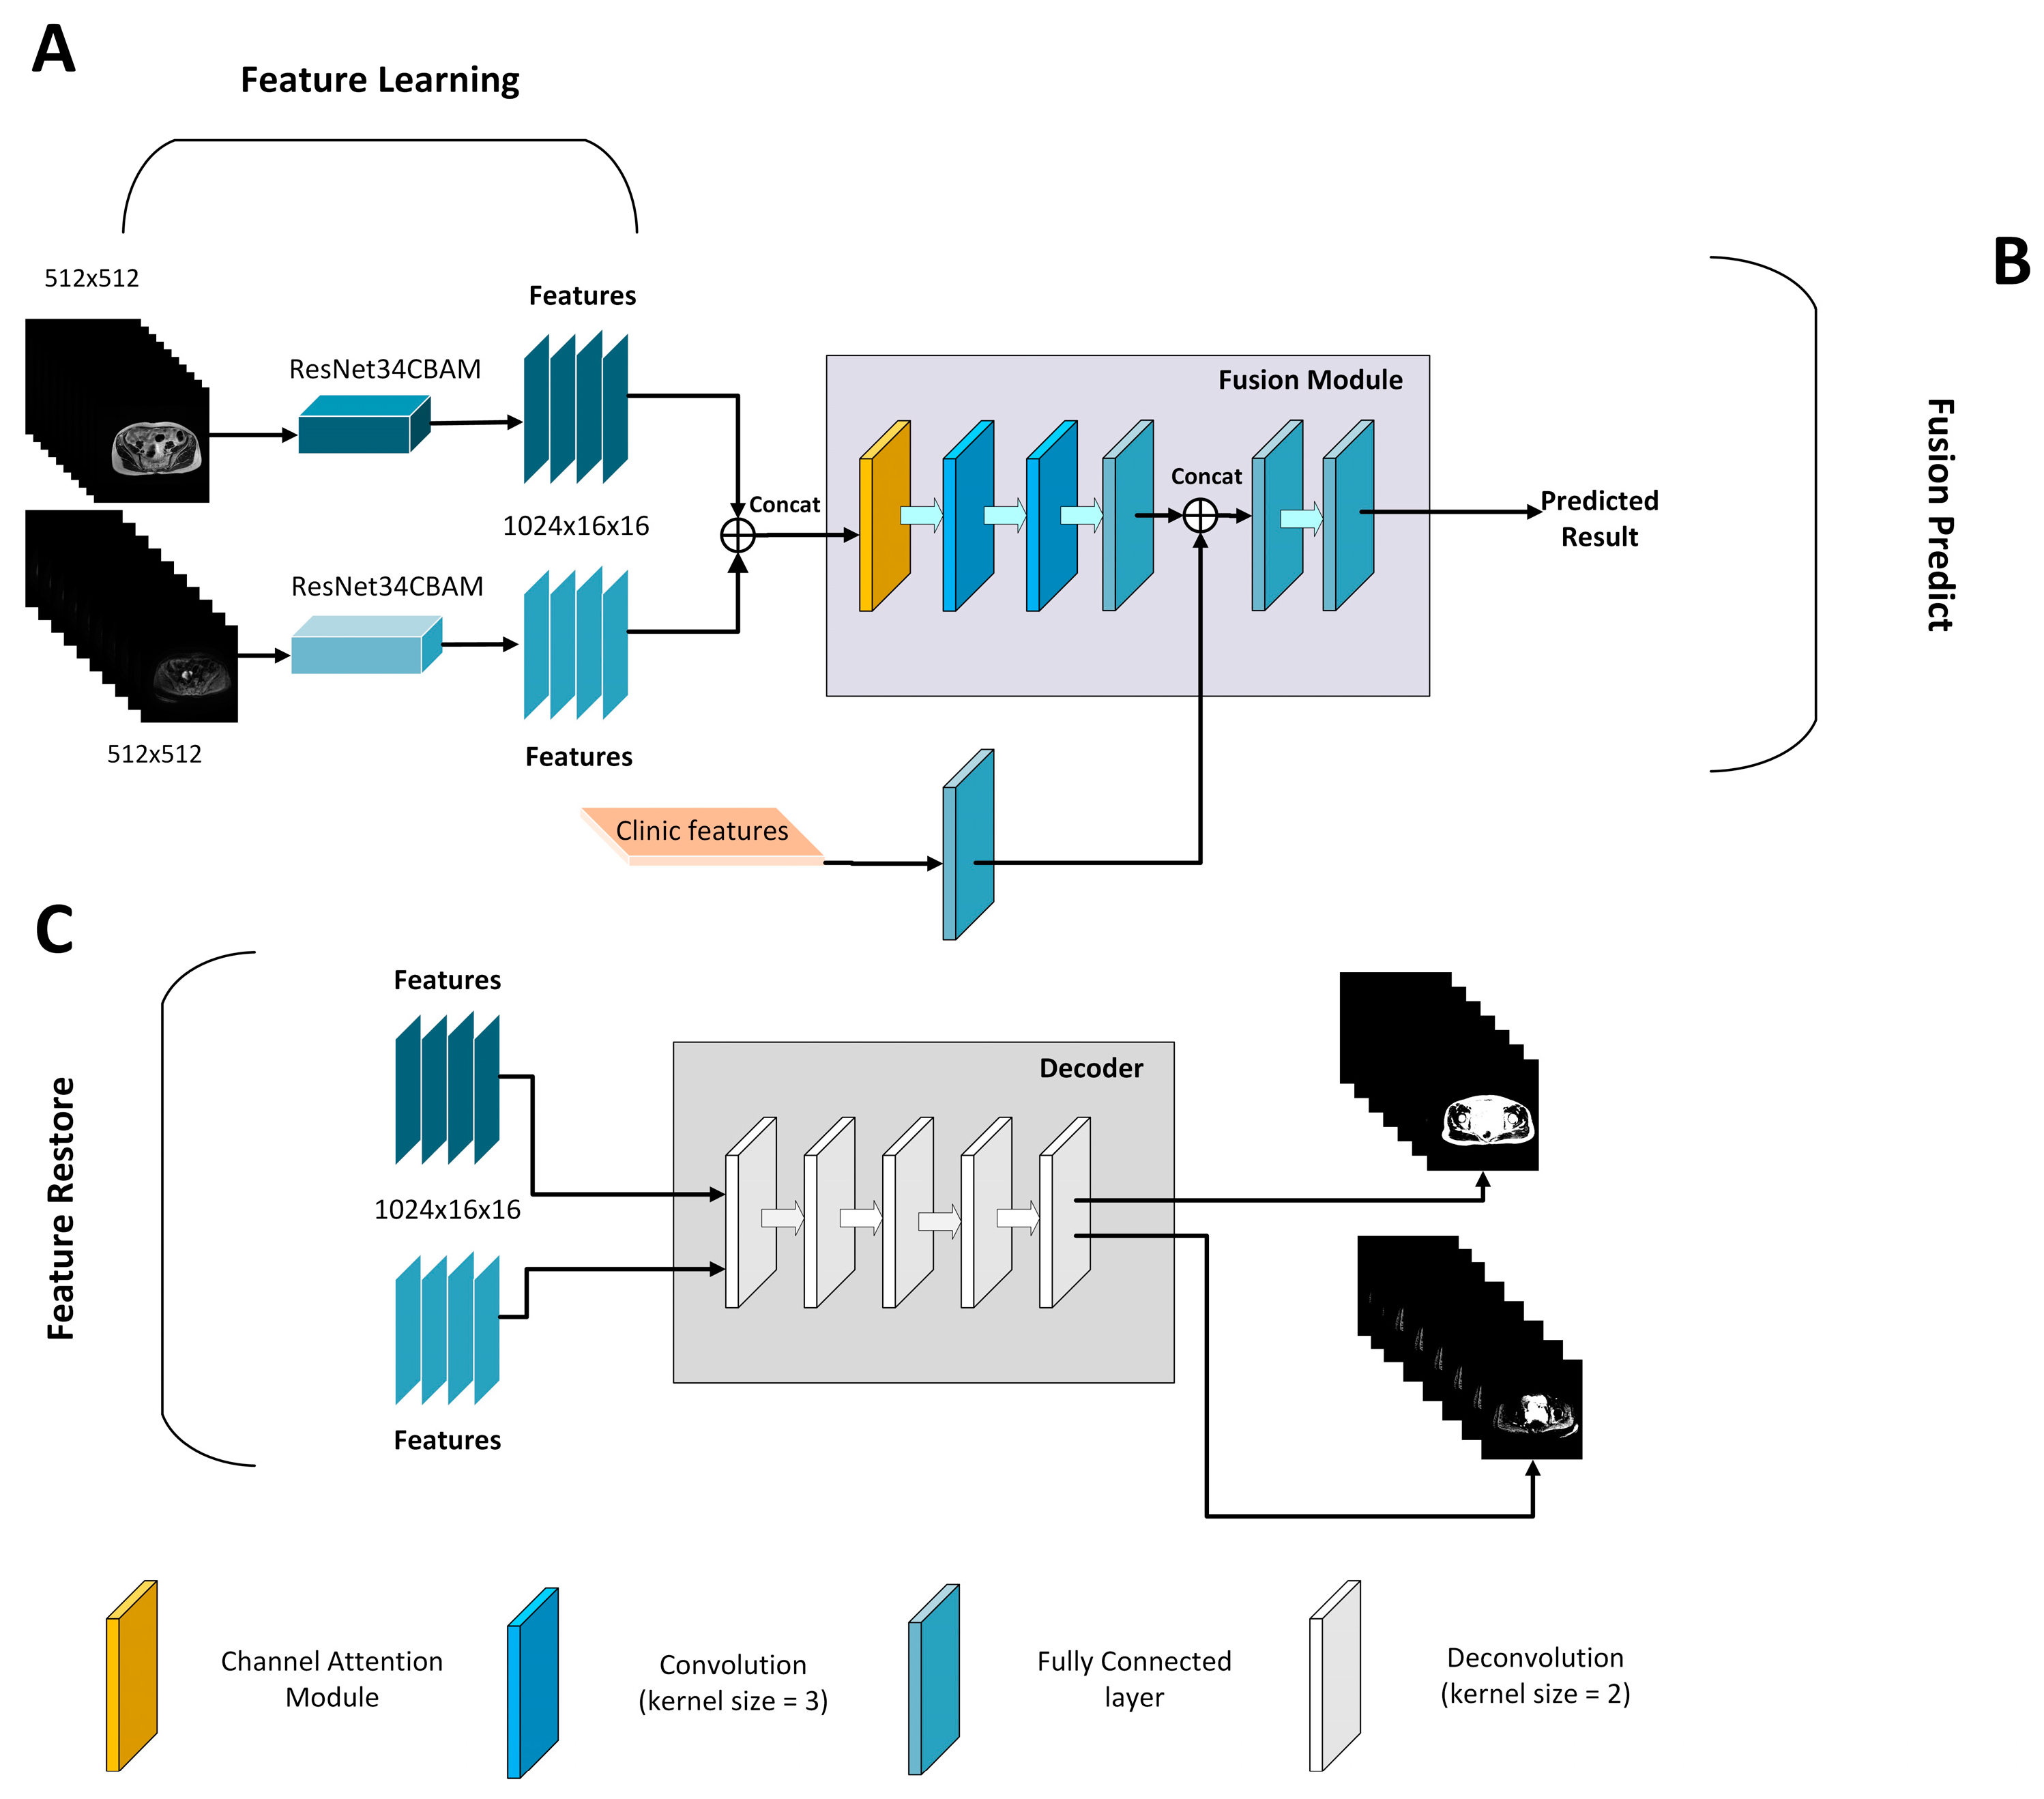
Figure 1). The original ResNet, as the entire connection layer of the classifier, including the convolution layer used to extract image features, removes redundant features, compresses the pooling layer of data, and finally combines features and maps the feature space to the tag space. Next, it accelerates convergence speed, reduces internal variable transfer, add a batch normalization layer between layers, and use the adaptive average pooling layer to compress spatial dimensions before finally entering the full connection layer, while filtering redundant features and reducing the number of model parameters. Based on this premise, ResNet CBAM includes channel attention and spatial attention to learn the significant aspects of the characteristics collected by ResNet. As a result, we used ResNet34-CBAM as the feature extraction to learn the image features automatically. Simultaneously, to verify whether the extracted features showed the inherent features of the image tumor, we used the decoder’s deconvolution layer to reconstruct the extracted features into an image, which we compared and evaluated with the original image. To achieve this goal, we trained the ResNet34CBAM using 185 patients. Radiologists evaluated tumors on all MRI slices from 185 patients, resulting in 3839 tumor pictures to train the network. During the training process, the network was iteratively optimized until the intrinsic image features were extracted. After obtaining the features of two modes via ResNet34-CBAM, the clinical features were entered into the information fusion device to fuse clinical features and predict HGSOC (
Figure 2). The information fusion device has two convolution layers, two linear activation layers, one channel attention layer, and one full connection layer for final classification.
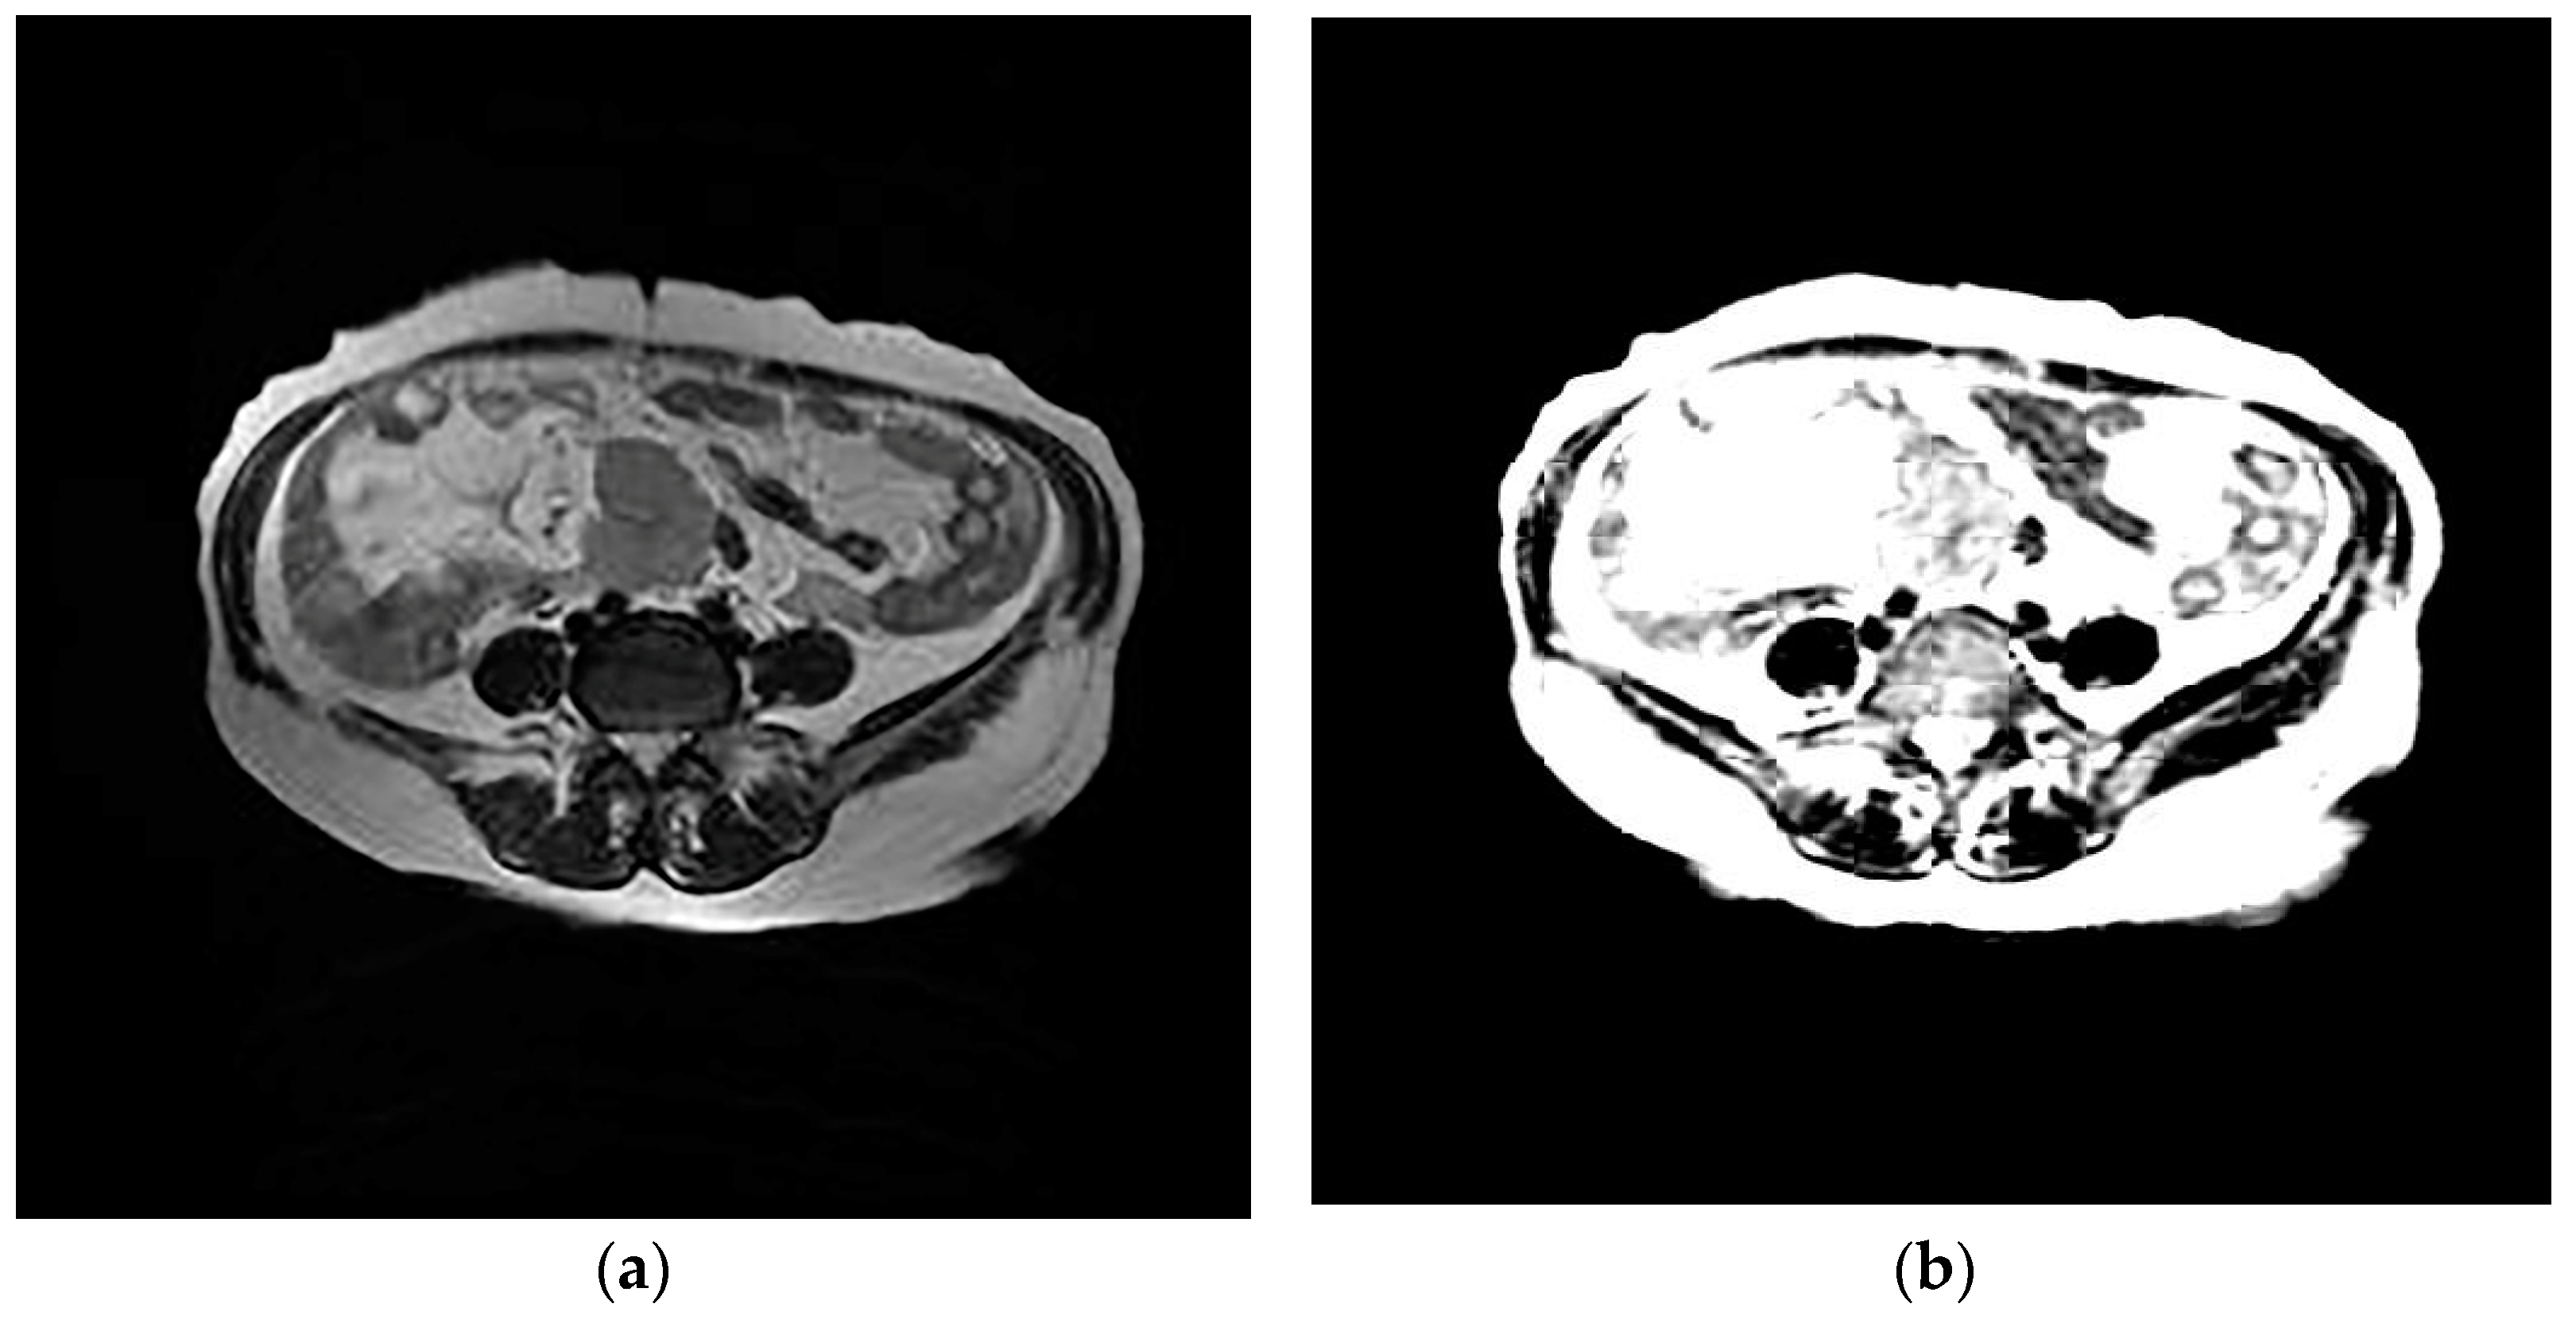
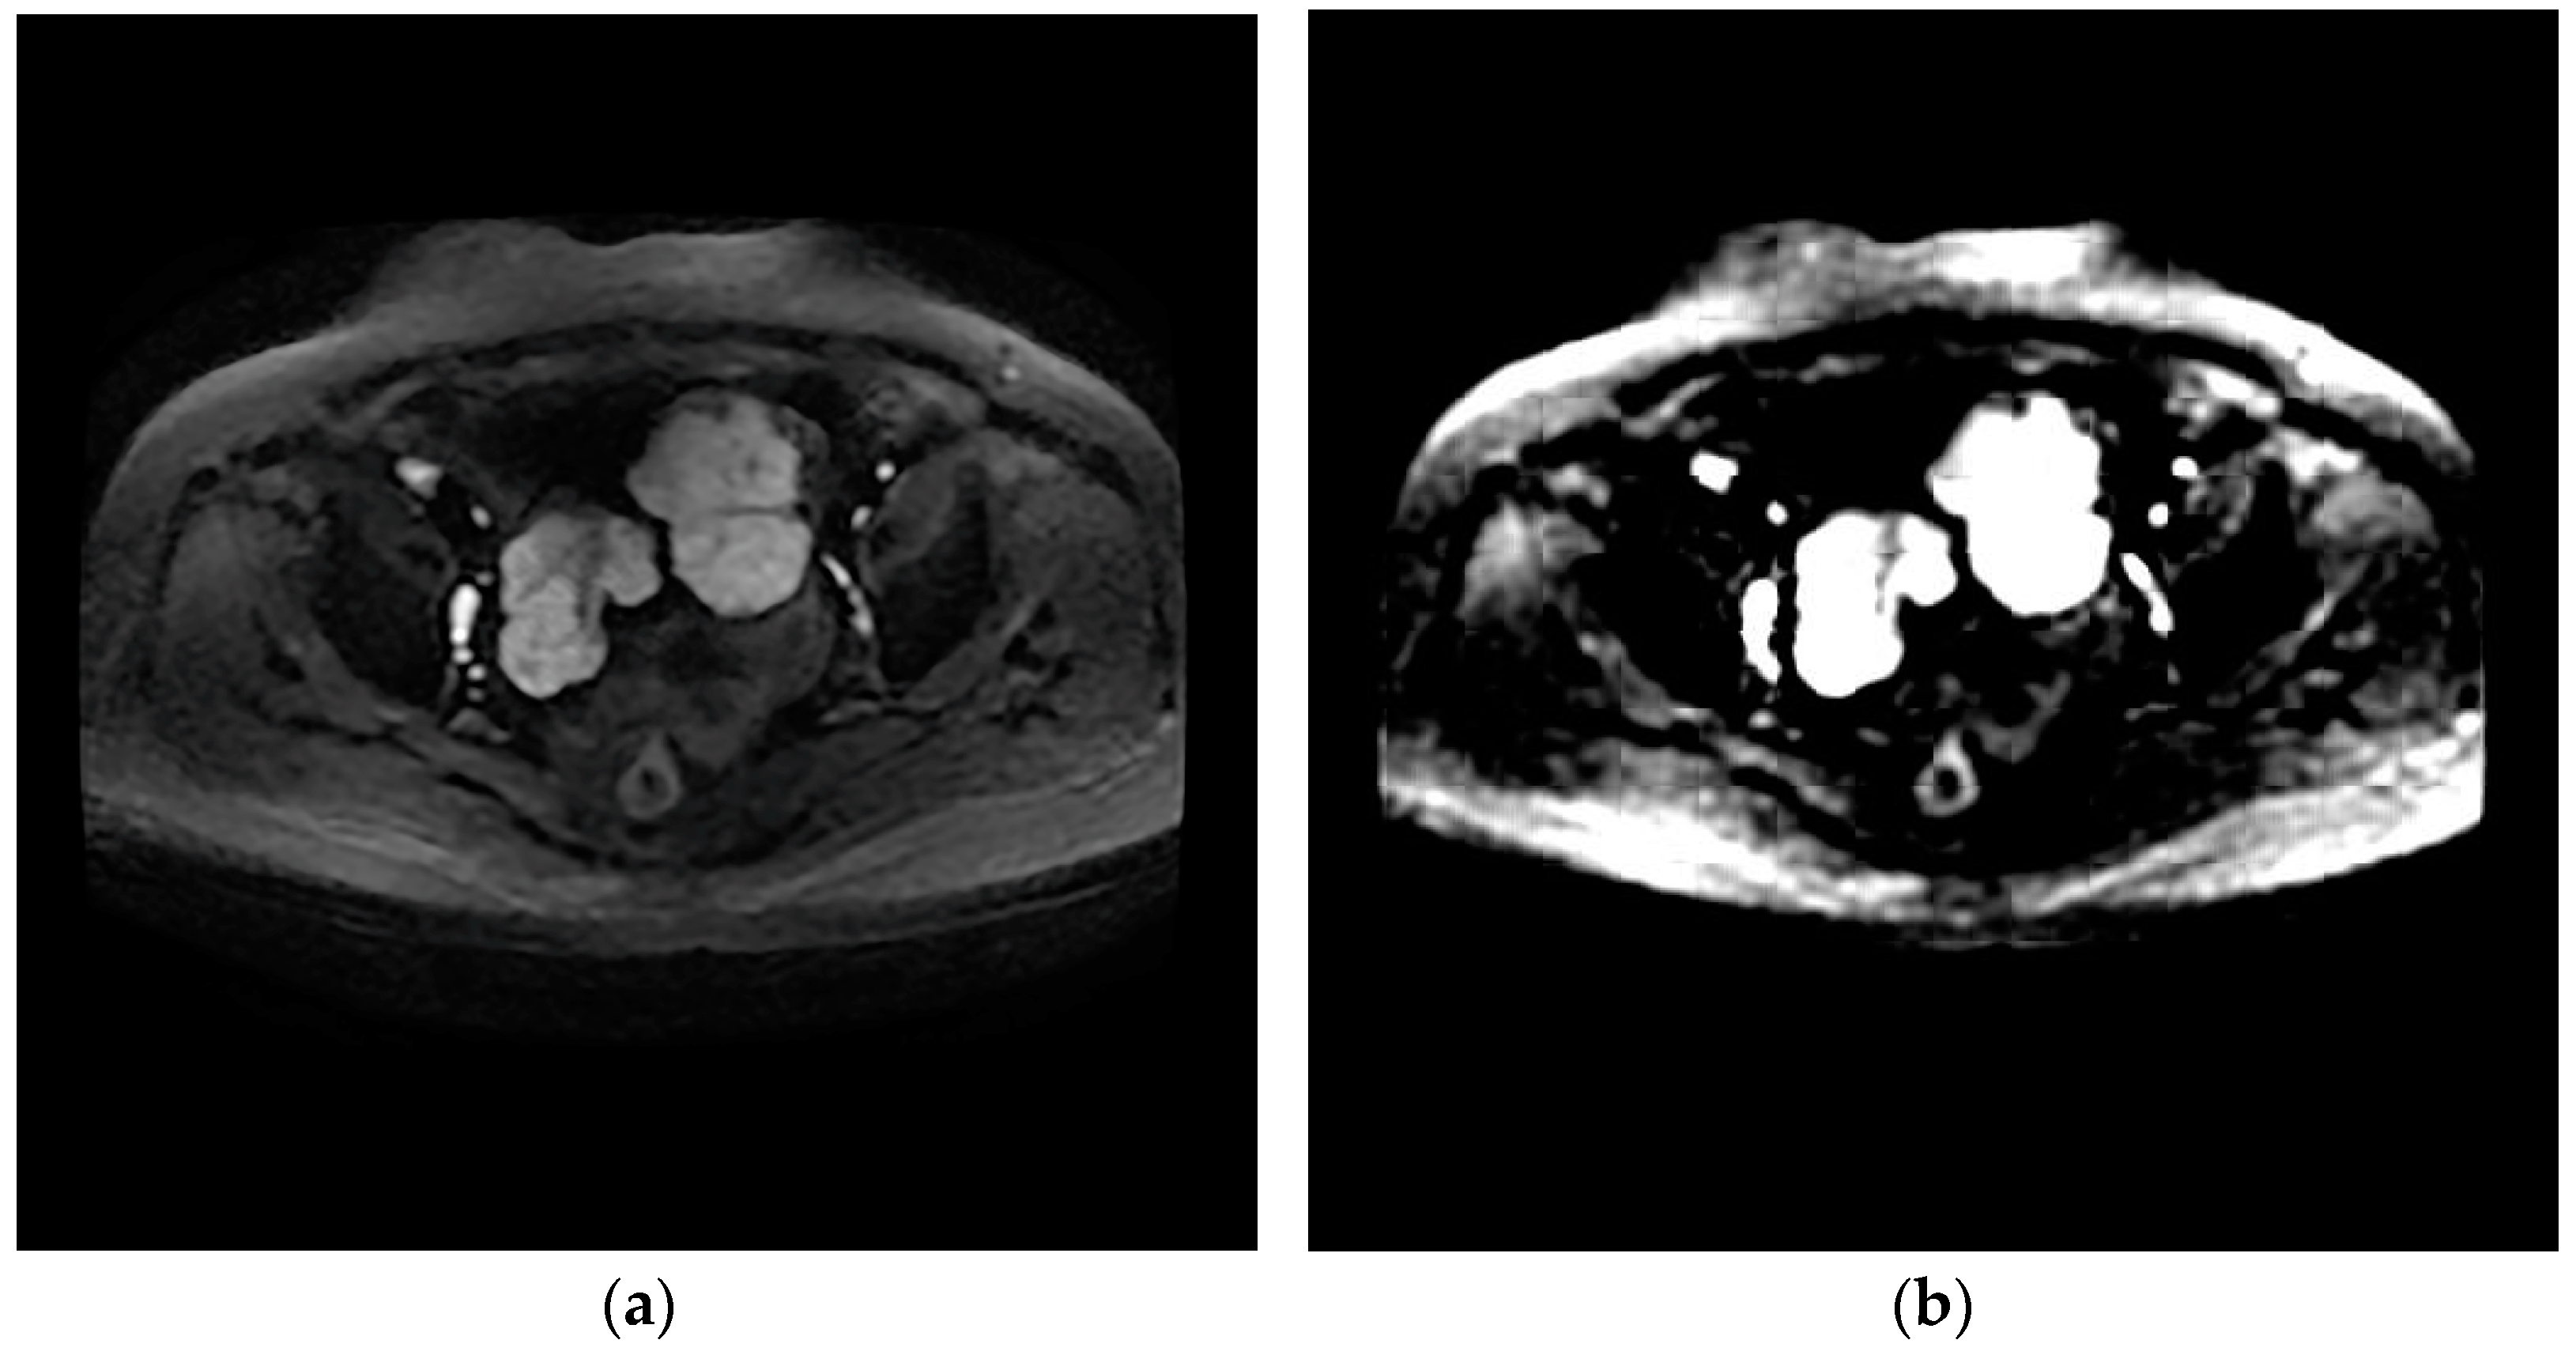
The design of the network can provide the value of image features. The network eliminates redundant information through learners and decoders, and only retains features that can reflect the inherent characteristics of HGSOC, and therefore a small number of features can contain most of the information of tumor images. Therefore, we input T2WI and DWI images from the same patient into the network and reconstructed them into images. It was found that the reconstructed images based on the features were similar to the original images, which proves that the internal features of the images are learned, as shown in
Figure 3 and
Figure 4.
2.4. Deep Learning Feature Extraction
When the trained neural network was obtained, it was used to extract the internal features of the image from MRI images of patients with high-grade serous ovarian cancer. First, we chose T2WI and DWI sequences from MRI images of patients with tumor areas, entered them into the network according to patient number, and used bilinear interpolation to resize them all to 512 × 512 before input. We then calculated the mean and variance of these images and normalized the mean and variance. They were then routed to the RestNet34CBAM network for feature extraction. We averaged the features of the same patient’s image slices in the same sequence to obtain the T2WI modal image features and DWI modal image features corresponding to each patient, and then sent the two features to the information fusion device because each patient’s sequence contained multiple tumor slices.
2.5. Clinical Characteristics
Because clinical features were employed as prognostic biomarkers in HGSOC [
25], we compared the prognostic significance of the deep learning feature with the clinical characteristics. We developed a clinical model using features such as age, preoperative CA-125, HE4, residual tumor state (RD), FIGO stage, tumor location, maximum tumor diameter, ascites, lymph node metastasis, peritoneal metastasis, distant metastasis, KI-67, and PR. We converted these clinical features into numerical values and then combined them into a vector with the patient number to facilitate one-to-one correspondence with the patient image features. We standardized the clinical features of all patients with a z-score after obtaining the clinical feature vector, and then fused them with the extracted image features. At the same time, we used a deep confidence network to screen the clinical features. A clinical model was built based on the clinical characteristics to predict the recurrence probability.
3. Statistical Analyses
Age, maximum tumor diameter, preoperative HE4 levels, and CA-125 levels were all reported, along with their medians and interquartile ranges (IQRs). Other categorical variables were presented in the form of frequencies and proportions. The F-test/independent samples t-test and Fisher’s exact test, respectively, were used to examine differences in continuous variables and categorical variables. Every statistical test had two sides. The cutoff for significance was p < 0.05.
A threshold of 0.5 was used to categorize the prediction scores produced by each model in order to assess the reliability of the clinical model, the deep learning model based on the fusion of T2WI and DWI images, and the fusion model based on clinical features and deep learning features. The risk of recurrence was high for values above 0.5 and low for values below 0.5. At the same time, we assessed the consistency between the model’s predicted recurrence probability and the actual recurrence using Harrell’s consistency index. The Kaplan–Meier chart was used to assess the correlation between the risk score of the prediction model and patients’ RFS. The index was between 0.6 and 0.8, indicating that the model was effective. To assess the model’s performance and accuracy, we used the AUC value of the area under the receiver operating characteristic curve (ROC curve) and the corresponding 95% CI, as well as the accurate value and the corresponding 95% CI. The DeLong method was used to test the statistical differences between ROC curves [
26]. The model proposed in this study was built with Python programming software (version 3.9 Python) and the lifelines package in Python.
4. Results
4.1. Patient Characteristics
The basic characteristics of all patients in our dataset are summarized in
Table 1. Preoperative CA125, HE4, maximum tumor diameter, tumor location, residual status of tumor, peritoneal metastasis, and PR were the clinical characteristics with statistical differences between the recurrence and non-recurrence groups.
4.2. Deep Learning
In the two validation sets, the fusion model had the best prediction effect (validation set 1 C-index = 0.752, [95% CI: 0.734–0.770], validation set 2 C-index = 0.813, [95% CI: 0.782–0.844]), followed by the deep learning model (validation set 1 C-index = 0.625, [95% CI: 0.582–0.668], validation set 2 C-index = 0.600, [95% CI: 0.554–0.644]), The clinical characteristic model showed the worst performance (validation set 1 C-index = 0.505, [95% CI: 0.457–0.552], validation set 2 C-index = 0.501 [95% CI: 0.447–0.555]) (
Table 2).
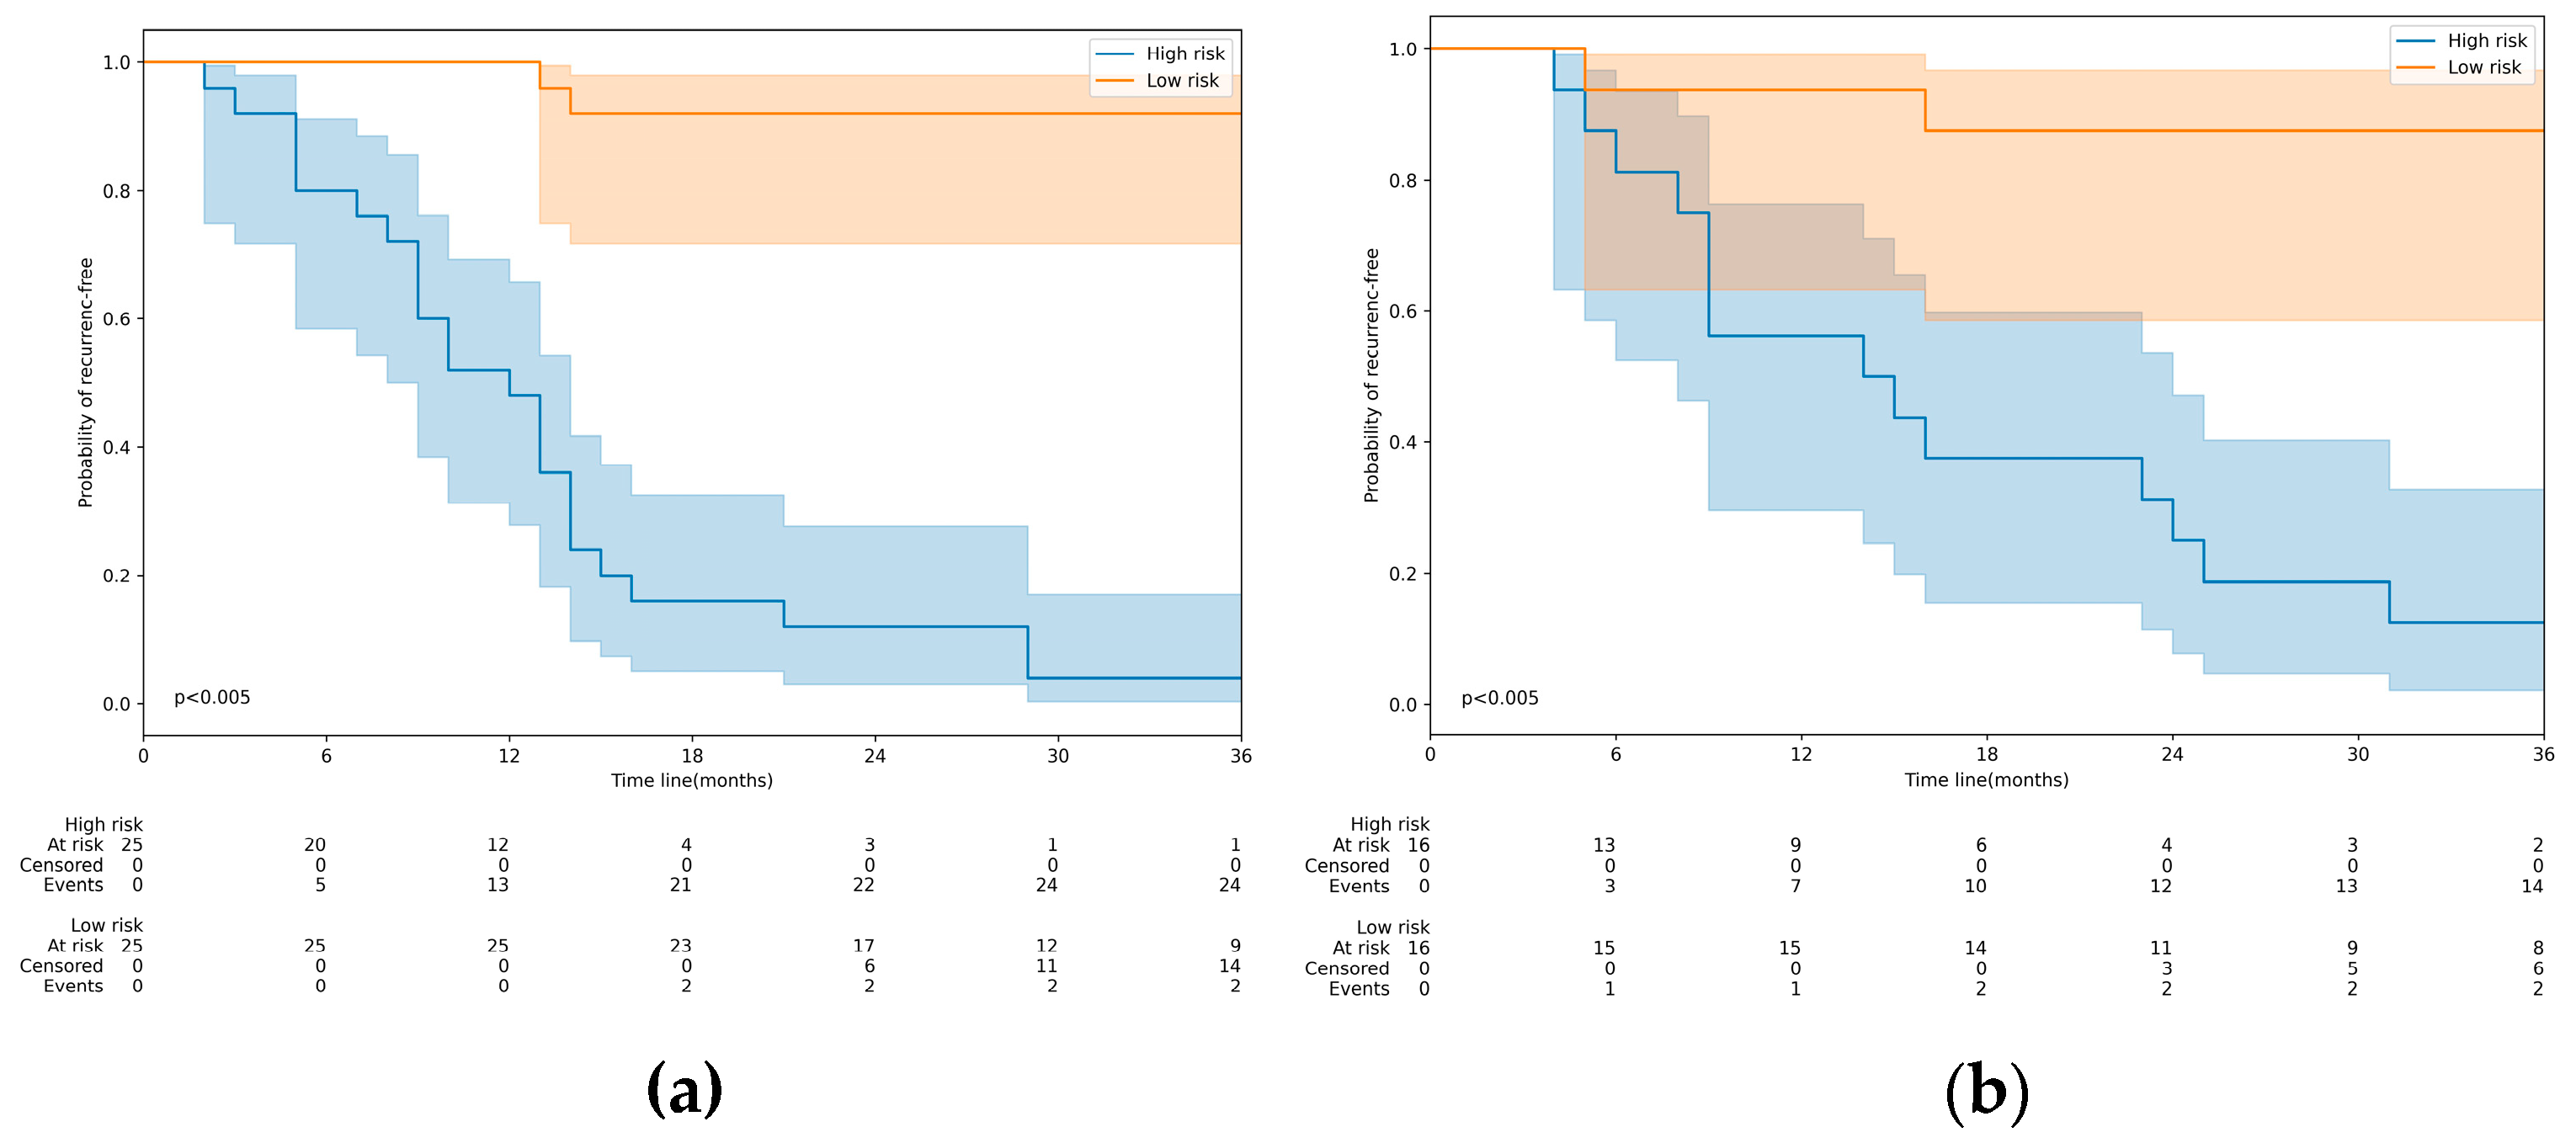
Furthermore, the Kaplan–Meier analysis confirmed the strong correlation between the model’s prediction score and RFS (
Figure 5). With a prediction score of 0.5 as the threshold, we divided the patients into high- and low-risk recurrence groups and found significant differences in RFS between the two groups in both validation sets.
At the same time, we calculated the AUC value of the model on the two validation sets to further demonstrate the fusion model’s predictive ability for recurrence, and the fusion model reached 0.986 (95% CI: [0.977–0.995]) on validation set 1 and 0.961 (95% CI: [0.937–0.985]) on validation set 2, proving that the fusion model had a good predictive ability for recurrence.
In the two validation sets, the AUC of the deep learning model was higher than that of the clinical model (validation set 1 AUC = 0.706, [95% CI: 0.655–0.757]; validation set 2 AUC = 0.676, [95% CI: 0.630–0.722]); however, the fusion model’s AUC was significantly higher than those of the clinical model and the deep learning model.
Using the DeLong method, the difference between the models was statistically significant (p < 0.05). (Clinical model vs. deep learning model, p = 0.00349; clinical model vs. fusion model, p = 0.00001; deep learning model vs. fusion model, p = 0.00127).
5. Discussion
To our knowledge, only a few studies on MRI-based deep learning for recurrence prediction in high-grade serous ovarian cancer have been published. As a result, the initial goal of our study was to create and evaluate a fusion model based on MRI features and clinical data to predict the probability of recurrence in HGSOC patients. Our findings suggest that the fusion model may be more useful than the clinical model in predicting RFS in patients with advanced HGSOC. Furthermore, the fusion model had a higher AUC than models based on images alone or clinical characteristics alone.
Some clinical trials have demonstrated that procaine–platinum treatment can extend the RFS of patients with advanced HGSOC and increase patient survival [
27,
28,
29]. The clinical needs of patients who are at high risk of recurrence for such treatment have not been satisfied. In clinical practice, however, no possible indicators have been shown to predict HGSOC recurrence. As a result, effective tumor recurrence biomarkers will enable personalized treatment of advanced HGSOC.
Thousands of neuron routes are used in the deep learning network to extract the inherent properties of HGSOC. ResNet, a classic deep learning network, has long been demonstrated to have a strong ability to self-learn features on a variety of image datasets. In recent years, attention has emerged as an effective learning method. It can make neural networks pay more attention to points of interest while learning features, thereby improving neural network feature learning ability. ResNet CBAM is formed from the combination of the two, which also has a stronger learning ability. The network we created employs ResNet34-CBAM as a learner to extract multi-level features of tumor images from MRI images of HGSOC patients. Different image features are extracted from each layer of the network, beginning with low-level features and progressing to complex high-level features as the level deepens.
The current research demonstrated that, compared to the AUCs from each MRI sequence separately, the combined model from two sequences had a significantly higher AUC for predicting the risk of recurrence. This result is consistent with earlier research that found multi-parametric models to have better predictive performance in a number of carcinomas, such as nasopharyngeal, breast, pancreatic, and rectal carcinomas [
30,
31,
32,
33]. Comparatively to the modality of CT, multi-parametric MRI has obvious advantages for offering potential predictors [
4]. More significantly, some advanced HGSOCs frequently manifest as small lesions with hazy borders and have a propensity to spread through widespread metastases, making it challenging to distinguish them from primary ovarian masses [
34,
35]. The performance of the fusion model combining deep learning features and clinical information was significantly higher than that of a single clinical model. This result is consistent with the research of Wang et al. [
36].
Although the results are encouraging, our research still has some limitations. First, the ResNe34-CBAM network was used to extract the internal features of MRI images and restore them to images. However, the restored images were similar to the original images on the whole, but there was still some blurring in the fine parts. Later, more detailed restored images can be optimized. At the same time, the specific relationship between the extracted features and the actual development of cancer has not been discussed. Secondly, the performance gap between the single clinical model and the single image model is larger than that of the fusion model, and it is not possible to identify whether clinical features or image features contribute greatly to the combined model. In the future, we can fuse clinical features and image features with different weights in this regard, and then evaluate the important party. Thirdly, due to the limitation of data, only the probability of recurrence of HGSOC can be predicted, but the recurrence time and degree cannot be estimated roughly. In the future, the recurrence of HGSOC can be predicted more carefully and deeply by expanding the data.
6. Conclusions
The current study demonstrates that deep learning can provide new MRI-based prognostic biomarkers related to HGSOC recurrence that are more predictive than clinical features. We also created a noninvasive fusion model to predict HGSOC recurrence using preoperative MRI imaging, with the goal of assisting with individualized HGSOC treatment and monitoring plans. In addition, we propose a new method for mining HGSOC’s intrinsic features. This method can use a large amount of data without requiring additional information.
Author Contributions
Conceptualization, L.L. (Lili Liu); methodology, H.W. and Y.T.; formal analysis, H.W.; data curation, L.L. (Lili Liu), L.L. (Li Liu) and J.W.; writing—original draft preparation, L.L. (Lili Liu) and H.W.; writing—review and editing, Y.L.; supervision, S.C. and Y.L. All authors have read and agreed to the published version of the manuscript.
Funding
This research was funded by Chongqing Normal University Graduate Scientific Research Innovation Project, China (grant number YKC22019).
Institutional Review Board Statement
The study was conducted in accordance with the Declaration of Helsinki, and approved by the Human Ethics Committee of the First Affiliated Hospital of Chongqing Medical University (protocol code 2022-K564 and date of approval was 5 January 2023).
Informed Consent Statement
Informed consent was obtained from all subjects involved in the study.
Data Availability Statement
The data presented in this study are available on request from the corresponding author. The data are not publicly available due to privacy or ethical considerations.
Acknowledgments
We would like to thank the teachers and students of Chongqing Normal University.
Conflicts of Interest
The authors declare no conflict of interest.
Abbreviations
| HGSOC | high grade serous ovarian cancer |
| MRI | magnetic resonance imaging |
| PFS | progression-free survival |
| T2WI | T2-weighted images |
| DWI | Diffusion weighted images |
| RD | residual tumor state; progesterone receptor |
| PACS | Picture Archiving and Communication System |
| CA-125 | cancer antigen 125 |
| HE4 | Human epididymis protein 4 |
References
- National Comprehensive Cancer Network (NCCN). NCCN Clinical Practice Guidelines in Oncology: Ovarian Cancer Including Fallopian Tube Cancer and Primary Peritoneal Cancer, Version 1.2021; National Comprehensive Cancer Network (NCCN): Plymouth Meeting, PA, USA, 2021. [Google Scholar]
- Richardson, D.L.; Sill, M.W.; Coleman, R.L.; Sood, A.K.; Pearl, M.L.; Kehoe, S.M.; Carney, M.E.; Hanjani, P.; Van Le, L.; Zhou, X.C.; et al. Paclitaxel with and without pazopanib for persistent or recurrent ovarian cancer: A randomized clinical trial. JAMA Oncol. 2018, 4, 196–202. [Google Scholar] [CrossRef] [PubMed]
- Siegel, R.L.; Miller, K.D.; Jemal, A. Cancer statistics, 2019. CA Cancer J. Clin. 2019, 69, 7–34. [Google Scholar] [CrossRef] [Green Version]
- Li, H.M.; Gong, J.; Li, R.M.; Xiao, Z.B.; Qiang, J.W.; Peng, W.J.; Gu, Y.J. Development of MRI-Based Radiomics Model to Predict the Risk of Recurrence in Patients with Advanced High-Grade Serous Ovarian Carcinoma. Am. J. Roentgenol. 2021, 217, 664–675. [Google Scholar] [CrossRef] [PubMed]
- Oza, A.M.; Cook, A.D.; Pfifisterer, J.; Embleton, A.; Ledermann, J.A.; Pujade-Lauraine, E.; Kristensen, G.; Carey, M.S.; Beale, P.; Cervantes, A.; et al. Standard chemotherapy with or without bevacizumab for women with newly diagnosed ovarian cancer (ICON7): Overall survival results of a phase 3 randomised trial. Lancet Oncol. 2015, 16, 928–936. [Google Scholar] [CrossRef]
- Rizzuto, I.; Stavraka, C.; Chatterjee, J.; Borley, J.; Hopkins, T.G.; Gabra, H.; Ghaem-Maghami, S.; Huson, L.; Blagden, S.P. Risk of ovarian cancer relapse score: A prognostic algorithm to predict relapse Following treatment for advanced ovarian cancer. Int. J. Gynecol. Cancer 2015, 25, 416–422. [Google Scholar] [CrossRef] [PubMed] [Green Version]
- Goode, E.L.; Block, M.S.; Kalli, K.R.; Vierkant, R.A.; Chen, W.; Fogarty, Z.C.; Gentry-Maharaj, A.; Tołoczko, A.; Hein, A.; Bouligny, A.L.; et al. Dose response association of CD8+ tumor-infifiltrating lymphocytes and survival time in high-grade serous ovarian cancer. JAMA Oncol. 2017, 3, e173290. [Google Scholar] [PubMed] [Green Version]
- Matulonis, U.A.; Shapira-Frommer, R.; Santin, A.D.; Lisyanskaya, A.S.; Pignata, S.; Vergote, I.; Raspagliesi, F.; Sonke, G.S.; Birrer, M.; Provencher, D.M.; et al. Antitumor activity and safety of pembrolizumab in patients with advanced recurrent ovarian cancer: Results from the phase II KEYNOTE-100 study. Ann. Oncol. 2019, 30, 1080–1087. [Google Scholar] [CrossRef] [PubMed]
- Huang, Y.Q.; Liang, C.H.; He, L.; Tian, J.; Liang, C.S.; Chen, X.; Ma, Z.L.; Liu, Z.Y. Development and Validation of a Radiomics Nomogram for Preoperative Prediction of Lymph Node Metastasis in Colorectal Cancer. J. Clin. Oncol. 2016, 34, 2157–2164. [Google Scholar] [CrossRef]
- Kirienko, M.; Cozzi, L.; Antunovic, L.; Lozza, L.; Fogliata, A.; Voulaz, E.; Rossi, A.; Chiti, A.; Sollini, M. Prediction of disease-free survival by the PET/CT radiomic signature in nonsmall cell lung cancer patients undergoing surgery. Eur. J. Nucl. Med. Mol. Imaging 2018, 45, 207–217. [Google Scholar] [CrossRef]
- Esteva, A.; Robicquet, A.; Ramsundar, B.; Kuleshov, V.; DePristo, M.; Chou, K.; Cui, C.; Corrado, G.; Thrun, S.; Dean, J. A guide to deep learning in healthcare. Nat. Med. 2019, 25, 24–29. [Google Scholar] [CrossRef]
- Kermany, D.S.; Goldbaum, M.; Cai, W.; Valentim, C.C.; Liang, H.; Baxter, S.L.; McKeown, A.; Yang, G.; Wu, X.; Yan, F.; et al. Identifying medical diagnoses and treatable diseases by image-based deep learning. Cell 2018, 172, 1122–1131. [Google Scholar] [CrossRef] [PubMed]
- Wang, S.; Zhou, M.; Liu, Z.; Liu, Z.; Gu, D.; Zang, Y.; Dong, D.; Gevaert, O.; Tian, J. Central focused convolutional neural networks: Developing a data-driven model for lung nodule segmentation. Med. Image Anal. 2017, 40, 172–183. [Google Scholar] [CrossRef] [PubMed]
- Elfifiky, A.A.; Pany, M.J.; Parikh, R.B.; Obermeyer, Z. Development and application of a machine learning approach to assess short-term mortality risk among patients with cancer starting chemotherapy. JAMA Netw. Open 2018, 1, e180926. [Google Scholar] [CrossRef] [Green Version]
- Avati, A.; Jung, K.; Harman, S.; Downing, L.; Ng, A.; Shah, N.H. Improving palliative care with deep learning. BMC Med. Inform. Decis. Mak. 2018, 18, 122. [Google Scholar] [CrossRef] [PubMed] [Green Version]
- Elfifiky, A.A.; Elshemey, W.M. Molecular dynamics simulation revealed binding of nucleotide inhibitors to ZIKV polymerase over 444 nanoseconds. J. Med. Virol. 2018, 90, 13–18. [Google Scholar] [CrossRef] [Green Version]
- Culliton, P.; Levinson, M.; Ehresman, A.; Wherry, J.; Steingrub, J.S.; Gallant, S.I. Predicting severe sepsis using text from the electronic health record. arXiv 2017, arXiv:1711.11536. [Google Scholar]
- Oh, J.; Makar, M.; Fusco, C.; McCaffffrey, R.; Rao, K.; Ryan, E.E.; Washer, L.; West, L.R.; Young, V.B.; Guttag, J. A generalizable, data-driven approach to predict daily risk of Clostridium diffiffifficile infection at two large academic health centers. Infect. Control Hosp. Epidemiol. 2018, 39, 425–433. [Google Scholar] [CrossRef] [Green Version]
- Yang, Z.; Huang, Y.; Jiang, Y.; Sun, Y.; Zhang, Y.-J.; Luo, P. Clinical assistant diagnosis for electronic medical record based on convolutional neural network. Sci. Rep. 2018, 8, 6329. [Google Scholar] [CrossRef]
- De Langavant, L.C.; Bayen, E.; Yaffffe, K. Unsupervised machine learning to identify high likelihood of dementia in population-based surveys: Development and validation study. J. Med. Internet Res. 2018, 20, e10493. [Google Scholar] [CrossRef]
- Chaudhary, K.; Poirion, O.B.; Lu, L.; Garmire, L.X. Deep Learning based multi-omics Integration robustly predicts survival in liver cancer. Clin. Cancer Res. 2018, 24, 1248–1259. [Google Scholar] [CrossRef] [Green Version]
- Morgan, R.J.; Armstrong, D.K.; Alvarez, R.D.; Bakkum-Gamez, J.N.; Behbakht, K.; Chen, L.M.; Copeland, L.; Crispens, M.A.; DeRosa, M.; Dorigo, O.; et al. Ovarian cancer, version 1.2016, NCCN clinical practice guidelines in oncology. J. Natl. Compr. Cancer Netw. 2016, 14, 1134–1163. [Google Scholar] [CrossRef] [PubMed]
- Kurta, M.L.; Edwards, R.P.; Moysich, K.B.; McDonough, K.; Bertolet, M.; Weissfeld, J.L.; Catov, J.M.; Modugno, F.; Bunker, C.H.; Ness, R.B.; et al. Prognosis and conditional disease-free survival among patients with ovarian cancer. J. Clin. Oncol. 2014, 32, 4102–4112. [Google Scholar] [CrossRef] [PubMed] [Green Version]
- He, K.; Zhang, X.Y.; Ren, S.; Jian, S. Deep residual learning for image recognition. In Proceedings of the IEEE Conference on Computer Vision and Pattern Recognition, Las Vegas, NV, USA, 27–30 June 2016; pp. 770–778. [Google Scholar]
- Lambin, P.; Leijenaar, R.T.; Deist, T.M.; Peerlings, J.; de Jong, E.E.C.; van Timmeren, J.; Sanduleanu, S.; Larue, R.T.H.M.; Even, A.J.G.; Jochems, A.; et al. Radiomics: The bridge between medical imaging and personalized medicine. Nat. Rev. Clin. Oncol. 2017, 14, 749–762. [Google Scholar] [CrossRef] [Green Version]
- Yu, X.Y.; Ren, J.; Jia, Y.; Wu, H.; Niu, G.; Liu, A.; Gao, Y.; Hao, F.; Xie, L. Multiparameter MRI Radiomics Model Predicts Preoperative Peritoneal Carcinomatosis in Ovarian Cancer. Front. Oncol. 2021, 11, 765652. [Google Scholar] [CrossRef] [PubMed]
- Oza, A.M.; Cibula, D.; Benzaquen, A.O.; Poole, C.; Mathijssen, R.H.; Sonke, G.S.; Colombo, N.; Špaček, J.; Vuylsteke, P.; Hirte, H.; et al. Olaparib combined with chemotherapy for recurrent platinum-sensitive ovarian cancer: A randomised phase 2 trial. Lancet Oncol. 2015, 16, 87–97. [Google Scholar] [CrossRef]
- González-Martín, A.; Pothuri, B.; Vergote, I.; DePont Christensen, R.; Graybill, W.; Mirza, M.R.; McCormick, C.; Lorusso, D.; Hoskins, P.; Freyer, G.; et al. PRIMA/ENGOT-OV26/GOG- 3012 Investigators. Niraparib in patients with newly diagnosed advanced ovarian cancer. N. Engl. J. Med. 2019, 381, 2391–2402. [Google Scholar] [PubMed] [Green Version]
- Ray-Coquard, I.; Pautier, P.; Pignata, S.; Pérol, D.; González-Martín, A.; Berger, R.; Fujiwara, K.; Vergote, I.; Colombo, N.; Mäenpää, J.; et al. PAOLA-1 Investigators. Olaparib plus bevacizumab as first-line maintenance in ovarian cancer. N. Engl. J. Med. 2019, 381, 2416–2428. [Google Scholar] [CrossRef]
- Liu, Z.; Li, Z.; Qu, J.; Zhang, R.; Zhou, X.; Li, L.; Sun, K.; Tang, Z.; Jiang, H.; Li, H.; et al. Radiomics of multiparametric MRI for pretreatment prediction of pathologic complete response to neoadjuvant chemotherapy in breast cancer: A multicenter study. Clin. Cancer Res. 2019, 25, 3538–3547. [Google Scholar] [CrossRef] [Green Version]
- Nie, K.; Shi, L.; Chen, Q.; Hu, X.; Jabbour, S.K.; Yue, N.; Niu, T.; Sun, X. Rectal cancer: Assessment of neoadjuvant chemoradiation outcome based on radiomics of multiparametric MRI. Clin. Cancer Res. 2016, 22, 5256–5264. [Google Scholar] [CrossRef] [Green Version]
- Tang, T.Y.; Li, X.; Zhang, Q.; Guo, C.X.; Zhang, X.Z.; Lao, M.Y.; Shen, Y.N.; Xiao, W.B.; Ying, S.H.; Sun, K.; et al. Development of a novel multiparametric MRI radiomic nomogram for preoperative evaluation of early recurrence in resectable pancreatic cancer. J. Magn. Reason. Imaging 2020, 52, 231–245. [Google Scholar] [CrossRef] [Green Version]
- Cui, Y.; Yang, X.; Shi, Z.; Yang, Z.; Du, X.; Zhao, Z.; Cheng, X. Radiomics analysis of multiparametric MRI for prediction of pathological complete response to neoadjuvant chemoradiotherapy in locally advanced rectal cancer. Eur. Radiol. 2019, 29, 1211–1220. [Google Scholar] [CrossRef] [PubMed]
- Vargas, H.A.; Huang, E.P.; Lakhman, Y.; Ippolito, J.E.; Bhosale, P.; Mellnick, V.; Shinagare, A.B.; Anello, M.; Kirby, J.; Fevrier-Sullivan, B.; et al. Radiogenomics of high-grade serous ovarian cancer: Multireader multi-institutional study from the cancer genome atlas ovarian cancer imaging research group. Radiology 2017, 285, 482–492. [Google Scholar] [CrossRef] [PubMed] [Green Version]
- Rizzo, S.; Botta, F.; Raimondi, S.; Origgi, D.; Buscarino, V.; Colarieti, A.; Tomao, F.; Aletti, G.; Zanagnolo, V.; Del Grande, M.; et al. Radiomics of high-grade serous ovarian cancer: Association between quantitative CT features, residual tumour and disease progression within 12 months. Eur. Radiol. 2018, 28, 4849–4859. [Google Scholar] [CrossRef] [PubMed]
- Wang, S.; Liu, Z.; Rong, Y.; Zhou, B.; Bai, Y.; Wei, W.; Wang, M.; Guo, Y.; Tian, J. Deep learning provides a new computed tomography-based prognostic biomarker for recurrence prediction in high-grade serous ovarian cancer. Radiother. Oncol. 2019, 132, 171–177. [Google Scholar] [CrossRef] [PubMed] [Green Version]
| Disclaimer/Publisher’s Note: The statements, opinions and data contained in all publications are solely those of the individual author(s) and contributor(s) and not of MDPI and/or the editor(s). MDPI and/or the editor(s) disclaim responsibility for any injury to people or property resulting from any ideas, methods, instructions or products referred to in the content. |
© 2023 by the authors. Licensee MDPI, Basel, Switzerland. This article is an open access article distributed under the terms and conditions of the Creative Commons Attribution (CC BY) license (https://creativecommons.org/licenses/by/4.0/).


