
Adaptive IoU Thresholding for Improving Small Object Detection: A Proof-of-Concept Study of Hand Erosions Classification of Patients with Rheumatic Arthritis on X-ray Images
 , , , , ,
Abstract
:1. Introduction
2. Materials and Methods
2.1. Study Design
2.2. Image Acquisition
2.3. Data Normalization
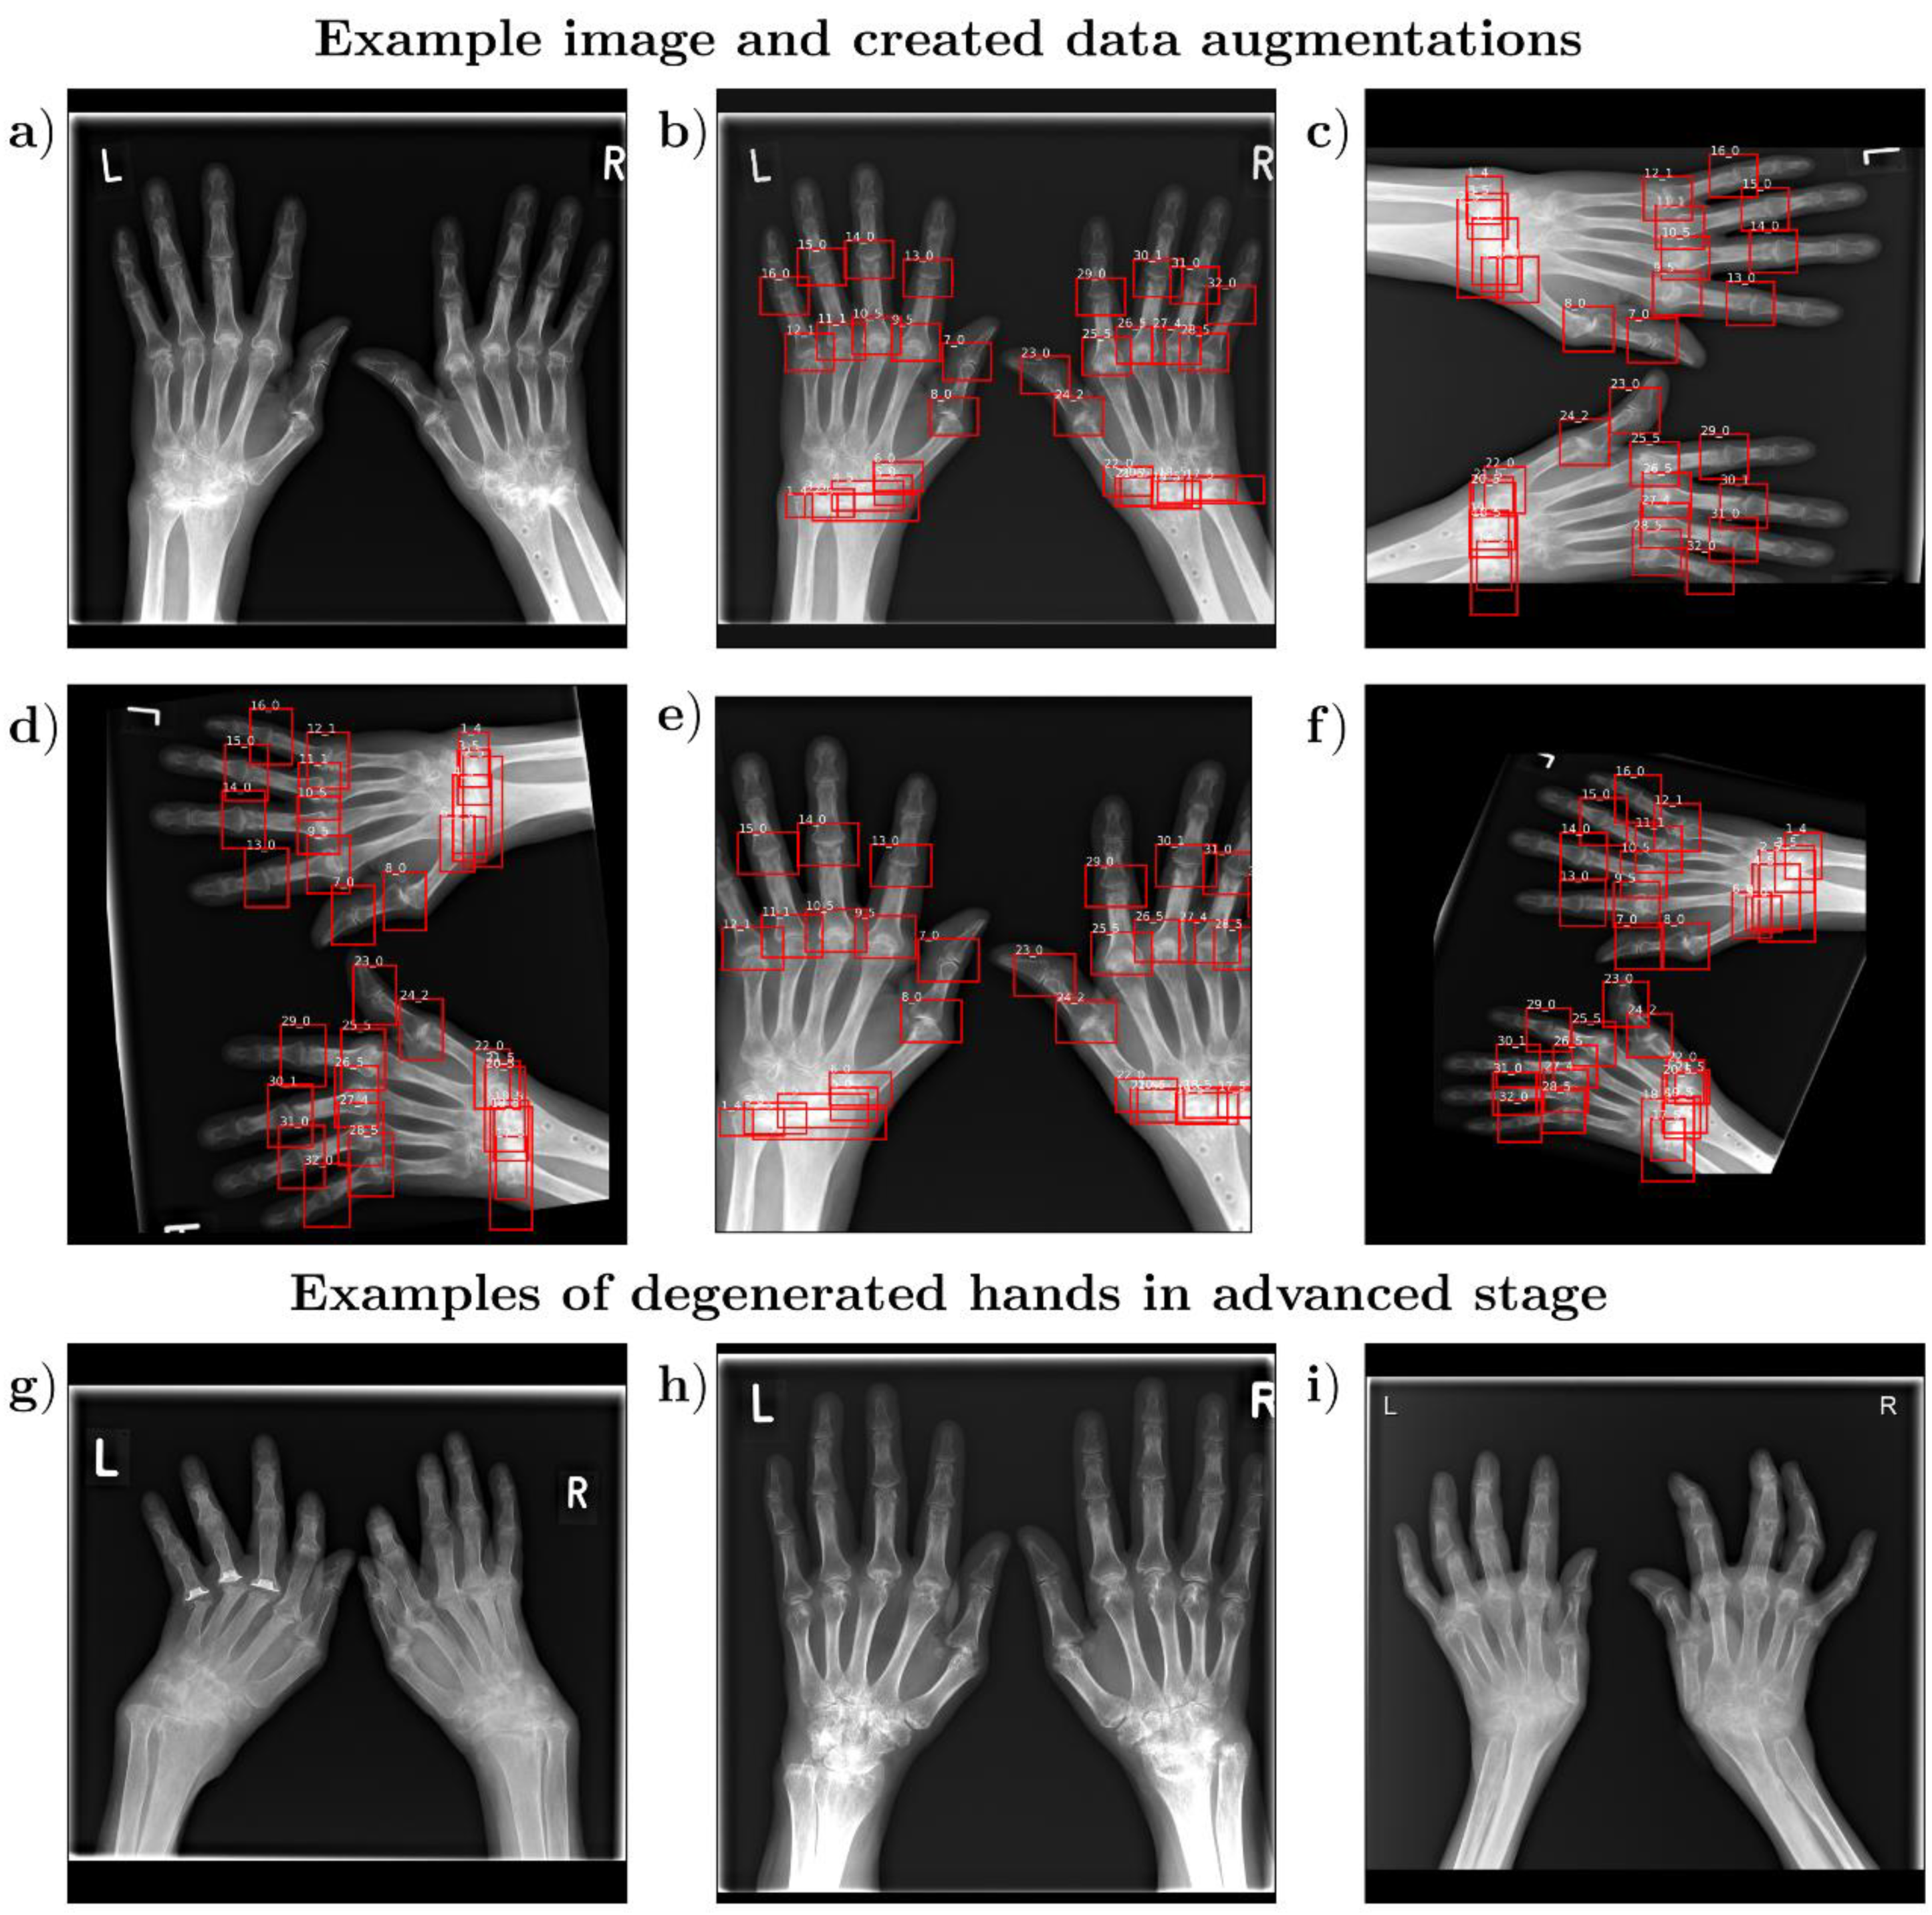
2.4. Data Augmentation
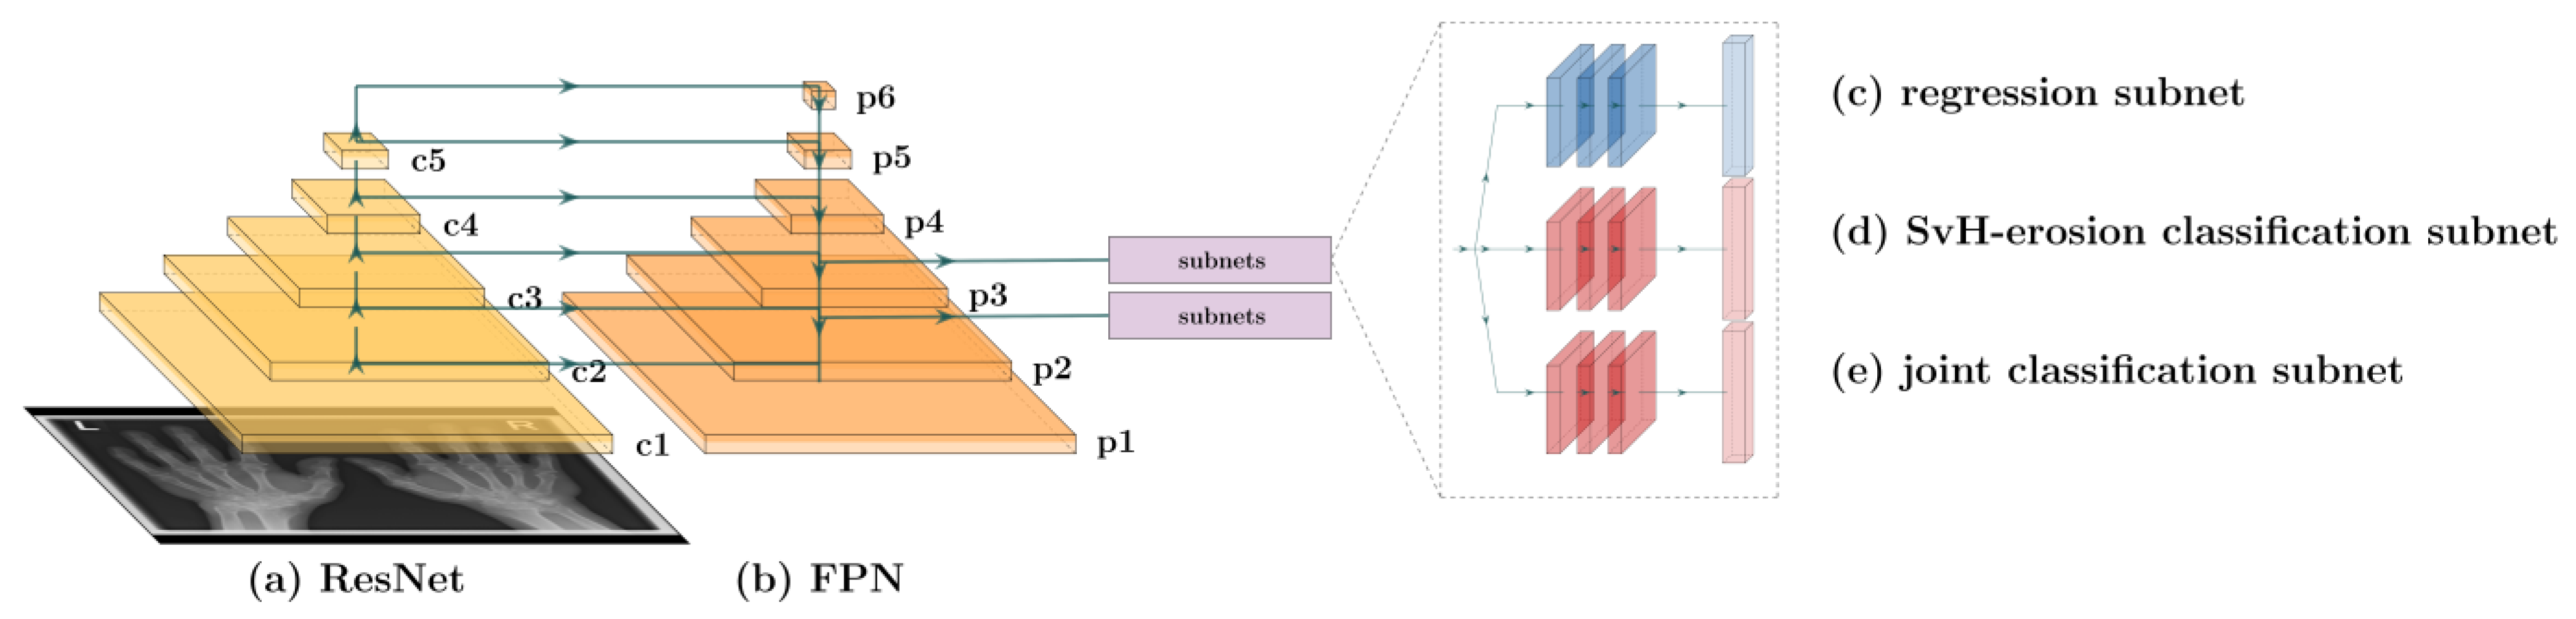
2.5. Network Architecture
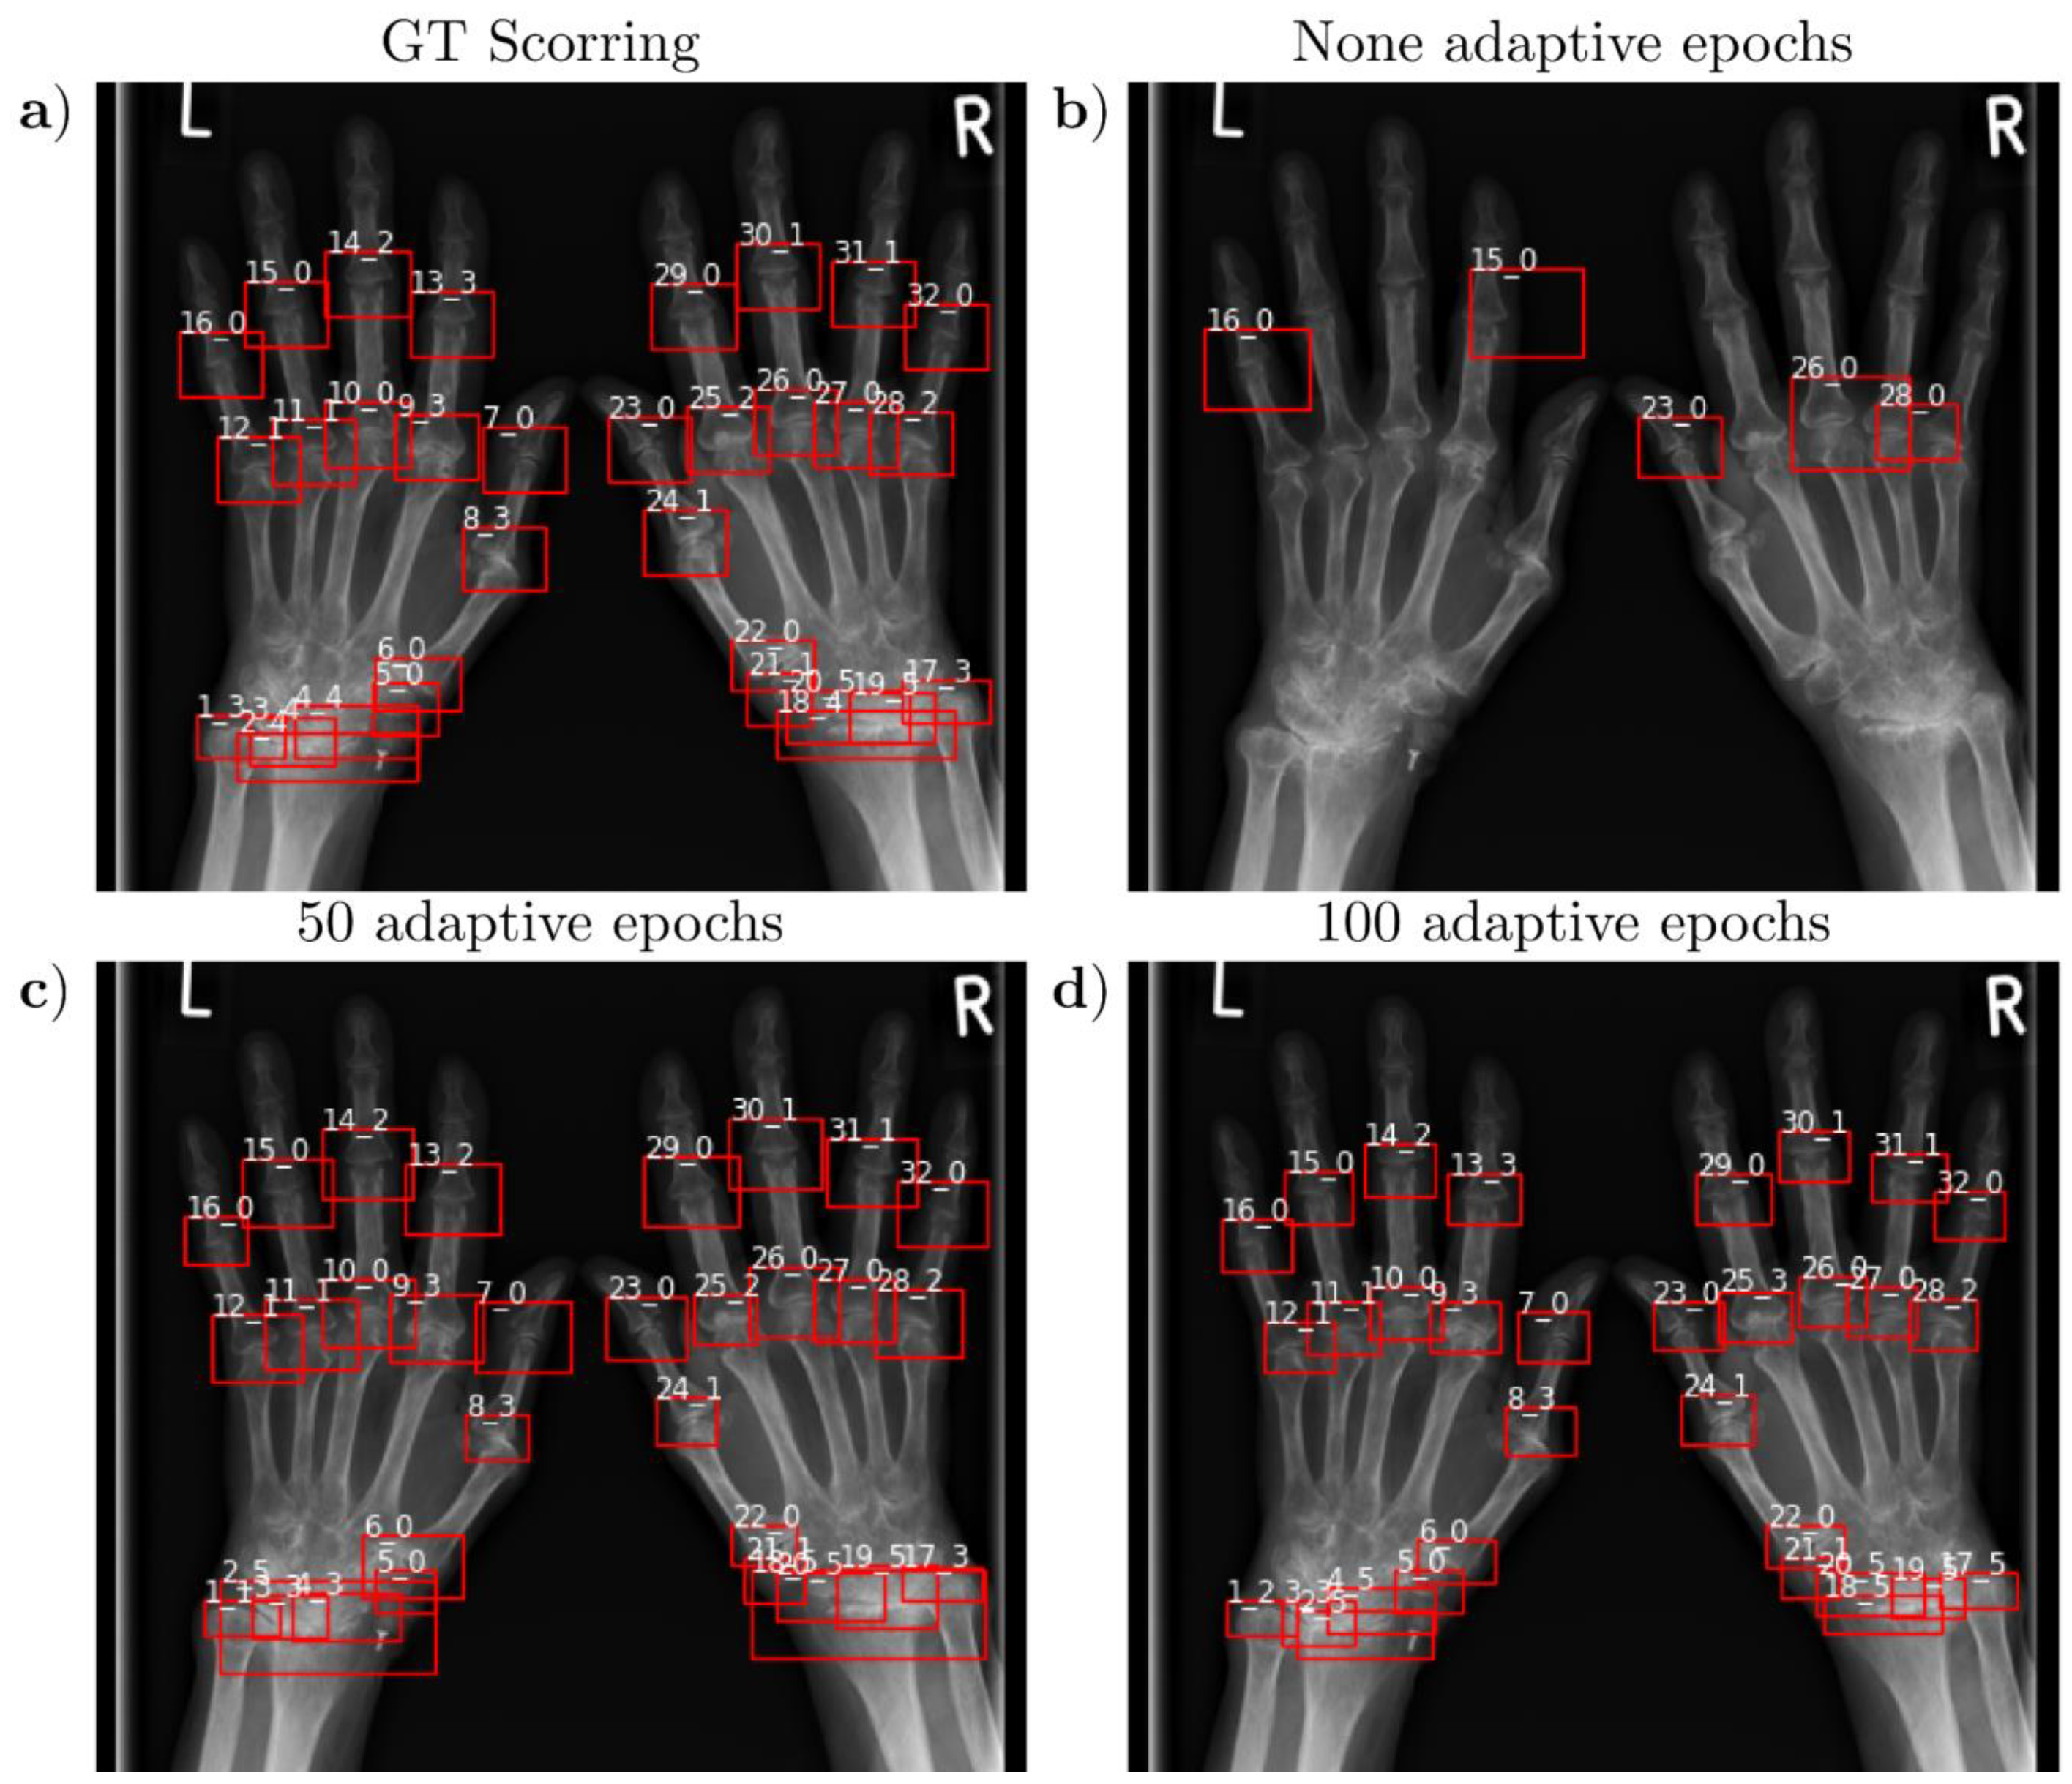
2.6. Adaptive IoU Threshold Fitting and Experimental Parameters
2.7. Evaluation Metrics
2.8. Statistical Analyses
3. Results
3.1. Patient Characteristics
3.2. Detection Accuracy and Localization Accuracy
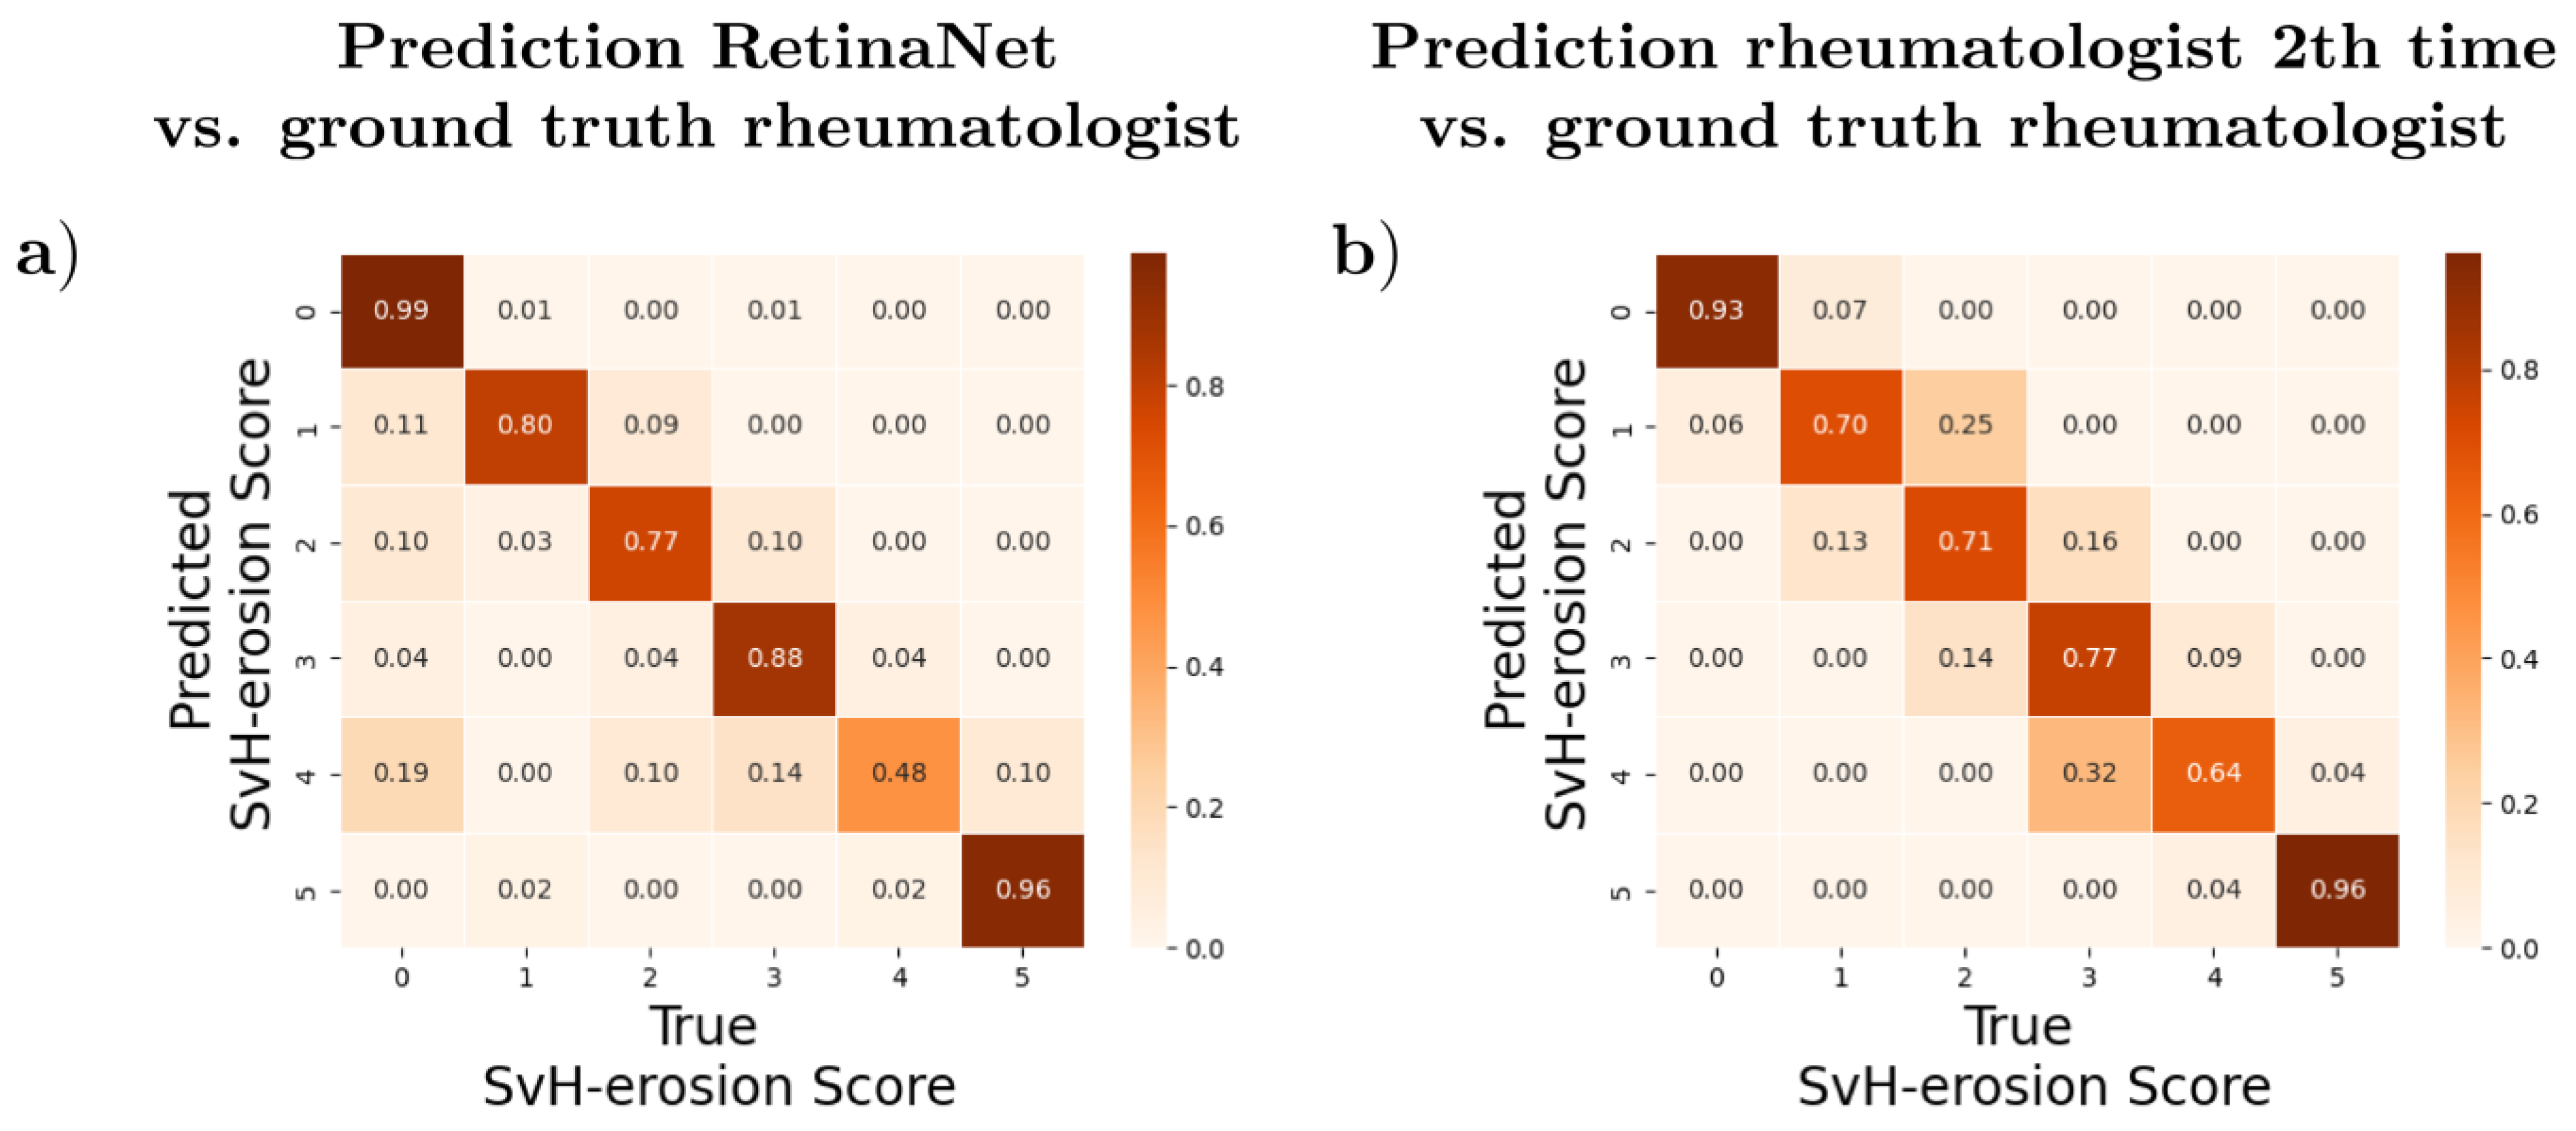
3.3. Agreement and Differences between Automatic and Manual Evaluation
3.4. Time Required
4. Discussion
5. Conclusions
Author Contributions
Funding
Institutional Review Board Statement
Informed Consent Statement
Data Availability Statement
Conflicts of Interest
Abbreviations and Acronyms
| SvH | Sharp van der Heijde |
| CEST | Chemical Exchange Saturation Transfer |
| dGEMRIC | delayed gadolinium-enhanced MRI of cartilage |
| DL | Deep Learning |
| RetinaNet | Retina networks |
| IoU | Intersection over Union |
| GT | ground truth |
| CR | conventional radiographs |
| PACS | Picture Archiving and Communication System |
| DICOM | Digital Imaging and Communications in Medicine |
| mAP | mean average accuracy |
| ReLU | Rectified Linear Unit |
| ResNet | residual neural network |
| FPN | feature pyramid network |
| FNN | feedforward neural networks |
| YOLO | You only look once |
| SSD | single-shot detector |
References
- Wilson, R.L. Rheumatoid Arthritis of the Hand. Orthop. Clin. N. Am. 1986, 17, 313–343. [Google Scholar] [CrossRef]
- Frenken, M.; Rübsam, G.; Mewes, A.; Radke, K.L.; Li, L.; Wilms, L.M.; Nebelung, S.; Abrar, D.B.; Sewerin, P. To Contrast or Not to Contrast? On the Role of Contrast Enhancement in Hand MRI Studies of Patients with Rheumatoid Arthritis. Diagnostics 2022, 12, 465. [Google Scholar] [CrossRef] [PubMed]
- van der Helm-van Mil, A.H.M.; Detert, J.; Le Cessie, S.; Filer, A.; Bastian, H.; Burmester, G.R.; Huizinga, T.W.J.; Raza, K. Validation of a prediction rule for disease outcome in patients with recent-onset undifferentiated arthritis: Moving toward individualized treatment decision-making. Arthritis Rheum. 2008, 58, 2241–2247. [Google Scholar] [CrossRef] [PubMed] [Green Version]
- Lindegaard, H.M.; Vallø, J.; Hørslev-Petersen, K.; Junker, P.; Østergaard, M. Low-cost, low-field dedicated extremity magnetic resonance imaging in early rheumatoid arthritis: A 1-year follow-up study. Ann. Rheum. Dis. 2006, 65, 1208–1212. [Google Scholar] [CrossRef] [PubMed]
- Abrar, D.B.; Schleich, C.; Radke, K.L.; Frenken, M.; Stabinska, J.; Ljimani, A.; Wittsack, H.-J.; Antoch, G.; Bittersohl, B.; Hesper, T.; et al. Detection of early cartilage degeneration in the tibiotalar joint using 3 T gagCEST imaging: A feasibility study. Magma 2021, 34, 249–260. [Google Scholar] [CrossRef] [PubMed]
- Radke, K.L.; Wilms, L.M.; Frenken, M.; Stabinska, J.; Knet, M.; Kamp, B.; Thiel, T.A.; Filler, T.J.; Nebelung, S.; Antoch, G.; et al. Lorentzian-Corrected Apparent Exchange-Dependent Relaxation (LAREX) Ω-Plot Analysis—An Adaptation for qCEST in a Multi-Pool System: Comprehensive In Silico, In Situ, and In Vivo Studies. Int. J. Mol. Sci. 2022, 23, 6920. [Google Scholar] [CrossRef] [PubMed]
- Radke, K.L.; Abrar, D.B.; Frenken, M.; Wilms, L.M.; Kamp, B.; Boschheidgen, M.; Liebig, P.; Ljimani, A.; Filler, T.J.; Antoch, G.; et al. Chemical Exchange Saturation Transfer for Lactate-Weighted Imaging at 3 T MRI: Comprehensive In Silico, In Vitro, In Situ, and In Vivo Evaluations. Tomography 2022, 8, 1277–1292. [Google Scholar] [CrossRef] [PubMed]
- Abrar, D.B.; Schleich, C.; Müller-Lutz, A.; Frenken, M.; Radke, K.L.; Vordenbäumen, S.; Schneider, M.; Ostendorf, B.; Sewerin, P. Cartilage Degradation in Psoriatic Arthritis Is Associated With Increased Synovial Perfusion as Detected by Magnetic Resonance Imaging. Front. Med. 2020, 7, 539870. [Google Scholar] [CrossRef]
- Truhn, D.; Zwingenberger, K.T.; Schock, J.; Abrar, D.B.; Radke, K.L.; Post, M.; Linka, K.; Knobe, M.; Kuhl, C.; Nebelung, S. No pressure, no diamonds?—Static vs. dynamic compressive in-situ loading to evaluate human articular cartilage functionality by functional MRI. J. Mech. Behav. Biomed. Mater. 2021, 120, 104558. [Google Scholar] [CrossRef]
- Radke, K.L.; Wollschläger, L.M.; Nebelung, S.; Abrar, D.B.; Schleich, C.; Boschheidgen, M.; Frenken, M.; Schock, J.; Klee, D.; Frahm, J.; et al. Deep Learning-Based Post-Processing of Real-Time MRI to Assess and Quantify Dynamic Wrist Movement in Health and Disease. Diagnostics 2021, 11, 1077. [Google Scholar] [CrossRef]
- Schock, J.; Truhn, D.; Nürnberger, D.; Conrad, S.; Huppertz, M.S.; Keil, S.; Kuhl, C.; Merhof, D.; Nebelung, S. Artificial intelligence-based automatic assessment of lower limb torsion on MRI. Sci. Rep. 2021, 11, 23244. [Google Scholar] [CrossRef] [PubMed]
- Zeng, G.; Guo, Y.; Zhan, J.; Wang, Z.; Lai, Z.; Du, X.; Qu, X.; Guo, D. A review on deep learning MRI reconstruction without fully sampled k-space. BMC Med. Imaging 2021, 21, 195. [Google Scholar] [CrossRef] [PubMed]
- Wang, H.-J.; Su, C.-P.; Lai, C.-C.; Chen, W.-R.; Chen, C.; Ho, L.-Y.; Chu, W.-C.; Lien, C.-Y. Deep Learning-Based Computer-Aided Diagnosis of Rheumatoid Arthritis with Hand X-ray Images Conforming to Modified Total Sharp/van der Heijde Score. Biomedicines 2022, 10, 1355. [Google Scholar] [CrossRef] [PubMed]
- Gayathri, J.L.; Abraham, B.; Sujarani, M.S.; Nair, M.S. A computer-aided diagnosis system for the classification of COVID-19 and non-COVID-19 pneumonia on chest X-ray images by integrating CNN with sparse autoencoder and feed forward neural network. Comput. Biol. Med. 2022, 141, 105134. [Google Scholar]
- Bai, L.; Zhang, Y.; Wang, P.; Zhu, X.; Xiong, J.-W.; Cui, L. Improved diagnosis of rheumatoid arthritis using an artificial neural network. Sci. Rep. 2022, 12, 9810. [Google Scholar] [CrossRef]
- Hirano, T.; Nishide, M.; Nonaka, N.; Seita, J.; Ebina, K.; Sakurada, K.; Kumanogoh, A. Development and validation of a deep-learning model for scoring of radiographic finger joint destruction in rheumatoid arthritis. Rheumatol. Adv. Pract. 2019, 3, rkz047. [Google Scholar] [CrossRef]
- Del Prete, R.; Graziano, M.D.; Renga, A. RetinaNet: A deep learning architecture to achieve a robust wake detector in SAR images. In Proceedings of the 2021 IEEE 6th International Forum on Research and Technology for Society and Industry (RTSI), Naples, Italy, 6–9 September 2021; pp. 171–176. [Google Scholar]
- Tan, L.; Huangfu, T.; Wu, L.; Chen, W. Comparison of RetinaNet, SSD, and YOLO v3 for real-time pill identification. BMC Med. Inform. Decis. Mak. 2021, 21, 324. [Google Scholar] [CrossRef]
- Nobis, F.; Geisslinger, M.; Weber, M.; Betz, J.; Lienkamp, M. A Deep Learning-based Radar and Camera Sensor Fusion Architecture for Object Detection. arXiv 2020. [Google Scholar] [CrossRef]
- Zlocha, M.; Dou, Q.; Glocker, B. Improving RetinaNet for CT Lesion Detection with Dense Masks from Weak RECIST Labels. In Medical Image Computing and Computer Assisted Intervention-MICCAI 2019, 1st ed.; Shen, D., Birukou, Eds.; Springer International Publishing: Berlin/Heidelberg, Germany, 2019; pp. 402–410. [Google Scholar]
- Choi, H.-T.; Lee, H.-J.; Kang, H.; Yu, S.; Park, H.-H. SSD-EMB: An Improved SSD Using Enhanced Feature Map Block for Object Detection. Sensors 2021, 21, 2842. [Google Scholar] [CrossRef]
- Yan, J.; Wang, H.; Yan, M.; Diao, W.; Sun, X.; Li, H. IoU-Adaptive Deformable R-CNN: Make Full Use of IoU for Multi-Class Object Detection in Remote Sensing Imagery. Remote Sens. 2019, 11, 286. [Google Scholar] [CrossRef] [Green Version]
- van der Heijde, D.; Dankert, T.; Nieman, F.; Rau, R.; Boers, M. Reliability and sensitivity to change of a simplification of the Sharp/van der Heijde radiological assessment in rheumatoid arthritis. Rheumatology 1999, 38, 941–947. [Google Scholar] [CrossRef] [PubMed]
- van der Heijde, D. How to read radiographs according to the Sharp/van der Heijde method. J. Rheumatol. 2000, 27, 261–263. [Google Scholar]
- Khan, Z.; Yahya, N.; Alsaih, K.; Ali, S.S.A.; Meriaudeau, F. Evaluation of Deep Neural Networks for Semantic Segmentation of Prostate in T2W MRI. Sensors 2020, 20, 3183. [Google Scholar] [CrossRef] [PubMed]
- Drałus, G.; Mazur, D.; Czmil, A. Automatic Detection and Counting of Blood Cells in Smear Images Using RetinaNet. Entropy 2021, 23, 1522. [Google Scholar] [CrossRef] [PubMed]
- Santos, A.; Marcato Junior, J.; de Andrade Silva, J.; Pereira, R.; Matos, D.; Menezes, G.; Higa, L.; Eltner, A.; Ramos, A.P.; Osco, L.; et al. Storm-Drain and Manhole Detection Using the RetinaNet Method. Sensors 2020, 20, 4450. [Google Scholar] [CrossRef]
- Xie, J.; Stensrud, E.; Skramstad, T. Detection-Based Object Tracking Applied to Remote Ship Inspection. Sensors 2021, 21, 761. [Google Scholar] [CrossRef]
- Kingma, D.P.; Ba, J. Adam: A Method for Stochastic Optimization. In Proceedings of the 3rd International Conference for Learning Representations, San Diego, CA, USA, 7–9 May 2014. [Google Scholar]
- Lin, T.-Y.; Goyal, P.; Girshick, R.; He, K.; Dollár, P. Focal Loss for Dense Object Detection. arXiv 2017. [Google Scholar] [CrossRef]
- Tan, O.; Liu, L.; You, Q.; Wang, J.; Chen, A.; Ing, E.; Morrison, J.C.; Jia, Y.; Huang, D. Focal Loss Analysis of Nerve Fiber Layer Reflectance for Glaucoma Diagnosis. Transl. Vis. Sci. Technol. 2021, 10, 9. [Google Scholar] [CrossRef]
- Cohen, J. Statistical Power Analysis for the Behavioral Sciences, 2nd ed.; Lawrence Erlbaum Associates: Hillsdale, NJ, USA, 1988. [Google Scholar]
- Armstrong, R.A. When to use the Bonferroni correction. Ophthalmic Physiol. Opt. J. Br. Coll. Ophthalmic Opt. 2014, 34, 502–508. [Google Scholar] [CrossRef]
- Jones, R.M.; Sharma, A.; Hotchkiss, R.; Sperling, J.W.; Hamburger, J.; Ledig, C.; O’Toole, R.; Gardner, M.; Venkatesh, S.; Roberts, M.M.; et al. Assessment of a deep-learning system for fracture detection in musculoskeletal radiographs. NPJ Digit. Med. 2020, 3, 144. [Google Scholar] [CrossRef]
- Kundu, R.; Das, R.; Geem, Z.W.; Han, G.-T.; Sarkar, R. Pneumonia detection in chest X-ray images using an ensemble of deep learning models. PLoS ONE 2021, 16, e0256630. [Google Scholar] [CrossRef] [PubMed]
- Xue, Y.; Zhang, R.; Deng, Y.; Chen, K.; Jiang, T. A preliminary examination of the diagnostic value of deep learning in hip osteoarthritis. PLoS ONE 2017, 12, e0178992. [Google Scholar] [CrossRef] [PubMed]
- Liu, F.; Zhou, Z.; Samsonov, A.; Blankenbaker, D.; Larison, W.; Kanarek, A.; Lian, K.; Kambhampati, S.; Kijowski, R. Deep Learning Approach for Evaluating Knee MR Images: Achieving High Diagnostic Performance for Cartilage Lesion Detection. Radiology 2018, 289, 160–169. [Google Scholar] [CrossRef] [Green Version]
- Spampinato, C.; Palazzo, S.; Giordano, D.; Aldinucci, M.; Leonardi, R. Deep learning for automated skeletal bone age assessment in X-ray images. Med. Image Anal. 2017, 36, 41–51. [Google Scholar] [CrossRef] [PubMed]
- Rohrbach, J.; Reinhard, T.; Sick, B.; Dürr, O. Bone erosion scoring for rheumatoid arthritis with deep convolutional neural networks. Comput. Electr. Eng. 2019, 78, 472–481. [Google Scholar] [CrossRef]
- Fan, J.; Huo, T.; Li, X. A Review of One-Stage Detection Algorithms in Autonomous Driving. In Proceedings of the 2020 4th CAA International Conference on Vehicular Control and Intelligence (CVCI), Hangzhou, China, 18–20 December 2020; pp. 210–214. [Google Scholar]


| Parameters | Overall | Training | Validation | Test |
|---|---|---|---|---|
| Age [a] | 55.6 ± 12.2 (23–87) | 55 ± 13 (23–87) | 56 ± 7 (29–82) | 57 ± 12 (27–87) |
| Number patients | 119 | 83 | 12 | 24 |
| Number images | 300 | 231 | 45 | 24 |
| male/female | 41/78 | 29/54 | 4/8 | 6/18 |
| Sum of erosion score | 52 ± 22 | 53 ± 25 (32–179) | 46 ± 8 (32–101) | 55 ± 30 (32–179) |
| Mean erosion score | 1.52 ± 0.70 (1.0–5.59) | 1.65 ± 0.77 (1.0–5.59) | 1.43 ± 0.25 (1.0–4.3) | 1.72 ± 0.95 (1–5.59) |
| Min erosion score | 0.0 ± 0.0 (0–0) | 0.0 ± 0.0 (0–0) | 0.0 ± 0.0 (0–0) | 0.0 ± 0.0 (0–0) |
| Max erosion score | 4.1 ± 1.92 (1–6) | 4.2 ± 1.87 (1–6) | 3.2 ± 1.7 (1–6) | 4.6 ± 1.6 (1–6) |
| RetinaNet Number | IoU Positive Threshold | IoU Negative Threshold | Adaptive Epochs |
|---|---|---|---|
| 1–3 | 0.5 | 0.4 | None, 50, 100 |
| 3–6 | 0.4 | 0.3 | None, 50, 100 |
| 7–9 | 0.3 | 0.2 | None, 50, 100 |
| 10–12 | 0.5 | 0.3 | None, 50, 100 |
| 13–15 | 0.4 | 0.2 | None, 50, 100 |
| 16–18 | 0.5 | 0.2 | None, 50, 100 |
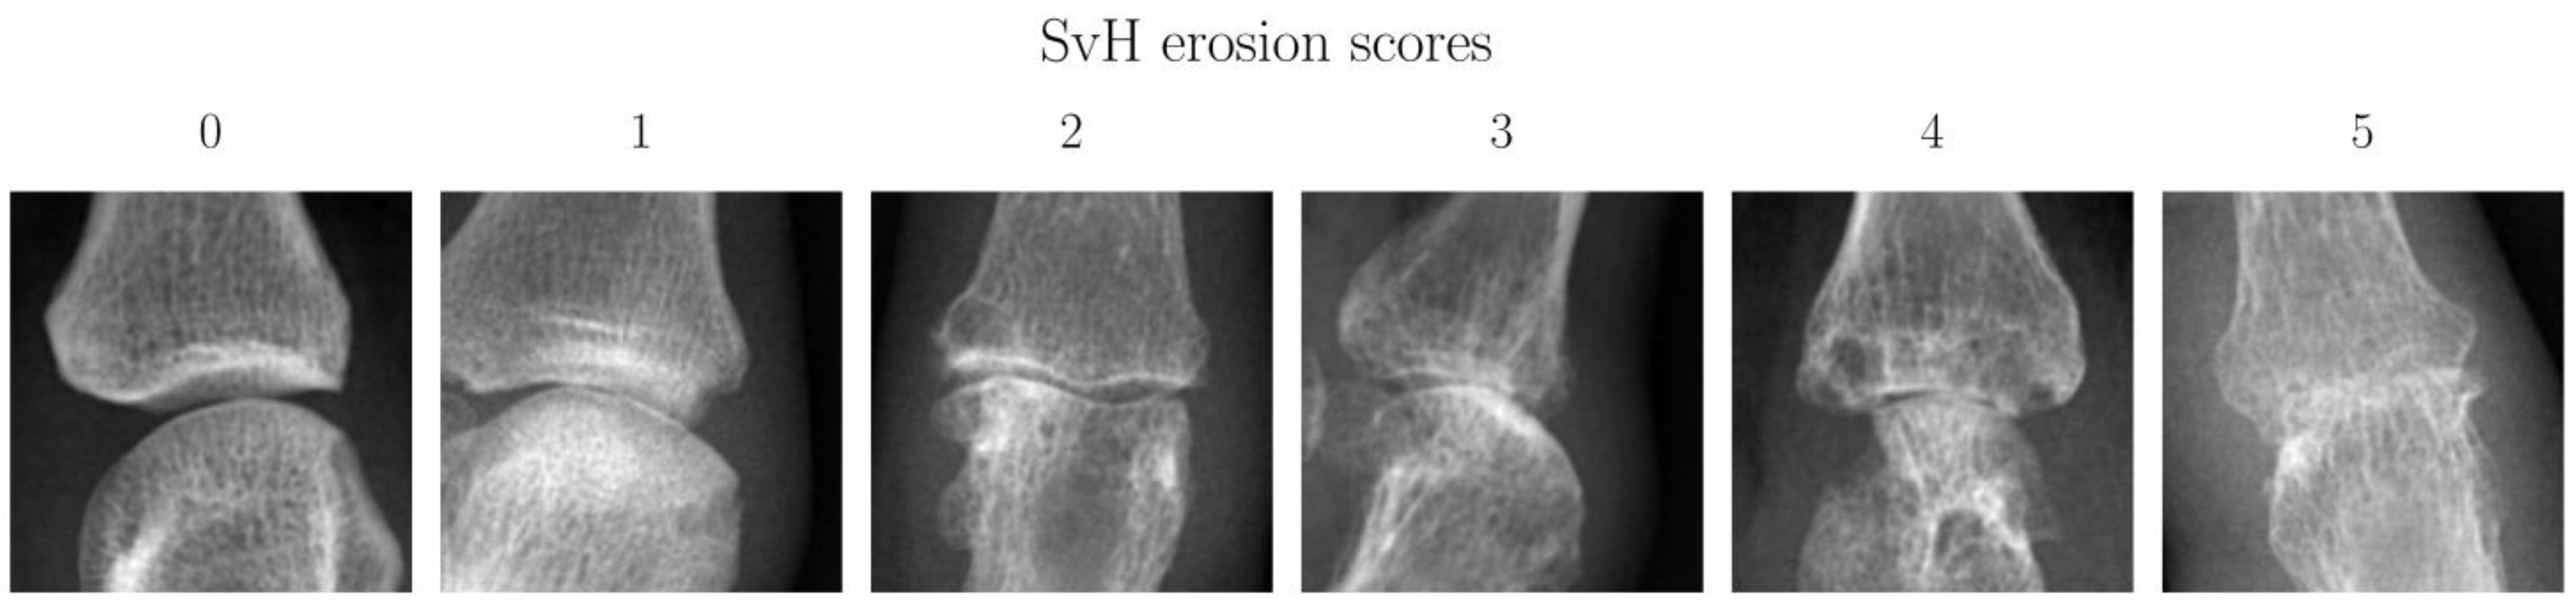
| SvH Erosion Score | Description | Number of Joints | Proportion |
|---|---|---|---|
| 0 | Normal joint | 578 | 75.26% |
| 1 | discrete erosion | 53 | 6.90% |
| 2 | Large erosion not passing midline * | 35 | 4.56% |
| 3 | Large erosion passing midline * | 27 | 3.52% |
| 4 | Sum of combined scores equals four | 24 | 3.13% |
| 5 | Sum of combined scores equal to or larger than five | 51 | 6.64% |
| Pos/Neg IoU Threshold | None | 50 Adaptive Epochs | 100 Adaptive Epochs | |||
|---|---|---|---|---|---|---|
| Accuracy | mAP | Accuracy | mAP | Accuracy | mAP | |
| 0.5/0.4 | 0.00 ± 0.00 | 0.00 ± 0.00 | 0.79 ± 0.11 | 0.45 ± 0.26 | 0.77 ± 0.15 | 0.40 ± 0.23 |
| 0.4/0.3 | 0.15 ± 0.07 | 0.25 ± 0.19 | 0.94 ± 0.05 | 0.81 ± 0.18 | 0.57 ± 0.18 | 0.27 ± 0.19 |
| 0.3/0.2 | 0.80 ± 0.14 | 0.43 ± 0.24 | 0.92 ± 0.06 | 0.67 ± 0.23 | 0.90 ± 0.08 | 0.65 ± 0.23 |
| 0.5/0.3 | 0.00 ± 0.00 | 0.00 ± 0.00 | 0.65 ± 0.20 | 0.28 ± 0.19 | 0.94 ± 0.06 | 0.79 ± 0.22 |
| 0.4/0.2 | 0.07 ± 0.45 | 0.21 ± 0.14 | 0.56 ± 0.17 | 0.27 ± 0.17 | 0.65 ± 0.17 | 0.26 ± 0.18 |
| 0.5/0.2 | 0.20 ± 0.08 | 0.27 ± 0.19 | 0.42 ± 0.13 | 0.27 ± 0.19 | 0.79 ± 0.15 | 0.34 ± 0.22 |
| Pos/Neg IoU Threshold | None | Adaptive Epochs | |
|---|---|---|---|
| 50 | 100 | ||
| 0.5/0.4 | 0.00 ± 0.00 | 0.59 ± 0.19 | 0.6 ± 0.14 |
| 0.4/0.3 | 0.11 ± 0.24 | 0.72 ± 0.14 | 0.45 ± 0.28 |
| 0.3/0.2 | 0.63 ± 0.12 | 0.68 ± 0.12 | 0.68 ± 0.16 |
| 0.5/0.3 | 0.00 ± 0.00 | 0.48 ± 0.25 | 0.65 ± 0.07 |
| 0.4/0.2 | 0.05 ± 0.16 | 0.44 ± 0.27 | 0.47 ± 0.21 |
| 0.5/0.2 | 0.20 ± 0.09 | 0.33 ± 0.30 | 0.59 ± 0.15 |
Disclaimer/Publisher’s Note: The statements, opinions and data contained in all publications are solely those of the individual author(s) and contributor(s) and not of MDPI and/or the editor(s). MDPI and/or the editor(s) disclaim responsibility for any injury to people or property resulting from any ideas, methods, instructions or products referred to in the content. |
© 2022 by the authors. Licensee MDPI, Basel, Switzerland. This article is an open access article distributed under the terms and conditions of the Creative Commons Attribution (CC BY) license (https://creativecommons.org/licenses/by/4.0/).
Share and Cite
Radke, K.L.; Kors, M.; Müller-Lutz, A.; Frenken, M.; Wilms, L.M.; Baraliakos, X.; Wittsack, H.-J.; Distler, J.H.W.; Abrar, D.B.; Antoch, G.; et al. Adaptive IoU Thresholding for Improving Small Object Detection: A Proof-of-Concept Study of Hand Erosions Classification of Patients with Rheumatic Arthritis on X-ray Images. Diagnostics 2023, 13, 104. https://doi.org/10.3390/diagnostics13010104
Radke KL, Kors M, Müller-Lutz A, Frenken M, Wilms LM, Baraliakos X, Wittsack H-J, Distler JHW, Abrar DB, Antoch G, et al. Adaptive IoU Thresholding for Improving Small Object Detection: A Proof-of-Concept Study of Hand Erosions Classification of Patients with Rheumatic Arthritis on X-ray Images. Diagnostics. 2023; 13(1):104. https://doi.org/10.3390/diagnostics13010104
Chicago/Turabian StyleRadke, Karl Ludger, Matthias Kors, Anja Müller-Lutz, Miriam Frenken, Lena Marie Wilms, Xenofon Baraliakos, Hans-Jörg Wittsack, Jörg H. W. Distler, Daniel B. Abrar, Gerald Antoch, and et al. 2023. "Adaptive IoU Thresholding for Improving Small Object Detection: A Proof-of-Concept Study of Hand Erosions Classification of Patients with Rheumatic Arthritis on X-ray Images" Diagnostics 13, no. 1: 104. https://doi.org/10.3390/diagnostics13010104