
Diagnostic Accuracy of Ultrasonographic Respiratory Variation in the Inferior Vena Cava, Subclavian Vein, Internal Jugular Vein, and Femoral Vein Diameter to Predict Fluid Responsiveness: A Systematic Review and Meta-Analysis


Abstract
:1. Introduction
2. Materials and Methods
2.1. Published Study Search and Selection Criteria
2.2. Data Extraction
2.3. Quality Assessment
2.4. Statistical Analysis
3. Results
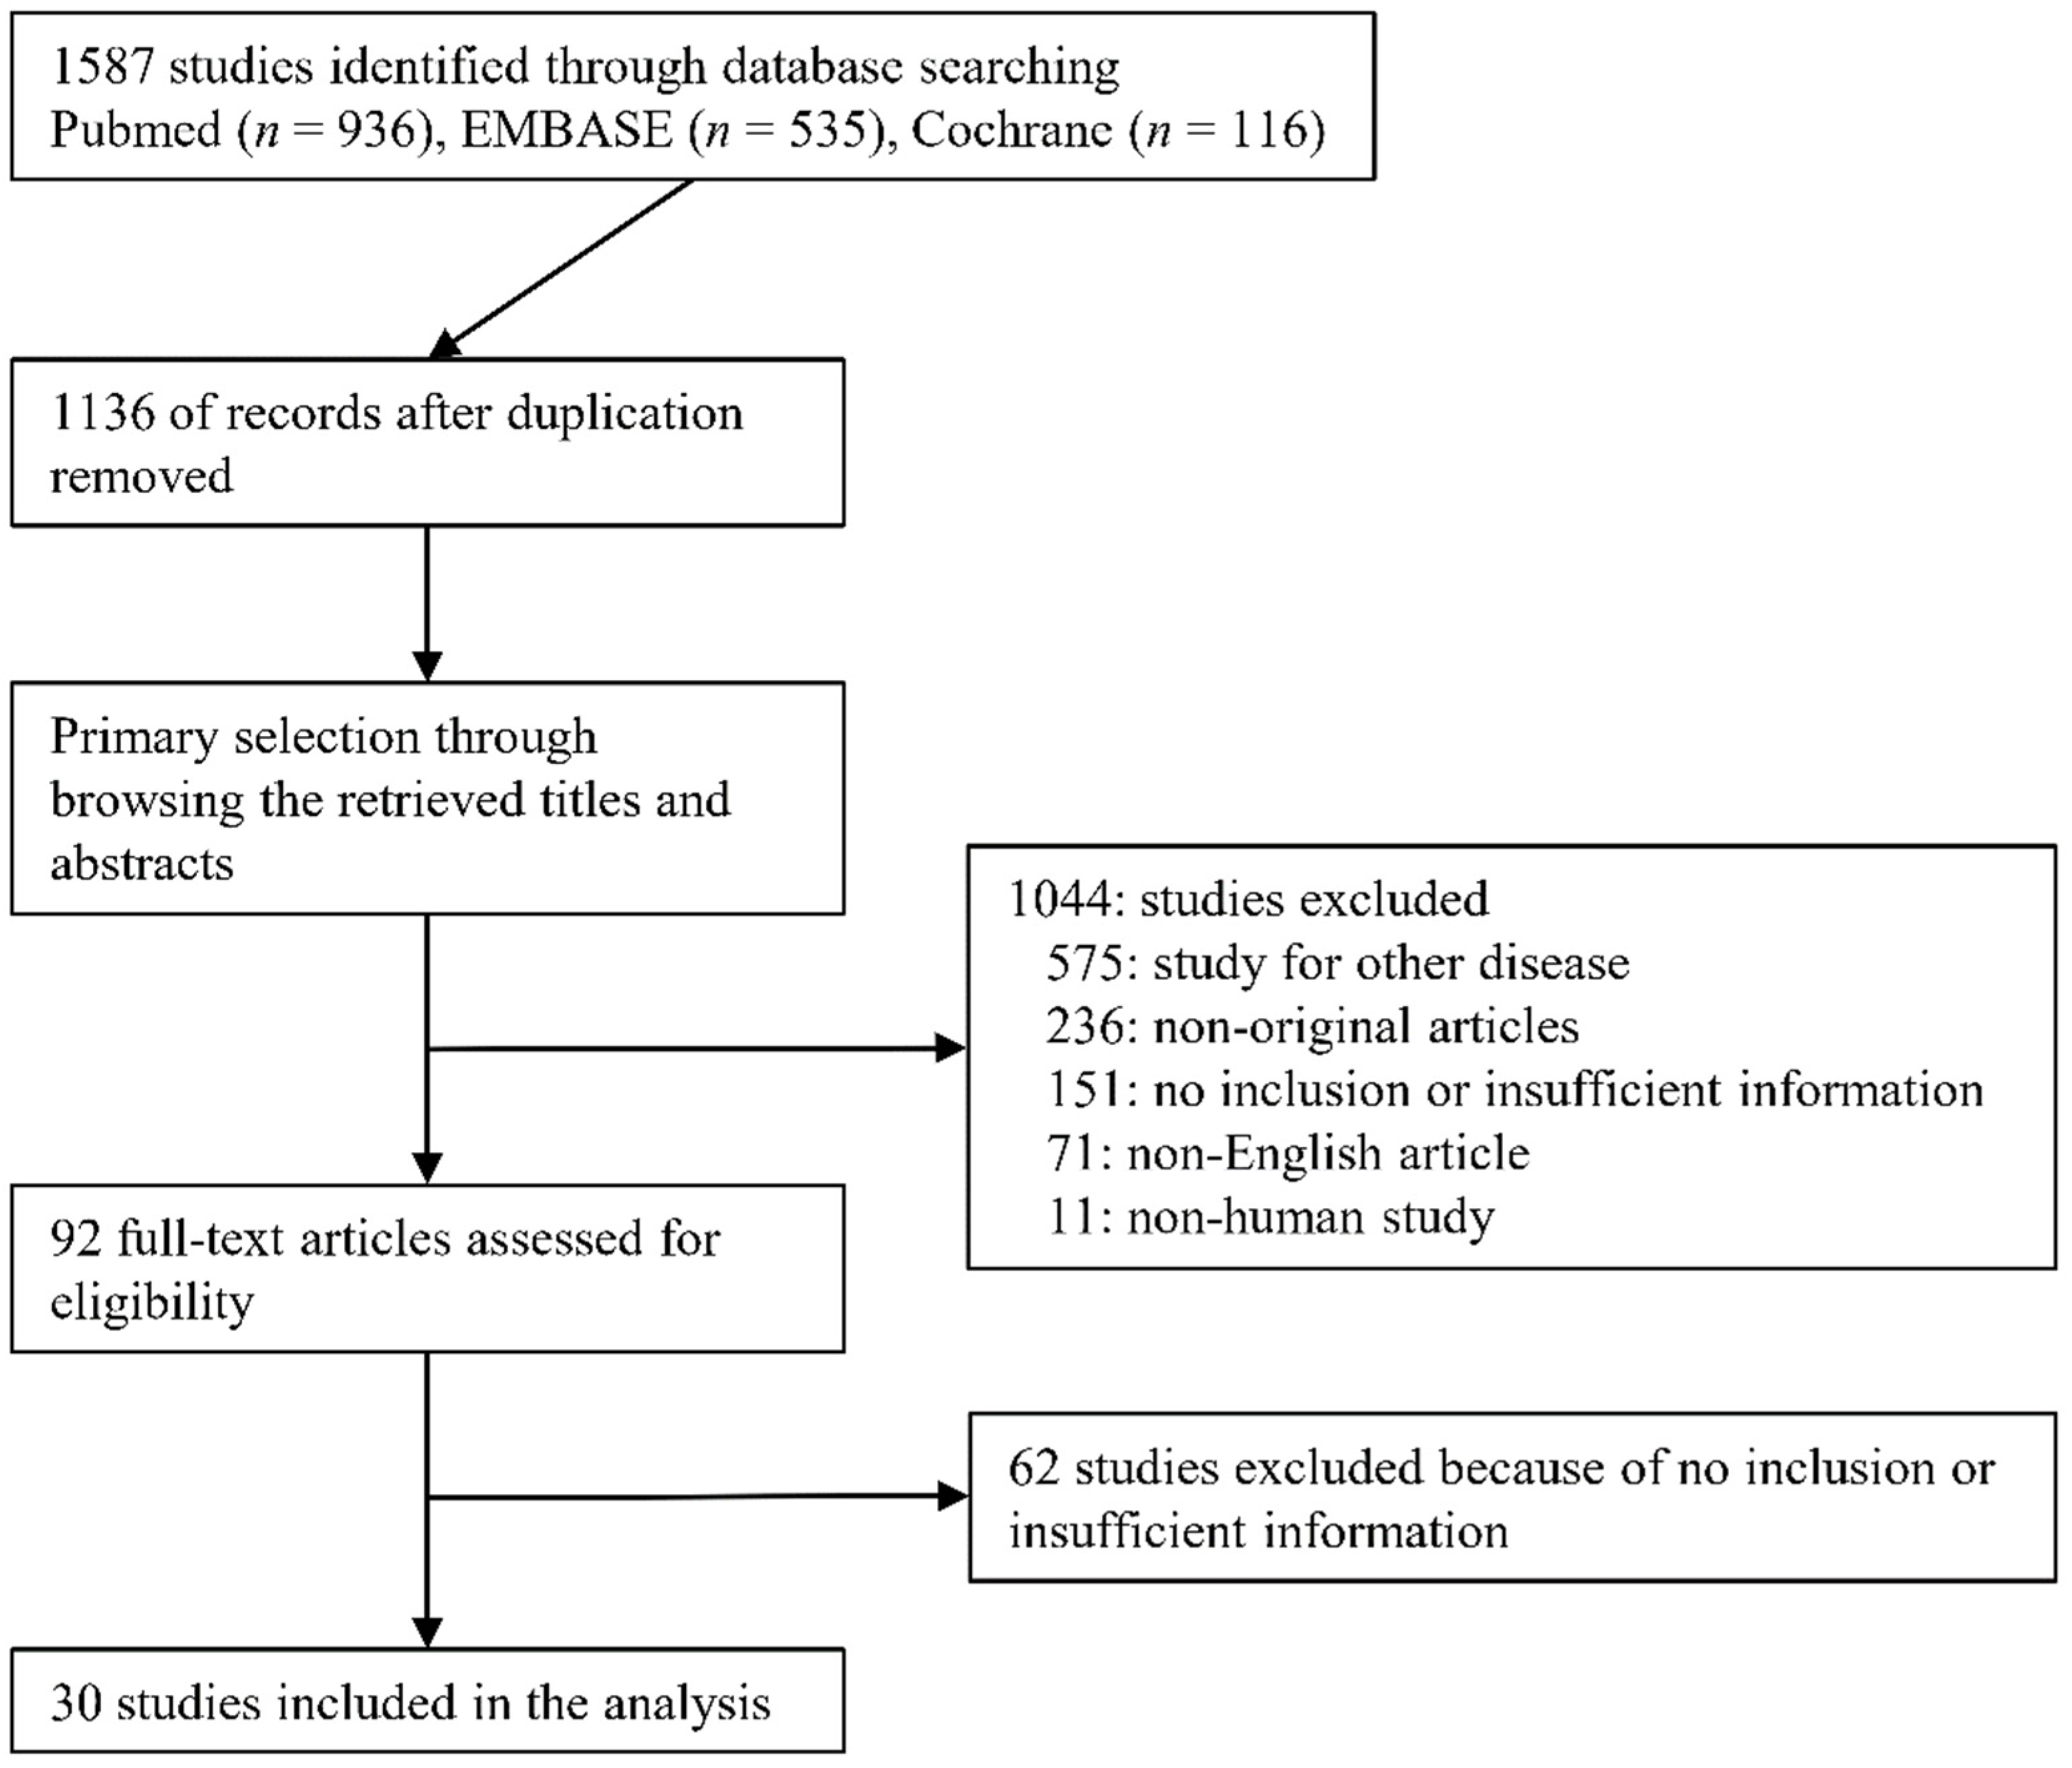
3.1. Selection and Characteristics
3.2. Clinical Characteristics of Patients
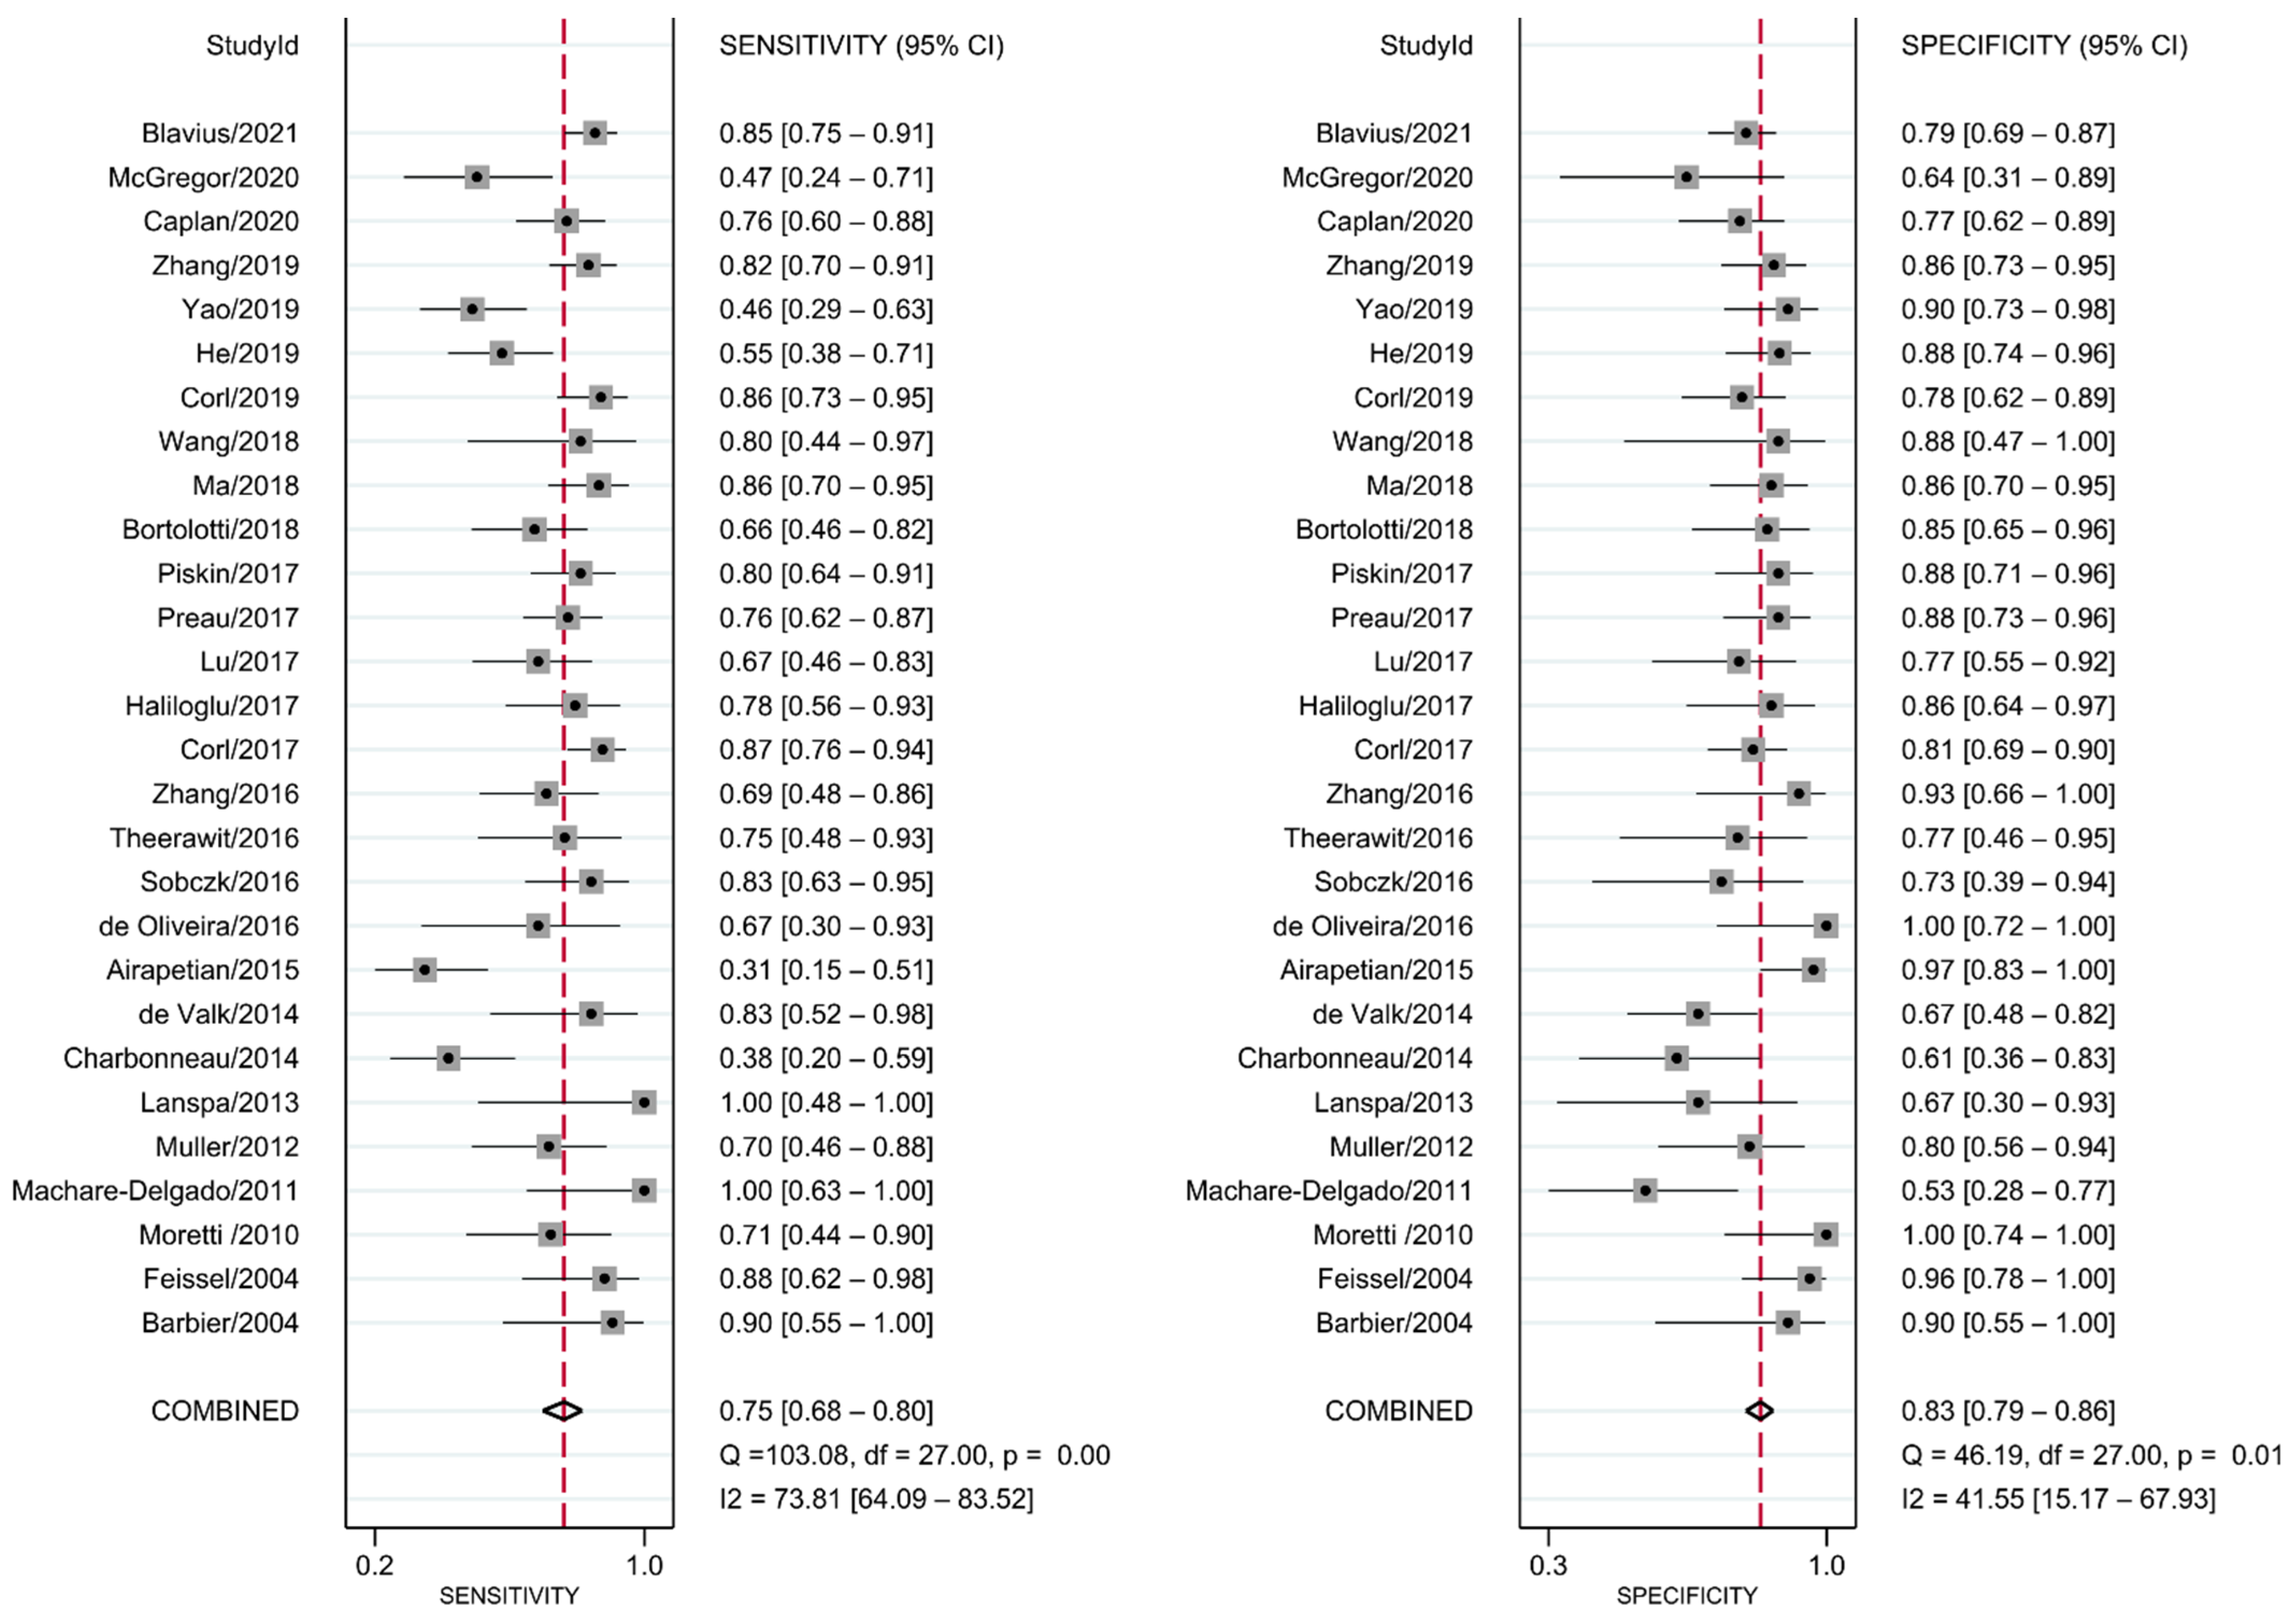
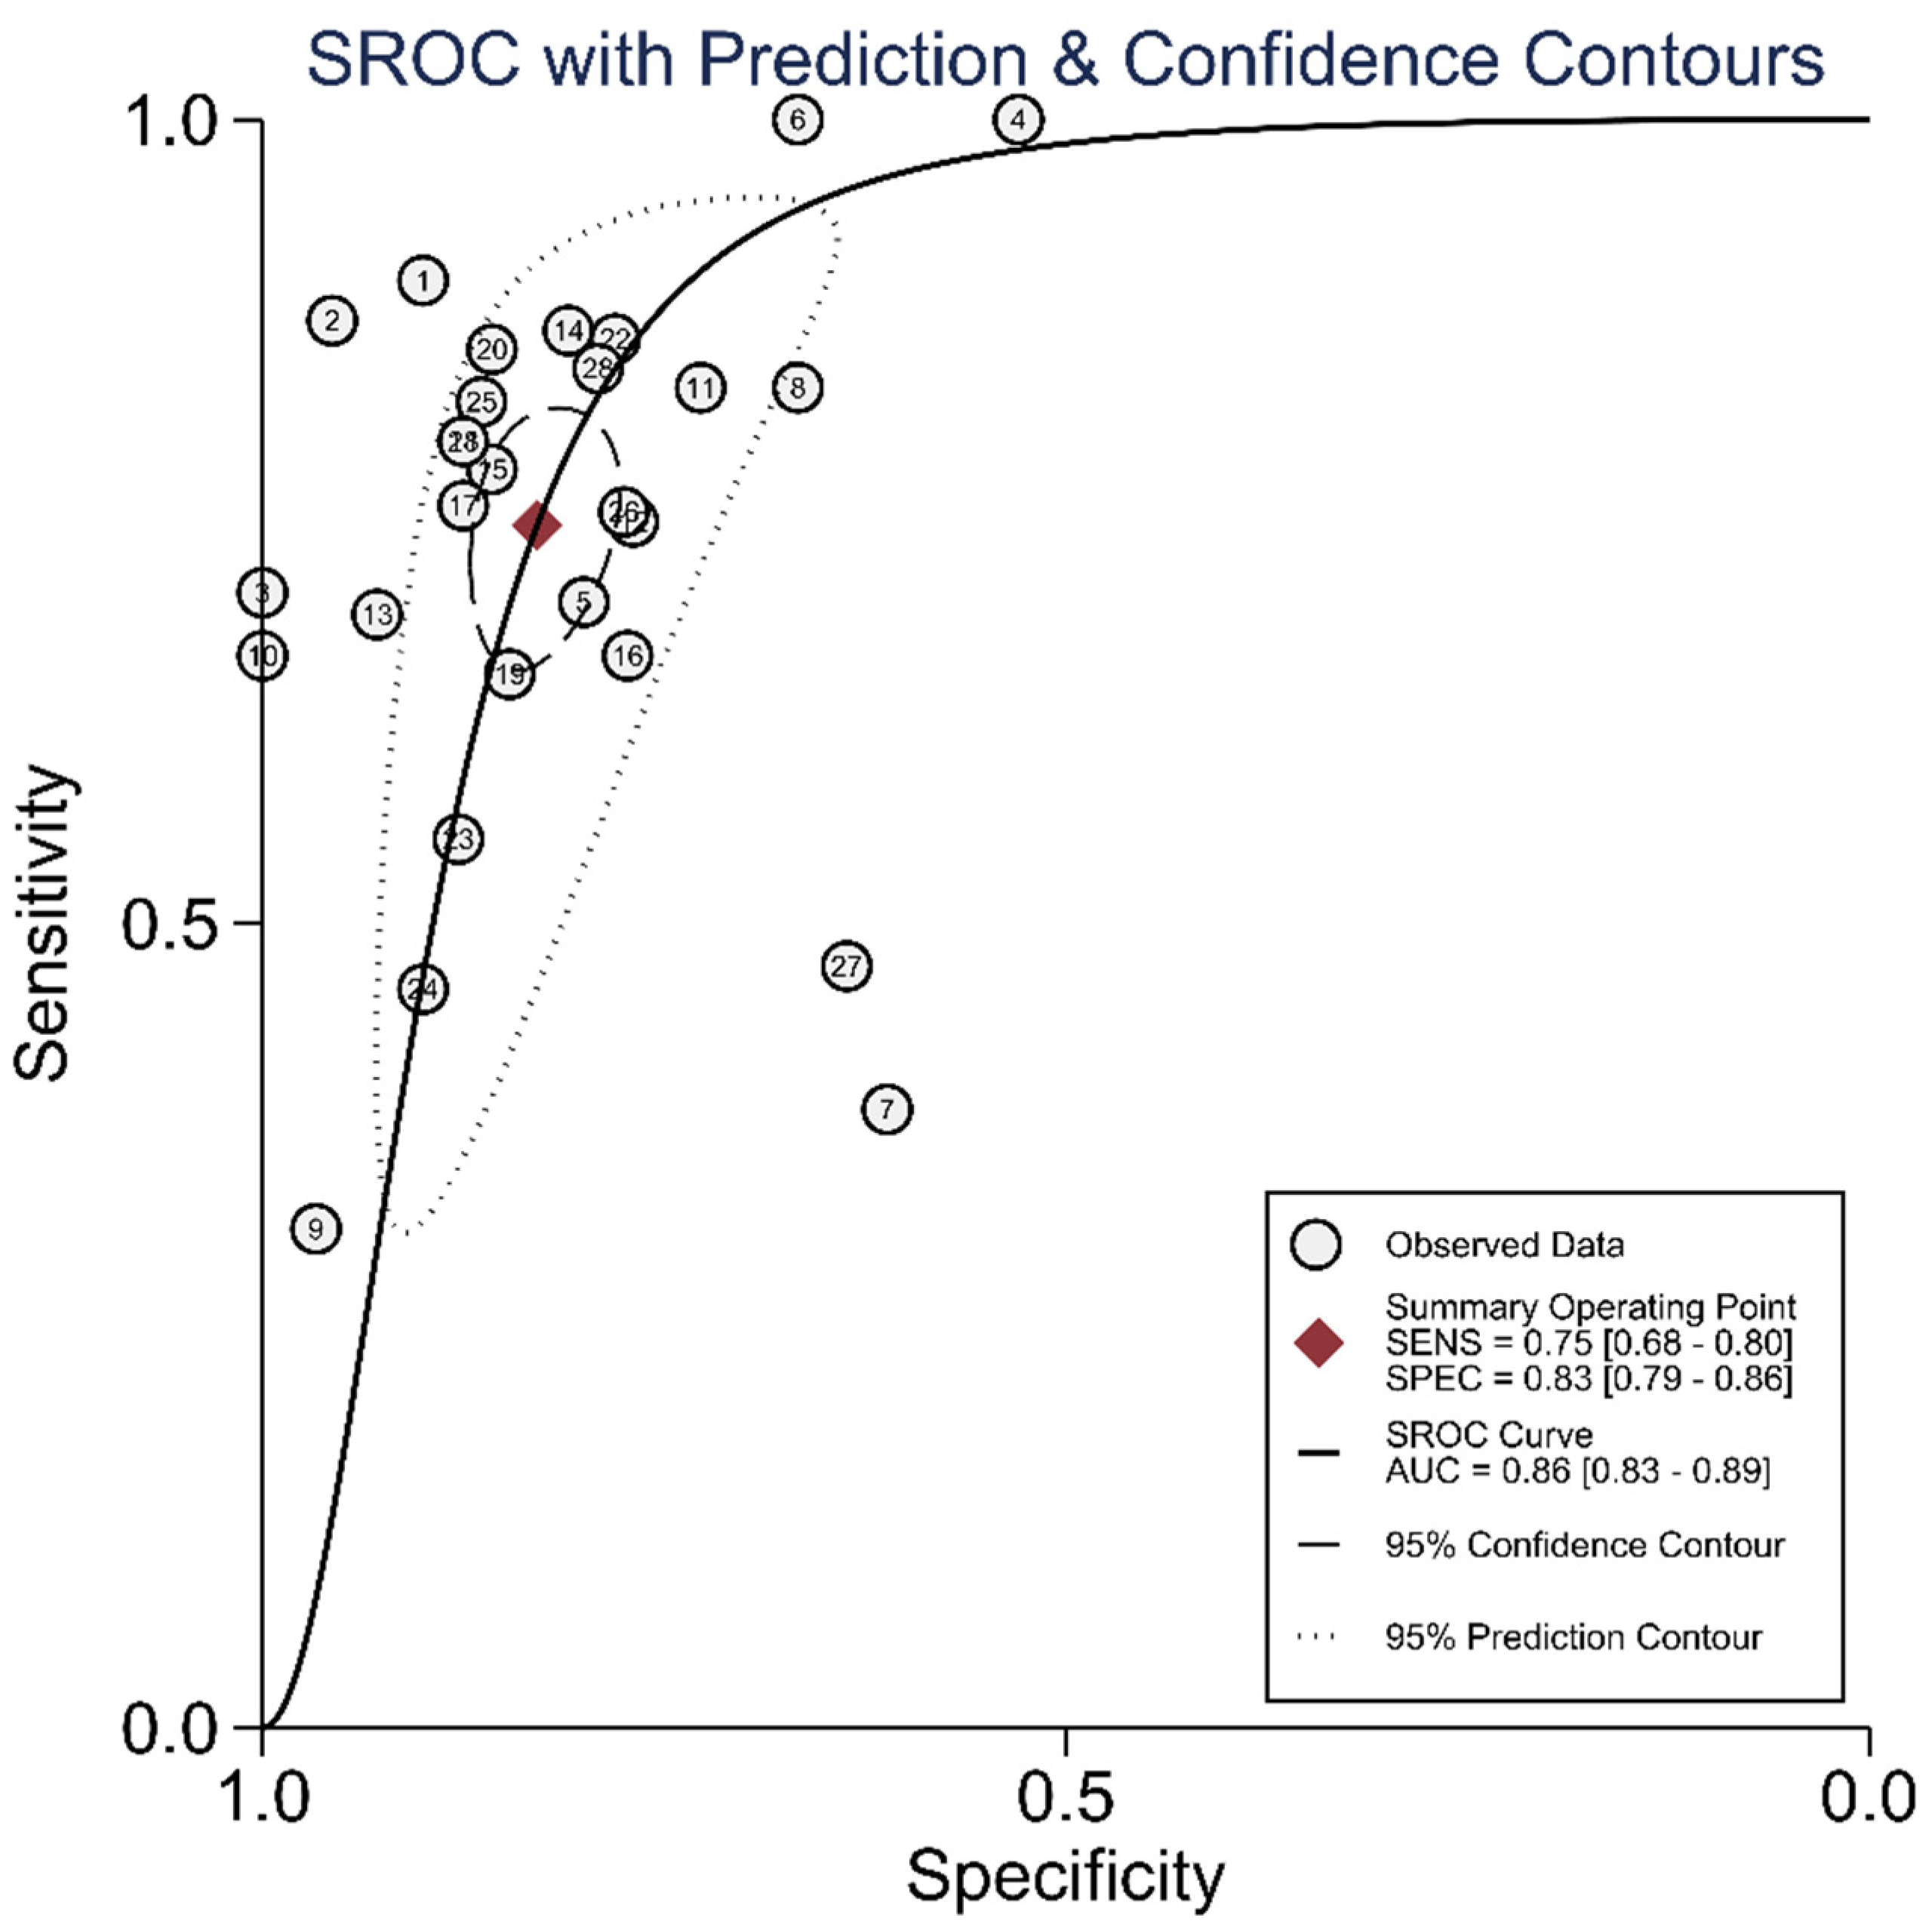
3.3. DTA Review
3.4. Meta-Regression, Subgroup Analysis, and Evaluation of Heterogeneity
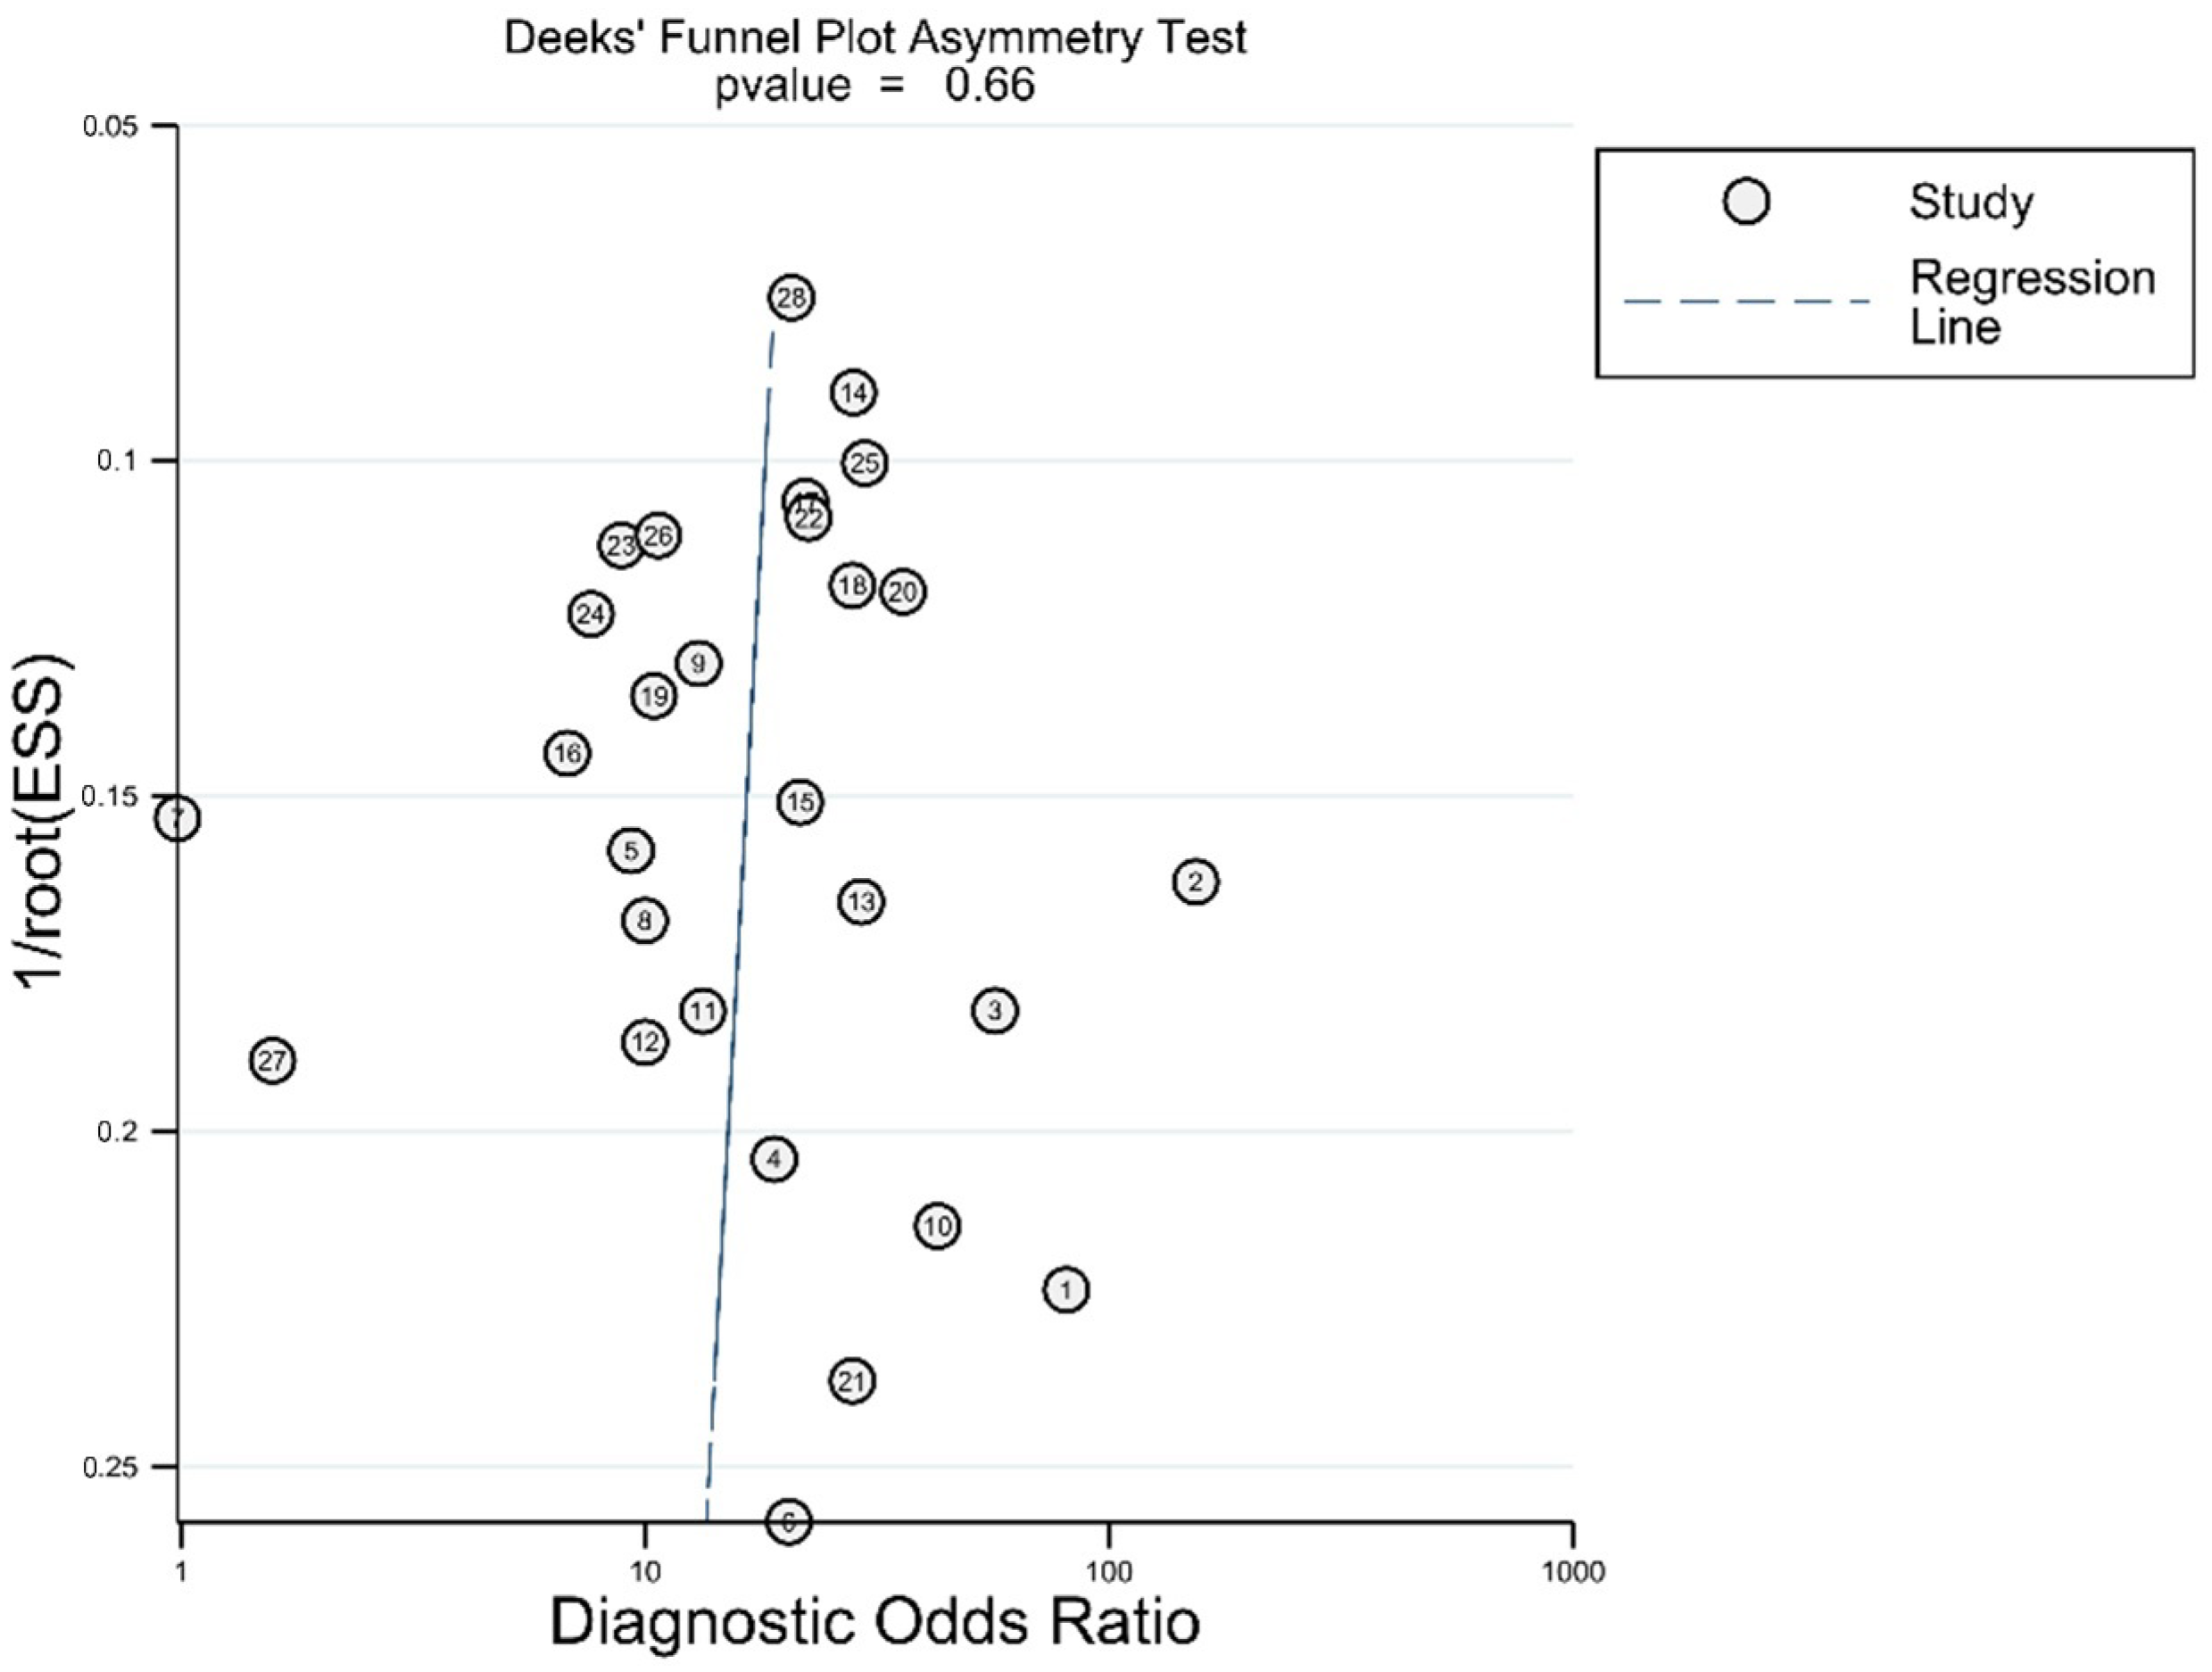
3.5. Publication Bias
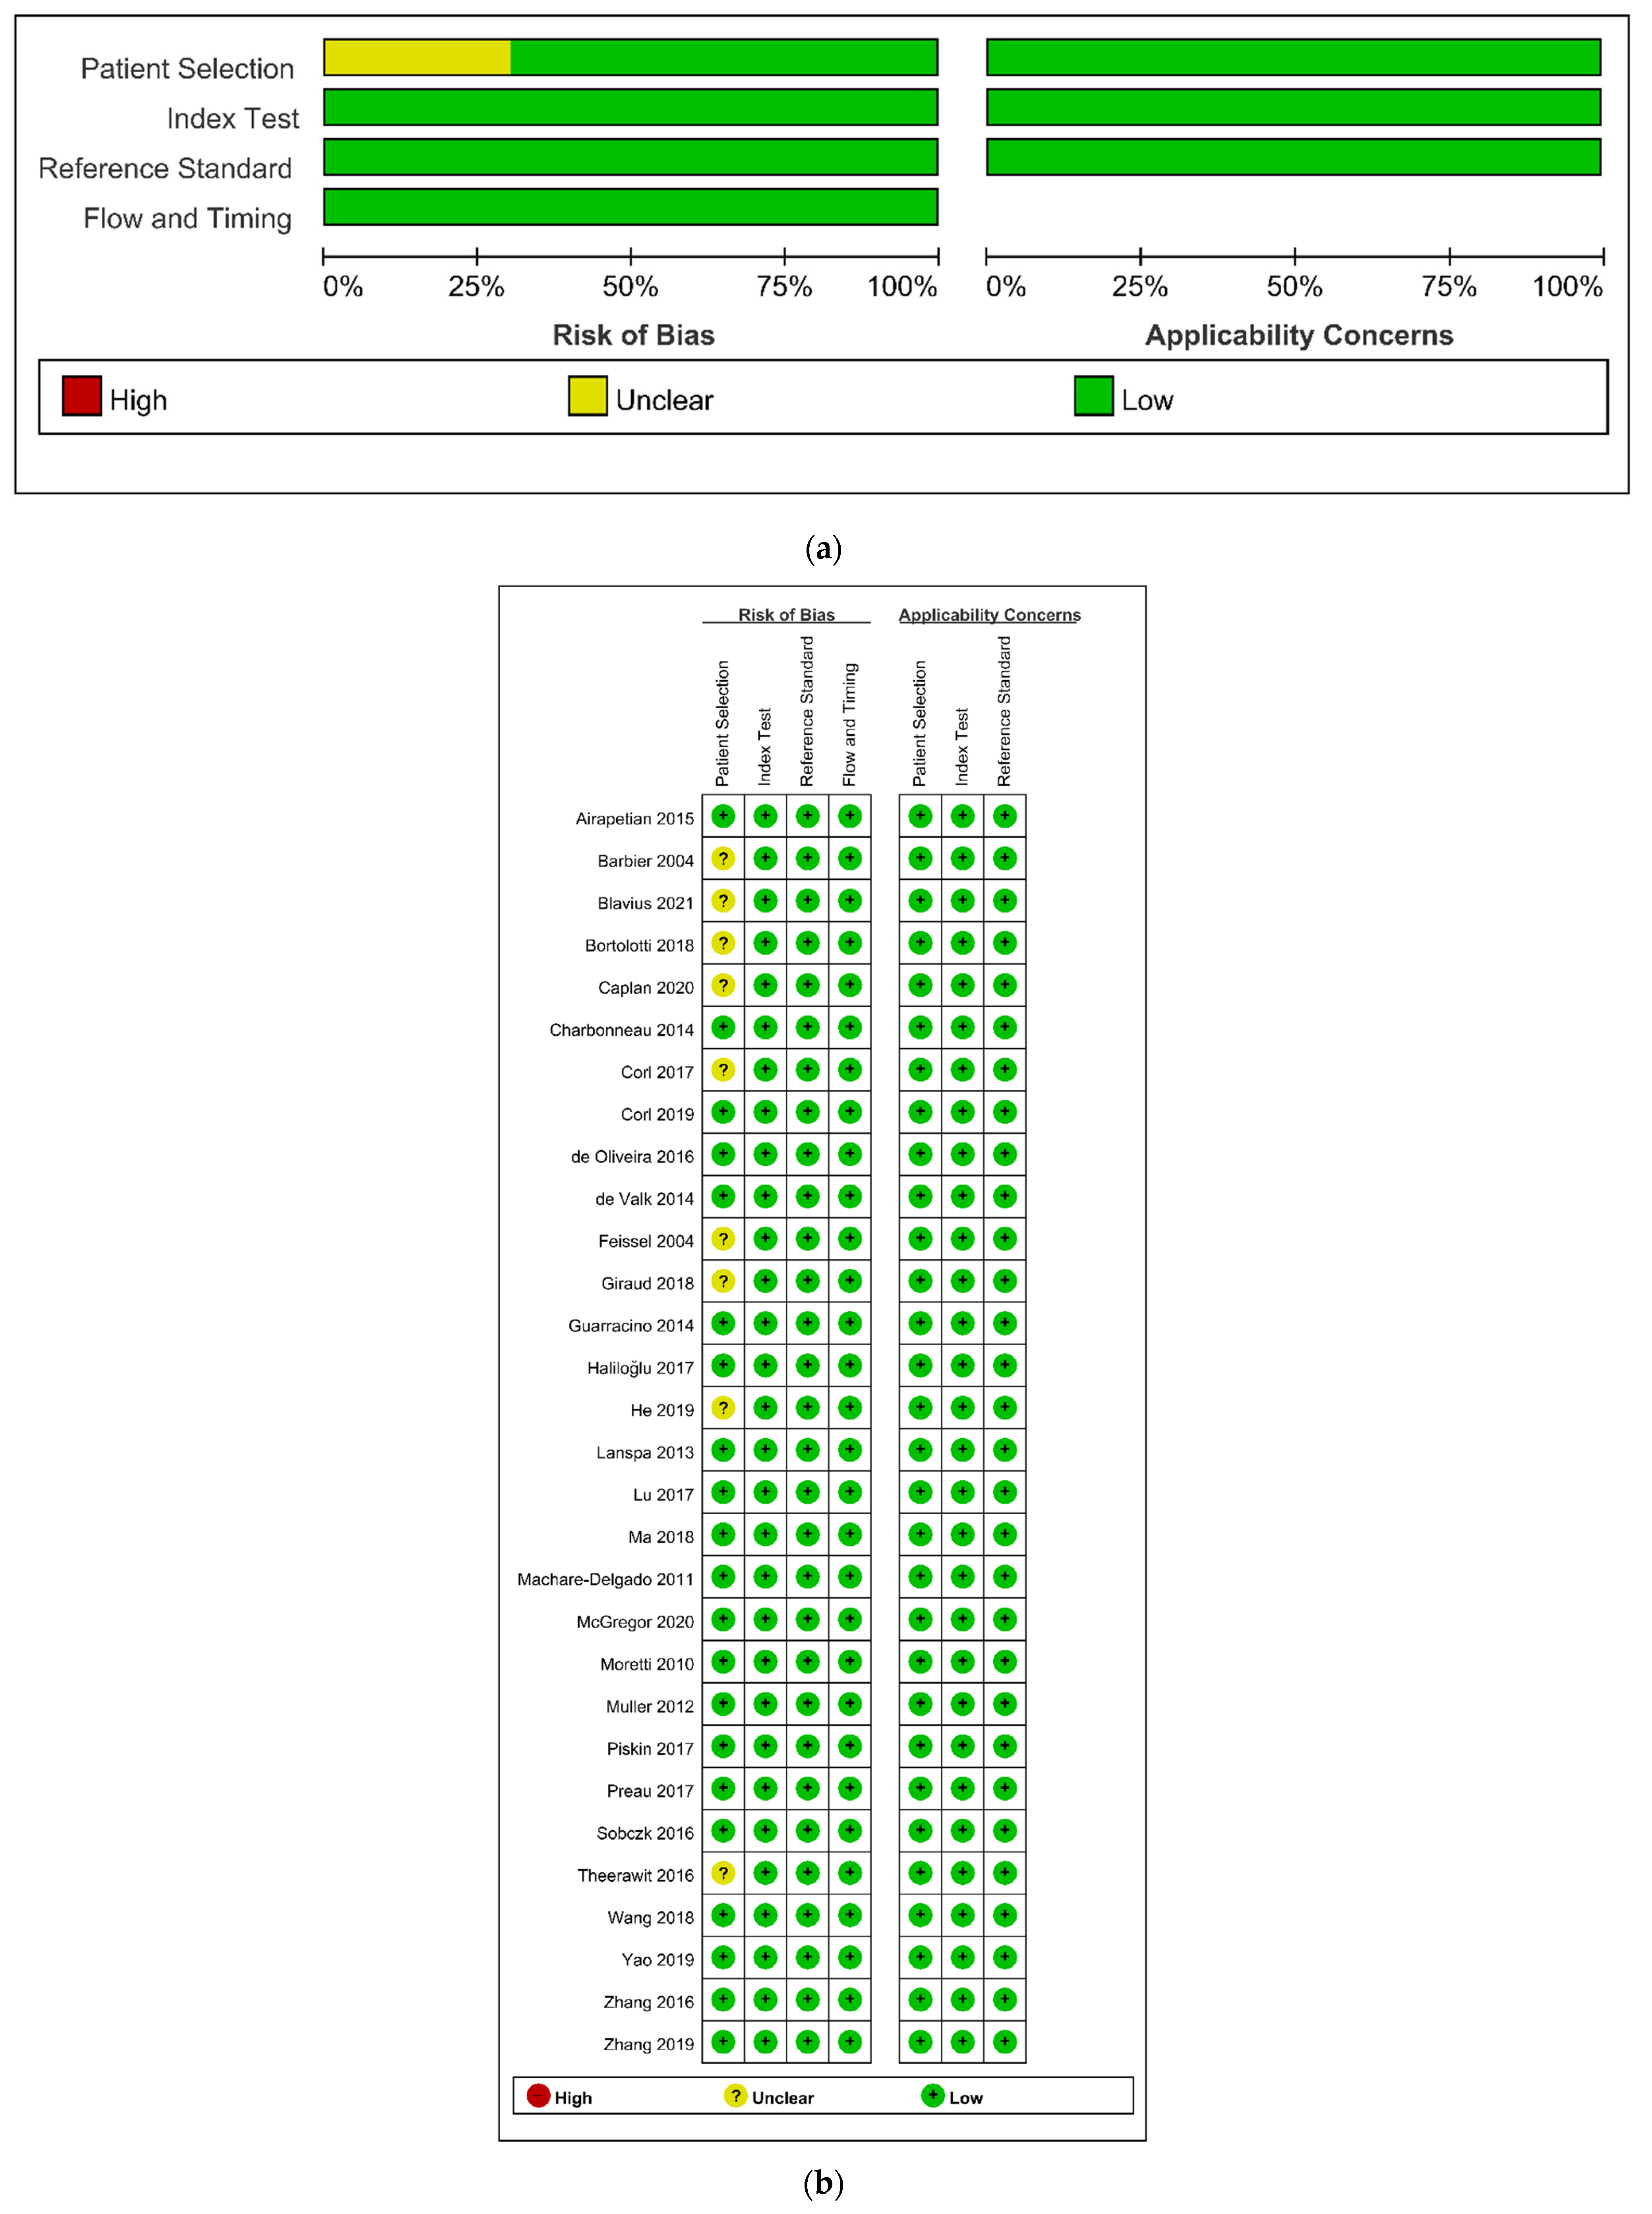
3.6. Quality Assessment
4. Discussion
5. Conclusions
Author Contributions
Funding
Institutional Review Board Statement
Informed Consent Statement
Data Availability Statement
Conflicts of Interest
References
- Ansari, B.M.; Zochios, V.; Falter, F.; Klein, A.A. Physiological controversies and methods used to determine fluid responsiveness: A qualitative systematic review. Anaesthesia 2016, 71, 94–105. [Google Scholar] [CrossRef]
- Bednarczyk, J.M.; Fridfinnson, J.A.; Kumar, A.; Blanchard, L.; Rabbani, R.; Bell, D.; Funk, D.; Turgeon, A.F.; Abou-Setta, A.M.; Zarychanski, R. Incorporating dynamic assessment of fluid responsiveness into goal-directed therapy: A systematic review and meta-analysis. Crit. Care Med. 2017, 45, 1538–1545. [Google Scholar] [CrossRef] [PubMed]
- Evans, L.; Rhodes, A.; Alhazzani, W.; Antonelli, M.; Coopersmith, C.M.; French, C.; Machado, F.R.; McIntyre, L.; Ostermann, M.; Prescott, H.C.; et al. Surviving sepsis campaign: International guidelines for management of sepsis and septic shock 2021. Crit. Care Med. 2021, 49, e1063–e1143. [Google Scholar] [CrossRef]
- Harvey, S.; Harrison, D.A.; Singer, M.; Ashcroft, J.; Jones, C.M.; Elbourne, D.; Brampton, W.; Williams, D.; Young, D.; Rowan, K. Assessment of the clinical effectiveness of pulmonary artery catheters in management of patients in intensive care (PAC-Man): A randomised controlled trial. Lancet 2005, 366, 472–477. [Google Scholar] [CrossRef]
- Jacob, R.; Dierberger, B.; Kissling, G. Functional significance of the Frank-Starling mechanism under physiological and pathophysiological conditions. Eur. Heart J. 1992, 13 (Suppl. E), 7–14. [Google Scholar] [CrossRef] [PubMed]
- Joseph, B.; Azim, A.; Zangbar, B.; Bauman, Z.; O’Keeffe, T.; Ibraheem, K.; Kulvatunyou, N.; Tang, A.; Latifi, R.; Rhee, P. Improving mortality in trauma laparotomy through the evolution of damage control resuscitation: Analysis of 1030 consecutive trauma laparotomies. J. Trauma Acute Care Surg. 2017, 82, 328–333. [Google Scholar] [CrossRef] [PubMed]
- Cannon, J.W.; Khan, M.A.; Raja, A.S.; Cohen, M.J.; Como, J.J.; Cotton, B.A.; Dubose, J.J.; Fox, E.E.; Inaba, K.; Rodriguez, C.J.; et al. Damage control resuscitation in patients with severe traumatic hemorrhage: A practice management guideline from the Eastern Association for the Surgery of Trauma. J. Trauma Acute Care Surg. 2017, 82, 605–617. [Google Scholar] [CrossRef] [Green Version]
- Kalla, M.; Herring, N.J.S. Physiology of shock and volume resuscitation. Surgery 2013, 31, 545–551. [Google Scholar]
- Chatterjee, K.J.C. The Swan-Ganz catheters: Past, present, and future: A viewpoint. Circulation 2009, 119, 147–152. [Google Scholar] [CrossRef] [Green Version]
- Saugel, B.; Kouz, K.; Scheeren, T.W.L.; Greiwe, G.; Hoppe, P.; Romagnoli, S.; de Backer, D. Cardiac output estimation using pulse wave analysis-physiology, algorithms, and technologies: A narrative review. Br. J. Anaesth. 2021, 126, 67–76. [Google Scholar] [CrossRef]
- Pourmand, A.; Pyle, M.; Yamane, D.; Sumon, K.; Frasure, S.E. The utility of point-of-care ultrasound in the assessment of volume status in acute and critically ill patients. World J. Emerg. Med. 2019, 10, 232–238. [Google Scholar] [CrossRef]
- Orso, D.; Paoli, I.; Piani, T.; Cilenti, F.L.; Cristiani, L.; Guglielmo, N. Accuracy of ultrasonographic measurements of inferior vena cava to determine fluid responsiveness: A systematic review and meta-analysis. J. Intensive Care Med. 2020, 35, 354–363. [Google Scholar] [CrossRef]
- Si, X.; Xu, H.; Liu, Z.; Wu, J.; Cao, D.; Chen, J.; Chen, M.; Liu, Y.; Guan, X. Does respiratory variation in inferior vena cava diameter predict fluid responsiveness in mechanically ventilated patients? A systematic review and meta-analysis. Anesth. Analg. 2018, 127, 1157–1164. [Google Scholar] [CrossRef] [PubMed]
- McInnes, M.D.F.; Moher, D.; Thombs, B.D.; McGrath, T.A.; Bossuyt, P.M.; Clifford, T.; Cohen, J.F.; Deeks, J.J.; Gatsonis, C.; Hooft, L.; et al. Preferred reporting items for a systematic review and meta-analysis of diagnostic test accuracy studies: The PRISMA-DTA statement. JAMA 2018, 319, 388–396. [Google Scholar] [CrossRef] [PubMed]
- Whiting, P.F.; Rutjes, A.W.; Westwood, M.E.; Mallett, S.; Deeks, J.J.; Reitsma, J.B.; Leeflang, M.M.; Sterne, J.A.; Bossuyt, P.M. QUADAS-2: A revised tool for the quality assessment of diagnostic accuracy studies. Ann. Intern. Med. 2011, 155, 529–536. [Google Scholar] [CrossRef] [PubMed]
- Rutter, C.M.; Gatsonis, C.A. A hierarchical regression approach to meta-analysis of diagnostic test accuracy evaluations. Stat. Med. 2001, 20, 2865–2884. [Google Scholar] [CrossRef]
- Reitsma, J.B.; Glas, A.S.; Rutjes, A.W.; Scholten, R.J.; Bossuyt, P.M.; Zwinderman, A.H. Bivariate analysis of sensitivity and specificity produces informative summary measures in diagnostic reviews. J. Clin. Epidemiol. 2005, 58, 982–990. [Google Scholar] [CrossRef] [PubMed]
- Higgins, J.P.; Thompson, S.G.; Deeks, J.J.; Altman, D.G. Measuring inconsistency in meta-analyses. BMJ 2003, 327, 557–560. [Google Scholar] [CrossRef] [Green Version]
- Dwamena, B. A Midas Retouch Regarding Diagnostic Meta-Analysis. In Proceedings of the 2014 Stata Conference, Boston, MA, USA, 31 July–1 August 2014. [Google Scholar]
- Deeks, J.J.; Macaskill, P.; Irwig, L. The performance of tests of publication bias and other sample size effects in systematic reviews of diagnostic test accuracy was assessed. J. Clin. Epidemiol. 2005, 58, 882–893. [Google Scholar] [CrossRef]
- Barbier, C.; Loubières, Y.; Schmit, C.; Hayon, J.; Ricôme, J.L.; Jardin, F.; Vieillard-Baron, A. Respiratory changes in inferior vena cava diameter are helpful in predicting fluid responsiveness in ventilated septic patients. Intensive Care Med. 2004, 30, 1740–1746. [Google Scholar] [CrossRef]
- Feissel, M.; Michard, F.; Faller, J.P.; Teboul, J.L. The respiratory variation in inferior vena cava diameter as a guide to fluid therapy. Intensive Care Med. 2004, 30, 1834–1837. [Google Scholar] [CrossRef]
- Moretti, R.; Pizzi, B. Inferior vena cava distensibility as a predictor of fluid responsiveness in patients with subarachnoid hemorrhage. Neurocrit. Care 2010, 13, 3–9. [Google Scholar] [CrossRef] [PubMed]
- Machare-Delgado, E.; Decaro, M.; Marik, P.E. Inferior vena cava variation compared to pulse contour analysis as predictors of fluid responsiveness: A prospective cohort study. J. Intensive Care Med. 2011, 26, 116–124. [Google Scholar] [CrossRef] [PubMed]
- Muller, L.; Bobbia, X.; Toumi, M.; Louart, G.; Molinari, N.; Ragonnet, B.; Quintard, H.; Leone, M.; Zoric, L.; Lefrant, J.Y. Respiratory variations of inferior vena cava diameter to predict fluid responsiveness in spontaneously breathing patients with acute circulatory failure: Need for a cautious use. Crit. Care 2012, 16, R188. [Google Scholar] [CrossRef] [PubMed] [Green Version]
- Lanspa, M.J.; Grissom, C.K.; Hirshberg, E.L.; Jones, J.P.; Brown, S.M. Applying dynamic parameters to predict hemodynamic response to volume expansion in spontaneously breathing patients with septic shock. Shock 2013, 39, 155–160. [Google Scholar] [CrossRef] [PubMed] [Green Version]
- Charbonneau, H.; Riu, B.; Faron, M.; Mari, A.; Kurrek, M.M.; Ruiz, J.; Geeraerts, T.; Fourcade, O.; Genestal, M.; Silva, S. Predicting preload responsiveness using simultaneous recordings of inferior and superior vena cavae diameters. Crit. Care 2014, 18, 473. [Google Scholar] [CrossRef] [Green Version]
- De Valk, S.; Olgers, T.J.; Holman, M.; Ismael, F.; Ligtenberg, J.J.; Ter Maaten, J.C. The caval index: An adequate non-invasive ultrasound parameter to predict fluid responsiveness in the emergency department? BMC Anesthesiol. 2014, 14, 114. [Google Scholar] [CrossRef] [Green Version]
- Guarracino, F.; Ferro, B.; Forfori, F.; Bertini, P.; Magliacano, L.; Pinsky, M.R. Jugular vein distensibility predicts fluid responsiveness in septic patients. Crit. Care 2014, 18, 647. [Google Scholar] [CrossRef] [Green Version]
- Airapetian, N.; Maizel, J.; Alyamani, O.; Mahjoub, Y.; Lorne, E.; Levrard, M.; Ammenouche, N.; Seydi, A.; Tinturier, F.; Lobjoie, E.; et al. Does inferior vena cava respiratory variability predict fluid responsiveness in spontaneously breathing patients? Crit. Care 2015, 19, 400. [Google Scholar] [CrossRef] [Green Version]
- De Oliveira, O.H.; Freitas, F.G.; Ladeira, R.T.; Fischer, C.H.; Bafi, A.T.; Azevedo, L.C.; Machado, F.R. Comparison between respiratory changes in the inferior vena cava diameter and pulse pressure variation to predict fluid responsiveness in postoperative patients. J. Crit. Care 2016, 34, 46–49. [Google Scholar] [CrossRef]
- Sobczyk, D.; Nycz, K.; Andruszkiewicz, P.; Wierzbicki, K.; Stapor, M. Ultrasonographic caval indices do not significantly contribute to predicting fluid responsiveness immediately after coronary artery bypass grafting when compared to passive leg raising. Cardiovasc. Ultrasound 2016, 14, 23. [Google Scholar] [CrossRef] [PubMed] [Green Version]
- Theerawit, P.; Morasert, T.; Sutherasan, Y. Inferior vena cava diameter variation compared with pulse pressure variation as predictors of fluid responsiveness in patients with sepsis. J. Crit. Care 2016, 36, 246–251. [Google Scholar] [CrossRef] [PubMed]
- Zhang, X.; Feng, J.; Zhu, P.; Luan, H.; Wu, Y.; Zhao, Z. Ultrasonographic measurements of the inferior vena cava variation as a predictor of fluid responsiveness in patients undergoing anesthesia for surgery. J. Surg. Res. 2016, 204, 118–122. [Google Scholar] [CrossRef]
- Corl, K.A.; George, N.R.; Romanoff, J.; Levinson, A.T.; Chheng, D.B.; Merchant, R.C.; Levy, M.M.; Napoli, A.M. Inferior vena cava collapsibility detects fluid responsiveness among spontaneously breathing critically-ill patients. J. Crit. Care 2017, 41, 130–137. [Google Scholar] [CrossRef]
- Haliloğlu, M.; Bilgili, B.; Kararmaz, A.; Cinel, İ. The value of internal jugular vein collapsibility index in sepsis. Ulusal travma ve acil cerrahi dergisi. Turk. J. Trauma Emerg. Surg. 2017, 23, 294–300. [Google Scholar] [CrossRef] [Green Version]
- Lu, N.; Xi, X.; Jiang, L.; Yang, D.; Yin, K. Exploring the best predictors of fluid responsiveness in patients with septic shock. The Am. J. Emerg. Med. 2017, 35, 1258–1261. [Google Scholar] [CrossRef]
- Pişkin, Ö.; Öz, İ. Accuracy of pleth variability index compared with inferior vena cava diameter to predict fluid responsiveness in mechanically ventilated patients. Medicine 2017, 96, e8889. [Google Scholar] [CrossRef]
- Preau, S.; Bortolotti, P.; Colling, D.; Dewavrin, F.; Colas, V.; Voisin, B.; Onimus, T.; Drumez, E.; Durocher, A.; Redheuil, A.; et al. Diagnostic accuracy of the inferior vena cava collapsibility to predict fluid responsiveness in spontaneously breathing patients with sepsis and acute circulatory failure. Crit. Care Med. 2017, 45, e290–e297. [Google Scholar] [CrossRef] [PubMed]
- Bortolotti, P.; Colling, D.; Colas, V.; Voisin, B.; Dewavrin, F.; Poissy, J.; Girardie, P.; Kyheng, M.; Saulnier, F.; Favory, R.; et al. Respiratory changes of the inferior vena cava diameter predict fluid responsiveness in spontaneously breathing patients with cardiac arrhythmias. Ann. Intensive Care 2018, 8, 79. [Google Scholar] [CrossRef] [PubMed]
- Giraud, R.; Abraham, P.S.; Brindel, P.; Siegenthaler, N.; Bendjelid, K. Respiratory changes in subclavian vein diameters predicts fluid responsiveness in intensive care patients: A pilot study. J. Clin. Monit. Comput. 2018, 32, 1049–1055. [Google Scholar] [CrossRef]
- Ma, G.G.; Hao, G.W.; Yang, X.M.; Zhu, D.M.; Liu, L.; Liu, H.; Tu, G.W.; Luo, Z. Internal jugular vein variability predicts fluid responsiveness in cardiac surgical patients with mechanical ventilation. Ann. Intensive Care 2018, 8, 6. [Google Scholar] [CrossRef] [Green Version]
- Wang, Y.; Jiang, Y.; Wu, H.; Wang, R.; Wang, Y.; Du, C. Assessment of fluid responsiveness by inferior vena cava diameter variation in post-pneumonectomy patients. Echocardiography 2018, 35, 1922–1925. [Google Scholar] [CrossRef] [PubMed]
- Corl, K.A.; Azab, N.; Nayeemuddin, M.; Schick, A.; Lopardo, T.; Zeba, F.; Phillips, G.; Baird, G.; Merchant, R.C.; Levy, M.M.; et al. Performance of a 25% inferior vena cava collapsibility in detecting fluid responsiveness when assessed by novice versus expert physician sonologists. J. Intensive Care Med. 2020, 35, 1520–1528. [Google Scholar] [CrossRef]
- He, F.; Li, X.; Thapa, S.; Li, C.; Luo, J.; Dai, W.; Liu, J. Evaluation of volume responsiveness by pulse pressure variability and inferior vena cava dispensability index at different tidal volumes by mechanical ventilation. Braz. J. Med. Biol. Res./Rev. Bras. Pesqui. Med. Biol. 2019, 52, e8827. [Google Scholar] [CrossRef] [PubMed] [Green Version]
- Yao, B.; Liu, J.Y.; Sun, Y.B.; Zhao, Y.X.; Li, L.D. The value of the inferior vena cava area distensibility index and its diameter ratio for predicting fluid responsiveness in mechanically ventilated patients. Shock 2019, 52, 37–42. [Google Scholar] [CrossRef] [PubMed]
- Zhang, H.; Zhang, Q.; Chen, X.; Wang, X.; Liu, D. Respiratory variations of inferior vena cava fail to predict fluid responsiveness in mechanically ventilated patients with isolated left ventricular dysfunction. Ann. Intensive Care 2019, 9, 113. [Google Scholar] [CrossRef] [Green Version]
- Caplan, M.; Durand, A.; Bortolotti, P.; Colling, D.; Goutay, J.; Duburcq, T.; Drumez, E.; Rouze, A.; Nseir, S.; Howsam, M.; et al. Measurement site of inferior vena cava diameter affects the accuracy with which fluid responsiveness can be predicted in spontaneously breathing patients: A post hoc analysis of two prospective cohorts. Ann. Intensive Care 2020, 10, 168. [Google Scholar] [CrossRef]
- McGregor, D.; Sharma, S.; Gupta, S.; Ahmed, S.; Harris, T. Emergency department non-invasive cardiac output study (EDNICO): An accuracy study. Scand. J. Trauma Resusc. Emerg. Med. 2020, 28, 8. [Google Scholar] [CrossRef]
- Blaivas, M.; Blaivas, L.; Philips, G.; Merchant, R.; Levy, M.; Abbasi, A.; Eickhoff, C.; Shapiro, N.; Corl, K. Development of a deep learning network to classify inferior vena cava collapse to predict fluid responsiveness. J. Ultrasound Med. Off. J. Am. Inst. Ultrasound Med. 2021, 40, 1495–1504. [Google Scholar] [CrossRef] [PubMed]
- Vignon, P.; Repessé, X.; Bégot, E.; Léger, J.; Jacob, C.; Bouferrache, K.; Slama, M.; Prat, G.; Vieillard-Baron, A. Comparison of echocardiographic indices used to predict fluid responsiveness in ventilated patients. Am. J. Respir. Crit. Care Med. 2017, 195, 1022–1032. [Google Scholar] [CrossRef]
- Brun, C.; Zieleskiewicz, L.; Textoris, J.; Muller, L.; Bellefleur, J.P.; Antonini, F.; Tourret, M.; Ortega, D.; Vellin, A.; Lefrant, J.Y.; et al. Prediction of fluid responsiveness in severe preeclamptic patients with oliguria. Intensive Care Med. 2013, 39, 593–600. [Google Scholar] [CrossRef]
- Baker, A.K.; Partridge, R.J.; Litton, E.; Ho, K.M. Assessment of the plethysmographic variability index as a predictor of fluid responsiveness in critically ill patients: A pilot study. Anaesth. Intensive Care 2013, 41, 736–741. [Google Scholar] [CrossRef] [Green Version]
- Dipti, A.; Soucy, Z.; Surana, A.; Chandra, S. Role of inferior vena cava diameter in assessment of volume status: A meta-analysis. Am. J. Emerg. Med. 2012, 30, 1414–1419. [Google Scholar] [CrossRef]
- Marik, P.E.; Cavallazzi, R. Does the central venous pressure predict fluid responsiveness? An updated meta-analysis and a plea for some common sense. Crit. Care Med. 2013, 41, 1774–1781. [Google Scholar] [CrossRef]
- Kent, A.; Bahner, D.P.; Boulger, C.T.; Eiferman, D.S.; Adkins, E.J.; Evans, D.C.; Springer, A.N.; Balakrishnan, J.M.; Valiyaveedan, S.; Galwankar, S.C.; et al. Sonographic evaluation of intravascular volume status in the surgical intensive care unit: A prospective comparison of subclavian vein and inferior vena cava collapsibility index. J. Surg. Res. 2013, 184, 561–566. [Google Scholar] [CrossRef]
- Kent, A.; Patil, P.; Davila, V.; Bailey, J.K.; Jones, C.; Evans, D.C.; Boulger, C.T.; Adkins, E.; Balakrishnan, J.M.; Valiyaveedan, S.; et al. Sonographic evaluation of intravascular volume status: Can internal jugular or femoral vein collapsibility be used in the absence of IVC visualization? Ann. Thorac. Med. 2015, 10, 44–49. [Google Scholar] [CrossRef] [PubMed]
- Monnet, X.; Teboul, J.L. Transpulmonary thermodilution: Advantages and limits. Crit. Care 2017, 21, 147. [Google Scholar] [CrossRef] [PubMed]
- Kobe, J.; Mishra, N.; Arya, V.K.; Al-Moustadi, W.; Nates, W.; Kumar, B. Cardiac output monitoring: Technology and choice. Ann. Card. Anaesth. 2019, 22, 6–17. [Google Scholar] [CrossRef]
- Marqué, S.; Cariou, A.; Chiche, J.D.; Squara, P. Comparison between Flotrac-Vigileo and Bioreactance, a totally noninvasive method for cardiac output monitoring. Crit. Care 2009, 13, R73. [Google Scholar] [CrossRef] [PubMed] [Green Version]
- Litton, E.; Morgan, M. The PiCCO monitor: A review. Anaesth. Intensive Care 2012, 40, 393–409. [Google Scholar] [CrossRef] [PubMed] [Green Version]
- Gorrasi, J.; Pazos, A.; Florio, L.; Américo, C.; Lluberas, N.; Parma, G.; Lluberas, R. Cardiac output measured by transthoracic echocardiography and Swan-Ganz catheter. A comparative study in mechanically ventilated patients with high positive end-expiratory pressure. Rev. Bras. Ter. Intensiva 2019, 31, 474–482. [Google Scholar] [CrossRef] [PubMed]
- Mercado, P.; Maizel, J.; Beyls, C.; Titeca-Beauport, D.; Joris, M.; Kontar, L.; Riviere, A.; Bonef, O.; Soupison, T.; Tribouilloy, C.; et al. Transthoracic echocardiography: An accurate and precise method for estimating cardiac output in the critically ill patient. Crit. Care 2017, 21, 136. [Google Scholar] [CrossRef] [PubMed] [Green Version]
- Kupersztych-Hagege, E.; Teboul, J.L.; Artigas, A.; Talbot, A.; Sabatier, C.; Richard, C.; Monnet, X. Bioreactance is not reliable for estimating cardiac output and the effects of passive leg raising in critically ill patients. Br. J. Anaesth. 2013, 111, 961–966. [Google Scholar] [CrossRef] [Green Version]
- Lee, S.; Lee, S.H.; Chang, B.C.; Shim, J.K. Efficacy of goal-directed therapy using bioreactance cardiac output monitoring after valvular heart surgery. Yonsei Med. J. 2015, 56, 913–920. [Google Scholar] [CrossRef] [PubMed] [Green Version]
- Trauzeddel, R.F.; Ertmer, M.; Nordine, M.; Groesdonk, H.V.; Michels, G.; Pfister, R.; Reuter, D.; Scheeren, T.W.L.; Berger, C.; Treskatsch, S. Perioperative echocardiography-guided hemodynamic therapy in high-risk patients: A practical expert approach of hemodynamically focused echocardiography. J. Clin. Monit. Comput. 2021, 35, 229–243. [Google Scholar] [CrossRef] [PubMed]


| Author | Year | Target Vein | Index Test | Device (Index Test) | Measure Site | Reference Standard | Device (Reference Standard) | Setting | Threshold (Reference Standard) | Fluid Challenge | MV | MV Setting | Study Design | Location | Study Period |
|---|---|---|---|---|---|---|---|---|---|---|---|---|---|---|---|
| Barbier [21] | 2004 | IVC | IVC-d | US, M-mode | Just upstream of the origin of hepatic vein | CI | ECHO | ICU, adult, MV, septic shock | CI = 15% | 7ml/kg 4% modified fluid gelatin over 30 min | yes | Tidal = 8.5 ± 1.5 mL/kg, PEEP = 4 ± 2 cm H2O | Obs | France | January 2003–July 2003 |
| Feissel [22] | 2004 | IVC | IVC-v | US, M-mode | Approximately 3 cm from the RA | CO | ECHO | ICU, adult, MV, septic shock | CO = 15% | 8 mL/kg of 6% hydroxyethyl starch over 20 min | yes | Tidal = 8 to 10 mL/kg | Obs | USA | NR |
| Moretti [23] | 2010 | IVC | IVC-d | US, M-mode | 2 cm upstream of the origin of hepatic vein | SVV | transpulmonary thermodilution | ICU, adult, MV, SAH | CI = 15% | 7 mL/kg of 6% hydroxyethyl starch over 30 min | yes | Tidal = 8 mL/kg, PEEP = 5 cm H2O | Obs | Italy | August 2008–July 2009 |
| Machare-Delgado [24] | 2011 | IVC | IVC-d | US, M-mode | 2 cm upstream of the origin of hepatic vein | SVI | ECHO | ICU, vasopressor dependent with MV | SVI = 10% | 500 mL NS over 10 min | yes | Tidal = 8 mL/kg, PEEP = 6.8 ± 2.8 cm H2O | Obs | USA | NR |
| Muller [25] | 2012 | IVC | IVC-c | US, M-mode | 2–3 cm upstream of the origin of hepatic vein | VTI | ECHO | ICU, adult, spontaneous breathing with ACF | subaortic VTI = 10% | 500 mL of 6% hydroxyethyl starch over 15 min | no | Obs | France | April 2009–April 2011 | |
| Lanspa [26] | 2013 | IVC | IVC-c | US, M-mode | 0.5–3 cm upstream of the origin of hepatic vein | CI | ECHO | ICU, adult, septic shock, spontaneous breathing | CI = 15% | 10 mL/kg of crystalloid over a period of less than 20 min | no | Obs | USA | January 2010–April 2011 | |
| Charbonneau [27] | 2014 | IVC | IVC-d | US, M-mode | Just upstream of the origin of hepatic vein | CI | ECHO | ICU, adult, septic shock with MV | CO = 15% | 7 mL/kg of 6% hydroxyethyl starch over 15 min | yes | Tidal = 8 to 10 mL/kg | Obs | France | NR |
| de Valk [28] | 2014 | IVC | IVC-c | US, M-mode | 3 cm upstream of the origin of hepatic vein | SBP | Non-invasive BP measurement | ED, adult, spontaneous breathing with sign of shock | SBP = 10mmHg | 500 mL NS over 15 min | no | Obs | Netherlands | NR | |
| Guarracino [29] | 2014 | IJV | IJV-d | US, M-mode | At the cricoid cartilage level | CI | PRAM | ICU, adult, sepsis, MV | CI = 15% | 7 mL/kg of crystalloid over 30 min | yes | Tidal = 6 to 8 mL/kg, PEEP = 6 cm H2O | Obs | USA | October 2012–December 2013 |
| Airapetian [30] | 2015 | IVC | IVC-c | US, M-mode | 2 cm upstream of the origin of hepatic vein | CO | ECHO | ICU, adult, spontaneous breathing decided to perform volume expansion | CO = 10% | PLR, 500 mL NS over 15 min | no | Obs | France | NR | |
| de Oliveira [31] | 2016 | IVC | IVC-d | US, M-mode | Just upstream of the origin of hepatic vein | VTI | ECHO | ICU, adult, MV, immediate perioperative period within the first 24 h | VTI = 15% | 500 mL NS over 15 min | yes | Tidal = 8 mL/kg | Obs | Brazil | February 2013–September 2014 |
| Sobczk [32] | 2016 | IVC | IVC-d | US, M-mode | Just upstream of the origin of hepatic vein | CO | ECHO | ICU, adult, coronary bypass grafting, MV | CO = 15% | 250 mL NS | yes | Tidal = 8 mL/kg, PEEP = 4.5 cm H2O | Obs | Poland | NR |
| Theerawit [33] | 2016 | IVC | IVC-d | US, M-mode | 2 cm upstream of the origin of hepatic vein | CO | Vigileo/FloTrac monitor | ICU, adult, septic shock | CO = 15% | 1000 mL of crystalloid over 1 h or 500 mL of colloid (6% hydroxyethyl starch or 5% human albumin) over 30 min | yes | Tidal ≥ 8 mL/kg, PEEP = 8 to 10 cm H2O | Obs | Thailand | November 2012–December 2013 |
| Zhang [34] | 2016 | IVC | IVC-d | US, M-mode | 2 cm upstream of the origin of hepatic vein | SVI | Vigileo/FloTrac monitor | OR, adult, Anesthesia for gastrointestinal surgery, ASA I or II | SVI = 15% | 7 mL/kg of 6% hydroxyethyl starch over 30 min | yes | Tidal = 8 to 10 mL/kg | Obs | China | NR |
| Corl [35] | 2017 | IVC | IVC-c | US, M-mode | Just upstream of the origin of hepatic vein | CI | NICOM | ICU, adult, spontaneous breathing, acute circulatory failure | CI = 10% | 3 min PLR, 500 mL NS bolus | no | Obs | USA, two hospitals | August 2014–July 2016 | |
| Haliloğlu [36] | 2017 | IVC | IVC-c | US, B-mode | IVC—0.5 to 3cm upstream of the origin of hepatic vein | CI | USCOM | ICU, adult, sepsis, spontaneous breathing | CI = 15% | PLR | no | Obs | Turkey | NR | |
| IJV | IJV-c | US, B-mode | IJV—at the cricoid cartilage level | CI | USCOM | ICU, adult, sepsis, spontaneous breathing | CI = 15% | PLR | no | Obs | Turkey | NR | |||
| Lu [37] | 2017 | IVC | IVC-d | US, M-mode | 2 cm upstream of the origin of hepatic vein | CI | PiCCO | ICU, adult, septic shock, MV | CI = 10% | 200 mL NS over 10 min | yes | Tidal = 8 to 10 mL/kg, PEEP = 5 to 12 cm H2O | Obs | China | January 2012–December 2015 |
| Piskin [38] | 2017 | IVC | IVC-d | US | NR | CI | ECHO | ICU, adult, MV | CI = 15% | PLR | yes | Tidal = 8 mL/kg | Obs | Turkey | April 2016–November 2016 |
| Preau [39] | 2017 | IVC | IVC-c | US, M-mode | 1.5 to 2 cm upstream of the origin of hepatic vein | SVI | ECHO | ICU, adult, spontaneous breathing, sepsis, acute circulatory failure | SVI = 10% | 500 mL of 4% gelatin over 30 min | no | Obs | France, two hospitals | November 2011–January 2014 | |
| Bortolotti [40] | 2018 | IVC | IVC-c | US | 1.5 to 2 cm upstream of the origin of hepatic vein | VTI | ECHO | ICU, adult, spontaneous breathing, infection, acute circulatory failure, cardiac arrythmia | VTI = 10% | 500 mL of 4% gelatin over 30 min | no | Obs | France, two hospitals | May 2012–May 2015 | |
| Giraud [41] | 2018 | SCV | SCV-c | US, M-mode | Clavicle | CO | PiCCO | ICU, adult, MV | CO = 15% | 500 mL NS over 10 min | yes | NR | Obs | Swiss | 2009–2010 |
| Ma [42] | 2018 | IVC | IVC-v | US, M-mode | 2cm from right atrium | SV | Vigileo/FloTrac monitor | ICU, adult who underwent cardiac surgery, circulatory instability | SV = 15% | PLR, 500 mL Gelofusine over 300 min | yes | Tidal = 8 mL/kg, PEEP = 5 cm H2O | Obs | China | August 2016–December 2016 |
| IJV | IJV-v | US, M-mode | At the cricoid cartilage level | SV | Vigileo/FloTrac monitor | ICU, adult who underwent cardiac surgery, circulatory instability | SV = 15% | PLR, 500 mL Gelofusine over 300 min | yes | Tidal = 8 mL/kg, PEEP = 5 cm H2O | Obs | China | August 2016–Dec ember 2016 | ||
| Wang [43] | 2018 | IVC | IVC-v | US, M-mode | 2 cm from right atrium | CI | PiCCO | ICU, adult, MV, postpneumonectomy, requiring fluid resuscitation | CI = 15% | 7 mL/kg of 6% hydroxyethyl starch over 30 min | yes | Tidal = 8 to 12 mL/kg, PEEP = 5 to 10 cm H2O | Obs | China | August 2014–December 2016 |
| Corl [44] | 2019 | IVC | IVC-c | US, B-mode | 3 cm from right atrium | CI | NICOM | ICU, adult, acute circulatory failure, spontaneous breathing | CI = 10% | 500 mL NS bolus | no | Obs | USA | November 2016–July 2018 | |
| He [45] | 2019 | IVC | IVC-d | US, M-mode | 2 to 3 cm from right atrium | VTI | ECHO | OR, adult, general anesthesia, elective surgery mechanical ventilation | VTI = 15% | 6 mL/kg of 4% gelatin over 10 min | yes | Tidal = 6, 9, 12 mL/kg | Obs | China | June 2018–September 2018 |
| Yao [46] | 2019 | IVC | IVC-d | US, B-mode | 2 to 3 cm from right atrium | CO | CNAP | ICU, adult, MV | CO = 10% | PLR | yes | Tidal = 7.6 mL/kg (responder), 7.8 mL/kg (non-responder); PEEP = 5 cm H2O | Obs | China | December 2017–March 2018 |
| Zhang [47] | 2019 | IVC | IVC-d | US, M-mode | Just upstream of the origin of the supraheptic vein | VTI | ECHO | ICU, adult, MV, need of an assessment of fluid responsiveness | VTI = 10% | PLR | yes | NR | Obs | China | July 2018–January 2019 |
| Caplan [48] | 2020 | IVC | IVC-c | US, B-mode | 1, 3, 4, 5 cm from aortocaval junction | SVI | ECHO | ICU, adult, sepsis, acute circulatory failure, two cohort (normal sinus rhythm and arrythmia), spontaneous breathing | SVI = 10% | 500 mL of 4% gelatin over 30 min | no | Obs | France | November 2011–May 2015 | |
| McGregor [49] | 2020 | IVC | IVC-c | US, B-mode | 2 to 3 cm from right atrium | VTI | ECHO | ED, adult, IV fluid required, spontaneous breathing | VTI = 10% | 250–500 mL NS over 15 min or less | no | Obs | UK | NR | |
| Blavius [50] | 2021 | IVC | IVC-c | US | NR | CI | Non-invasive cardiac output monitoring | ICU, adult, critically ill patients, spontaneous breathing | CI = 10% | 500 mL NS bolus | no | Obs | USA | NR |
| Author | Year | Target Vein | TP | FP | FN | TN | Sen | Spe | AUROC | n | Threshold (Index Test) |
|---|---|---|---|---|---|---|---|---|---|---|---|
| Barbier [21] | 2004 | IVC | 9 | 1 | 1 | 9 | 0.90 | 0.90 | 0.910 | 20 | ΔIVC = 18% |
| Feissel [22] | 2004 | IVC | 14 | 1 | 2 | 22 | 0.88 | 0.96 | NR | 39 | ΔIVC = 12% |
| Moretti [23] | 2010 | IVC | 12 | 0 | 5 | 12 | 0.71 | 1.00 | 0.902 | 29 | ΔIVC = 16% |
| Machare-Delgado [24] | 2011 | IVC | 8 | 8 | 0 | 9 | 1.00 | 0.53 | 0.816 | 25 | ΔIVC = 12% |
| Muller [25] | 2012 | IVC | 14 | 4 | 6 | 16 | 0.70 | 0.80 | 0.770 | 40 | ΔIVC = 40% |
| Lanspa [26] | 2013 | IVC | 5 | 3 | 0 | 6 | 1.00 | 0.67 | 0.840 | 14 | ΔIVC = 15% |
| Charbonneau [27] | 2014 | IVC | 10 | 7 | 16 | 11 | 0.38 | 0.61 | 0.430 | 44 | ΔIVC = 21% |
| de Valk [28] | 2014 | IVC | 10 | 11 | 2 | 22 | 0.83 | 0.67 | 0.741 | 45 | ΔIVC = 36.5% |
| Guarracino [29] | 2014 | IJV | 24 | 1 | 6 | 19 | 0.80 | 0.95 | 0.915 | 50 | ΔIJV = 18% |
| Airapetian [30] | 2015 | IVC | 9 | 1 | 20 | 29 | 0.31 | 0.97 | 0.620 | 59 | ΔIVC = 49% |
| de Oliveira [31] | 2016 | IVC | 6 | 0 | 3 | 11 | 0.67 | 1.00 | 0.840 | 20 | ΔIVC = 16% |
| Sobczk [32] | 2016 | IVC | 20 | 3 | 4 | 8 | 0.83 | 0.73 | 0.739 | 35 | ΔIVC = 18% |
| Theerawit [33] | 2016 | IVC | 12 | 3 | 4 | 10 | 0.75 | 0.77 | 0.688 | 29 | ΔIVC = 10.7% |
| Zhang [34] | 2016 | IVC | 18 | 1 | 8 | 13 | 0.69 | 0.93 | 0.850 | 40 | ΔIVC = 46% |
| Corl [35] | 2017 | IVC | 53 | 12 | 8 | 51 | 0.87 | 0.81 | 0.840 | 124 | ΔIVC = 25% |
| Haliloğlu [36] | 2017 | IVC | 18 | 3 | 5 | 18 | 0.78 | 0.86 | 0.825 | 44 | ΔIVC = 35% |
| IJV | 18 | 3 | 5 | 18 | 0.78 | 0.86 | 0.825 | 44 | ΔIJV = 36% | ||
| Lu [37] | 2017 | IVC | 18 | 5 | 9 | 17 | 0.67 | 0.77 | 0.805 | 49 | ΔIVC = 20% |
| Piskin [38] | 2017 | IVC | 32 | 4 | 8 | 28 | 0.80 | 0.88 | 0.928 | 72 | ΔIVC = 23.08% |
| Preau [39] | 2017 | IVC | 38 | 5 | 12 | 35 | 0.76 | 0.88 | 0.820 | 90 | ΔIVC = 31% |
| Bortolotti [40] | 2018 | IVC | 19 | 4 | 10 | 22 | 0.66 | 0.85 | 0.820 | 55 | ΔIVC = 37% |
| Giraud [41] | 2018 | SCV | 9 | 1 | 0 | 10 | 1.00 | 0.91 | 0.970 | 20 | ΔSVC = 13.4% |
| Ma [42] | 2018 | IVC | 30 | 5 | 5 | 30 | 0.86 | 0.86 | 0.830 | 70 | ΔIVC = 13.39% |
| IJV | 32 | 6 | 3 | 29 | 0.91 | 0.83 | 0.880 | 70 | ΔIJV = 12.99% | ||
| Wang [43] | 2018 | IVC | 8 | 1 | 2 | 7 | 0.80 | 0.88 | 0.860 | 18 | ΔIVC = 15% |
| Corl [44] | 2019 | IVC–expert | 38 | 9 | 6 | 32 | 0.86 | 0.78 | 0.820 | 85 | ΔIVC = 25% |
| IVC-novice | 35 | 13 | 9 | 28 | 0.70 | 0.68 | 0.690 | 85 | ΔIVC = 25% | ||
| He [45] | 2019 | IVC-tidal 6mL/kg | 26 | 10 | 12 | 31 | 0.68 | 0.76 | 0.710 | 79 | ΔIVC = 11.1% |
| IVC-tidal 9mL/kg | 21 | 5 | 17 | 36 | 0.55 | 0.88 | 0.790 | 79 | ΔIVC = 15.3% | ||
| IVC-tidal 12mL/kg | 20 | 5 | 18 | 36 | 0.53 | 0.88 | 0.730 | 79 | ΔIVC = 13.4% | ||
| Yao [46] | 2019 | IVC | 17 | 3 | 20 | 27 | 0.46 | 0.90 | 0.702 | 67 | ΔIVC = 25.6% |
| Zhang [47] | 2019 | IVC | 47 | 6 | 10 | 38 | 0.82 | 0.86 | 0.815 | 101 | ΔIVC = 14.5% |
| Caplan [48] | 2020 | IVC | 31 | 9 | 10 | 31 | 0.76 | 0.77 | 0.820 | 81 | ΔIVC = 20% |
| McGregor [49] | 2020 | IVC | 9 | 4 | 10 | 7 | 0.47 | 0.64 | 0.464 | 30 | ΔIVC = 40% |
| Blavius [50] | 2021 | IVC—training set | 71 | 19 | 13 | 72 | 0.85 | 0.79 | 0.820 | 175 | ΔIVC = 25% |
| IVC—test set | 8 | 0 | 1 | 11 | 0.89 | 1.00 | 0.940 | 20 | ΔIVC = 25% |
| Subgroup by Moderator | Pooled Sen (95% CI) | Pooled Spe (95% CI) | Pooled PLR (95% CI) | Pooled NLR (95% CI) | Pooled DOR (95% CI) | AUROC (95% CI) | Meta -Regression Test (p Value) |
|---|---|---|---|---|---|---|---|
| ΔIVC ≥ 20% | 0.07 | ||||||
| yes (k = 16) [25,27,28,30,34,35,36,37,38,39,40,44,46,48,49,50] | 0.70 (0.61–0.78) | 0.81 (0.78–0.85) | 3.86 (3.12–4.76) | 0.36 (0.27–0.48) | 10 (7–16) | 0.84 (0.80–0.87) | |
| no (k = 12) [21,22,23,24,26,31,32,33,42,43,45,47] | 0.81 (0.72–0.88) | 0.85 (0.77–0.91) | 5.42 (3.61–8.14) | 0.22 (0.15–0.33) | 25 (14–42) | 0.90 (0.87–0.92) | |
| Using IVC collapsibility index | 0.58 | ||||||
| yes (k = 12) [25,26,28,30,35,36,39,40,44,48,49,50] | 0.76 (0.65–0.84) | 0.81 (0.76–0.86) | 4.10 (3.30–5.10) | 0.30 (0.20–0.43) | 14 (9–22) | 0.85 (0.82–0.88) | |
| no (k = 16) [21,22,23,24,27,31,32,33,34,37,38,42,43,45,46,47] | 0.74 (0.65–0.81) | 0.85 (0.79–0.90) | 5.06 (3.36–7.55) | 0.31 (0.22–0.42) | 17 (9–31) | 0.87 (0.84–0.90) | |
| Using echocardiography as a reference test | 0.68 | ||||||
| yes (k= 17) [21,22,24,25,26,27,30,31,32,36,38,39,40,45,47,48,49] | 0.73 (0.63–0.81) | 0.83 (0.77–0.88) | 4.39 (3.13–6.14) | 0.33 (0.24–0.46) | 13 (8–24) | 0.86 (0.83–0.89) | |
| no (k = 11) [23,28,33,34,35,37,42,43,44,46,50] | 0.78 (0.69–0.85) | 0.82 (0.77–0.87) | 4.40 (3.40–5.80) | 0.27 (0.19–0.37) | 16 (10–26) | 0.87 (0.84–0.90) | |
| ICU patient | 0.22 | ||||||
| yes (k = 24) [21,22,23,24,25,26,27,29,30,31,32,33,35,36,37,38,39,40,41,42,43,44,46,47,48,50] | 0.76 (0.69–0.82) | 0.83 (0.80–0.86) | 4.60 (3.80–5.50) | 0.28 (0.22–0.37) | 16 (11–23) | 0.87 (0.83–0.89) | |
| no (ED, OR) (k = 4) [28,34,45,49] | 0.62 (0.50–0.73) | 0.80 (0.66–0.89) | 3.00 (1.70–5.30) | 0.48 (0.35–0.66) | 6 (3–14) | 0.70 (0.66–0.74) | |
| Sepsis patients | 0.81 | ||||||
| yes (k = 9) [21,22,26,27,33,36,37,39,48] | 0.75 (0.63–0.83) | 0.82 (0.73–0.88) | 4.13 (2.52–6.76) | 0.31 (0.20–0.49) | 13 (5–33) | 0.87 (0.83–0.92) | |
| no (k = 19) [23,24,25,28,29,30,31,32,34,35,38,40,41,42,43,44,45,46,47,49,50] | 0.75 (0.66–0.82) | 0.84 (0.79–0.88) | 4.77 (3.77–6.03) | 0.30 (0.22–0.40) | 16 (11–23) | 0.88 (0.84–0.90) | |
| Fluid challenge | 0.34 | ||||||
| PLR only (k = 4) [36,38,46,47] | 0.73 (0.57–0.85) | 0.88 (0.80–0.92) | 5.90 (3.60–9.50) | 0.30 (0.18–0.52) | 19 (8–44) | 0.89 (0.86–0.91) | |
| Fluid infusion (k = 24) [21,22,23,24,25,26,27,28,29,30,31,32,33,34,35,37,39,40,41,42,43,44,45,48,49,50] | 0.75 (0.68–0.81) | 0.82 (0.77–0.86) | 4.15 (3.31–5.22) | 0.31 (0.23–0.40) | 14 (9–20) | 0.86 (0.83–0.89) | |
| Mechanical Ventilation | 0.58 | ||||||
| yes (k16) [21,22,23,24,27,31,32,33,34,37,38,42,43,45,46,47] | 0.74 (0.65–0.81) | 0.85 (0.79–0.90) | 5.06 (3.39–7.54) | 0.31 (0.22–0.42) | 17 (9–31) | 0.87 (0.848–0.90) | |
| no (k = 12) [25,26,28,30,35,36,39,40,44,48,49,50] | 0.76 (0.65–0.84) | 0.81 (0.76–0.86) | 4.10 (3.30–5.10) | 0.30 (0.20–0.43) | 14 (9–22) | 0.85 (0.82–0.88) | |
| Mechanical Ventilation Setting (k = 15) [21,22,23,24,27,31,32,33,34,37,38,42,43,45,46] | 0.31 | ||||||
| Tidal < 8mL/kg or PEEP > 5 mmHg (k = 5) [24,33,37,43,46] | 0.73 (0.52–0.87) | 0.77 (0.62–0.88) | 3.24 (1.97–5.3) | 0.35 (0.19–0.64) | 9 (4–21) | 0.82 (0.35–0.97) | |
| Tidal ≥ 8mL/kg or PEEP ≤ 5 mmHg (k = 10) [21,22,23,27,31,32,34,38,42,45] | 0.74 (0.63–0.83 | 0.88 (0.81–0.93) | 6.19 (3.55–10.80) | 0.29 (0.19–0.45) | 21 (9–52) | 0.90 (0.17–1.00) | |
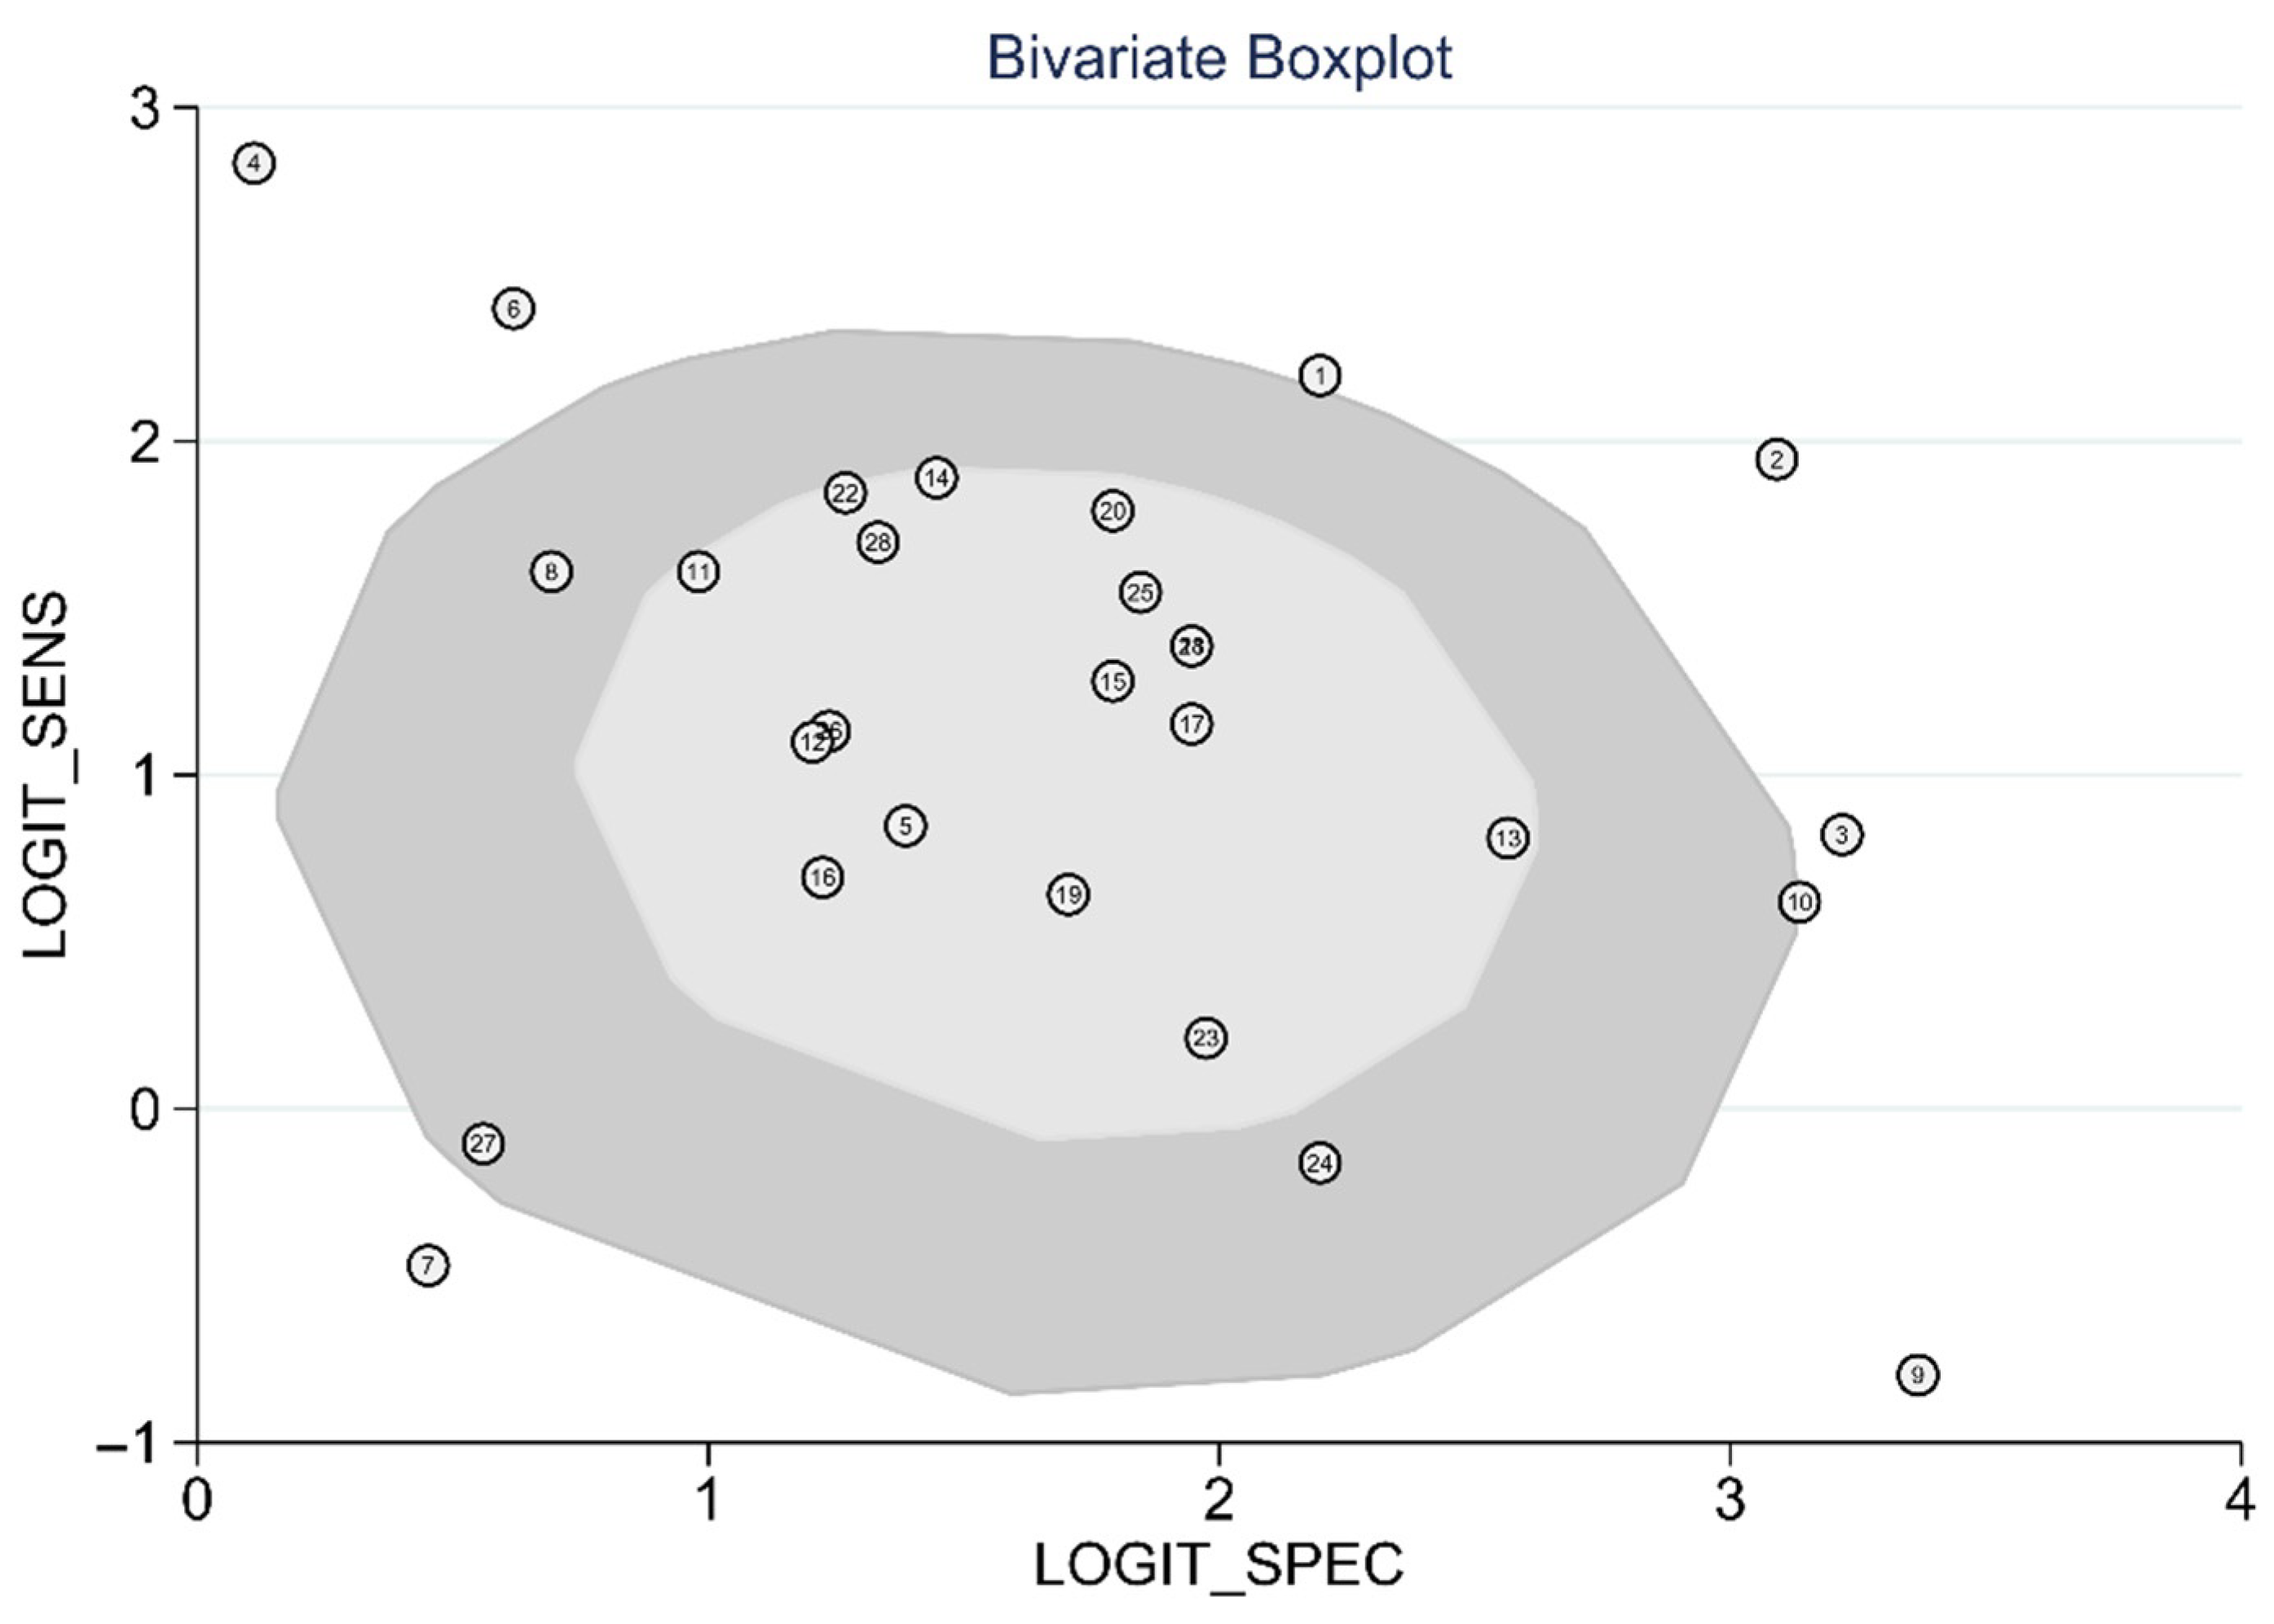
| Bivariate boxplot | 0.83 | ||||||
| inlier (k = 21) [21,22,23,24,26,27,30] | 0.75 (0.70–0.80) | 0.83 (0.79–0.86) | 4.32 (3.60–5.20) | 0.30 (0.24–0.37) | 14 (10–20) | 0.86 (0.42–0.98) | |
| outlier (k = 7) [25,28,29,31,32,33,34,35,36,37,38,39,40,41,42,43,44,45,46,47,48,49,50] | 0.80 (0.48–0.95) | 0.87 (0.66–0.96) | 6.02 (2.20–16.42) | 0.23 (0.07–0.73) | 27 (5–142) | 0.91 (0.17–1.00) |
Publisher’s Note: MDPI stays neutral with regard to jurisdictional claims in published maps and institutional affiliations. |
© 2021 by the authors. Licensee MDPI, Basel, Switzerland. This article is an open access article distributed under the terms and conditions of the Creative Commons Attribution (CC BY) license (https://creativecommons.org/licenses/by/4.0/).
Share and Cite
Kim, D.-W.; Chung, S.; Kang, W.-S.; Kim, J. Diagnostic Accuracy of Ultrasonographic Respiratory Variation in the Inferior Vena Cava, Subclavian Vein, Internal Jugular Vein, and Femoral Vein Diameter to Predict Fluid Responsiveness: A Systematic Review and Meta-Analysis. Diagnostics 2022, 12, 49. https://doi.org/10.3390/diagnostics12010049
Kim D-W, Chung S, Kang W-S, Kim J. Diagnostic Accuracy of Ultrasonographic Respiratory Variation in the Inferior Vena Cava, Subclavian Vein, Internal Jugular Vein, and Femoral Vein Diameter to Predict Fluid Responsiveness: A Systematic Review and Meta-Analysis. Diagnostics. 2022; 12(1):49. https://doi.org/10.3390/diagnostics12010049
Chicago/Turabian StyleKim, Do-Wan, Seungwoo Chung, Wu-Seong Kang, and Joongsuck Kim. 2022. "Diagnostic Accuracy of Ultrasonographic Respiratory Variation in the Inferior Vena Cava, Subclavian Vein, Internal Jugular Vein, and Femoral Vein Diameter to Predict Fluid Responsiveness: A Systematic Review and Meta-Analysis" Diagnostics 12, no. 1: 49. https://doi.org/10.3390/diagnostics12010049