Article

Prognostic Value of Baseline Radiomic Features of 18F-FDG PET in Patients with Diffuse Large B-Cell Lymphoma

1
Department of Medical Imaging and Radiological Sciences, Tzu Chi University of Science and Technology, Hualien 97005, Taiwan
2
Department of Hematology and Oncology, Hualien Tzu Chi Hospital, Buddhist Tzu Chi Medical Foundation, Hualien 97004, Taiwan
3
Department of Medicine, College of Medicine, Tzu Chi University, Hualien 97004, Taiwan
4
Medical Physics Research Center, Institute for Radiological Research, Chang Gung University/Chang Gung Memorial Hospital, Taoyuan 33302, Taiwan
5
Department of Radiation Oncology, Chang Gung Memorial Hospital, Taoyuan 33305, Taiwan
6
Department of Nuclear Medicine, Keelung Chang Gung Memorial Hospital, Keelung 20401, Taiwan
7
Institute of Medical Sciences, Tzu Chi University, Hualien 97004, Taiwan
8
Department of Nuclear Medicine, Hualien Tzu Chi Hospital, Buddhist Tzu Chi Medical Foundation, Hualien 97004, Taiwan
*
Author to whom correspondence should be addressed.
Diagnostics 2021, 11(1), 36; https://doi.org/10.3390/diagnostics11010036
Submission received: 23 November 2020 / Revised: 21 December 2020 / Accepted: 24 December 2020 / Published: 28 December 2020
(This article belongs to the Special Issue Radiomics in Oncology)

Abstract

:
This study investigates whether baseline 18F-FDG PET radiomic features can predict survival outcomes in patients with diffuse large B-cell lymphoma (DLBCL). We retrospectively enrolled 83 patients diagnosed with DLBCL who underwent 18F-FDG PET scans before treatment. The patients were divided into the training cohort (n = 58) and the validation cohort (n = 25). Eighty radiomic features were extracted from the PET images for each patient. Least absolute shrinkage and selection operator regression were used to reduce the dimensionality within radiomic features. Cox proportional hazards model was used to determine the prognostic factors for progression-free survival (PFS) and overall survival (OS). A prognostic stratification model was built in the training cohort and validated in the validation cohort using Kaplan–Meier survival analysis. In the training cohort, run length non-uniformity (RLN), extracted from a gray level run length matrix (GLRLM), was independently associated with PFS (hazard ratio (HR) = 15.7, p = 0.007) and OS (HR = 8.64, p = 0.040). The International Prognostic Index was an independent prognostic factor for OS (HR = 2.63, p = 0.049). A prognostic stratification model was devised based on both risk factors, which allowed identification of three risk groups for PFS and OS in the training (p < 0.001 and p < 0.001) and validation (p < 0.001 and p = 0.020) cohorts. Our results indicate that the baseline 18F-FDG PET radiomic feature, RLNGLRLM, is an independent prognostic factor for survival outcomes. Furthermore, we propose a prognostic stratification model that may enable tailored therapeutic strategies for patients with DLBCL.

1. Introduction

Diffuse large B-cell lymphoma (DLBCL) is the most common type of lymphoma, accounting for approximately one-third of non-Hodgkin lymphomas [1]. DLBCL is a heterogeneous group of lymphomas with variable survival rates. The cure rate of DLBCL has improved substantially due to advances in disease management, and the addition of rituximab immunotherapy to conventional cyclophosphamide, hydroxydaunorubicin (doxorubicin or epirubicin), oncovin (vincristine), and prednisolone chemotherapy (R-CHOP) is effective in 60–70% of patients [2]. However, approximately 30–40% of patients still suffer relapse or refectory disease [3]. New prognostic factors for personalized risk-adapted treatment is currently an unmet clinical need, and may improve the outcomes of patients with DLBCL.
The International Prognostic Index (IPI) has been the basis for determining prognosis for DLBLC in clinical practice for the past 20 years [4,5]. In addition to IPI, 18F-fluorodeoxyglucose (18F-FDG) positron emission tomography/computed tomography (PET/CT) is a standard imaging modality for patients with DLBLC. 18F-FDG PET is highly sensitive for detecting lymphoma, and plays a crucial role in disease staging and therapy monitoring, which has allowed personalized therapeutic decision making [6]. The total metabolic tumor volume (MTV) derived from baseline 18F-FDG PET has been shown to be associated with survival outcomes in patients with DLBCL [7,8,9,10,11,12], and novel PET imaging-derived biomarkers may further individualize the treatment of lymphoma.
Tumor heterogeneity is a pivotal prognostic factor in cancer progression, recurrence, and therapeutic resistance [13]. Moreover, tumor heterogeneity plays an important role in patient outcomes, and is correlated with tumor aggressiveness, metastasis, and molecular profiles [14,15]. Radiomic analysis can be used to assess tumor heterogeneity, and may assist with clinical outcome prognostication [16]. High-throughput radiomic features are extracted from medical images, and can reveal complex mathematical patterns in the spatial distribution of signal intensity values that are not observed visually. Radiomic analysis promotes diagnostic, predictive, and prognostic power to facilitate better clinical decision making [17]. Radiomic features have been widely explored to pursue personalized medicine in various oncology studies [18,19,20,21,22,23]; however, there is limited evidence relating to their role as prognostic factors in DLBCL [24,25].
Therefore, this study aimed to assess the prognostic value of radiomic features derived from baseline 18F-FDG PET in terms of survival outcomes. Moreover, we investigated the feasibility of combining clinical variables and radiomic features for the prognostic stratification of patients with DLBCL.

2. Materials and Methods

2.1. Patient Population

This study was conducted according to the Declaration of Helsinki guidelines, and approved by the Institutional Review Board and Research Ethics Committee of Hualien Tzu Chi Hospital, Buddhist Tzu Chi Medical Foundation (IRB108–251-B; 10 December 2019). The need for informed consent was waived given the retrospective nature of the study. Between September 2004 and June 2019, 83 patients with a pathological diagnosis of DLBCL who underwent pre-treatment 18F-FDG PET/CT were retrospectively enrolled. All patients received either R-CHOP chemotherapy or R-CVP (rituximab, cyclophosphamide, vincristine, prednisone) chemotherapy, or rituximab monotherapy in patients with a low tumor burden. Electronic charts were carefully reviewed for each patient, and data regarding patient demographics, disease characteristics, clinical course, therapy modalities, and patient outcomes were collected. All patients underwent a complete medical history, physical examination, laboratory tests, bone marrow aspiration, CT scan, and 18F-FDG PET/CT. The patient’s age at disease onset, Ann Arbor stage, Eastern Cooperative Oncology Group performance status, lactate dehydrogenase (LDH) level, and extranodal involvement were recorded for calculation of the IPI score [5]. Bulky disease was defined as a nodal mass larger than 10 cm in diameter.

2.2. Patient Follow-Up Evaluation

Initial treatment of rituximab-based chemotherapy with or without involved-field radiotherapy was conducted to the patients with DLBCL under the Clinical Practice Guidelines of the National Comprehensive Cancer Network in Oncology. Disease status was evaluated by CT or 18F-FDG PET/CT scan following treatment. Follow-up assessment was performed every 3 months for the first 2 years, and 6 to 12 months thereafter. The enrolled patients were followed up until disease progression or death, and these cases were counted as an event. Progression-free survival (PFS) was defined as the time from the date of diagnosis to the date of the first relapse, progression, or death from any cause. Overall survival (OS) was defined as the time from diagnosis until death from any cause [26]. Patients who did not suffer an event were censored at the date of the last known follow-up.

2.3. 18F-FDG PET/CT Scan

Patients fasted for at least 4 h before the examination and had blood glucose levels less than 150 mg/dL. Patients were injected intravenously with 5 MBq/kg of 18F-FDG, and PET/CT scans were performed 45 min after administration using a GE Discovery ST scanner (GE Healthcare, Milwaukee, WI, USA). PET images were acquired from the midthigh to the vertex in a static 3-dimensional mode. A CT scan without intravenous contrast medium enhancement was performed immediately prior to the PET imaging for attenuation correction. PET images were reconstructed with an ordered-subset expectation maximization algorithm (2 iterations, 21 subsets, and a 2.14-mm full width at half maximum Gaussian post-filter). The reconstructed PET image has a matrix size of 128 × 128, a pixel size of 5.47 × 5.47 mm, and a slice thickness of 3.27 mm.

2.4. Feature Extraction and Selection

18F-FDG PET images were interpreted by an expert nuclear medicine physician. To avoid interobserver variations, all images were analyzed by the same reviewer using OsiriX software (Pixmeo, Geneva, Switzerland) [27]. The results were confirmed by the other experienced nuclear medicine physician. 18F-FDG-avid lesions were segmented on PET images by applying the region-growing algorithm with a standardized uptake value (SUV) threshold above 2.5 for target delineation [28]. The SUV-based volumes of interest were used to compute quantitative radiomic features in PET images.
The radiomic features included 19 first-order features and 61 textural features. The first-order parameters were calculated on the basis of SUV statistics. The textural features were computed from a gray level co-occurrence matrix, gray level run length matrix (GLRLM), gray level size zone matrix (GLSZM), and neighboring gray tone difference matrix using a fixed bin width of 0.25. A total of 80 radiomic features (Supplementary Table S1) were extracted from PET images using the Pyradiomics open-source software package version 2.2.0 (Harvard Medical School, Boston, MA, USA) [29]. Radiomic features calculated by this package complies with the feature definitions described by the Imaging Biomarker Standardization Initiative (IBSI) [30,31].
To reduce dimensionality within the radiomic features, reliable features were chosen with low sensitivity to the intraclass correlation coefficient (ICC) following the literature report [32]. Subsequently, the least absolute shrinkage and selection operator (LASSO) regression algorithm [33] was employed for the chosen features. A five-fold cross-validation scheme was applied to tune the parameters of Lambda. The optimal Lambda value was identified by the minimum cross-validated criterion and the minimum criterion within one standard error. Using this method, the regression coefficients of irrelevant features were regularized to zero, and the remaining nonzero coefficients of the radiomic features were selected.

2.5. Statistical Analysis

The primary endpoints of this study were PFS and OS. Clinical variables and image features from the radiomic analysis were tested as potential prognostic factors. Two independent datasets were needed to build and validate the model. The data of 83 patients were randomly divided into two cohorts: 58 patients (70%) to the training dataset, and the remaining 25 patients (30%) to the validation dataset. Chi-square tests were used to compare the categorical variables between the training and validation cohorts. Receiver operating characteristic (ROC) curves were used to define the optimal cut-off values of the radiomic features by maximizing the sensitivity and specificity based on the Youden index. Cox proportional hazards regression models were used to identify the prognostic factors of PFS and OS in the training dataset. The statistically significant variables in the univariate Cox analysis were included in the stepwise multivariate Cox regression models. In both training and validation datasets, the survival curve was plotted using the Kaplan–Meier method, and the survival difference between the subgroups was assessed using a log-rank test. All statistical tests were two-sided, with a significance level of 0.05. Statistical analyses were performed using MedCalc statistical software version 19.4.1 (MedCalc Software, Ostend, Belgium) and R open-source statistical software version 3.5.2 (R Foundation, Vienna, Austria).

3. Results

3.1. Patient Characteristics

A total of 83 patients met the criteria for enrolment in the study; among whom, 65 patients were treated with the R-CHOP chemotherapy regimen, 13 with R-CVP, and 5 with rituximab monotherapy. In addition, 18 patients received involved-field radiotherapy. The median follow-up period was 41.7 months; at the time of the analysis, 35 patients (42%) suffered disease relapse or progression at a median of 9.8 months after diagnosis, and 29 patients (35%) died of the disease at a median of 10.7 months. The 5-year PFS rate was 52.3%, and the 5-year OS rate was 60.3% in the entire study population. The clinical characteristics of the patients are outlined in Table 1. No significant differences were found between the training and validation datasets (p = 0.111–0.755).

3.2. Feature Selection in the Training Cohort

The twelve radiomic features (Supplementary Table S2) with low sensitivity to the ICC (<1.10) were chosen according to the literature report [32]. These reliable features were chosen for further LASSO analysis. Based on the LASSO results (Supplementary Figure S1), MTV, gray level non-uniformity (GLN), and run length non-uniformity (RLN) both from GLRLM with nonzero regression coefficients were selected as potential prognostic factors for PFS and OS. From ROC curves, the cut-off value of MTV was 137 cm3, GLNGLRLM was 68, and RLNGLRLM was 1449. These cut-off values were used to stratify patients into those with good or poor survival outcomes.

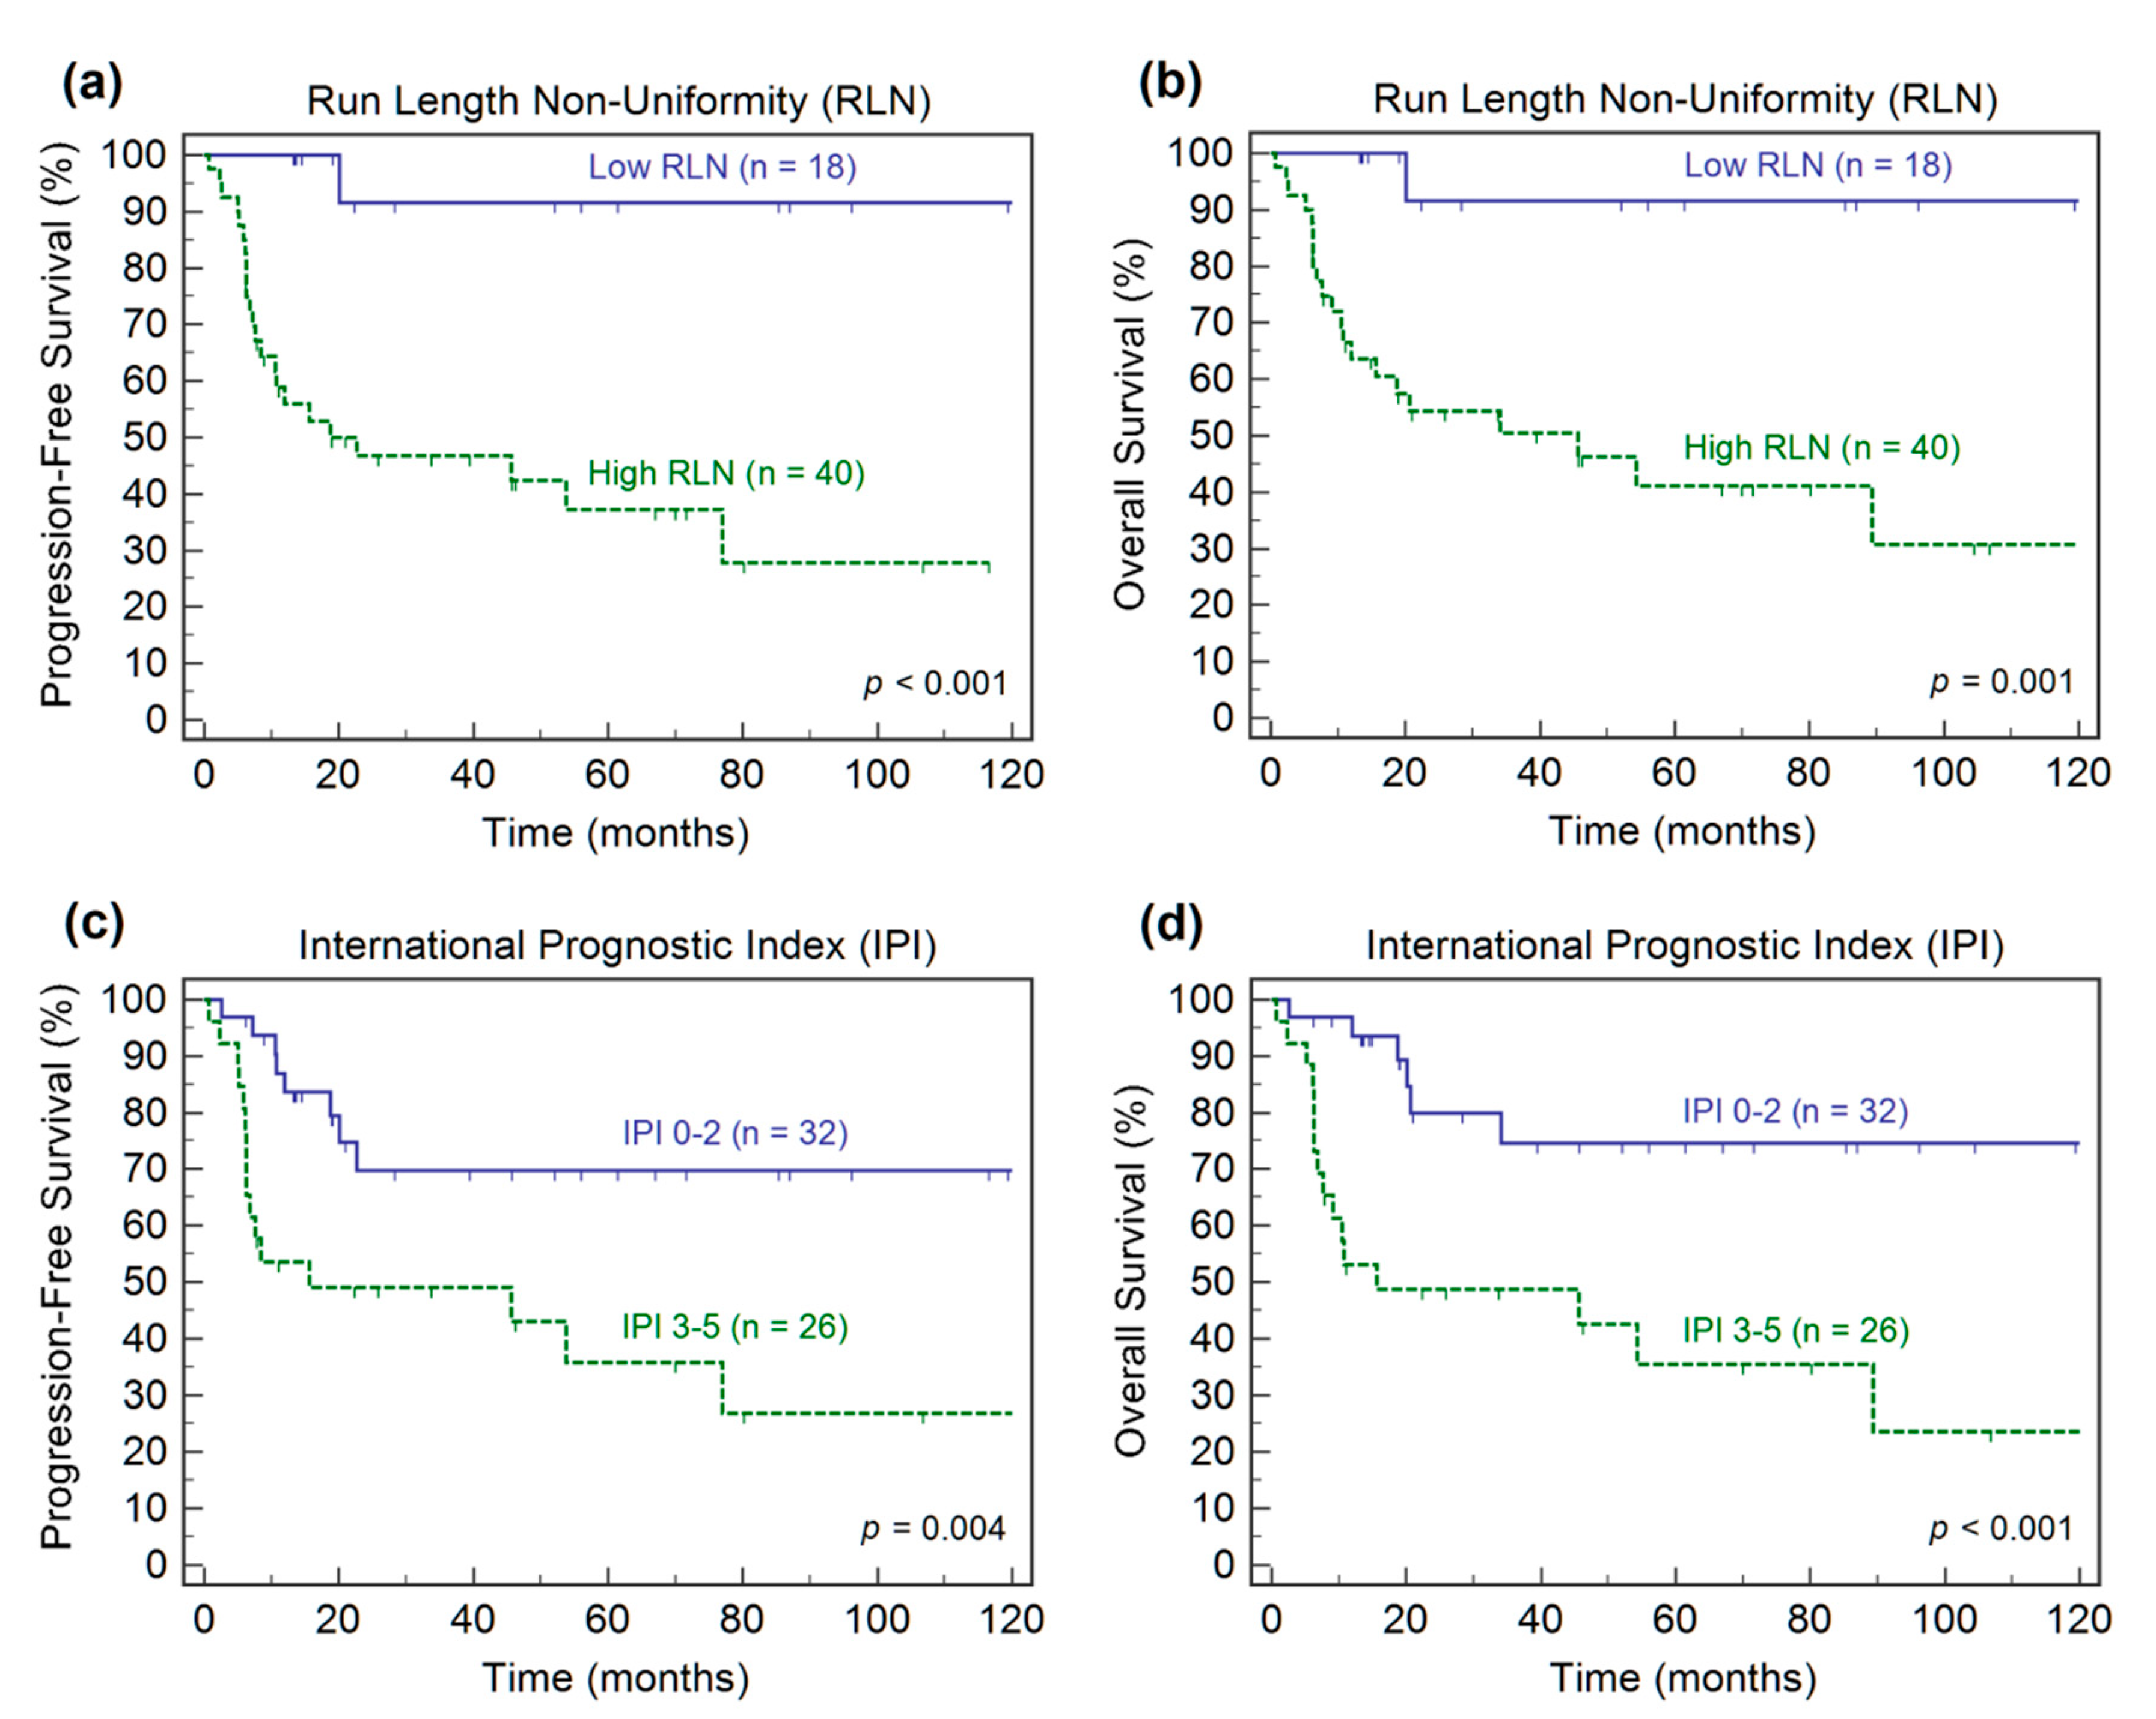
3.3. Survival Analyses in the Training Cohort

The results of univariate and multivariate Cox regression analyses for the clinical variables and PET parameters are presented in Table 2 and Table 3, respectively. In the univariate analysis, the disease stage, LDH, IPI score, bulky disease of clinical variables, MTV, GLNGLRLM, and RLNGLRLM of radiomic features were associated with PFS. Meanwhile, LDH, IPI, MTV, GLNGLRLM, and RLNGLRLM were related to OS. These variables were entered into the multivariate Cox regression model. After multivariate analysis, RLNGLRLM remained a prognostic factor for PFS, whereas the IPI and RLNGLRLM maintained their prognostic significance for OS.
Kaplan–Meier survival analysis confirmed that the IPI score and RLNGLRLM were predictive factors for both PFS and OS (Figure 1). The 5-year estimate of PFS was 35.8% in the high-risk IPI group compared to 69.8% in the low-risk IPI group. Patients with high-risk IPI scores had a 5-year OS of 35.5%, while patients with low-risk IPI scores had a 5-year OS of 74.6%. The high RLNGLRLM patients had more aggressive disease, a greater risk of relapse or progression, and a lower survival rate compared to patients with low RLNGLRLM. Patients with a high RLNGLRLM had a 5-year PFS of 37.2%, whereas patients with a low RLNGLRLM had a 5-year PFS of 91.7%. Moreover, patients with a high RLNGLRLM had a 5-year OS of 41.1%, whereas patients with a low RLNGLRLM had a 5-year OS of 91.7%.

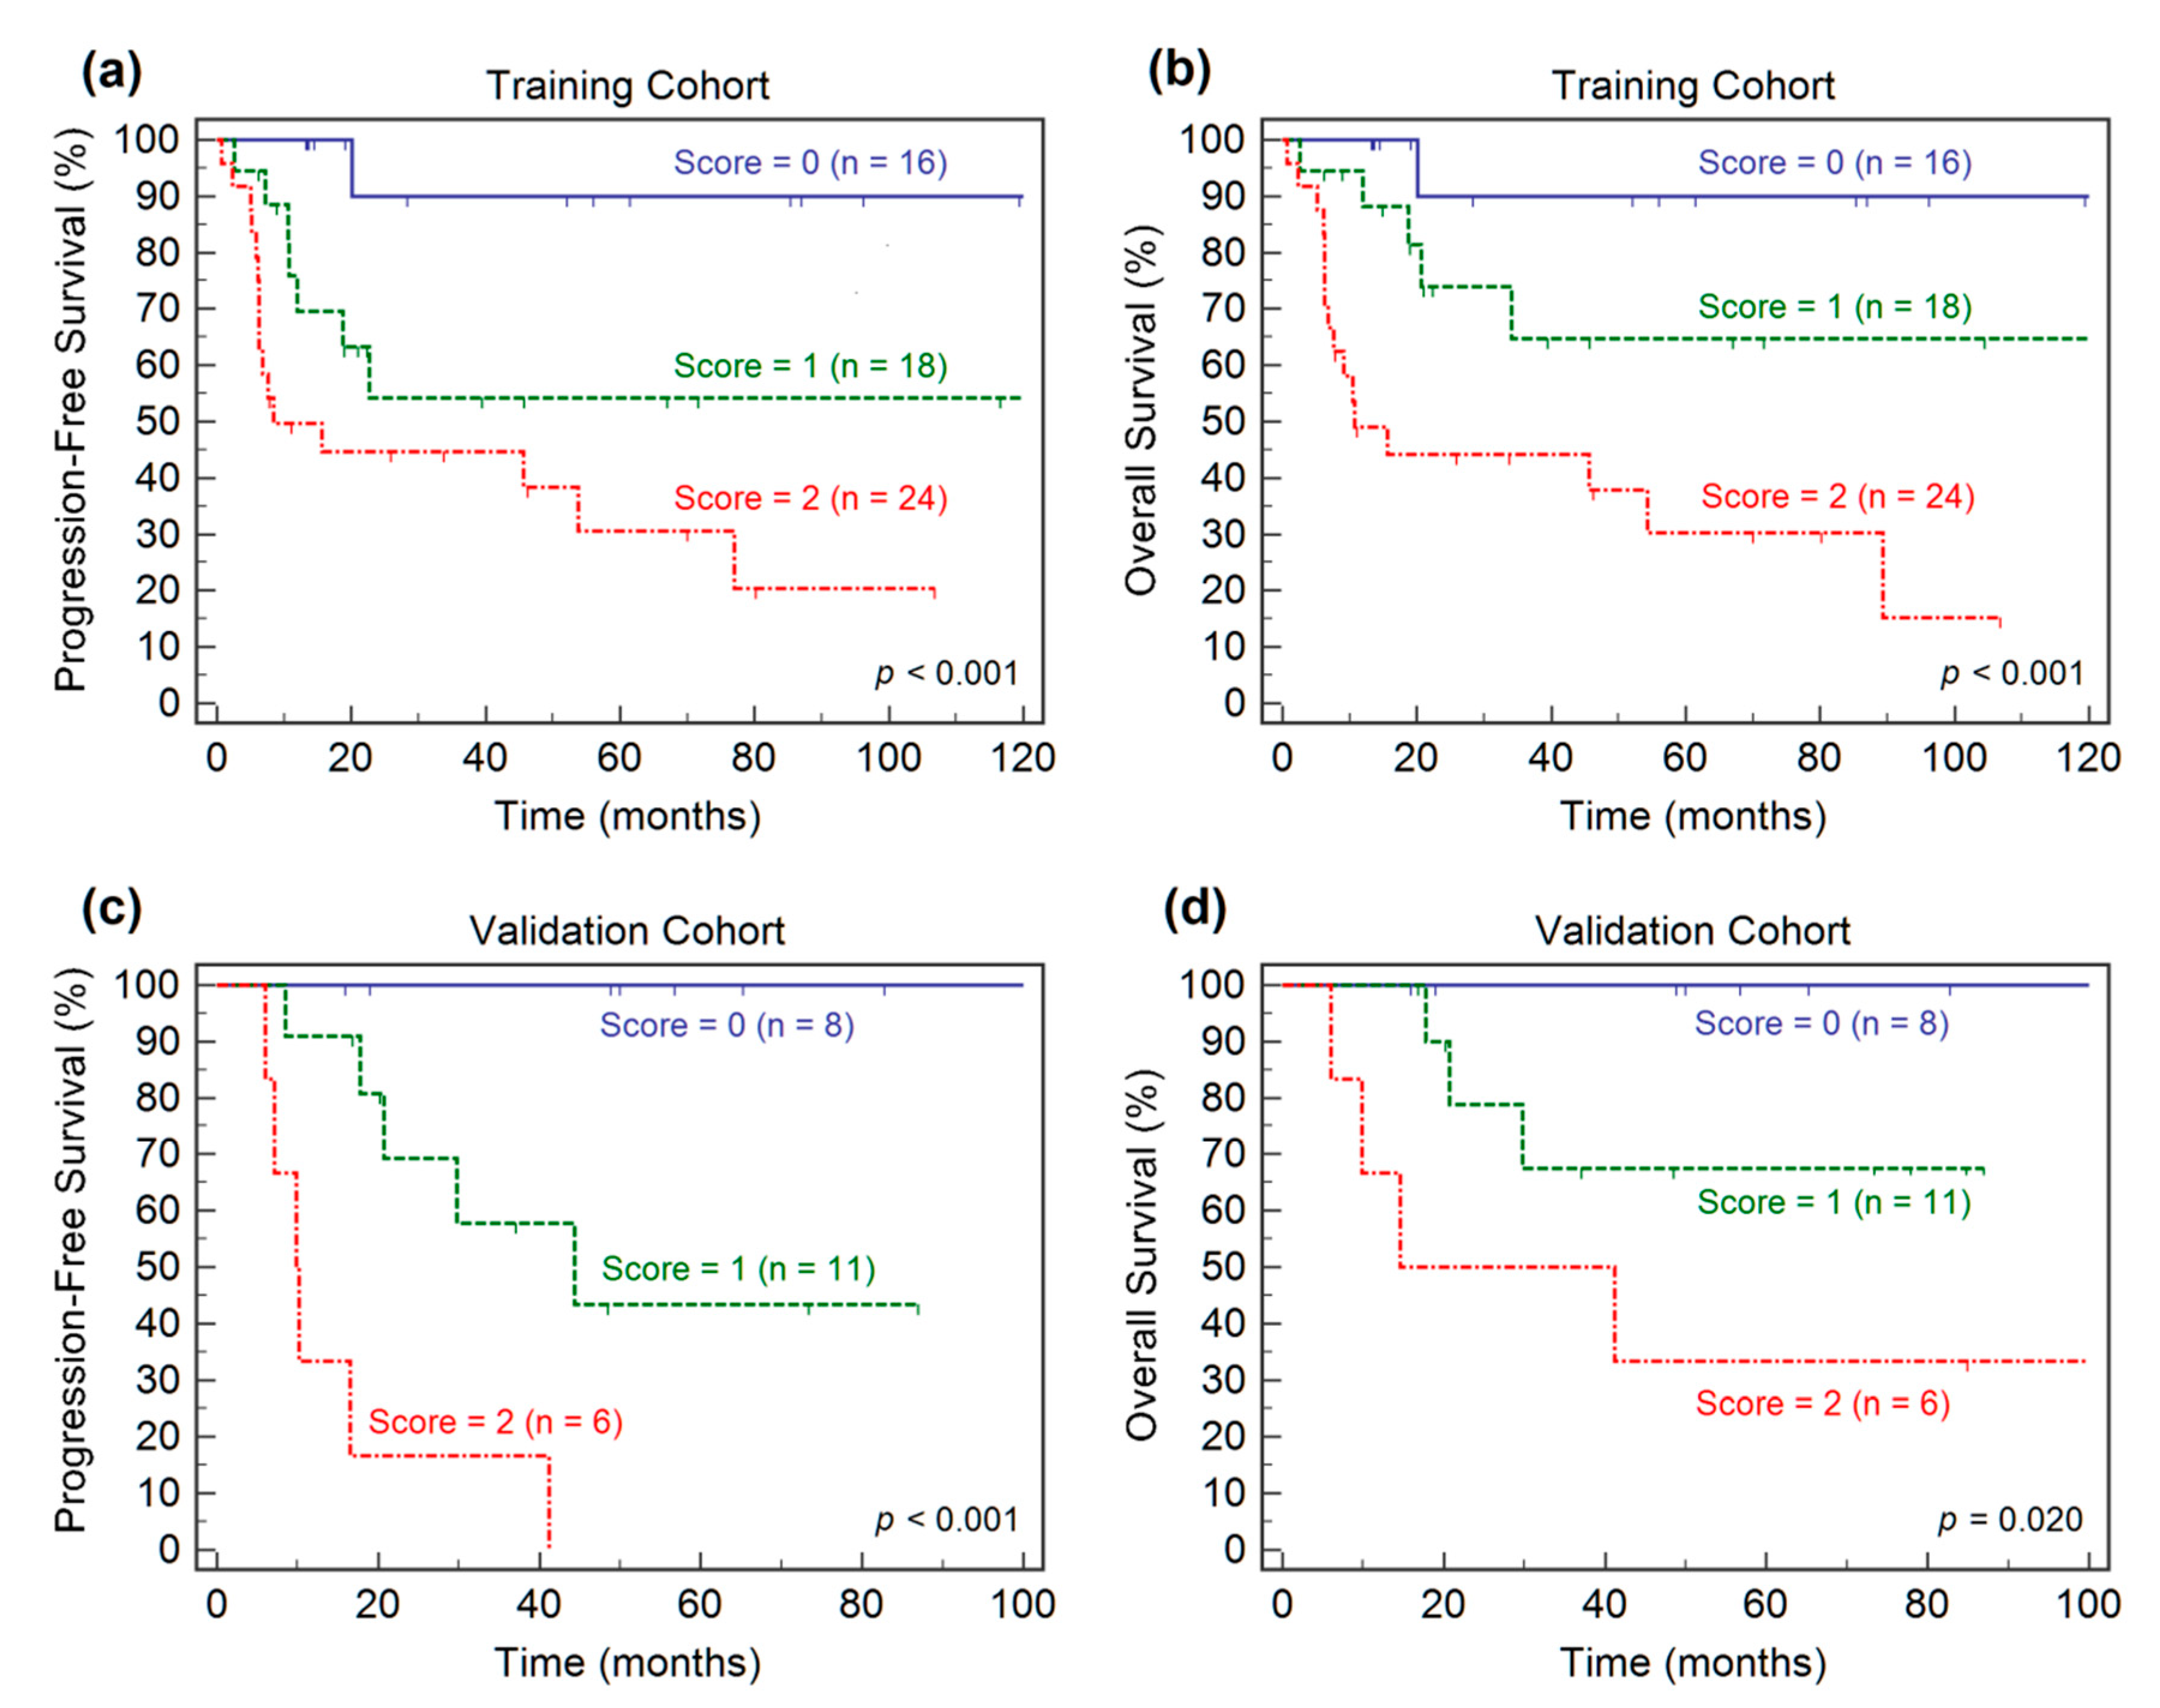
3.4. Prognostic Model Development and Validation

A prognostic stratification model was built based on the independent risk factors presented in the multivariate Cox regression analysis for OS. The risk factors included high-risk IPI scores of the clinical variable and high RLNGLRLM of the radiomic feature. A combination of the two factors, the presence or absence of each risk factor was given a score of 1 or 0, resulting in scores from 0 to 2. All patients were stratified into three risk groups: group I, with a score of 0 (none of the risk factors); group II, with a score of 1 (one risk factors); and group III, with a score of 2 (two risk factors). In the training dataset, Kaplan–Meier analyses of PFS and OS demonstrated the ability of the prognostic stratification model (Figure 2a,b). Survival curves revealed that the three risk groups were significantly different with regard to PFS and OS. The 5-year PFS of patients in groups I to III were 90.0%, 54.2%, 30.6% (p < 0.001), respectively, and the 5-year OS were 90.0%, 64.7.0%, 30.3% (p < 0.001), respectively.
In the validation dataset, survival curves generated through Kaplan–Meier analysis indicated that the prognostic stratification model identified three risk groups for survival outcomes (Figure 2c,d). The patients in group I had significantly higher 5-year PFS (100% vs. 43.3% vs. 0%, p < 0.001) and OS (100% vs. 67.5% vs. 33.3%, p = 0.020) rates than those in groups II and III.

4. Discussion

The present study investigated the use of radiomic analysis of 18F-FDG PET for predicting survival outcomes in patients with DLBCL. Our results demonstrate that baseline 18F-FDG PET radiomics have prognostic value, and that RLNGLRLM is an independent prognostic factor for both PFS and OS. The RLNGLRLM provides a way of featuring for tumor heterogeneity, driven by the genomic diversity that enables the tumor to evolve and adapt to anticancer treatments [15,34]. Therefore, it can be reasoned that the assessment of tumor heterogeneity allows us to anticipate patient outcomes. Moreover, a prognostic stratification model was devised to identify the risk groups of patients based on integrating clinical and imaging prognostic factors. The proposed model showed the complementary roles of combining clinical information with tumor heterogeneity and allowed the stratification of three risk groups according to survival outcomes in patients with DLBCL.
Many PET radiomic features are currently under investigational use, and different studies have reported different radiomic features for predicting the survival outcome of lymphoma [35,36,37,38,39]. To keep the data dimensionally low to avoid overfitting, only 12 radiomic features with low ICC sensitivity were evaluated for clinical endpoints in this study. The cohort was split into a training dataset (70%) and an internal validation dataset (30%). A LASSO algorithm was further used for feature selection in order to achieve the best accuracy for PFS and OS prognostication. The radiomic feature identified in the study, RLNGLRLM, was a valuable imaging biomarker after multivariable analyses. RLNGLRLM estimates the similarity of run lengths throughout the image, where a lower value indicates higher homogeneity. A higher RLNGLRLM was associated with a worse prognosis, suggesting that the measurement of tumor heterogeneity of 18F-FDG PET distribution is an essential biomarker in patients with DLBCL.
The literature on molecular imaging radiomics for DLBCL is limited. A few studies have been conducted to investigate the usefulness of PET radiomic features in determining the survival in DLBCL. Parvez et al. [38] found that GLNGLSZM correlated with disease-free survival, and that kurtosis correlated with OS. Moreover, Aide et al. [35,40] found that skewness of skeletal heterogeneity was a prognostic factor for PFS, and long-zone high gray level emphasis from GLSZM was a prognostic parameter for 2-year event-free survival. Recently, Cottereau et al. [41] reported that the radiomic feature characterizing lesion dissemination was associated with PFS and OS. Our findings are in line with those of studies indicating that the PET-derived radiomic features are useful for patient outcome prognostication in DLBCL. Previous studies have indicated that MTV can be used to determine the prognosis of patients with DLBCL [7,8,9,10,11,12]. Our results are not in contradiction with those of the studies. In univariate analysis, MTV demonstrated prognostic significance; however, in multivariate analysis, MTV did not correlate with PFS and OS, presumably due to the small sample size. In lymphoma, few reports have indicated that the performance of PET metabolic parameters for survival prognostication is poor compared to that of PET radiomic features [42,43]. On the contrary, Wang et al. [39] reported that radiomics are not superior to traditional imaging parameters. Notwithstanding, our data suggest that features of tumor heterogeneity may serve as a complementary indicator of MTV. Further external validation is required in a larger cohort population to validate our findings.
Tumor heterogeneity has the potential to impact the prognosis of patients with DLBCL [44]. Lymphoma is a system malignancy, which lacks a primary tumor in the majority of cases. A biopsy is generally performed for a single lesion site in routine clinical practice. Thus, it might be more relevant to explore the tumor heterogeneity across the entire tumor volume than with a single site biopsy in DLBCL. In this study, a tumor heterogeneity feature from the entire tumor volume was combined with the clinical IPI to construct a prognostic stratification model. Our findings highlight the benefit of an integrated approach that includes IPI and radiomics for evaluating patients with DLBCL at initial diagnosis. Currently, a qualitative assessment of response using 18F-FDG PET has been implemented into the clinical management of DLBCL. However, patients with DLBCL failed to achieve significant survival improvement after the qualitative 18F-FDG PET response directed-treatment strategy [45]. Radiomics provides a more sophisticated quantitative measure of 18F-FDG PET. We further combined radiomics with the clinical IPI system into a survival prediction model. Because radiomics portrays tumor heterogeneity, which is different from the clinical information provided by the IPI score, these two features may have complementary roles. A combination of the two risk factors may more comprehensively depict the survival risk of DLBCL. Future clinical trials are warranted to test the ability of our proposed model to guide tailored treatment strategies.
Despite the usefulness of radiomics, it does have certain limitations. First, radiomics are extracted in terms of MTV, and the method of MTV measurement is inconsistent among different working groups. A recent report [28] indicated that different methods predicted prognosis, but those with a SUV ≥ 2.5 had the best interobserver agreement and were easiest to apply in DLBCL; this was the method we selected in the current study. Moreover, the threshold used to divide patients into high- and low-risk groups depends on the method of MTV measurement. Thus, setting of common criteria for standardization of the MTV calculation is warranted [46]. Second, the SUV discretization step in computing textural features can influence repeatability [47]. In our work, a reliable discretization using a fixed size of bins was adopted, which was shown to be more appropriate in clinical cases [48]. However, the optimal bin size value could not be identified (i.e., the extraction of reliable radiomic features has not been thoroughly investigated). Further investigation of the optimal size of bins for survival prognostication should be considered. Third, the reliability of radiomic features and their ability to predict clinical outcomes is highly dependent on the choice of feature extraction platform [49]. Future radiomic studies should still ensure platforms are IBSI-compliant, as was the platform that we adopted in the current study. Finally, radiomic features can be sensitive to the imaging acquisition and reconstruction settings [50]. Therefore, a radiomic-based model might not be directly applied to different imaging centers, which limits its usefulness in clinical practice. Further research is necessary to validate our findings using a post-reconstruction harmonization [51] approach in multicenter trials.
We acknowledge that our research is exploratory and that there are several limitations. Like most radiomic studies, selection bias could not be avoided due to the retrospective nature of the study. Furthermore, since our analysis was based on a small number of patients, the lack of statistically significant differences should be interpreted with caution, as a statistical difference may be evident with a larger population. Besides, the interobserver variability could be affected by different image readers. In addition, current molecular genetic studies have identified DLBCL subtypes with less favorable survival outcomes, such as the activated B-cell subtype or MYC oncogene rearrangement [11,52]. However, only 12 patients in our cohort underwent subtyping. Whether the radiomic features derived from 18F-FDG PET are associated with the different subtypes of DLBCL requires further investigation. Finally, the rituximab-based regimens and the radiotherapy doses varied throughout the study. This study demonstrated that the identified radiomic feature has prognostic value in DLBCL, but the underlying biological meaning remains to be further explored in larger, multi-institutional cohorts before they can be applied to clinical decision making.

5. Conclusions

Our results indicate that the baseline 18F-FDG PET radiomic feature, RLNGLRLM, serves as an independent prognostic factor for survival outcomes. Furthermore, a prognostic stratification model combining the IPI and RLNGLRLM can be useful for risk stratification of patients with DLBCL. Our findings may be clinically helpful in guiding personalized therapeutic strategies.

Supplementary Materials

Supplementary materials can be found at https://www.mdpi.com/2075-4418/11/1/36/s1.

Author Contributions

K.-H.L. and Y.-H.C. have full access to all the study data; study design, K.-H.L., Y.-F.W., H.-H.L. and Y.-H.C.; image analysis, S.-H.L. and Y.-H.C.; radiomic analysis, K.-H.L. and H.-H.L.; statistical analysis, K.-H.L., T.-C.H. and Y.-H.C.; drafting the article: K.-H.L., Y.-F.W. and Y.-H.C.; critically revising the article’s important intellectual content, K.-H.L., Y.-F.W., H.-H.L., S.-C.C. and Y.-H.C. All authors have read and agreed to the published version of the manuscript.

Funding

This research received no external funding.

Institutional Review Board Statement

The study was conducted according to the guidelines of the Declaration of Helsinki, and approved by the Institutional Review Board and Research Ethics Committee of Hualien Tzu Chi Hospital, Buddhist Tzu Chi Medical Foundation (IRB108–251-B; 10 December 2019).

Informed Consent Statement

Patient consent was waived given the retrospective nature of the study.

Data Availability Statement

The data presented in this study are available on request from the corresponding author. The data are not publicly available due to the privacy and ethical restrictions.

Acknowledgments

The authors wish to thank the staff from the Cancer Center of Buddhist Tzu Chi General Hospital for their assistance in retrieving the data of patients with DLBCL.

Conflicts of Interest

The authors declare no conflict of interest.

References

  1. Teras, L.R.; DeSantis, C.E.; Cerhan, J.R.; Morton, L.M.; Jemal, A.; Flowers, C.R. 2016 US lymphoid malignancy statistics by World Health Organization subtypes. CA Cancer J. Clin. 2016, 66, 443–459. [Google Scholar] [CrossRef]
  2. Tilly, H.; Gomes da Silva, M.; Vitolo, U.; Jack, A.; Meignan, M.; Lopez-Guillermo, A.; Walewski, J.; André, M.; Johnson, P.W.; Pfreundschuh, M.; et al. Diffuse large B-cell lymphoma (DLBCL): ESMO clinical practice guidelines for diagnosis, treatment and follow-up. Ann. Oncol. 2015, 26, v116–v125. [Google Scholar] [CrossRef] [PubMed]
  3. Friedberg, J.W. Relapsed/refractory diffuse large B-cell lymphoma. Hematology Am. Soc. Hematol. Educ. Program. 2011, 2011, 498–505. [Google Scholar] [CrossRef] [PubMed] [Green Version]
  4. Bari, A.; Marcheselli, L.; Sacchi, S.; Marcheselli, R.; Pozzi, S.; Ferri, P.; Balleari, E.; Musto, P.; Neri, S.; Aloe Spiriti, M.A.; et al. Prognostic models for diffuse large B-cell lymphoma in the rituximab era: A never-ending story. Ann. Oncol. 2009, 21, 1486–1491. [Google Scholar] [CrossRef] [PubMed]
  5. Sehn, L.H.; Berry, B.; Chhanabhai, M.; Fitzgerald, C.; Gill, K.; Hoskins, P.; Klasa, R.; Savage, K.J.; Shenkier, T.; Sutherland, J.; et al. The revised International Prognostic Index (R-IPI) is a better predictor of outcome than the standard IPI for patients with diffuse large B-cell lymphoma treated with R-CHOP. Blood 2007, 109, 1857–1861. [Google Scholar] [CrossRef] [PubMed] [Green Version]
  6. Voltin, C.-A.; Mettler, J.; Grosse, J.; Dietlein, M.; Baues, C.; Schmitz, C.; Borchmann, P.; Kobe, C.; Hellwig, D. FDG-PET Imaging for Hodgkin and Diffuse large B-cell lymphoma—An updated overview. Cancers 2020, 12, 601. [Google Scholar] [CrossRef] [PubMed] [Green Version]
  7. Adams, H.J.; de Klerk, J.M.; Fijnheer, R.; Heggelman, B.G.; Dubois, S.V.; Nievelstein, R.A.; Kwee, T.C. Prognostic superiority of the National Comprehensive Cancer Network International Prognostic Index over pretreatment whole-body volumetric-metabolic FDG-PET/CT metrics in diffuse large B-cell lymphoma. Eur. J. Haematol. 2015, 94, 532–539. [Google Scholar] [CrossRef]
  8. Guo, B.; Tan, X.; Ke, Q.; Cen, H. Prognostic value of baseline metabolic tumor volume and total lesion glycolysis in patients with lymphoma: A meta-analysis. PLoS ONE 2019, 14, e0210224. [Google Scholar] [CrossRef]
  9. Mikhaeel, N.G.; Smith, D.; Dunn, J.T.; Phillips, M.; Møller, H.; Fields, P.A.; Wrench, D.; Barrington, S. Combination of baseline metabolic tumour volume and early response on PET/CT improves progression-free survival prediction in DLBCL. Eur. J. Nucl. Med. Mol. Imaging 2016, 43, 1209–1219. [Google Scholar] [CrossRef] [Green Version]
  10. Schmitz, C.; Hüttmann, A.; Müller, S.P.; Hanoun, M.; Boellaard, R.; Brinkmann, M.; Jöckel, K.-H.; Dührsen, U.; Rekowski, J. Dynamic risk assessment based on positron emission tomography scanning in diffuse large B-cell lymphoma: Post-hoc analysis from the PETAL trial. Eur. J. Cancer 2020, 124, 25–36. [Google Scholar] [CrossRef] [Green Version]
  11. Toledano, M.N.; Desbordes, P.; Banjar, A.; Gardin, I.; Vera, P.; Ruminy, P.; Jardin, F.; Tilly, H.; Becker, S. Combination of baseline FDG PET/CT total metabolic tumour volume and gene expression profile have a robust predictive value in patients with diffuse large B-cell lymphoma. Eur. J. Nucl. Med. Mol. Imaging 2018, 45, 680–688. [Google Scholar] [CrossRef] [PubMed]
  12. Vercellino, L.; Cottereau, A.-S.; Casasnovas, O.; Tilly, H.; Feugier, P.; Chartier, L.; Fruchart, C.; Roulin, L.; Obéric, L.; Pica, G.M.; et al. High total metabolic tumor volume at baseline predicts survival independent of response to therapy. Blood 2020, 135, 1396–1405. [Google Scholar] [CrossRef] [PubMed]
  13. Stanta, G.; Bonin, S. Overview on clinical relevance of intra-tumor teterogeneity. Front. Med. 2018, 5, 85. [Google Scholar] [CrossRef] [PubMed] [Green Version]
  14. Burrell, R.A.; McGranahan, N.; Bartek, J.; Swanton, C. The causes and consequences of genetic heterogeneity in cancer evolution. Nat. Cell Biol. 2013, 501, 338–345. [Google Scholar] [CrossRef]
  15. McGranahan, N.; Swanton, C. Clonal Heterogeneity and tumor evolution: Past, present, and the future. Cell 2017, 168, 613–628. [Google Scholar] [CrossRef]
  16. Lambin, P.; Rios-Velazquez, E.; Leijenaar, R.; Carvalho, S.; van Stiphout, R.G.; Granton, P.; Zegers, C.M.; Gillies, R.; Boellard, R.; Dekker, A.; et al. Radiomics: Extracting more information from medical images using advanced feature analysis. Eur. J. Cancer 2012, 48, 441–446. [Google Scholar] [CrossRef] [Green Version]
  17. Gillies, R.J.; Kinahan, P.E.; Hricak, H. Radiomics: Images are more than pictures, they are data. Radiology 2016, 278, 563–577. [Google Scholar] [CrossRef] [Green Version]
  18. Lucia, F.; Visvikis, D.; Vallières, M.; Desseroit, M.-C.; Miranda, O.; Robin, P.; Bonaffini, P.A.; Alfieri, J.; Masson, I.; Mervoyer, A.; et al. External validation of a combined PET and MRI radiomics model for prediction of recurrence in cervical cancer patients treated with chemoradiotherapy. Eur. J. Nucl. Med. Mol. Imaging 2019, 46, 864–877. [Google Scholar] [CrossRef]
  19. Maffione, A.M.; Montesi, G.; Caroli, P.; Colletti, P.M.; Rubello, D.; Matteucci, F. Is it time to introduce PET/CT in rectal cancer guidelines? Clin. Nucl. Med. 2020, 45, 611–617. [Google Scholar] [CrossRef]
  20. Manafi-Farid, R.; Karamzade-Ziarati, N.; Vali, R.; Mottaghy, F.M.; Beheshti, M. 2-[18F]FDG PET/CT radiomics in lung cancer: An overview of the technical aspect and its emerging role in management of the disease. Methods 2020. [Google Scholar] [CrossRef]
  21. Ninatti, G.; Kirienko, M.; Neri, E.; Sollini, M.; Chiti, A. Imaging-based prediction of molecular therapy targets in NSCLC by radiogenomics and AI approaches: A systematic review. Diagnostics 2020, 10, 359. [Google Scholar] [CrossRef] [PubMed]
  22. Sah, B.-R.; Owczarczyk, K.; Siddique, M.; Cook, G.J.R.; Goh, V. Radiomics in esophageal and gastric cancer. Abdom. Radiol. 2019, 44, 2048–2058. [Google Scholar] [CrossRef] [PubMed] [Green Version]
  23. Tagliafico, A.S.; Piana, M.; Schenone, D.; Lai, R.; Massone, A.M.; Houssami, N. Overview of radiomics in breast cancer diagnosis and prognostication. Breast 2020, 49, 74–80. [Google Scholar] [CrossRef] [PubMed] [Green Version]
  24. Mayerhoefer, M.E.; Umutlu, L.; Schöder, H. Functional imaging using radiomic features in assessment of lymphoma. Methods 2020. [Google Scholar] [CrossRef]
  25. Wang, H.; Zhou, Y.; Li, L.; Hou, W.; Ma, X.; Tian, R. Current status and quality of radiomics studies in lymphoma: A systematic review. Eur. Radiol. 2020, 1–13. [Google Scholar] [CrossRef]
  26. Cheson, B.D.; Pfistner, B.; Juweid, M.E.; Gascoyne, R.D.; Specht, L.; Horning, S.J.; Coiffier, B.; Fisher, R.I.; Hagenbeek, A.; Zucca, E.; et al. Revised response criteria for malignant lymphoma. J. Clin. Oncol. 2007, 25, 579–586. [Google Scholar] [CrossRef]
  27. Rosset, A.; Spadola, L.; Ratib, O. OsiriX: An open-source software for navigating in multidimensional DICOM images. J. Digit. Imaging 2004, 17, 205–216. [Google Scholar] [CrossRef] [Green Version]
  28. Ilyas, H.; Mikhaeel, N.G.; Dunn, J.T.; Rahman, F.; Møller, H.; Smith, D.; Barrington, S.F. Defining the optimal method for measuring baseline metabolic tumour volume in diffuse large B cell lymphoma. Eur. J. Nucl. Med. Mol. Imaging 2018, 45, 1142–1154. [Google Scholar] [CrossRef] [Green Version]
  29. Van Griethuysen, J.J.; Fedorov, A.; Parmar, C.; Hosny, A.; Aucoin, N.; Narayan, V.; Beets-Tan, R.G.; Fillion-Robin, J.-C.; Pieper, S.; Aerts, H.J. Computational radiomics system to decode the radiographic phenotype. Cancer Res. 2017, 77, e104–e107. [Google Scholar] [CrossRef] [Green Version]
  30. Zwanenburg, A.; Leger, S.; Vallieres, M.; Lock, S. Image biomarker standardisation initiative-feature definitions. arXiv 2016, arXiv:1612.07003 2016. [Google Scholar]
  31. Zwanenburg, A.; Vallières, M.; Abdalah, M.A.; Aerts, H.J.; Andrearczyk, V.; Apte, A.; Ashrafinia, S.; Bakas, S.; Beukinga, R.J.; Boellaard, R.; et al. The image biomarker standardization initiative: Standardized quantitative radiomics for high-throughput image-based phenotyping. Radiology 2020, 295, 328–338. [Google Scholar] [CrossRef] [PubMed] [Green Version]
  32. Zwanenburg, A. Radiomics in nuclear medicine: Robustness, reproducibility, standardization, and how to avoid data analysis traps and replication crisis. Eur. J. Nucl. Med. Mol. Imaging 2019, 46, 2638–2655. [Google Scholar] [CrossRef] [PubMed]
  33. Tibshirani, R. The lasso method for variable selection in the Cox model. Stat Med 1997, 16, 385–395. [Google Scholar] [CrossRef] [Green Version]
  34. Caswell, D.R.; Swanton, C. The role of tumour heterogeneity and clonal cooperativity in metastasis, immune evasion and clinical outcome. BMC Med. 2017, 15, 133. [Google Scholar] [CrossRef]
  35. Aide, N.; Fruchart, C.; Nganoa, C.; Gac, A.-C.; Lasnon, C. Baseline 18F-FDG PET radiomic features as predictors of 2-year event-free survival in diffuse large B cell lymphomas treated with immunochemotherapy. Eur. Radiol. 2020, 30, 4623–4632. [Google Scholar] [CrossRef]
  36. Lue, K.-H.; Wu, Y.-F.; Liu, S.-H.; Hsieh, T.-C.; Chuang, K.-S.; Lin, H.-H.; Chen, Y.-H. Prognostic value of pretreatment radiomic features of 18F-FDG PET in patients with Hodgkin lymphoma. Clin. Nucl. Med. 2019, 44, e559–e565. [Google Scholar] [CrossRef]
  37. Mayerhoefer, M.E.; Riedl, C.C.; Kumar, A.; Gibbs, P.; Weber, M.; Tal, I.; Schilksy, J.; Schöder, H. Radiomic features of glucose metabolism enable prediction of outcome in mantle cell lymphoma. Eur. J. Nucl. Med. Mol. Imaging 2019, 46, 2760–2769. [Google Scholar] [CrossRef] [Green Version]
  38. Parvez, A.; Tau, N.; Hussey, D.; Maganti, M.; Metser, U. 18F-FDG PET/CT metabolic tumor parameters and radiomics features in aggressive non-Hodgkin’s lymphoma as predictors of treatment outcome and survival. Ann. Nucl. Med. 2018, 32, 410–416. [Google Scholar] [CrossRef]
  39. Wang, H.; Zhao, S.; Li, L.; Tian, R. Development and validation of an 18F-FDG PET radiomic model for prognosis prediction in patients with nasal-type extranodal natural killer/T cell lymphoma. Eur. Radiol. 2020, 1–10. [Google Scholar] [CrossRef]
  40. Aide, N.; Talbot, M.; Fruchart, C.; Damaj, G.; Lasnon, C. Diagnostic and prognostic value of baseline FDG PET/CT skeletal textural features in diffuse large B cell lymphoma. Eur. J. Nucl. Med. Mol. Imaging 2018, 45, 699–711. [Google Scholar] [CrossRef] [Green Version]
  41. Cottereau, A.-S.; Nioche, C.; Dirand, A.-S.; Clerc, J.; Morschhauser, F.; Casasnovas, O.; Meignan, M.A.; Buvat, I. 18F-FDG PET dissemination features in Diffuse large B-cell lymphoma Are Predictive of Outcome. J. Nucl. Med. 2020, 61, 40–45. [Google Scholar] [CrossRef] [PubMed]
  42. Ko, K.-Y.; Liu, C.-J.; Ko, C.-L.; Yen, R.-F. Intratumoral Heterogeneity of Pretreatment 18F-FDG PET Images predict disease progression in patients with nasal type extranodal Natural Killer/T-cell lymphoma. Clin. Nucl. Med. 2016, 41, 922–926. [Google Scholar] [CrossRef] [PubMed]
  43. Lue, K.-H.; Wu, Y.-F.; Liu, S.-H.; Hsieh, T.-C.; Chuang, K.-S.; Lin, H.-H.; Chen, Y.-H. Intratumor heterogeneity assessed by 18F-FDG PET/CT predicts treatment response and survival outcomes in patients with Hodgkin lymphoma. Acad. Radiol. 2020, 27, e183–e192. [Google Scholar] [CrossRef] [PubMed]
  44. Wang, Y.; Feng, W.; Liu, P. Genomic pattern of intratumor heterogeneity predicts the risk of progression in early stage diffuse large B-cell lymphoma. Carcinogenesis 2019, 40, 1427–1434. [Google Scholar] [CrossRef] [PubMed]
  45. Barrington, S.F.; Johnson, P.W.M. 18F-FDG PET/CT in lymphoma: Has imaging-directed personalized medicine become a reality? J. Nucl. Med. 2017, 58, 1539–1544. [Google Scholar] [CrossRef] [Green Version]
  46. Barrington, S.F.; Meignan, M.A. Time to prepare for risk adaptation in lymphoma by standardizing measurement of metabolic tumor burden. J. Nucl. Med. 2019, 60, 1096–1102. [Google Scholar] [CrossRef] [Green Version]
  47. Reuzé, S.; Schernberg, A.; Orlhac, F.; Sun, R.; Chargari, C.; Dercle, L.; Deutsch, E.; Buvat, I.; Robert, C. Radiomics in nuclear medicine applied to radiation therapy: Methods, pitfalls, and challenges. Int. J. Radiat. Oncol. Biol. Phys. 2018, 102, 1117–1142. [Google Scholar] [CrossRef]
  48. Leijenaar, R.T.; Nalbantov, G.; Carvalho, S.; van Elmpt, W.J.; Troost, E.G.C.; Boellaard, R.; Aerts, H.J.; Gillies, R.J.; Lambin, P. The effect of SUV discretization in quantitative FDG-PET Radiomics: The need for standardized methodology in tumor texture analysis. Sci. Rep. 2015, 5, 11075. [Google Scholar] [CrossRef]
  49. Fornacon-Wood, I.; Mistry, H.; Ackermann, C.J.; Blackhall, F.; McPartlin, A.; Faivre-Finn, C.; Price, G.J.; O’Connor, J.P.B. Reliability and prognostic value of radiomic features are highly dependent on choice of feature extraction platform. Eur. Radiol. 2020, 30, 6241–6250. [Google Scholar] [CrossRef]
  50. Yan, J.; Chu-Shern, J.L.; Loi, H.Y.; Khor, L.K.; Sinha, A.K.; Quek, S.T.; Tham, I.W.; Townsend, D. Impact of image reconstruction settings on texture features in 18F-FDG PET. J. Nucl. Med. 2015, 56, 1667–1673. [Google Scholar] [CrossRef] [Green Version]
  51. Orlhac, F.; Boughdad, S.; Philippe, C.; Stalla-Bourdillon, H.; Nioche, C.; Champion, L.; Soussan, M.; Frouin, F.; Frouin, V.; Buvat, I. A postreconstruction harmonization method for multicenter radiomic studies in PET. J. Nucl. Med. 2018, 59, 1321–1328. [Google Scholar] [CrossRef] [PubMed]
  52. Cottereau, A.S.; Lanic, H.; Mareschal, S.; Meignan, M.; Vera, P.; Tilly, H.; Jardin, F.; Becker, S. Molecular profile and FDG-PET/CT total metabolic tumor volume improve risk classification at diagnosis for patients with Diffuse large B-cell lymphoma. Clin. Cancer Res. 2016, 22, 3801–3809. [Google Scholar] [CrossRef] [PubMed] [Green Version]
Figure 1. Kaplan–Meier estimates of progression-free survival and overall survival according to the baseline run length non-uniformity (a,b) and International Prognostic Index scores (c,d).
Diagnostics 11 00036 g001
Figure 2. Kaplan–Meier estimates of progression-free survival and overall survival according to the prognostic stratification model in the training cohort (a,b) and the validation cohort (c,d).
Diagnostics 11 00036 g002
Table 1. Clinical Characteristics of Patients in the Training and Validation Cohorts.
CharacteristicOverall (n = 83)Training (n = 58)Validation (n = 25)p-Value
Sex
Female32 (39%)23 (40%)9 (36%)0.755
Male51 (61%)35 (60%)16 (64%)
Age, median (range), years61 (19–86)61 (19-86)59 (19–81)0.550
Ann Arbor stage
Early (I–II) 33 (40%)25 (43%)8 (32%)0.345
Advanced (III–IV) 50 (60%)33 (57%)17 (68%)
ECOG performance status
0/159 (71%)41 (71%)18 (72%)0.904
2–424 (29%)17 (29%)7 (28%)
LDH
Normal23 (28%)17 (29%)6 (24%)0.622
Elevated (>271 U/L) 60 (72%)41 (71%)19 (76%)
Extranodal sites
No49 (59%)35 (60%)14 (56%)0.713
Yes34 (41%)23 (40%)11 (44%)
IPI score
Low-risk (0–2) 41 (49%)32 (55%)9 (36%)0.111
High-risk (3–5)42 (51%)26 (45%)16 (64%)
Bulky disease (>10 cm)9 (11%)7 (12%)2 (11%)0.587
R-CHOP65 (78%)47 (81%)18 (72%)0.362
Radiotherapy18 (22%)12 (21%)6 (24%)0.739
ECOG, Eastern Cooperative Oncology Group; LDH, lactate dehydrogenase; IPI, International Prognostic Index; R-CHOP, rituximab-cyclophosphamide, hydroxydaunorubicin, oncovin, prednisolone chemotherapy.
Table 2. Univariate and Multivariate Analyses for Prognostic Factors of Progression-free Survival.
Univariate AnalysisMultivariate Analysis
HR (95% CI)p-ValueHR (95% CI)p-Value
Clinical variables
Age (>60 years)2.012 (0.876–4.618)0.098
Female vs. Male1.178 (0.515–2.695)0.697
Stage (I–II vs. III–IV)2.618 (1.035–6.621)0.042 * 0.980
ECOG (0/1 vs. 2–4)1.931 (0.819–4.553)0.132
LDH (≤271 vs. >271 U/L)3.151 (1.248–7.958)0.015 * 0.748
Extranodal sites (no vs. yes) 1.725 (0.774–3.845)0.182
IPI score (0–2 vs. 3–5)3.248 (1.386–7.608)0.006 * 0.224
Bulky disease (>10 cm)3.179 (1.147–8.812)0.026 * 0.282
PET parameters
MTV (>137 cm3)13.64 (1.837–101.2)0.011 * 0.169
GLNGLRLM (>68)15.42 (2.078–114.3)0.007 * 0.155
RLNGLRLM (>1449)15.66 (2.107–116.5)0.007 *15.66 (2.107–116.5)0.007 *
HR, hazard ratio; CI, confidence interval; ECOG, Eastern Cooperative Oncology Group; LDH, lactate dehydrogenase; IPI, International Prognostic Index; MTV, metabolic tumor volume; GLN, gray level non-uniformity; GLRLM, gray level run length matrix; RLN, run length non-uniformity; *, statistically significant.
Table 3. Univariate and Multivariate Analyses for Prognostic Factors of Overall Survival.
Univariate AnalysisMultivariate Analysis
HR (95% CI)p-ValueHR (95% CI)p-Value
Clinical variables
Age (>60 years)2.301 (0.958–5.520)0.062
Female vs. Male1.286 (0.538–3.072)0.571
Stage (I–II vs. III–IV)2.658 (0.974–7.253)0.056
ECOG (0/1 vs. 2–4)2.278 (0.944–5.495)0.066
LDH (≤271 vs. >271 U/L)3.270 (1.205–8.875)0.020 * 0.620
Extranodal sites (no vs. yes) 2.137 (0.921–4.957)0.077
IPI score (0–2 vs. 3–5)4.393 (1.714–11.26)0.002 *2.626 (1.001–6.885)0.049 *
Bulky disease (>10 cm)1.819 (0.611–5.408)0.282
PET parameters
MTV (>137 cm3)11.45 (1.538–85.19)0.017 * 0.343
GLNGLRLM (>68)13.06 (1.755–97.20)0.012 * 0.215
RLNGLRLM (>1449)13.19 (1.771–98.26)0.011 *8.636 (1.104–67.57)0.040 *
HR, hazard ratio; CI, confidence interval; ECOG, Eastern Cooperative Oncology Group; LDH, lactate dehydrogenase; IPI, International Prognostic Index; MTV, metabolic tumor volume; GLN, gray level non-uniformity; GLRLM, gray level run length matrix; RLN, run length non-uniformity; *, statistically significant.
Publisher’s Note: MDPI stays neutral with regard to jurisdictional claims in published maps and institutional affiliations.

