Digital Microfluidic Platform to Maximize Diagnostic Tests with Low Sample Volumes from Newborns and Pediatric Patients

Abstract
:1. Introduction
2. Technology Overview
2.1. Digital Microfluidics Using Electrowetting
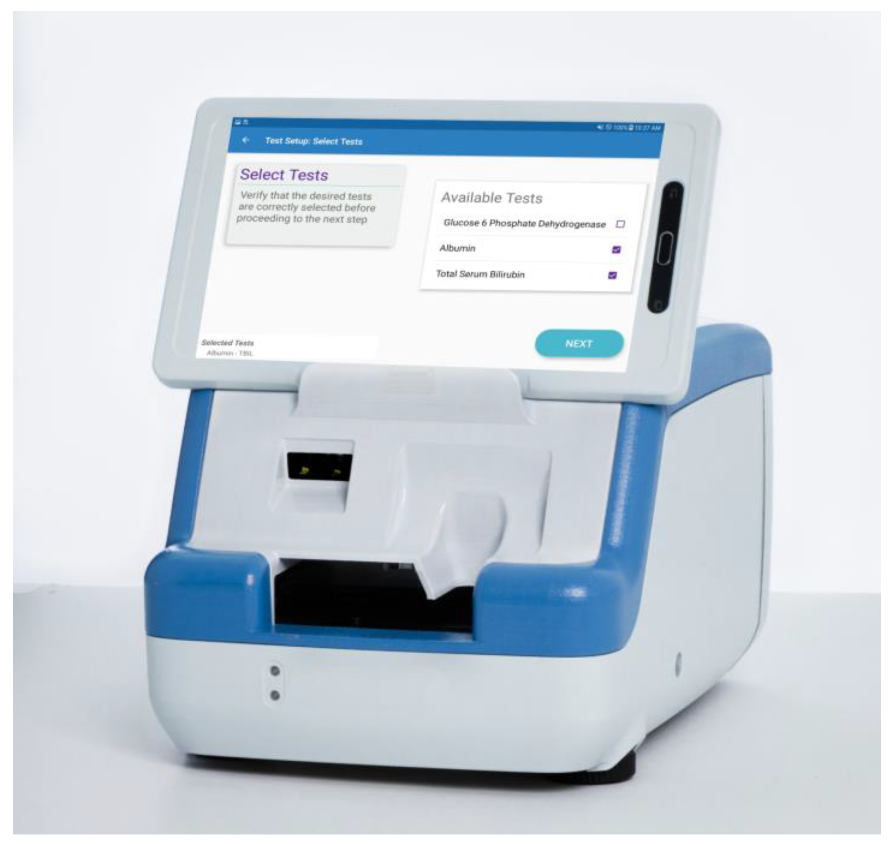
2.2. Digital Microfluidic Instrument Design
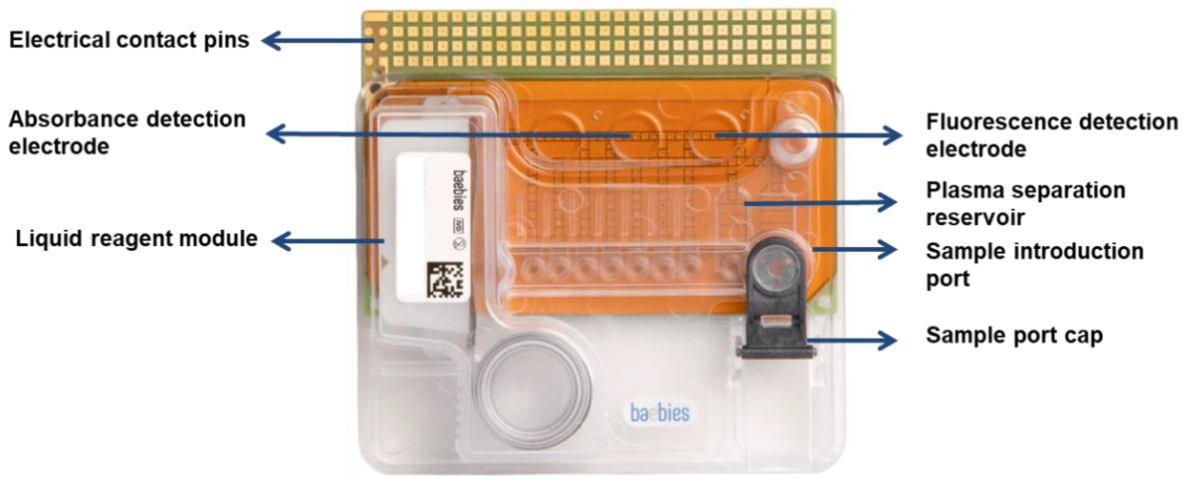
2.3. Cartridge Architecture
2.4. Onboard Quality Control Checks
3. Materials and Methods
3.1. DMF Plasma Separation
3.2. DMF Blood Lysis
3.3. Chemistry Assays
3.3.1. Reagents
3.3.2. Droplet Manipulation Protocols
3.4. Immunoassays
3.4.1. Reagents
3.4.2. Droplet-Based Magnetic Bead Immunoassay Protocol
3.5. Molecular Assays
3.5.1. Reagents
3.5.2. On-Cartridge DNA Amplification Protocol
3.6. Acquisition of Clinical Samples
3.7. Reference Methods for Method Comparison Studies
4. Results
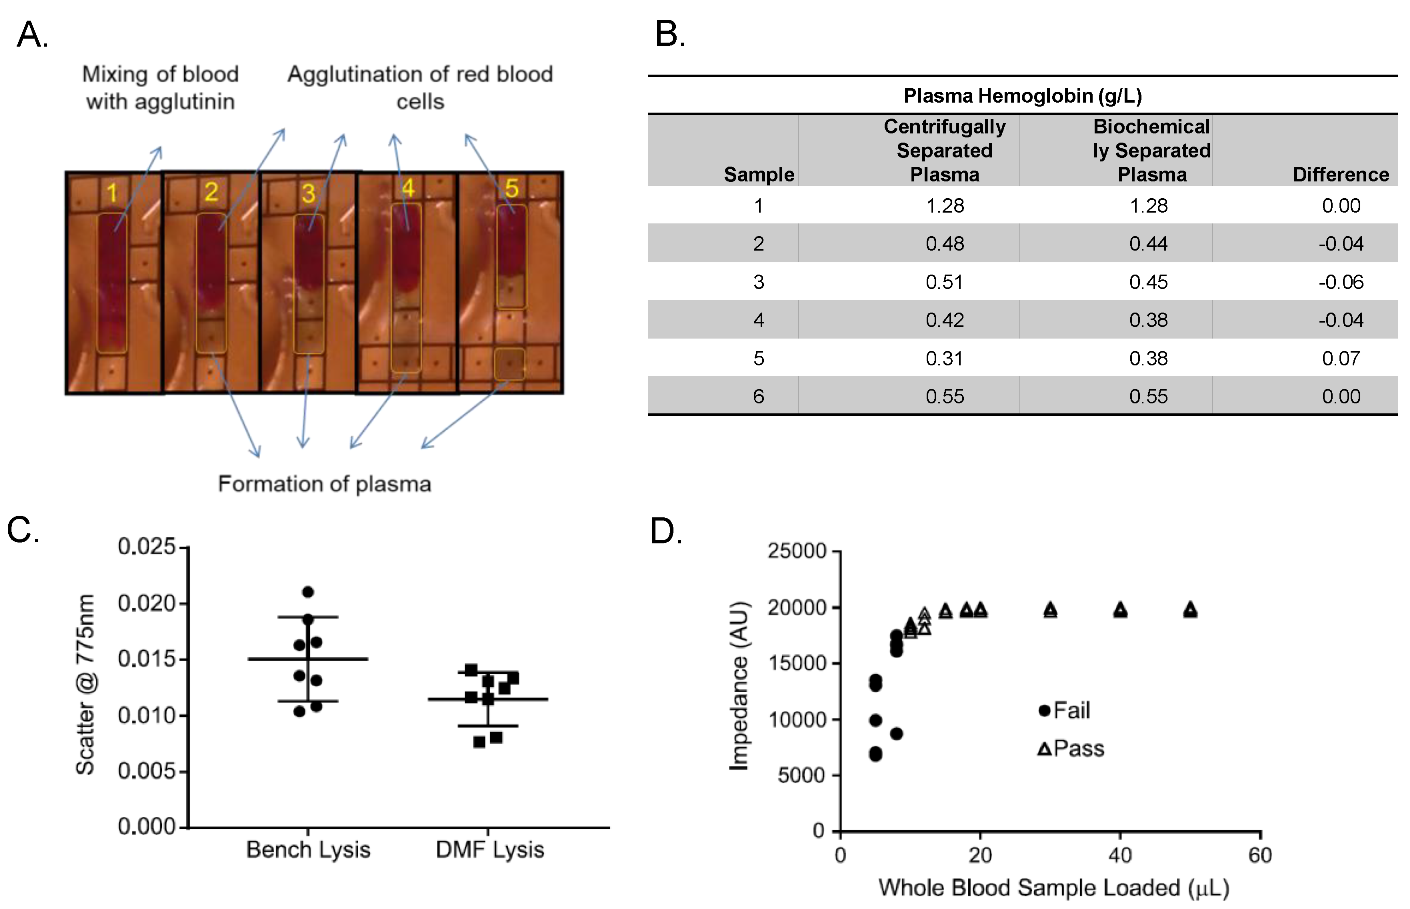
4.1. Integration of Sample Pre-Analytical Steps
4.1.1. Plasma Preparation
4.1.2. Red Blood Cell Lysis
4.1.3. Sample Volume Check
4.2. Miniaturized, Automated Diagnostic Assays
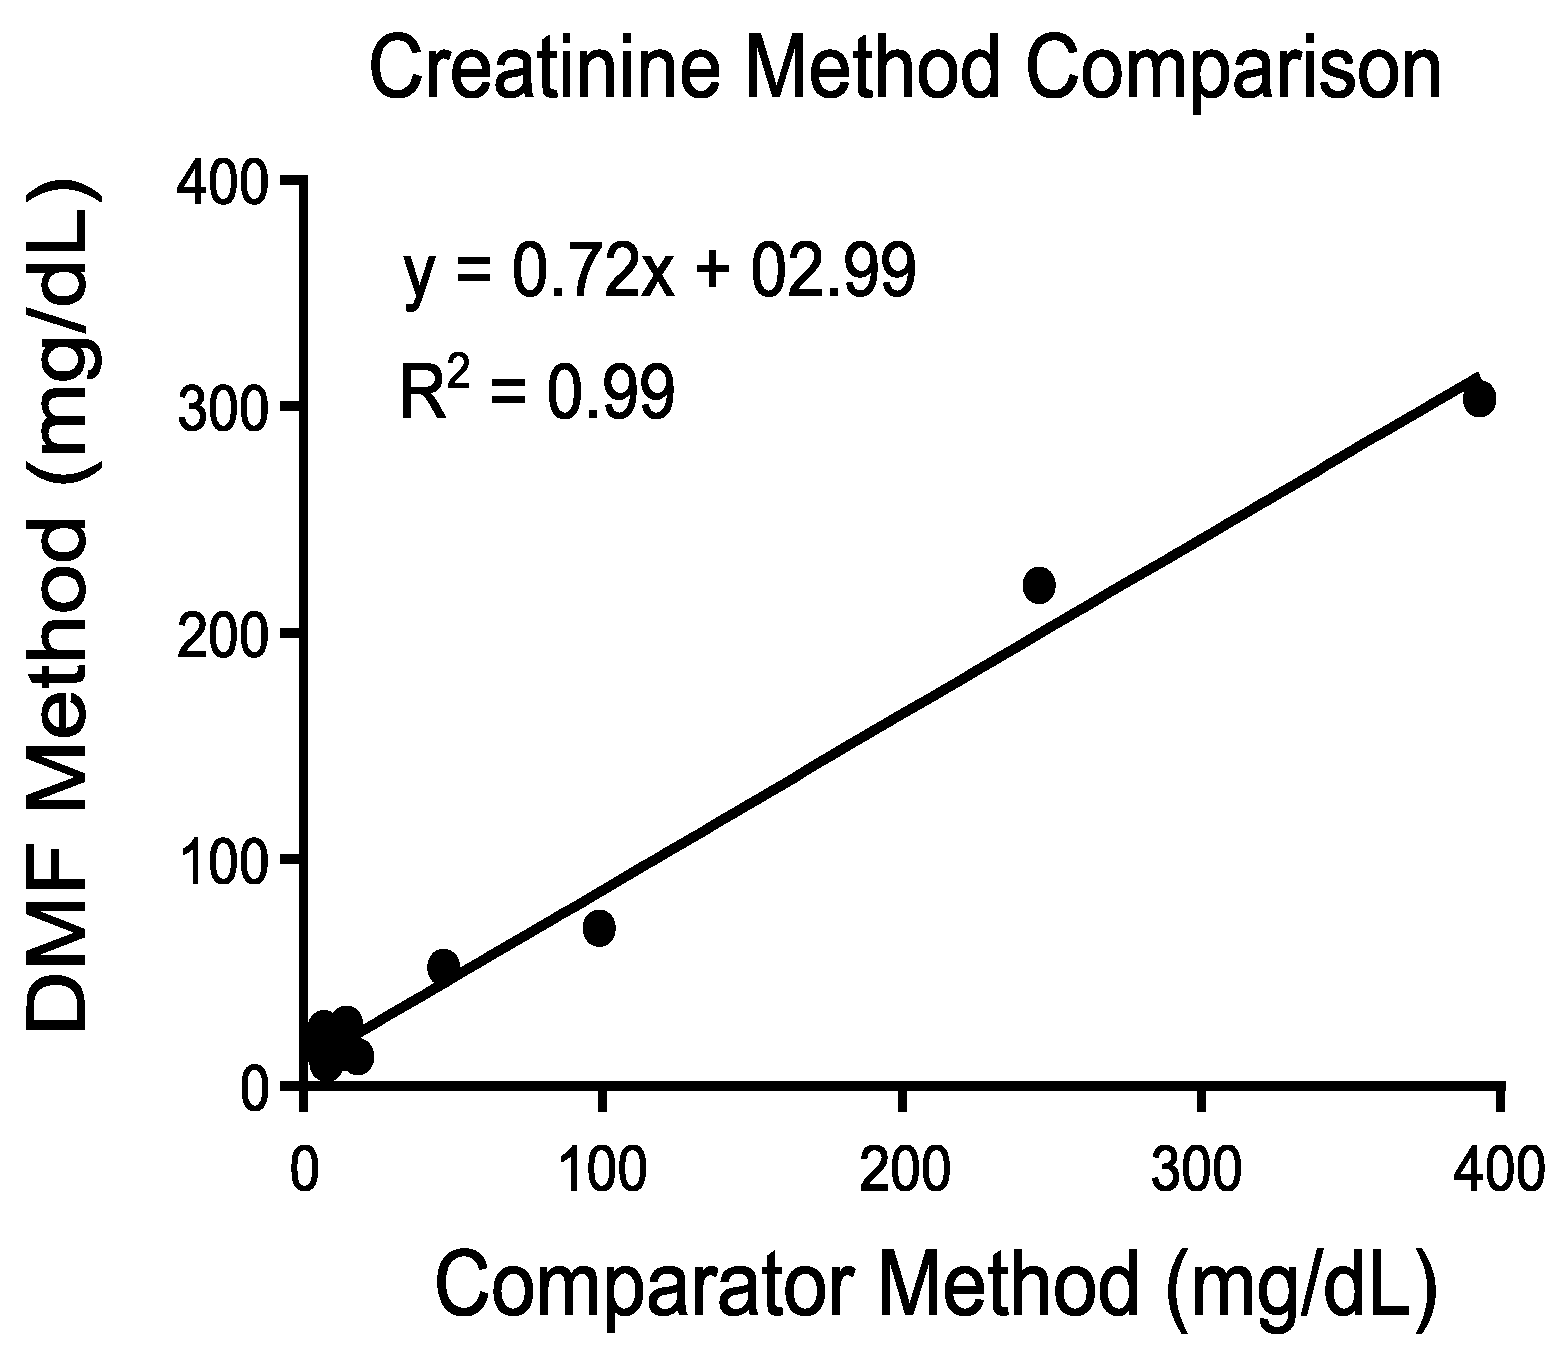
4.2.1. Chemistry Assays
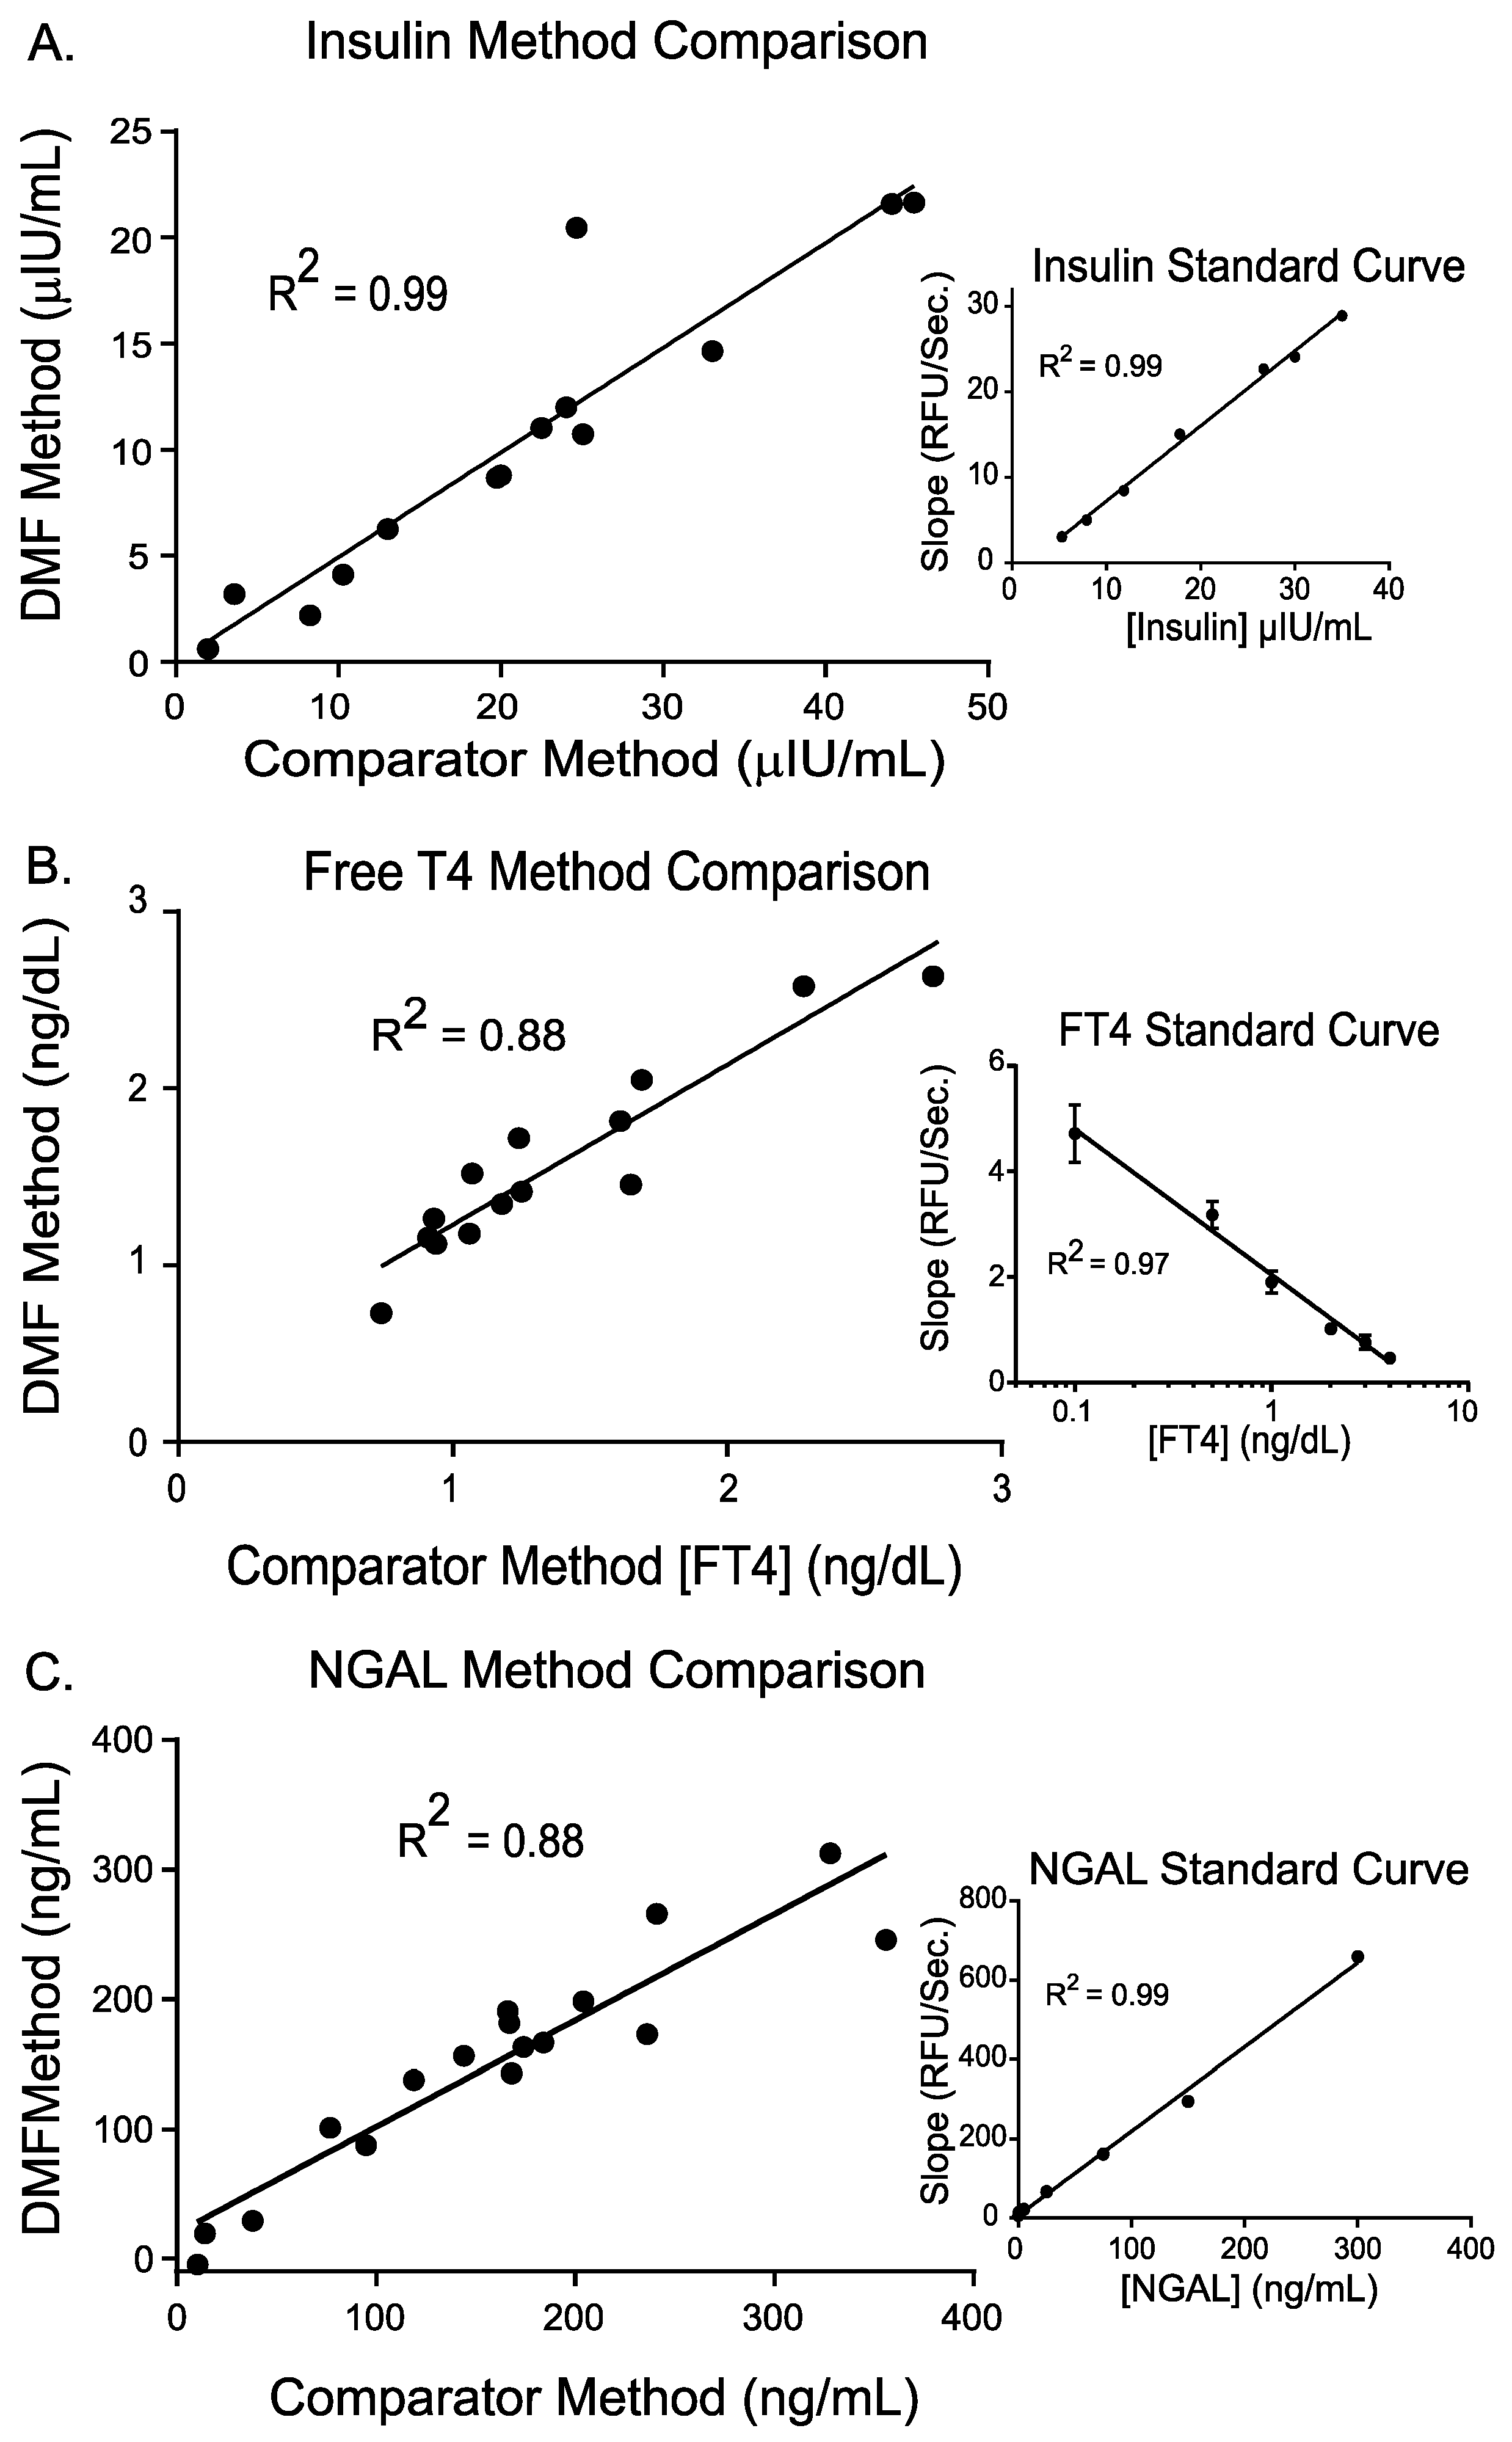
4.2.2. Immunoassays
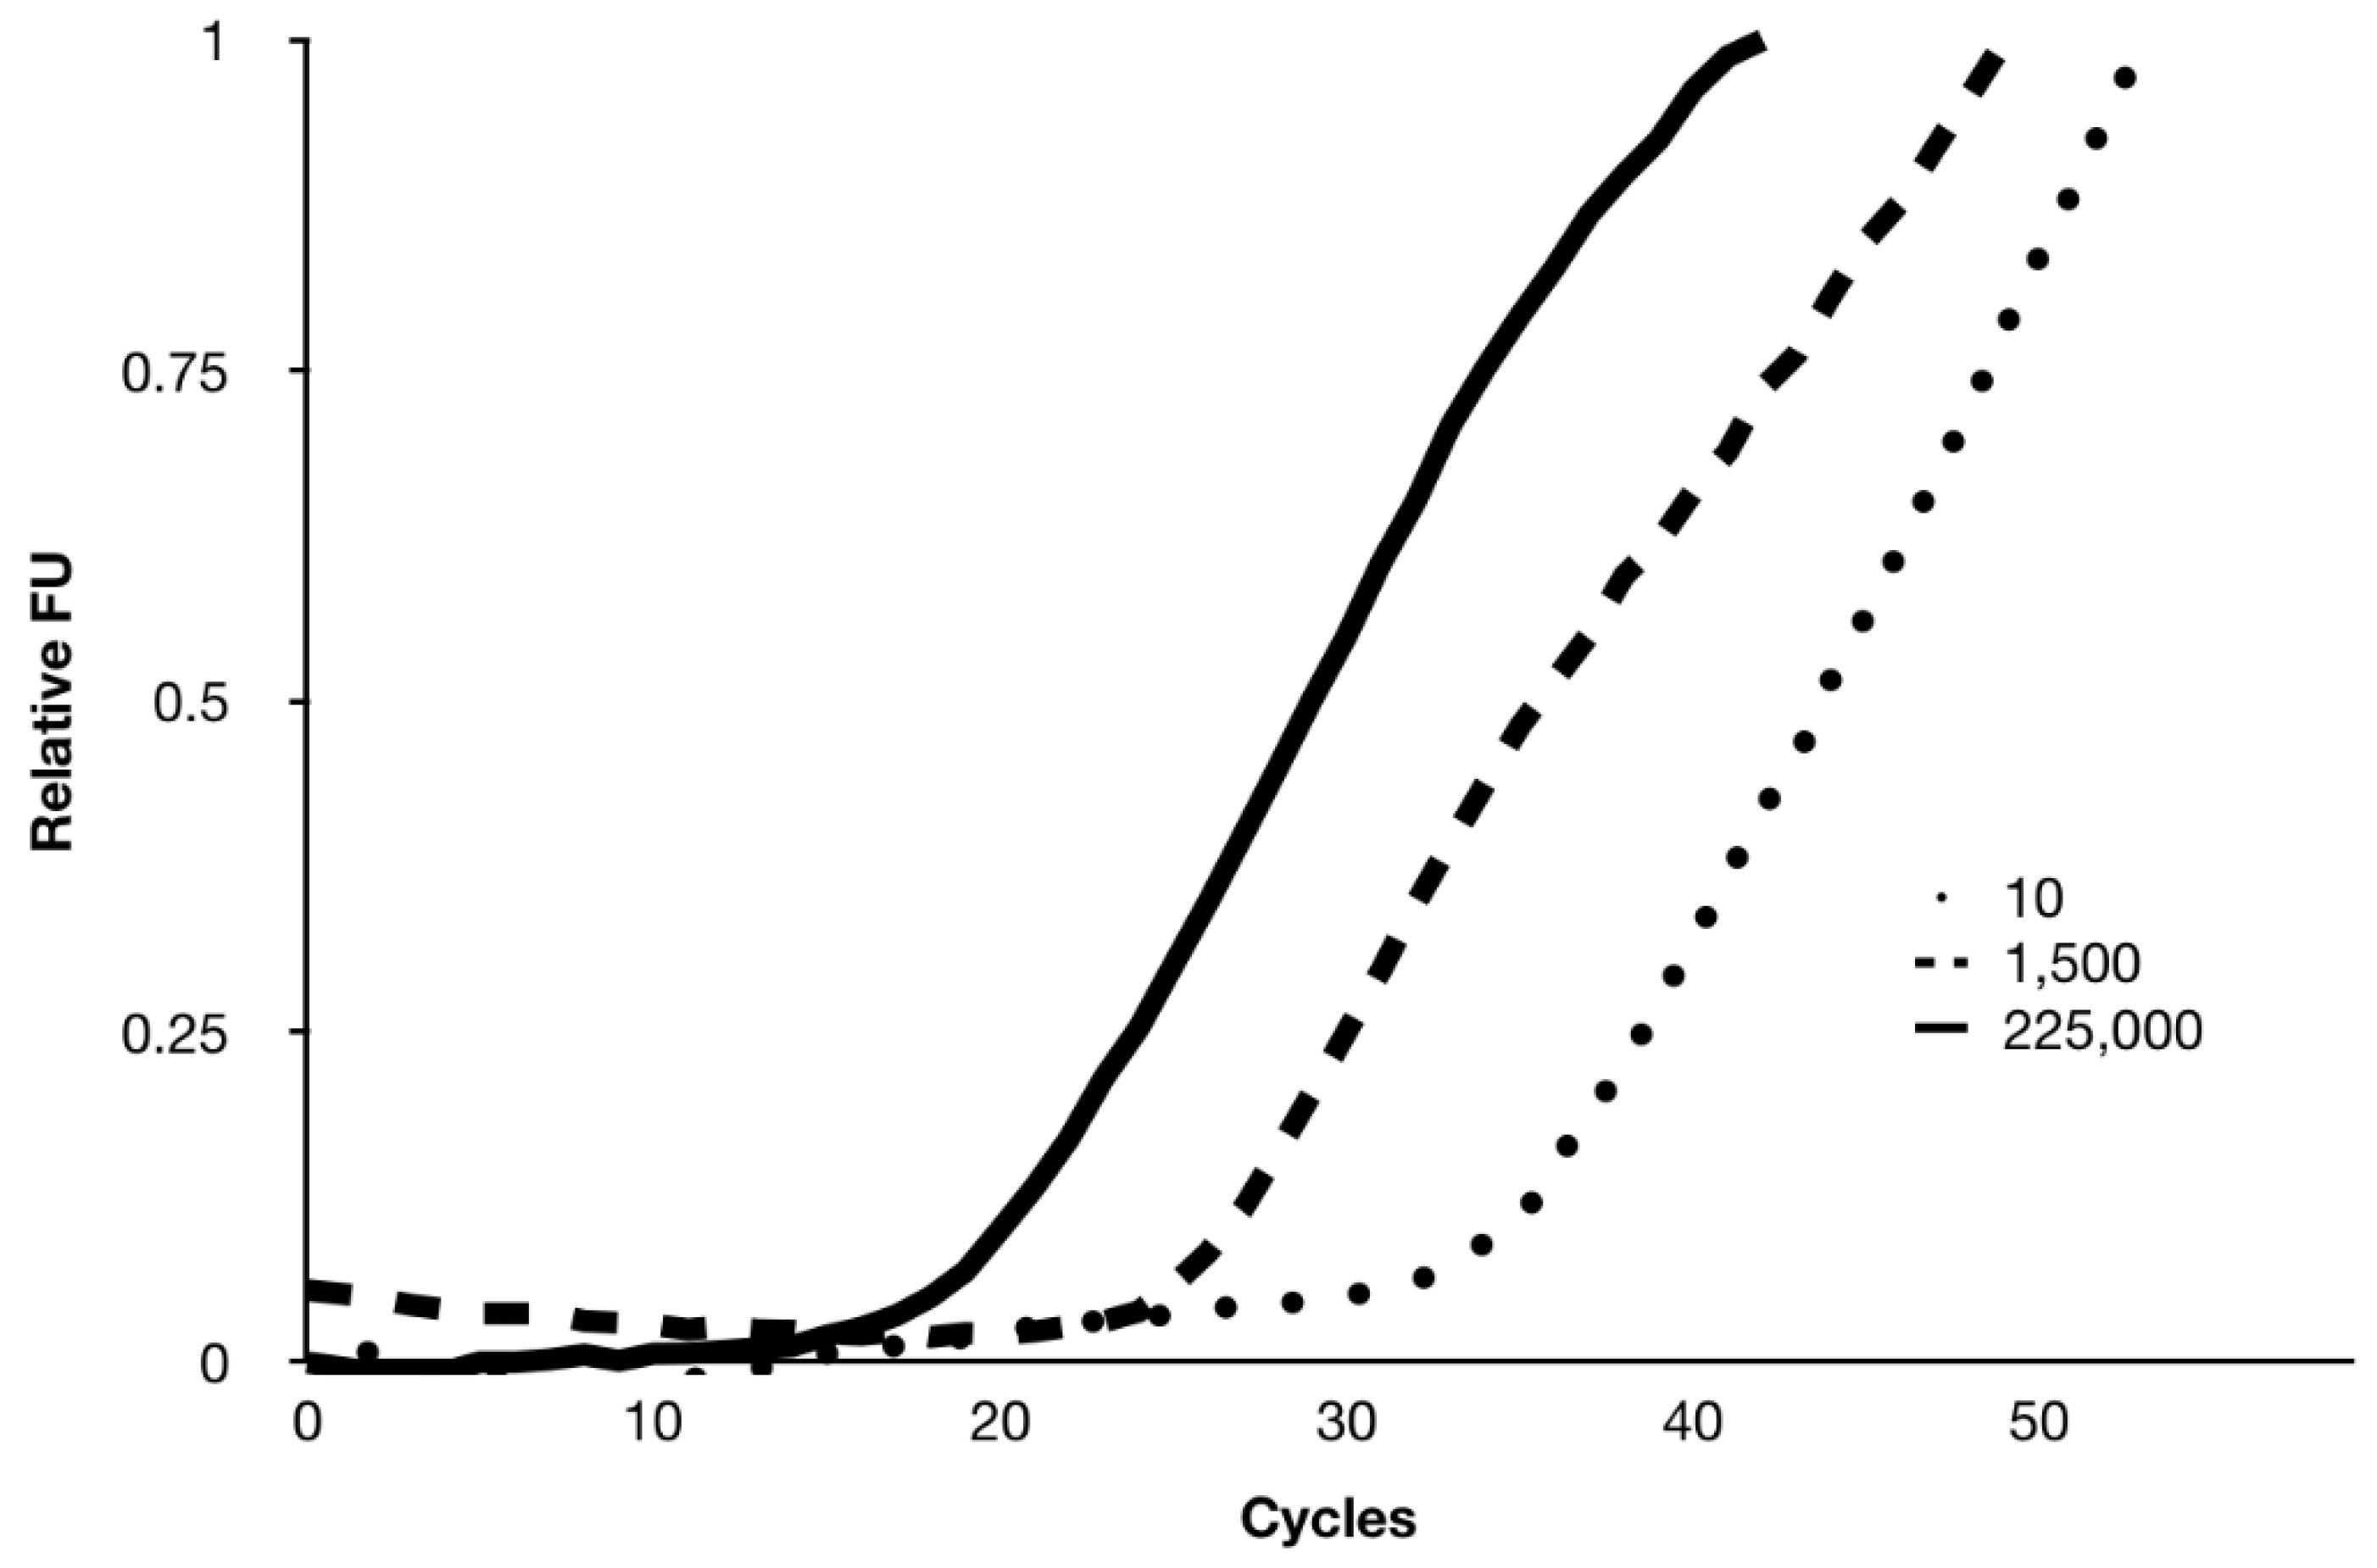
4.2.3. Molecular
5. Conclusions
Supplementary Materials
Author Contributions
Funding
Acknowledgments
Conflicts of Interest
References
- Howie, S.R.C. Blood sample volumes in child health research: review of safe limits. Bull. World Health Organ. 2011, 89, 46–53. [Google Scholar] [CrossRef] [PubMed]
- Blajchman, M.A.; Sheridan, D.; Rawls, W.E. Risks associated with blood transfusion in newborn infants. Clin. Perinatol. 1984, 11, 403–415. [Google Scholar] [CrossRef]
- Jakacka, N.; Snarski, E.; Mekuria, S. Prevention of Iatrogenic Anemia in Critical and Neonatal Care. Adv. Clin. Exp. Med. 2016, 25, 191–197. [Google Scholar] [CrossRef] [PubMed] [Green Version]
- Patel, R.M.; Knezevic, A.; Shenvi, N.; Hinkes, M.; Keene, S.; Roback, J.D.; Easley, K.A.; Josephson, C.D. Association of red blood cell transfusion, anemia, and necrotizing enterocolitis in very low-birth-weight infants. JAMA J. Am. Med. Assoc. 2016, 315, 889–897. [Google Scholar] [CrossRef]
- Bateman, S.T.; Lacroix, J.; Boven, K.; Forbes, P.; Barton, R.; Thomas, N.J.; Jacobs, B.; Markovitz, B.; Goldstein, B.; Hanson, J.H.; et al. Anemia, Blood Loss, and Blood Transfusions in North American Children in the Intensive Care Unit. Am. J. Respir. Crit. Care Med. 2008, 178, 26–33. [Google Scholar] [CrossRef] [Green Version]
- Pearson, H. Blood and blood forming tissues. In Rudolph’s Pediatrics; Rudolph, C., Ed.; McGraw-Hill: New York, NY, USA, 2018; p. 117. [Google Scholar]
- Search Our Health Care Diagnostics Tests Menu|LabCorp. Available online: https://www.labcorp.com/test-menu/search (accessed on 29 December 2019).
- Yaacobi, N.; Bar-Meir, M.; Shchors, I.; Bromiker, R. A Prospective Controlled Trial of the Optimal Volume for Neonatal Blood Cultures. Pediatr. Infect. Dis. J. 2015, 34, 351–354. [Google Scholar] [CrossRef]
- Sista, R.; Hua, Z.; Thwar, P.; Sudarsan, A.; Srinivasan, V.; Eckhardt, A.; Pollack, M.; Pamula, V. Development of a digital microfluidic platform for point of care testing. Lab Chip 2008, 8, 2091. [Google Scholar] [CrossRef] [Green Version]
- Pollack, M.G.; Pamula, V.K.; Srinivasan, V.; Eckhardt, A.E. Applications of electrowetting-based digital microfluidics in clinical diagnostics. Expert Rev. Mol. Diagn. 2011, 11, 393–407. [Google Scholar] [CrossRef]
- Paik, P.; Pamula, V.K.; Fair, R.B. Rapid droplet mixers for digital microfluidic systems. Lab Chip 2003, 3, 253–259. [Google Scholar] [CrossRef]
- Paik, P.; Pamula, V.K.; Pollack, M.G.; Fair, R.B. Electrowetting-based droplet mixers for microfluidic systemsElectronic supplementary information (ESI) available: six mpeg videos showing some mixing schemes used in Fig. 7. See http://www.rsc.org/suppdata/lc/b2/b210825a/. Lab Chip 2003, 3, 28. [Google Scholar] [CrossRef]
- Sista, R.S.; Eckhardt, A.E.; Srinivasan, V.; Pollack, M.G.; Palanki, S.; Pamula, V.K. Heterogeneous immunoassays using magnetic beads on a digital microfluidic platform. Lab Chip 2008, 8, 2188. [Google Scholar] [CrossRef] [PubMed] [Green Version]
- Hua, Z.; Rouse, J.L.; Eckhardt, A.E.; Srinivasan, V.; Pamula, V.K.; Schell, W.A.; Benton, J.L.; Mitchell, T.G.; Pollack, M.G. Multiplexed real-time polymerase chain reaction on a digital microfluidic platform. Anal. Chem. 2010, 82, 2310–2316. [Google Scholar] [CrossRef] [PubMed] [Green Version]
- Sista, R.S.; Wang, T.; Wu, N.; Graham, C.; Eckhardt, A.; Winger, T.; Srinivasan, V.; Bali, D.; Millington, D.S.; Pamula, V.K. Multiplex newborn screening for Pompe, Fabry, Hunter, Gaucher, and Hurler diseases using a digital microfluidic platform. Clin. Chim. Acta 2013, 424, 12–18. [Google Scholar] [CrossRef] [PubMed] [Green Version]
- Graham, C.; Sista, R.S.; Kleinert, J.; Wu, N.; Eckhardt, A.; Bali, D.; Millington, D.S.; Pamula, V.K. Novel application of digital microfluidics for the detection of biotinidase deficiency in newborns. Clin. Biochem. 2013, 46, 1889–1891. [Google Scholar] [CrossRef] [PubMed] [Green Version]
- Emani, S.; Nelson, L.T.; Norton, S.; Singh, R.; Pamula, V.; Emani, S. Enzymatic Functional Assays of Coagulation Using Small Sample Volumes. Lab. Med. 2018, 49, 47–54. [Google Scholar] [CrossRef]
- Emani, S. Novel Coagulation Analyzers in Development: A Glimpse toward the Future of Microfluidics. Semin. Thromb. Hemost. 2019, 45, 302–307. [Google Scholar] [CrossRef]
- Srinivasan, V.; Pamula, V.K.; Fair, R.B. Droplet-based microfluidic lab-on-a-chip for glucose detection. Anal. Chim. Acta 2004, 507, 145–150. [Google Scholar] [CrossRef]
- Shimabuku, R.; Nakamura, H. Total and unbound bilirubin determination using an automated peroxidase micromethod. Kobe J. Med. Sci. 1982, 28, 91–104. [Google Scholar]
- Boppana, S.B.; Ross, S.A.; Shimamura, M.; Palmer, A.L.; Ahmed, A.; Michaels, M.G.; Sánchez, P.J.; Bernstein, D.I.; Tolan, R.W.; Novak, Z.; et al. Saliva Polymerase-Chain-Reaction Assay for Cytomegalovirus Screening in Newborns. N. Engl. J. Med. 2011, 364, 2111–2118. [Google Scholar] [CrossRef] [Green Version]
- Askenazi, D.J.; Koralkar, R.; Patil, N.; Halloran, B.; Ambalavanan, N.; Griffin, R. Acute Kidney Injury Urine Biomarkers in Very Low-Birth-Weight Infants. Clin. J. Am. Soc. Nephrol. 2016, 11, 1527–1535. [Google Scholar] [CrossRef] [Green Version]
- Gorakshakar, A.C.; Ghosh, K. Use of lectins in immunohematology. Asian J. Transfus. Sci. 2016, 10, 12–21. [Google Scholar] [CrossRef]
- EP07-A2. Clinical and Laboratory Safety Institute Guidelines for Interference Testing in Clinical Chemistry; Clinical Laboratory Standards Institute: Wayne, PA, USA, 2005; ISBN 610.688.0700.
- American Academy of Pediatrics Subcommittee on Hyperbilirubinemia. Management of hyperbilirubinemia in the newborn infant 35 or more weeks of gestation. Pediatrics 2004, 114, 297–316. [Google Scholar] [CrossRef] [PubMed] [Green Version]
- Watchko, J.F.; Tiribelli, C. Bilirubin-Induced Neurologic Damage—Mechanisms and Management Approaches. N. Engl. J. Med. 2013, 369, 2021–2030. [Google Scholar] [CrossRef] [PubMed]
- Jacobsen, J.; Wennberg, R.P. Determination of unbound bilirubin in the serum of newborns. Clin. Chem. 1974, 20, 783. [Google Scholar] [PubMed]
- Ahlfors, C.E. Effect of serum dilution on apparent unbound bilirubin concentration as measured by the peroxidase method. Clin. Chem. 1981, 27, 692–696. [Google Scholar] [PubMed]
- Ahlfors, C.E. Measurement of Plasma Unbound Unconjugated Bilirubin. Anal. Biochem. 2000, 279, 130–135. [Google Scholar] [CrossRef]
- Nkhoma, E.T.; Poole, C.; Vannappagari, V.; Hall, S.A.; Beutler, E. The global prevalence of glucose-6-phosphate dehydrogenase deficiency: A systematic review and meta-analysis. Blood Cells Mol. Dis. 2009, 42, 267–278. [Google Scholar] [CrossRef]
- Watchko, J.F.; Kaplan, M.; Stark, A.R.; Stevenson, D.K.; Bhutani, V.K. Should we screen newborns for glucose-6-phosphate dehydrogenase deficiency in the United States. J. Perinatol. 2013, 33, 499–504. [Google Scholar] [CrossRef] [Green Version]
- Cannon, M.J.; Griffiths, P.D.; Aston, V.; Rawlinson, W.D. Universal newborn screening for congenital CMV infection: what is the evidence of potential benefit? Rev. Med. Virol. 2014, 24, 291–307. [Google Scholar] [CrossRef] [Green Version]
- Yamaguchi, A.; Oh-Ishi, T.; Arai, T.; Sakata, H.; Adachi, N.; Asanuma, S.; Oguma, E.; Kimoto, H.; Matsumoto, J.; Fujita, H.; et al. Screening for seemingly healthy newborns with congenital cytomegalovirus infection by quantitative real-time polymerase chain reaction using newborn urine: an observational study. BMJ Open 2017, 7, e013810. [Google Scholar] [CrossRef] [Green Version]
- Nelson, L.T.; Boppana, S.B.; Pamula, V.K. Towards point-of-care nucleic acid testing for congenital cytomegalovirus infection in newborns. In Proceedings of the 5th International Congenital CMV Conference, Brisbane, Australia, 20–24 April 2015. [Google Scholar]


| Analyte | Reference Method [7] | Expected Turnaround Time | Minimum Volume of Plasma/Serum | Estimated Volume of Whole Blood | Additional Pre-Shipping Sample Preparation |
|---|---|---|---|---|---|
| Heparin Anti-Xa | Labcorp 117101 (activity assay) | 1–3 days | 1.0 mL | 2.0 mL | Centrifugation right after collection and frozen shipping |
| Factor VIII activity | Labcorp 500192 (activity assay) | 3–5 days | 0.5 mL | 1.0 mL | Same as above |
| ATIII activity | Labcorp 015040 (activity assay) | 2–3 days | 1.0 mL | 2.0 mL | Same as above |
| Von Willebrand factor antigen | Labcorp 086280 (immunoassay) | 1–3 days | 1.0 mL | 2.0 mL | Same as above |
| Protein S antigen | Labcorp 164517 (immunoassay) | 2–3 days | 2.0 mL | 4.0 mL | Same as above |
| Factor V Leiden Mutation Analysis | Labcorp 511154 (nucleic acid assay) | 5–7 days | n/a | 3.0 mL | None |
| Factor II (Prothrombin), DNA Analysis | Labcorp 511162 (nucleic acid assay) | 5–7 days | n/a | 3.0 mL | None |
| Sample Matrix | Immunoassays | Molecular | Chemical/Enzymatic Assays | |||
|---|---|---|---|---|---|---|
| Competitive | Sandwich | Genomic (Eukaryotic) | Infectious Disease (Prokaryotic) | Functional | Biochemical | |
| Blood | Free T4, cortisol | Insulin, human growth hormone, protein S, von Willebrand factor, thyroid stimulating hormone, creatine kinase MM | Factor II mutation, factor V Leiden | HIV | G6PD, antithrombin III, protein C, factor VIII, galactose-1-phosphate uridyltransferase | Total bilirubin, albumin, unbound bilirubin, glucose, beta-hydroxybutyrate, free fatty acids, factor Xa, phenylalanine, creatine kinase, glutamine, glutamate, ammonia |
| Urine | Fentanyl | NGAL, Cystatin C | Creatinine | |||
| Saliva | CMV | |||||
© 2020 by the authors. Licensee MDPI, Basel, Switzerland. This article is an open access article distributed under the terms and conditions of the Creative Commons Attribution (CC BY) license (http://creativecommons.org/licenses/by/4.0/).
Share and Cite
Sista, R.S.; Ng, R.; Nuffer, M.; Basmajian, M.; Coyne, J.; Elderbroom, J.; Hull, D.; Kay, K.; Krishnamurthy, M.; Roberts, C.; et al. Digital Microfluidic Platform to Maximize Diagnostic Tests with Low Sample Volumes from Newborns and Pediatric Patients. Diagnostics 2020, 10, 21. https://doi.org/10.3390/diagnostics10010021
Sista RS, Ng R, Nuffer M, Basmajian M, Coyne J, Elderbroom J, Hull D, Kay K, Krishnamurthy M, Roberts C, et al. Digital Microfluidic Platform to Maximize Diagnostic Tests with Low Sample Volumes from Newborns and Pediatric Patients. Diagnostics. 2020; 10(1):21. https://doi.org/10.3390/diagnostics10010021
Chicago/Turabian StyleSista, Rama S., Rainer Ng, Miriam Nuffer, Michael Basmajian, Jacob Coyne, Jennifer Elderbroom, Daniel Hull, Kathryn Kay, Maithri Krishnamurthy, Christopher Roberts, and et al. 2020. "Digital Microfluidic Platform to Maximize Diagnostic Tests with Low Sample Volumes from Newborns and Pediatric Patients" Diagnostics 10, no. 1: 21. https://doi.org/10.3390/diagnostics10010021