Data Descriptor

DNA Methylome and Transcriptome Maps of Primary Colorectal Cancer and Matched Liver Metastasis

1
Department of Pathology, Dunedin School of Medicine, University of Otago, Dunedin 9016, New Zealand
2
Peter MacCallum Cancer Centre, Melbourne, VIC 3052, Australia
3
The Sir Peter MacCallum Department of Oncology, Faculty of Medicine, Dentistry and Health Sciences, University of Melbourne, Melbourne, VIC 3052, Australia
4
Department of Medicine, Dunedin School of Medicine, University of Otago, Dunedin 9016, New Zealand
5
Evotec SE, 22419 Hamburg, Germany
6
Department of Surgery, University of Otago, Christchurch 8011, New Zealand
7
UPES University, Dehradun 248007, India
*
Authors to whom correspondence should be addressed.
Submission received: 30 October 2023 / Revised: 8 December 2023 / Accepted: 18 December 2023 / Published: 29 December 2023

Abstract

:
Sequencing-based genome-wide DNA methylation, gene expression studies and associated data on paired colorectal cancer (CRC) primary and liver metastasis are very limited. We have profiled the DNA methylome and transcriptome of matched primary CRC and liver metastasis samples from the same patients. Genome-scale methylation and expression levels were examined using Reduced Representation Bisulfite Sequencing (RRBS) and RNA-Seq, respectively. To investigate DNA methylation and expression patterns, we generated a total of 1.01 × 10⁹ RRBS reads and 4.38 × 10⁸ RNA-Seq reads from the matched cancer tissues. Here, we describe in detail the sample features, experimental design, methods and bioinformatic pipeline for these epigenetic data. We demonstrate the quality of both the samples and sequence data obtained from the paired samples. The sequencing data obtained from this study will serve as a valuable resource for studying underlying mechanisms of distant metastasis and the utility of epigenetic profiles in cancer metastasis.
Dataset: The data have been deposited in the GEO database under accession number GSE213402.
Dataset License: License under which the dataset is made available: CC BY-NC-ND.

1. Introduction

Colorectal cancer (CRC) is currently ranked as the third most frequent cancer and as second in cancer-related mortality worldwide [1,2]. The annual incidence rate in 2020 was estimated to be 2 million new cases, and 3.2 million cases are expected in 2040, which represents a predicted 63% increase in the next 20 years [1]. As with most solid cancers, metastasis is the prevalent cause of CRC mortality [3,4]. According to Ciardiello et al. [5], around 20% of CRC patients present with metastatic disease at initial diagnosis, and up to 50% of patients with non-metastatic CRC develop metastatic disease over time. The most common site of metastatic disease in CRC patients is the liver, followed by the lungs [6,7]. The current standard treatment for liver metastasis is liver resection, although there is a 60% to 70% recurrence rate [8,9]. However, the majority of patients with liver metastases are ineligible for surgery because of an insufficient future liver remnant (FLR) or extensive tumour dissemination [6]. A small FLR with a low hepatic functional reserve can increase the risk of posthepatectomy liver failure [10].
Metastasis is a complex and multistep process that involves a myriad of epigenetic and transcriptomic changes [11,12,13,14]. Multiple genes have been identified with changes in methylation and expression in CRC liver metastasis when compared with primary CRC tumours [15,16,17,18,19,20,21,22,23]. Although studies have identified methylation alterations between unpaired CRC primary and liver metastasis samples [16,17], identifying these changes by comparing matched primary tumours and metastases from the same patient provides a more direct measurement of epigenetic changes in tumour progression [24]. The analysis of paired samples also reduces inter-individual variations and increases statistical power [25,26]. However, it is challenging to obtain paired primary cancer and liver metastasis samples because metastasectomies are infrequently carried out [25]. Further, paired samples are not often retained as a part of routine clinical practice. Most studies on paired CRC liver metastasis and DNA methylation have focused on analysing the methylation patterns of specific genes or miR-200 family members [18,19,20,21,22,23]. However, there is very limited data available on genome-wide methylation patterns for paired CRC primary and liver metastasis. Two studies have used microarray-based platforms to analyse genome-wide methylation patterns, but neither included genome-wide transcriptome analysis on the paired samples [20,22]. We have recently performed whole-genome-scale sequence-based methylation and combined transcriptome studies paired primary CRC and matched liver metastasis samples to identify epigenetic markers for CRC liver metastasis [27]. This approach provides the opportunity to detect functional epigenetic signatures and yield insights into molecular mechanisms of cancer progression and the development of metastases. Furthermore, it is important to acknowledge the value of transcriptome analyses, specifically in CRC liver metastasis. For instance, the application of machine learning coupled with bioinformatic analysis allowed insights into gene expression patterns, functional significance and prognostic relevance in CRC liver metastasis patients [28]. This investigation utilised microarray-based gene expression data obtained from hepatic resections of liver metastases from primary colorectal tumours [28]. However, relying solely on transcriptome data from hepatic resections of liver metastases overlooks crucial information about changes in primary tumours. This approach provides a limited view of tumour evolution and interactions beyond gene expression and lacks the capacity for multi-omics analysis. Utilising paired samples in conjunction with multi-omics data is preferable for revealing the epigenetic and transcriptomic alterations in CRC liver metastasis.
To our knowledge, here we present new whole-genome-scale sequence-based methylation and combined transcriptome data of clinically well-annotated paired primary CRC and matched liver metastasis samples. We have generated DNA methylation using Reduced Representation Bisulfite Sequencing (RRBS) and transcriptome (RNA-Seq) maps of paired primary cancers and liver metastases from 10 CRC patients. The samples were obtained from both male (n = 7) and female (n = 3) patients aged between 57 and 75. Robust clinical data relevant to this study were obtained to conduct a broad range of analyses. Here, we present a detailed description of the tissue samples, experimental design, methods and bioinformatic pipeline, which include all the tools and packages to analyse the RRBS and transcriptome data (Figure 1).

2. Data Description

Patient data, which included sex, age and tumour site, were obtained from patient medical records (Table 1). Additional information regarding patient data can be accessed through the supplementary Table 1 in [27]. All the RRBS and RNA-Seq data reported in this article have been deposited in the GEO database under accession number GSE213402 (see the GEO website at https://www.ncbi.nlm.nih.gov/geo/query/acc.cgi?acc=GSE213402, accessed on 17 December 2023). Each data file is assigned an accession number and has a ‘GSM’ prefix (Table 1). Raw single-end RRBS and paired-end RNA-Seq files for all the samples are in fastq file format. The processed RRBS file is in .txt format (file name: CRCvsLM_RRBS_processed.txt). The processed transcript per million (TPM) file is in .csv format (file name: CRCvsLM_RNASEQ_processed.csv).

3. Results

3.1. DNA and RNA Quality

We have obtained DNA and RNA from the fresh frozen clinical samples for epigenomic and transcriptomic analysis. The purity of the DNA was determined by measuring the 260/280 and 260/230 ratios. A 260/280 ratio within the range of 1.8–2.0 and a 260/230 ratio within 2.0–2.2 shows high purity. The data from the current study shows a mean 260/280 ratio of 1.90 and a mean 260/230 ratio of 2.02, indicating the high quality of the DNA. The RNA purity was also evaluated by using absorbance ratios at 260/280 and 260/230 nm values. The acceptable absorbance ratio for RNA at 260/280 is ~2.0, and 260/230 is between 2.0 and 2.2 [29]. Our purified RNA from the fresh frozen samples had a mean 260/280 ratio of 2.07 and a mean 260/230 ratio of 1.74.

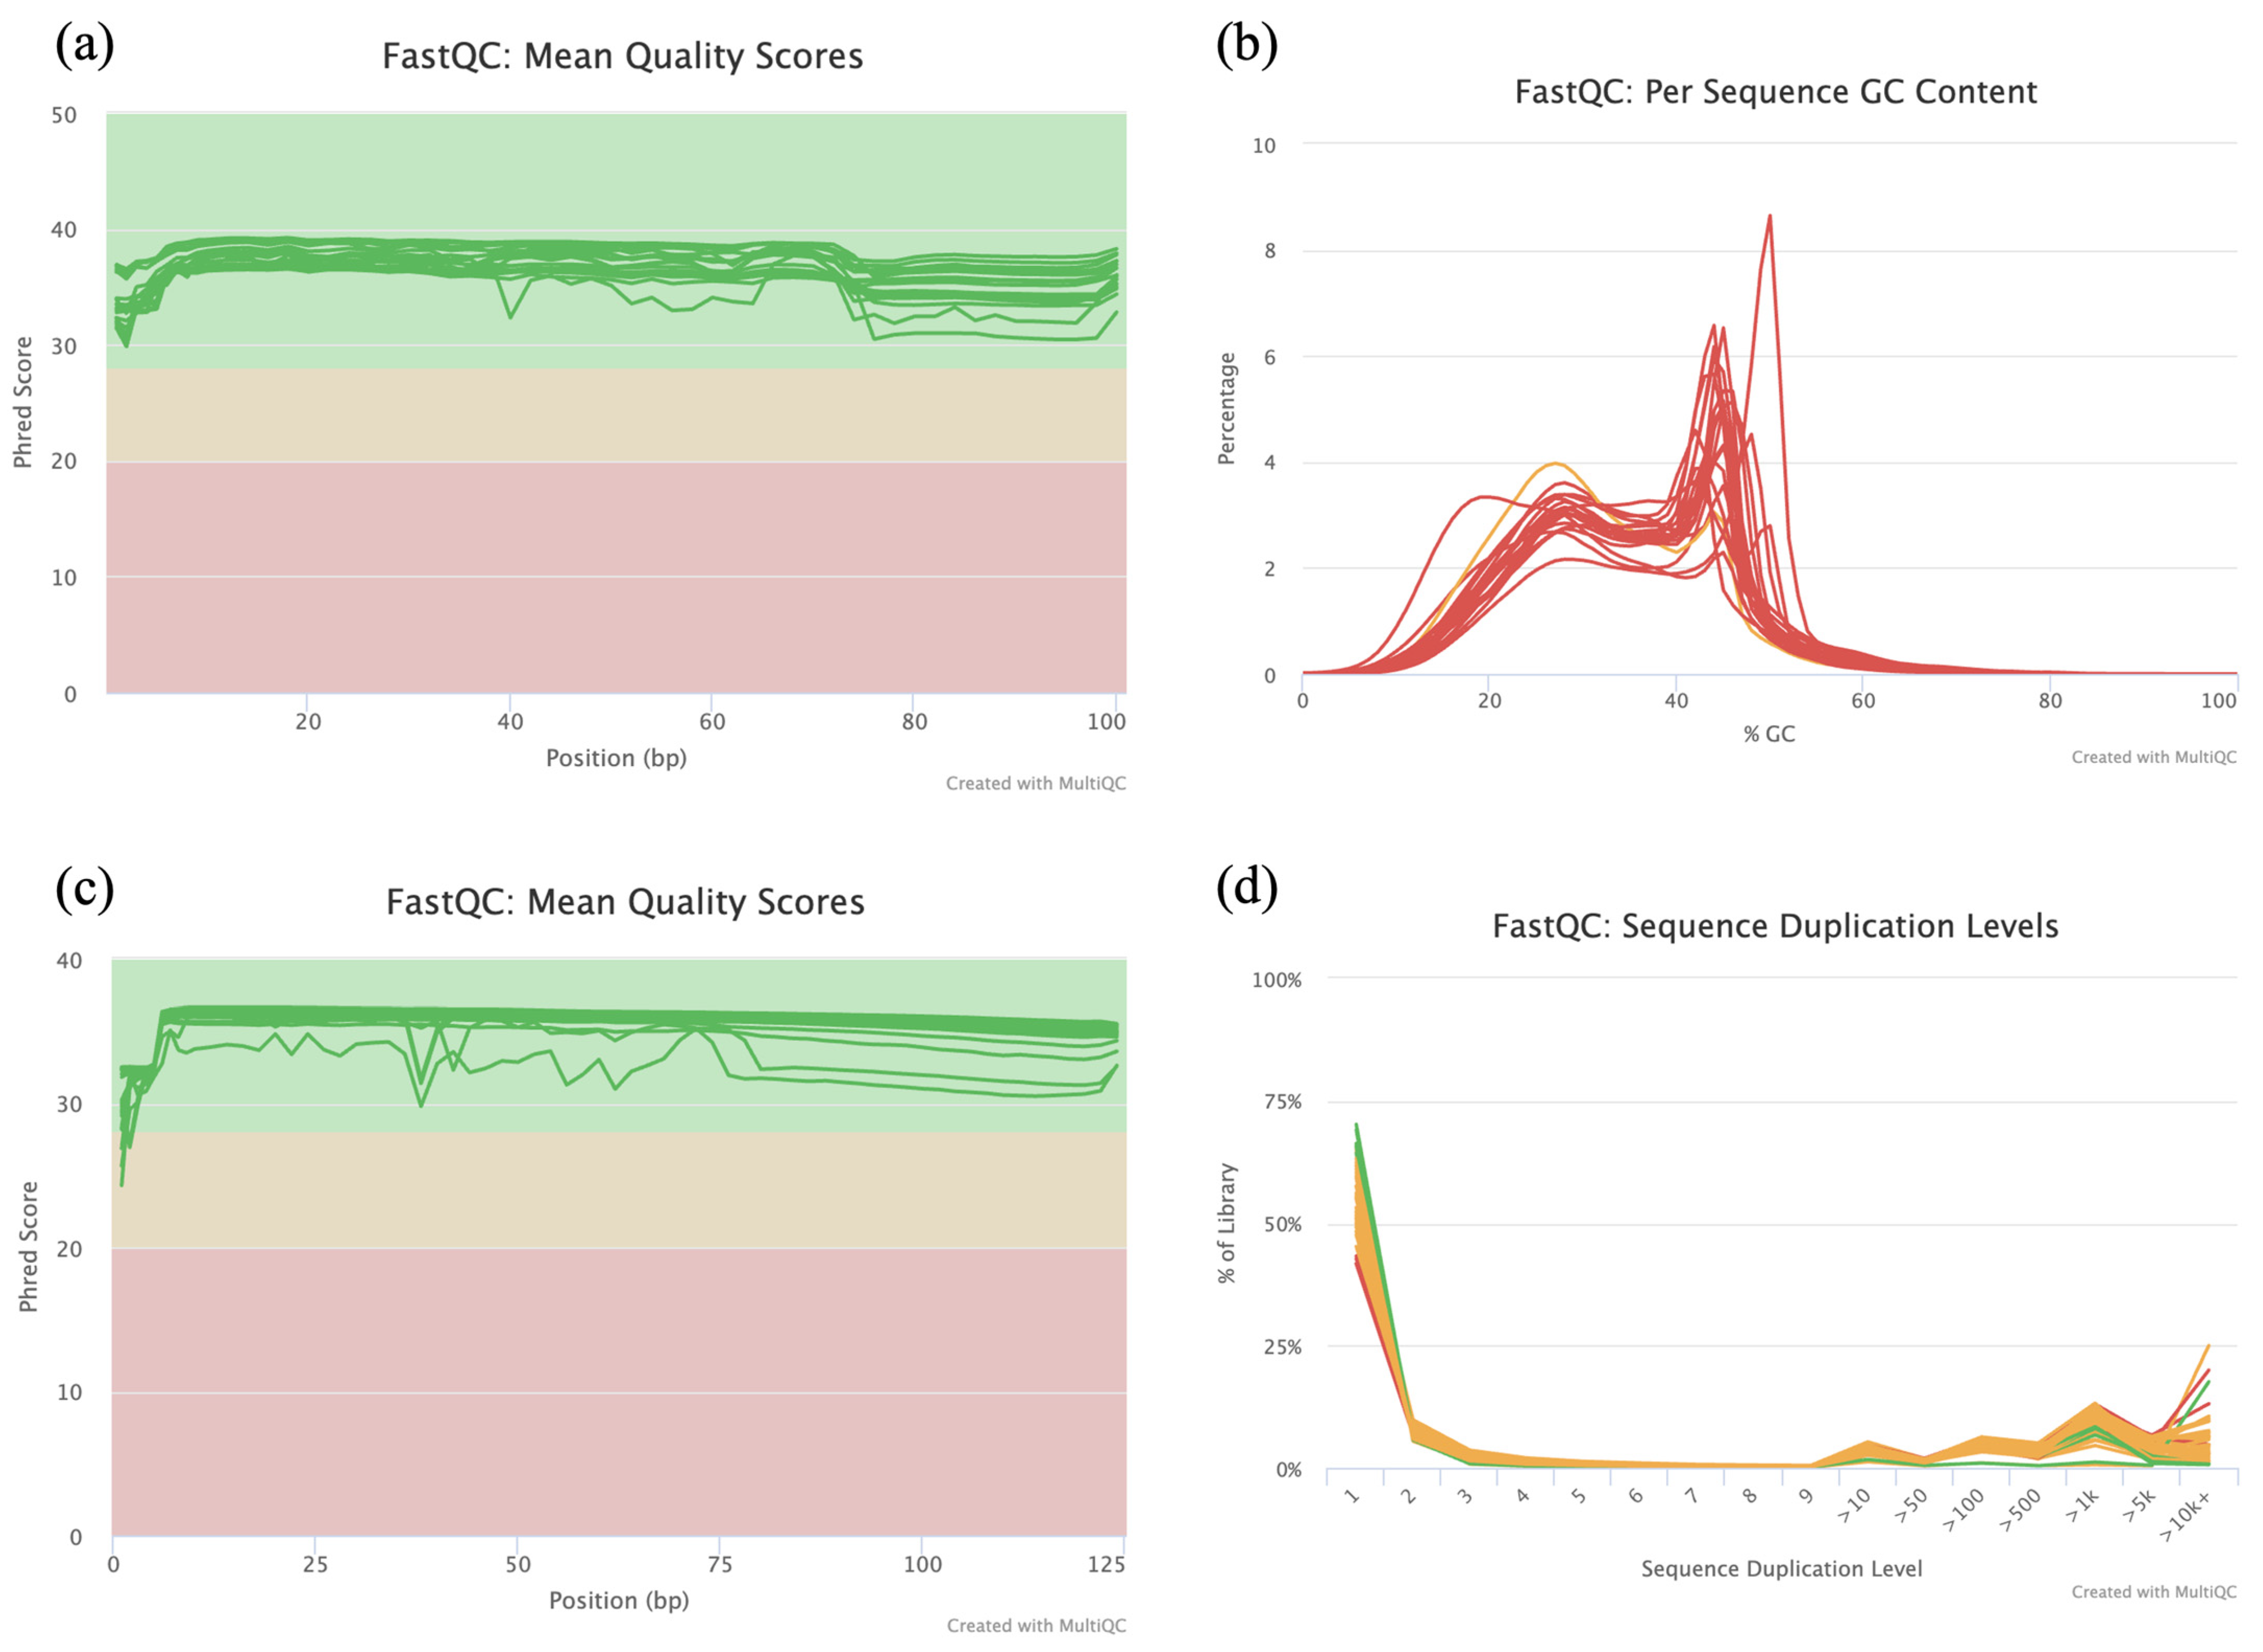
3.2. RRBS and RNA-Seq Data Quality

As a first quality evaluation, we analysed the raw RRBS reads. Adaptor sequences were trimmed, and low-quality reads were filtered out based on quality scores from the raw reads. Subsequently, the quality of trimmed reads was reassessed using FastQC with MultiQC packages, which showed that the quality was high with Phred quality scores > 30 throughout the 100 bp sequence cycle (Figure 2a). The per sequence GC content, which is the GC distribution of each sample compared to normal GC distribution, showed a shift in distribution due to the bisulphite conversion of Cs to Ts, therefore demonstrating the excellent quality of the methylation data (Figure 2b).
Following the initial quality assessment of the raw RNA reads, reads with a Phred score < 23 were filtered, and adaptor sequences were trimmed. After trimming the reads, only high-quality (Phred score > 24) reads were retained (Figure 2c). The distribution of duplicated sequences in the libraries was skewed to the left, with a high number of duplicates (>20%) at sequence duplication levels < 2 and >5k (Figure 2d). This is expected in RNA-Seq data, which contains highly expressed genes that will be over-sequenced [30].

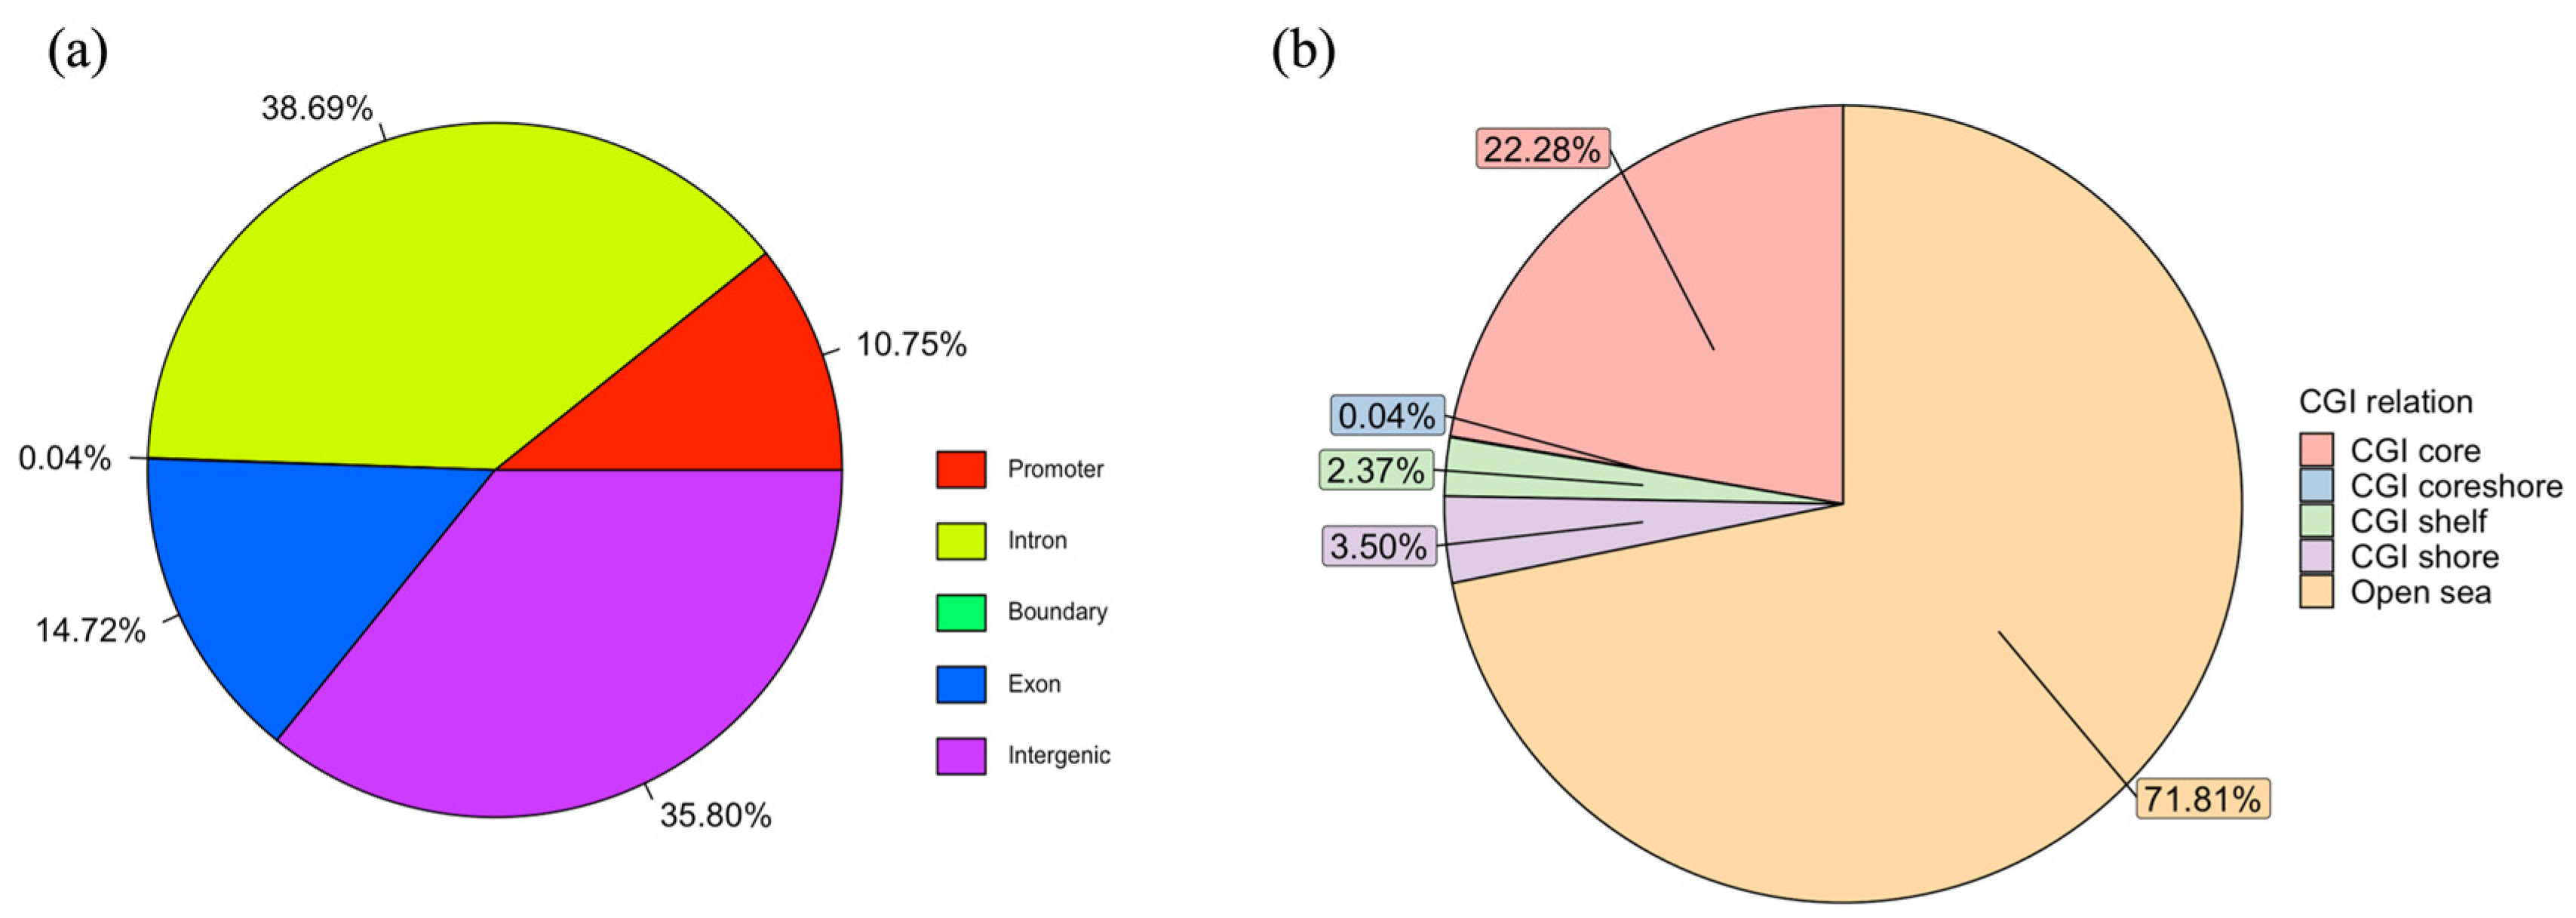
3.3. RRBS Alignment Quality and Characteristics of Methylome

RRBS reads were aligned to human genome hg19 with Bismark alignment with default parameters [31]. We have obtained a total of 1398 million sequenced reads for RRBS experiments, which was an average of 69 million reads per sample, and 36 million quality-filtered reads were mapped uniquely to the human genome per sample. We obtained a unique mapping efficiency between 25.40% and 62.80% (Table 2). Other studies have reported low mapping efficiency in fresh frozen samples, reaching as low as 16.7% [32,33]. We observed an average CpG methylation rate of 49.35% and a low non-CpG methylation rate (ranging from 0.31% to 0.54%) (Table 2), indicating that the bisulphite conversion process was highly efficient. There were a total of 5,470,738 CpGs that were in common to at least eight samples per group and ≥5-fold coverage, and the majority of these were situated within intronic, intergenic regions and promoters. Specifically, approximately 38.69% were found in introns, 35.80% in intergenic regions and 10.75% in promoters (Figure 3a). Further analysis showed that 28.19% of the CpGs were located in various subregions of CpG islands, including CpG island core, coreshore, shelf and shore, while 71.81% were situated in open sea regions (Figure 3b).

3.4. RRBS Technical Replicates

To examine the technical reproducibility, we included a technical replicate for a CRC primary sample (CRC316) and also for the paired CRC liver metastasis sample (LM316). The libraries were prepared using the same DNA extract, kits and platform. Spearman’s correlation analysis was used to assess the concordance between the replicates within the common CpG sites (with a coverage of 10 or more reads). The results showed strong correlations of DNA methylation levels between the two CRC316 replicates (Pearson R = 0.93, p < 2.2 × 10⁻¹⁶) and between the two LM316 replicates (Pearson R = 0.94, p < 2.2 × 10⁻¹⁶), indicating high reproducibility of RRBS results for fresh frozen clinical samples. This is consistent with our previous description of RRBS results and reproducibility [34,35]. For our differential methylation analysis, we have combined the technical replicates to increase CpG coverage [27].

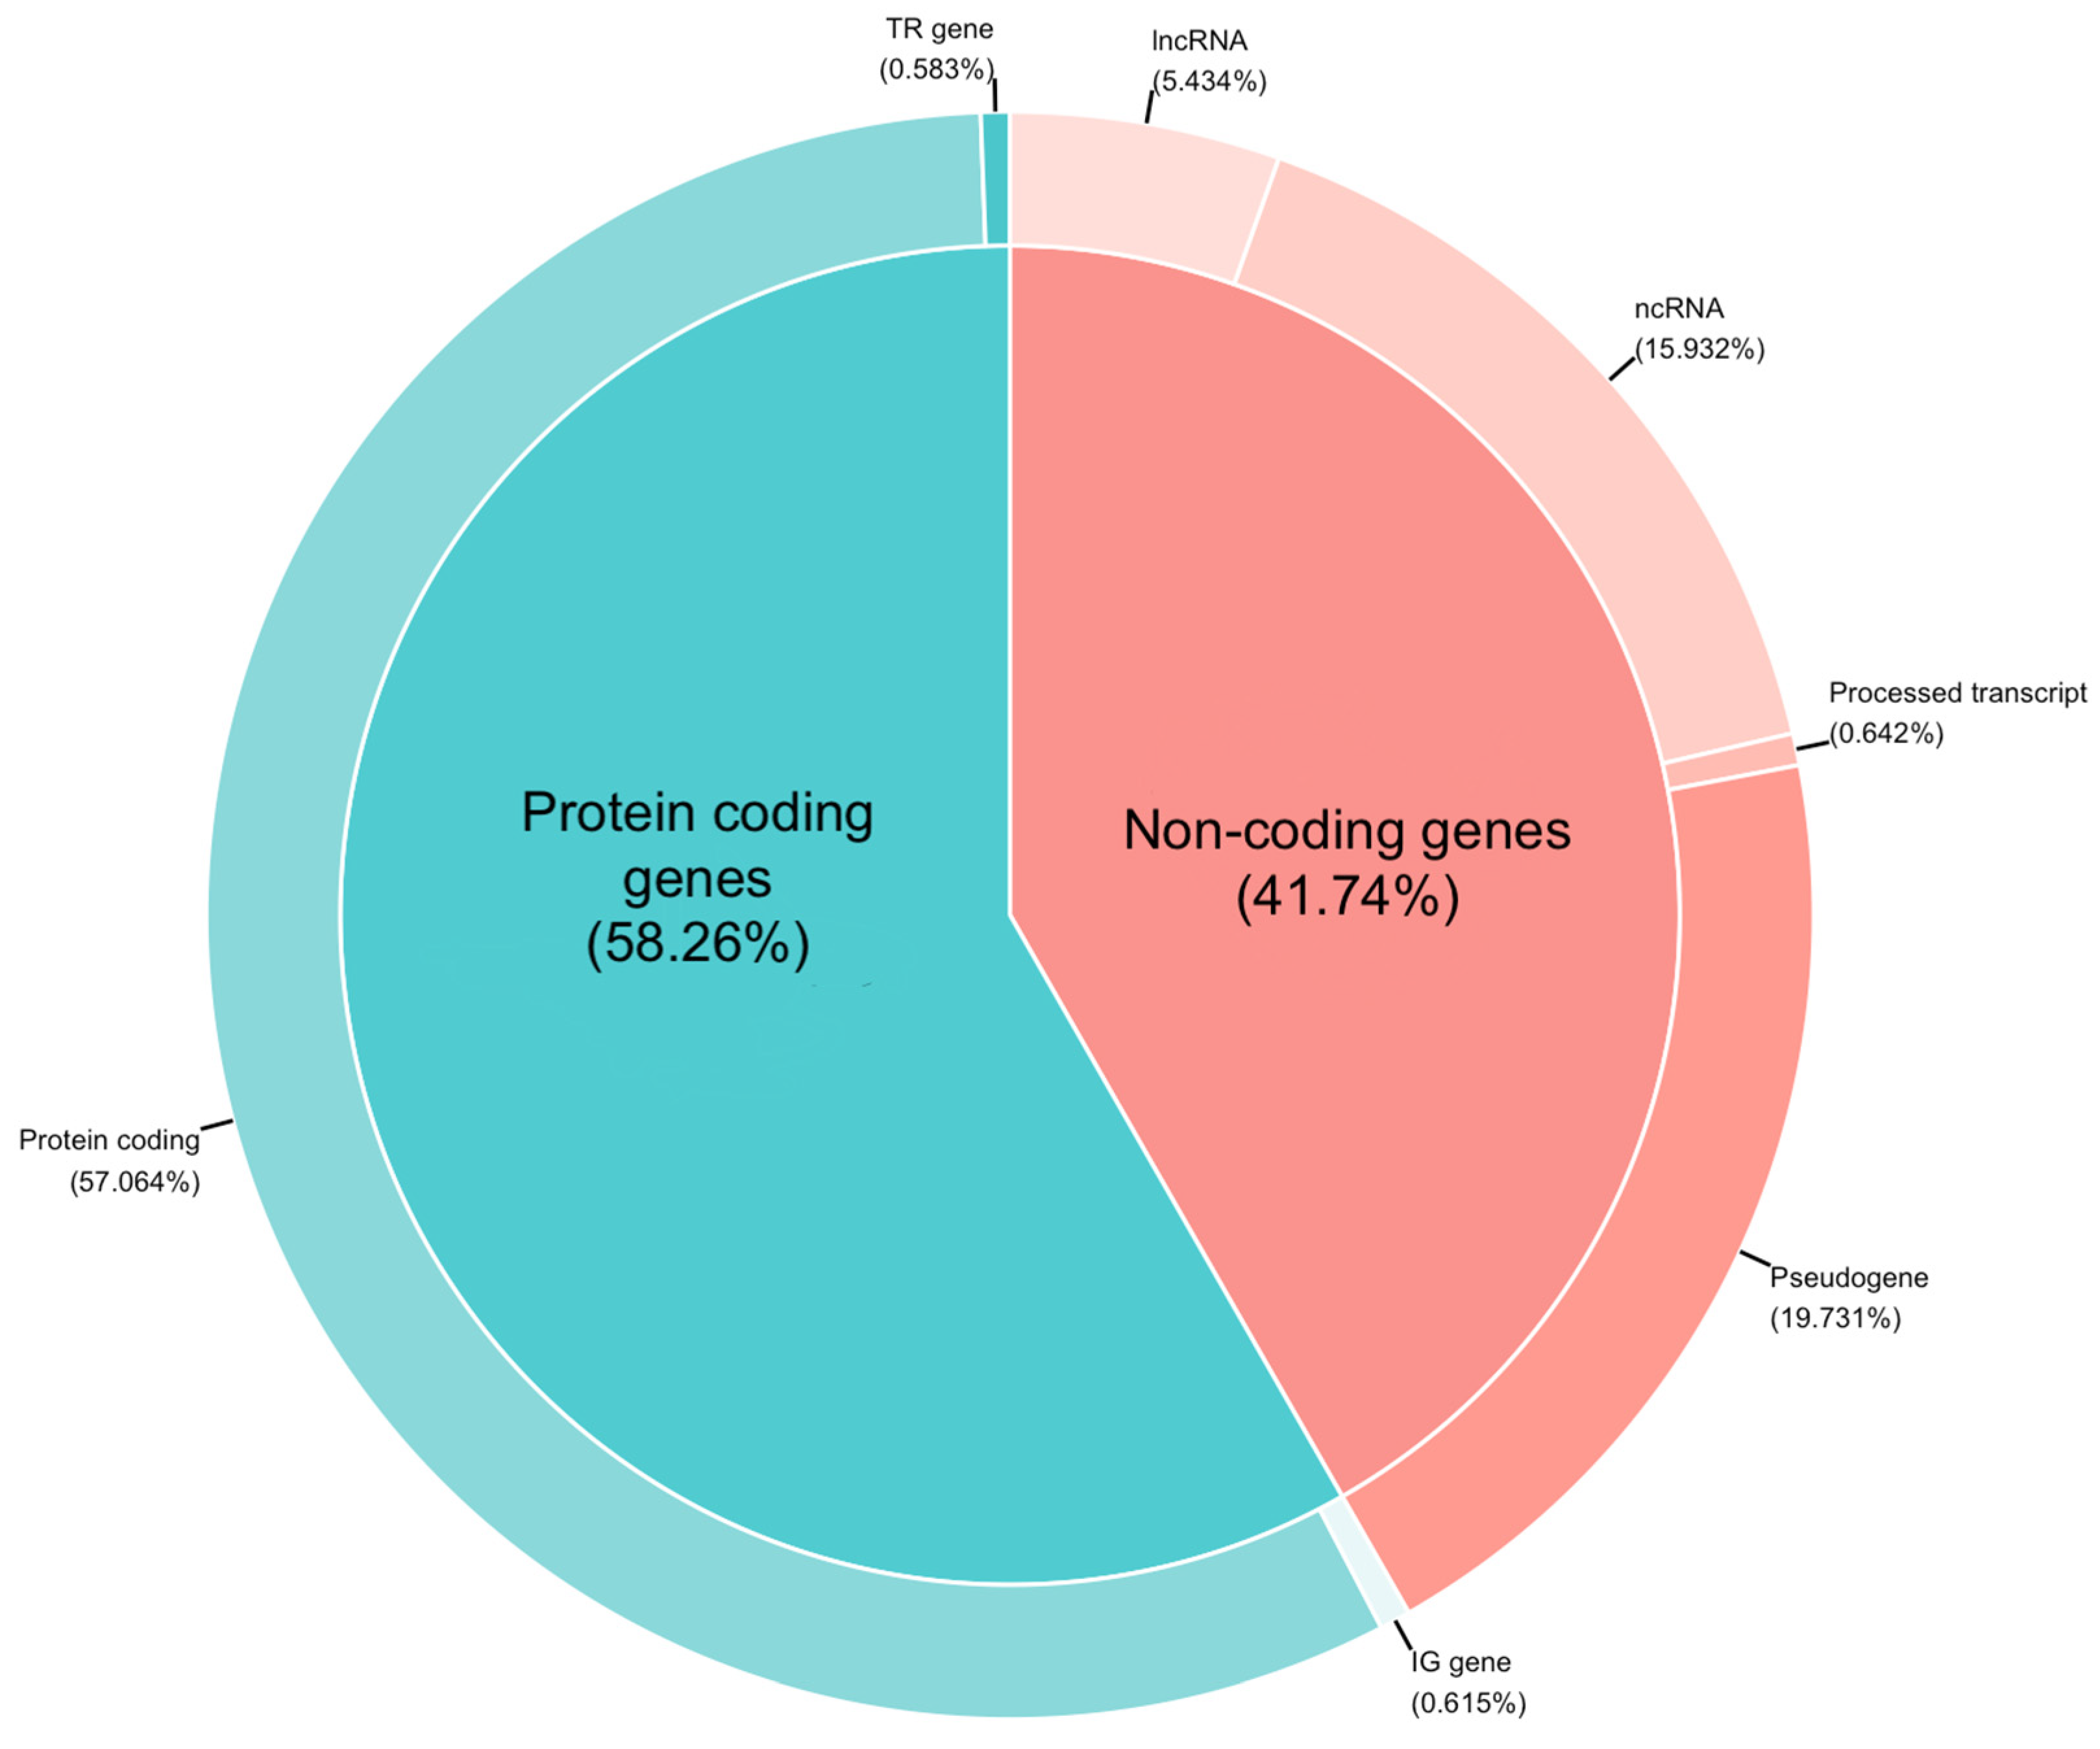
3.5. RNA-Seq Alignment Quality, Efficiency of rRNA Depletion and Transcriptome Analysis

RNA sequencing generated a total of 437 million reads, with an average of 21 million raw reads per sample. The raw RNA-Seq reads were trimmed and aligned to the human genome hg19 using HISAT aligner [36]. The summary of alignment statistics is provided in Table 3. The sequencing analysis yielded an average of 17 million uniquely mapped reads, representing 80.26% of the total sequenced reads (Table 3). Our results are consistent with the unique mapping percentages (ranging from 76% to 87%) reported in prior studies that utilised whole transcriptome RNA-Seq library preparation and ribosomal RNA depletion on fresh frozen samples [37,38] and further support the reliability of our findings. In our library preparation, ribosomal RNA (rRNA) was depleted using the Ribo-Zero Gold kit. To assess the efficiency of rRNA depletion in the library preparation, we have calculated the rRNA mapping rate. This analysis showed that the libraries had a very low percentage of rRNA reads, with a maximum rRNA mapping rate of 0.001% (Table 3). In comparison, another study reported a higher rRNA mapping rate of 0.1% in fresh frozen samples [37], indicating the effectiveness of our rRNA depletion method in minimising the presence of rRNA. Based on the Ensembl biotype gene and transcript classification, among the ~33,000 genes examined, 58.26% were classified as protein coding, which includes a distribution of 0.62% as immunoglobulin and 0.58% T cell receptor genes. The remaining 41.74% comprised non-coding genes, which encompassed 5.43% long non-coding RNA (lncRNA), 15.93% non-coding RNA (ncRNA), 0.64% processed transcript and 19.73% pseudogene entities, as illustrated in Figure 4.

4. Methods

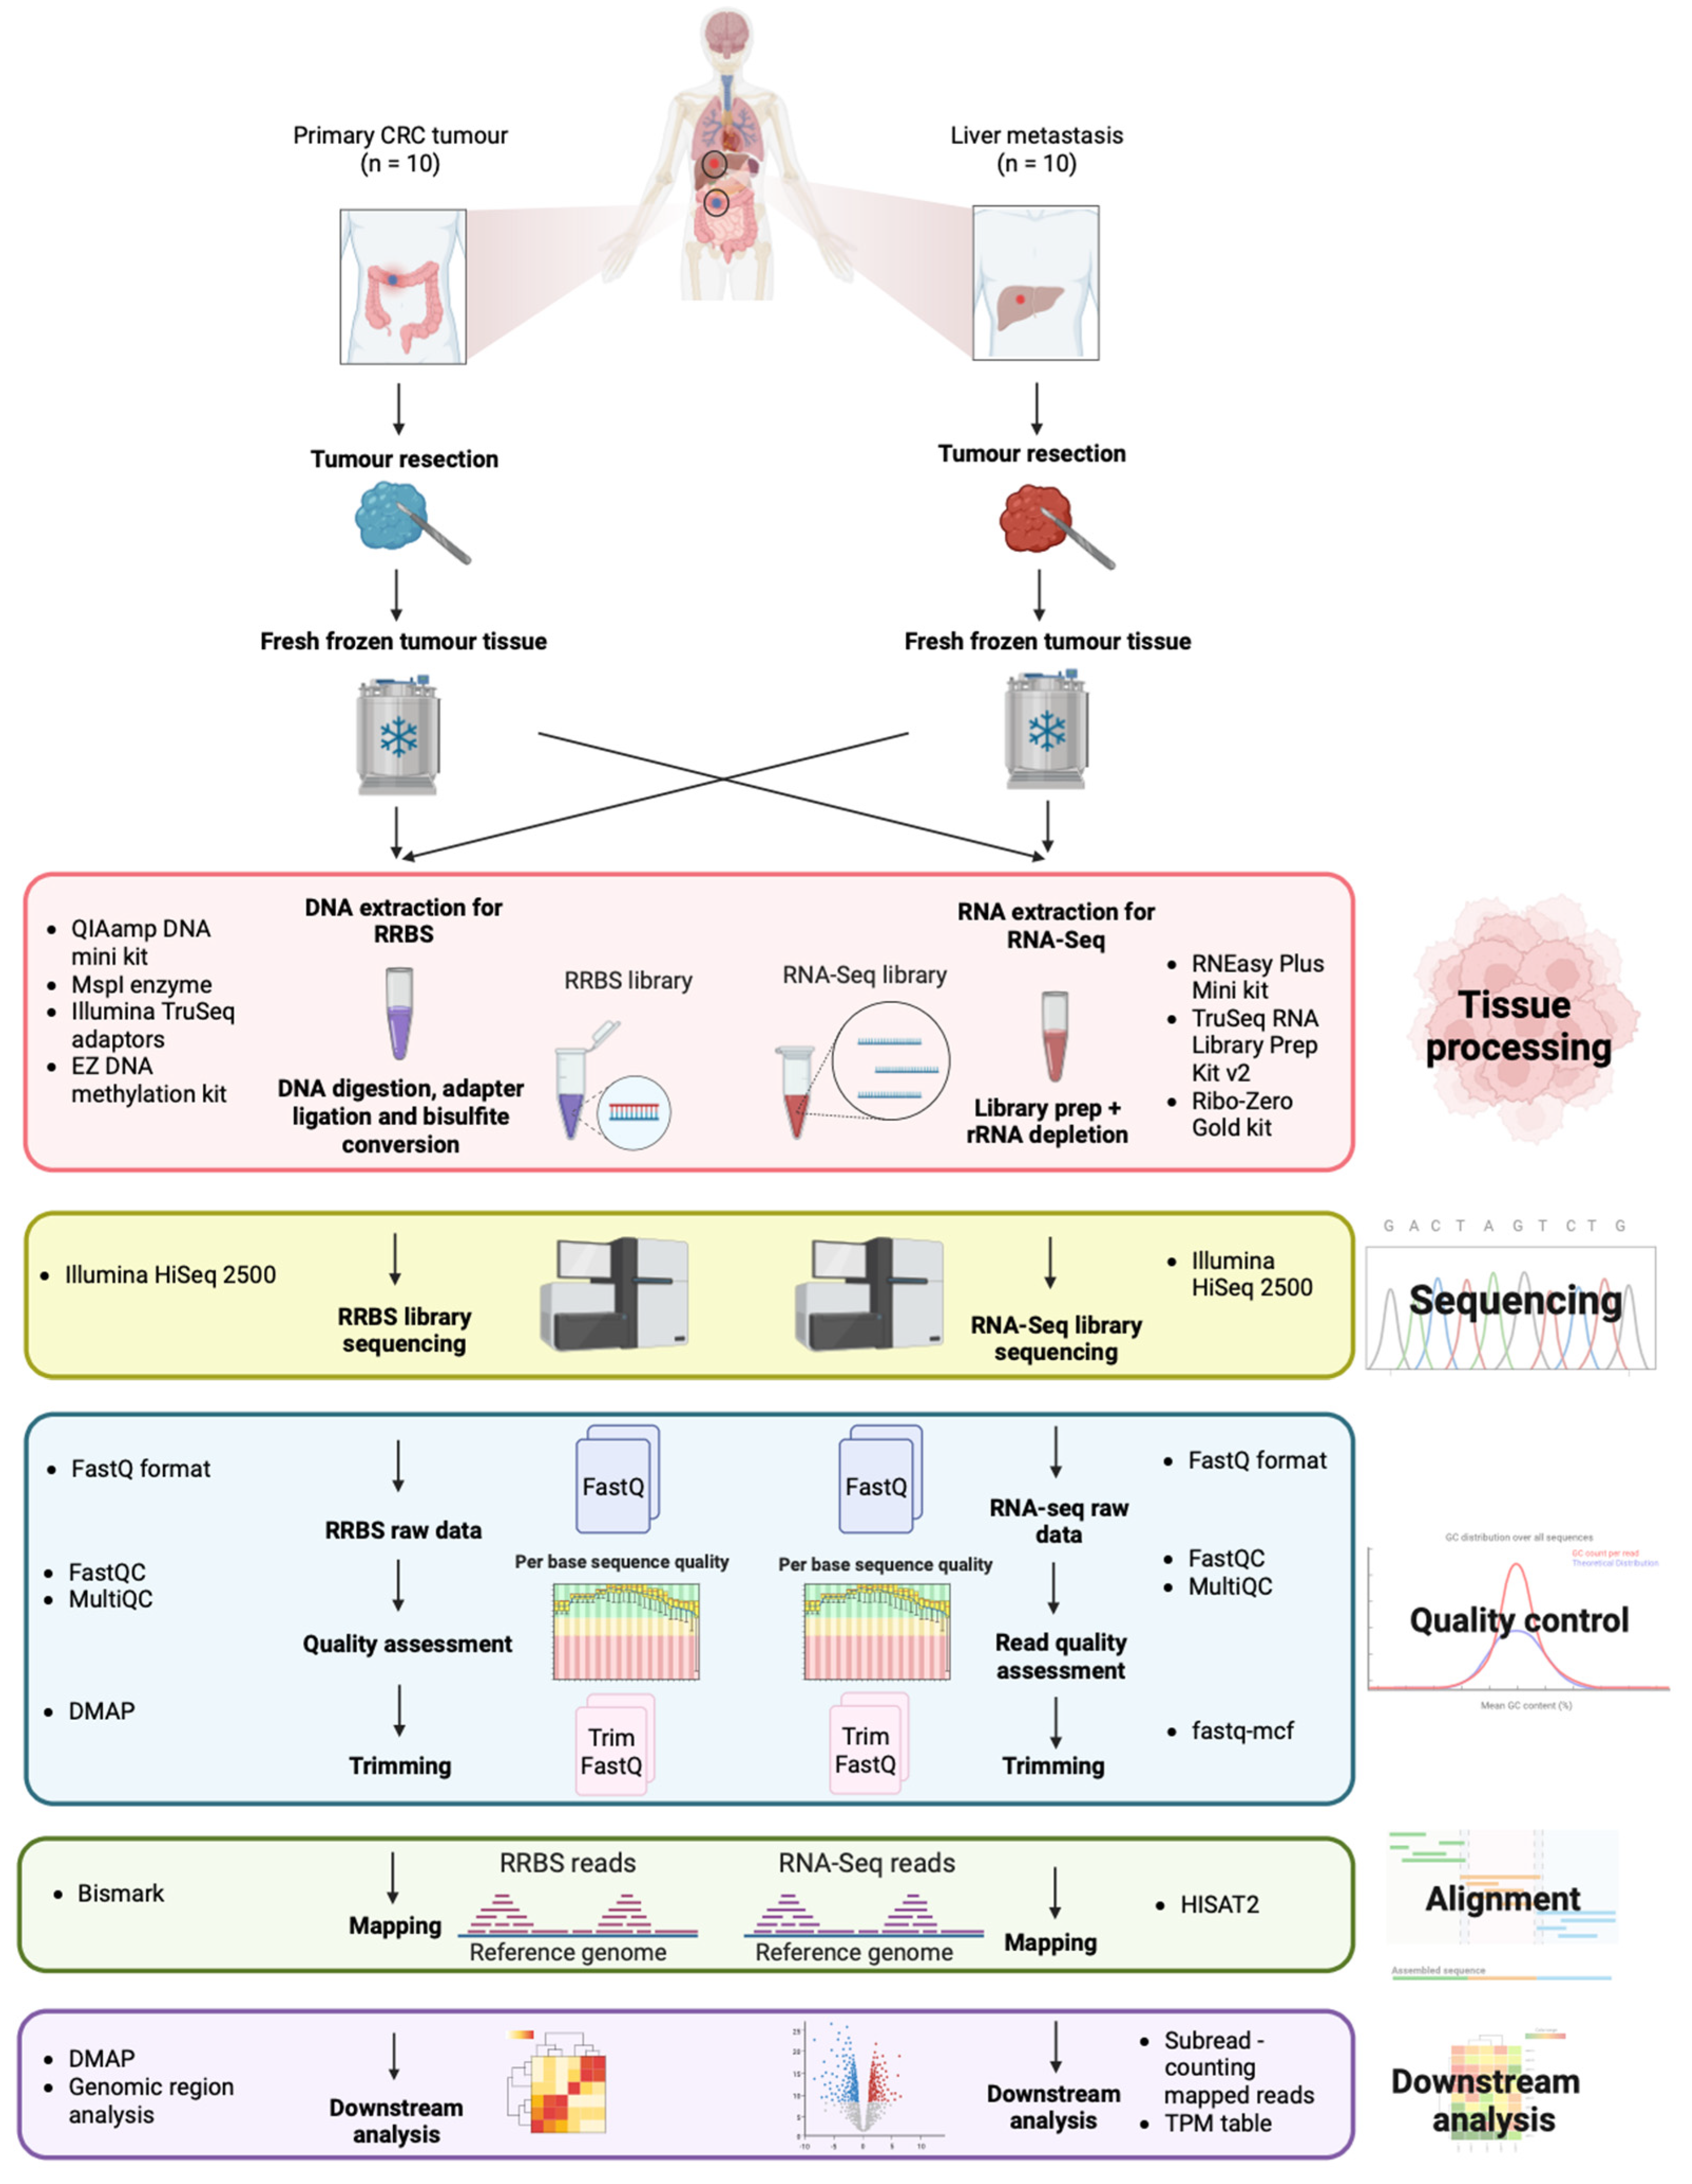
4.1. Tumour Samples and Clinical Data Collection

Paired fresh frozen tissue samples of primary colorectal adenocarcinomas (n = 10) and liver metastases (n = 10) were obtained from the Cancer Society Tissue Bank (University of Otago, Christchurch); all patients provided written informed consent. Ethical approval was granted for the use of these samples by the University of Otago Human Ethics Committee (approval number: H16/037). All samples used for nucleic acid extractions were stored under controlled conditions for a period ranging between 6 months and 6 years before being accessed for analysis.

4.2. Genomic DNA Extraction and RRBS Library Preparation

DNA was isolated from fresh frozen tissue samples using the QIAamp DNA mini kit (Qiagen, Hilden, Germany) according to the manufacturer’s instructions. DNA concentration was quantified with a Qubit dsDNA HS Assay Kit and Qubit 2.0 Fluorometer (Thermo Fisher Scientific, Waltham, MA, USA), and DNA quality was assessed using a NanoPhotometer (Implen, München, Germany). RRBS libraries were prepared following our previously described method [39]. Genomic DNA (100 ng–500 ng) was digested overnight with MspI enzyme (New England Biolabs, Ipswich, MA), using 20 units of enzyme per μg of DNA, and end repair was performed to add A-tail to the 3′ ends, which are required for adaptor ligation. Illumina TruSeq sequencing adaptors (Illumina, San Diego, CA) were ligated to the end-repaired fragments, and fragment sizes of 40 bp to 220 bp were selected using sample purification beads (SPB) (Illumina, USA). Subsequently, bisulphite conversion was performed on the size-selected fragments using the EZ DNA methylation kit (Zymo Research, Irvine, CA, USA) according to the manufacturer’s instructions. The bisulphite-converted DNA was amplified using KAPA HiFi HotStart Uracil+ (Kapa Biosystems, Roche, Basilea, Switzerland). An Agilent 2100 Bioanalyzer was used to evaluate the library quality and size range. The RRBS library was sequenced on a HiSeq 2500 instrument (Illumina, San Diego, CA, USA) with 100 bp single-end reads.

4.3. RRBS Data Analysis

The quality of RRBS reads was evaluated using the most commonly used quality control programs: FastQC (http://www.bioinformatics.babraham.ac.uk/projects/fastqc/) and MultiQC tool [40]. Low-quality reads, adaptor sequences and 3′ end (3′ end consists of unmethylated CpG bases which were incorporated during the end-repair reaction) were trimmed using our in-house cleanadaptors tool from the DMAP package [41]. Subsequently, the reads were aligned to the human reference genome (GRCh37, hg19) with the bisulphite aligner Bismark [31], allowing one mismatch in the seed. Bismark alignment is fast and has a relatively low bias when used to align RRBS data [42]. After the alignment, CpG sites were called using the Bismark methylation extractor with a cut-off of 5× coverage. The identgeneloc program of the DMAP package was used to assign the closest genes and genomic locations for all CpGs.

4.4. RNA Extraction and Sequencing

Fresh frozen tissue samples were weighed, and <20 mg of tissue was homogenised with a Retsch Mixer Mill (Retsch, Germany). Total RNA was isolated with the RNEasy Plus Mini Kit (Qiagen, Hilden, Germany), and RNA purity was measured using a NanoPhotometer. RNA-seq libraries were prepared using TruSeq RNA Library Prep Kit v2 (Illumina, San Diego, CA, USA), and ribosomal RNA was depleted using Ribo-Zero Gold (Illumina, San Diego, CA) following the manufacturer’s protocol. The quality of ribosomal RNA-depleted libraries was determined on a Bioanalyzer and then sequenced on an Illumina HiSeq 2500 V4 platform, and 125 bp paired-end reads were generated.

4.5. RNA-Sequencing Data Analysis

The quality of raw reads was evaluated with FastQC (http://www.bioinformatics.babraham.ac.uk/projects/fastqc/, accessed on 4 February 2023) and MultiQC tool [40]. fastq-mcf tools from the ea-utils package [43] were used to trim sequences with a Phred score of less than 20 and adaptor sequences. The processed reads were mapped to the hg19 reference human genome (GRCh37) with HISAT2 version 2.0.5 [36]. HISAT2 is considered to have high sensitivity (97.3%), high precision (94.8%), low run time (26.7 min) and low memory usage (4.3 GB) when compared to other aligners [44]. Featurecounts [45] in the Subread package was used to count the reads to individual genes, and a gene annotation file was obtained from Ensemble. Counts are normalised to remove unwanted technical variation caused by library preparation, mapping bias and other sources of variation [46]. The gene expression levels were quantified using TPM values.

5. Summary

The RRBS and RNA-Seq data (both raw and unprocessed) are available from the GEO database via the accession number GSE213402. The GitHub respiratory contains all the tools and codes to analyse this data using the established RRBS and RNA-Seq pipeline. This study represents the first attempt to investigate CRC liver metastasis epigenetic markers by combining RRBS and RNA-Seq data in paired CRC primary and liver metastases. Even though there is a growing interest in studying CRC liver metastasis, there is a gap in the literature regarding the application of high-throughput sequencing technology in paired CRC liver metastasis samples. This gap restricts our understanding of the epigenetic and transcriptome changes associated with CRC liver metastasis. Our data are critical to understanding these changes and regulatory mechanisms involved in the development of CRC liver metastases; they can be used as an independent cohort for future studies and validation. Further, deep learning methods could be applied in future work on these datasets to reveal novel patterns of tumours [47]. The integration of multi-omics data sets in paired samples provides a great opportunity to understand the complex dynamics of tumour progression, treatment response and the identification of novel biomarkers for early detection and diagnosis of CRC metastasis in the future. It is also valuable for the identification of potential drivers of metastasis and developing targeted therapies for patients, which could improve prognosis and survival.

Author Contributions

Conceptualisation, E.J.R. and A.C.; formal analysis, P.A., E.J.R., G.G., P.A.S. and S.A.; investigation, E.J.R., S.A., S.A.B., A.L.L., A.A., S.S., S.P., R.V.P. and A.C.; resources, M.R.E., F.A.F., R.V.P. and A.C.; data curation, P.A., E.J.R., G.G., P.A.S. and S.S.; writing—original draft preparation, P.A.; writing—review and editing, All authors.; visualisation, P.A.; supervision, M.R.E., R.V.P., E.J.R. and A.C.; project administration, E.J.R., R.V.P. and A.C.; funding acquisition, R.V.P. and A.C. All authors have read and agreed to the published version of the manuscript.

Funding

This study was funded by the Royal Society of New Zealand Te Apārangi (for a Rutherford Discovery Fellowship to A.C. and Marsden Fund to E.R. and A.C.) and grants from Lottery Health Research New Zealand, the University of Otago (A.C.), Maurice and Phyllis Paykel Trust and Gut Cancer Foundation NZ (to R.P.). We are also grateful for additional support from the T.D. Scott Chair in Urology and Department of Surgical Sciences (to A.C. and E.R.), Hugh Green Foundation, Colorectal Surgical Society of Australia and New Zealand (to R.P.), Maurice Wilkins Centre for Molecular Biodiscovery, Cancer Society of New Zealand, Health Research Council of New Zealand, New Zealand Institute for Cancer Research Trust (to M.E.—salary support for A.C., E.R., S.A., A.L.) and John Gavin Postdoctoral Fellowship from the Cancer Research Trust New Zealand (to A.A.).

Institutional Review Board Statement

The study was conducted in accordance with the Declaration of Helsinki and approved by the Human Ethics Committee of the University of Otago (Approval number: H16/037).

Informed Consent Statement

Informed consent was obtained from all subjects involved in the study.

Data Availability Statement

The data have been deposited in the GEO database under accession number GSE213402.

Acknowledgments

The authors are grateful to the patients and their families who contributed to this study, the Cancer Society Tissue Bank (CSTB) and the Otago Genomics Facility at the University of Otago for providing the sequencing service and assistance.

Conflicts of Interest

Author Sebastian Schmeier was employed by the company Evotec SE. The remaining authors declare that the research was conducted in the absence of any commercial or financial relationships that could be construed as a potential conflict of interest.

References

  1. Morgan, E.; Arnold, M.; Gini, A.; Lorenzoni, V.; Cabasag, C.J.; Laversanne, M.; Vignat, J.; Ferlay, J.; Murphy, N.; Bray, F. Global burden of colorectal cancer in 2020 and 2040: Incidence and mortality estimates from GLOBOCAN. Gut 2023, 72, 338–344. [Google Scholar] [CrossRef]
  2. Cervantes, A.; Adam, R.; Roselló, S.; Arnold, D.; Normanno, N.; Taïeb, J.; Seligmann, J.; De Baere, T.; Osterlund, P.; Yoshino, T.; et al. Metastatic colorectal cancer: ESMO Clinical Practice Guideline for diagnosis, treatment and follow-up. Ann. Oncol. 2022, 34, 10–32. [Google Scholar] [CrossRef]
  3. Lenos, K.J.; Bach, S.; Moreno, L.F.; Hoorn, S.T.; Sluiter, N.R.; Bootsma, S.; Braga, F.A.V.; Nijman, L.E.; Bosch, T.v.D.; Miedema, D.M.; et al. Molecular characterization of colorectal cancer related peritoneal metastatic disease. Nat. Commun. 2022, 13, 4443. [Google Scholar] [CrossRef]
  4. Pretzsch, E.; Nieß, H.; Bösch, F.; Westphalen, C.B.; Jacob, S.; Neumann, J.; Werner, J.; Heinemann, V.; Angele, M.K. Age and metastasis–how age influences metastatic spread in cancer. Colorectal cancer as a model. Cancer Epidemiol. 2022, 77, 102112. [Google Scholar] [CrossRef]
  5. Ciardiello, F.; Ciardiello, D.; Martini, G.; Napolitano, S.; Tabernero, J.; Cervantes, A. Clinical management of metastatic colorectal cancer in the era of precision medicine. CA A Cancer J. Clin. 2022, 72, 372–401. [Google Scholar] [CrossRef] [PubMed]
  6. Guidolin, K.; Choi, W.J.; Servidio-Italiano, F.; Quereshy, F.; Sapisochin, G. Attitudes of Canadian Colorectal Cancer Care Providers towards Liver Transplantation for Colorectal Liver Metastases: A National Survey. Curr. Oncol. 2022, 29, 602–612. [Google Scholar] [CrossRef] [PubMed]
  7. Lee, R.M.; Cardona, K.; Russell, M.C. Historical perspective: Two decades of progress in treating metastatic colorectal cancer. J. Surg. Oncol. 2019, 119, 549–563. [Google Scholar] [CrossRef]
  8. Viganò, L.; Branciforte, B.; Laurenti, V.; Costa, G.; Procopio, F.; Cimino, M.; Del Fabbro, D.; Di Tommaso, L.; Torzilli, G. The histopathological growth pattern of colorectal liver metastases impacts local recurrence risk and the adequate width of the surgical margin. Ann. Surg. Oncol. 2022, 29, 1–10. [Google Scholar] [CrossRef]
  9. Acciuffi, S.; Meyer, F.; Bauschke, A.; Croner, R.; Settmacher, U.; Altendorf-Hofmann, A. Solitary colorectal liver metastasis: Overview of treatment strategies and role of prognostic factors. J. Cancer Res. Clin. Oncol. 2022, 148, 657–665. [Google Scholar] [CrossRef]
  10. Kawaguchi, Y.; Lillemoe, H.A.; Vauthey, J. Dealing with an insufficient future liver remnant: Portal vein embolization and two-stage hepatectomy. J. Surg. Oncol. 2019, 119, 594–603. [Google Scholar] [CrossRef]
  11. Rodenhiser, D.I. Epigenetic contributions to cancer metastasis. Clin. Exp. Metastasis 2009, 26, 5–18. [Google Scholar] [CrossRef]
  12. Nowak, E.; Bednarek, I. Aspects of the Epigenetic Regulation of EMT Related to Cancer Metastasis. Cells 2021, 10, 3435. [Google Scholar] [CrossRef] [PubMed]
  13. Chen, J.F.; Yan, Q. The roles of epigenetics in cancer progression and metastasis. Biochem. J. 2021, 478, 3373–3393. [Google Scholar] [CrossRef] [PubMed]
  14. Patel, S.A.; Vanharanta, S. Epigenetic determinants of metastasis. Mol. Oncol. 2017, 11, 79–96. [Google Scholar] [CrossRef]
  15. Liu, J.; Li, H.; Sun, L.; Shen, S.; Zhou, Q.; Yuan, Y.; Xing, C. Epigenetic Alternations of MicroRNAs and DNA Methylation Contribute to Liver Metastasis of Colorectal Cancer. Dig. Dis. Sci. 2019, 64, 1523–1534. [Google Scholar] [CrossRef]
  16. Chen, J.; Röcken, C.; Lofton-Day, C.; Schulz, H.-U.; Müller, O.; Kutzner, N.; Malfertheiner, P.; Ebert, M.P. Molecular analysis of APC promoter methylation and protein expression in colorectal cancer metastasis. Carcinogenesis 2005, 26, 37–43. [Google Scholar] [CrossRef] [PubMed]
  17. Kim, Y.-H.; Petko, Z.; Dzieciatkowski, S.; Lin, L.; Ghiassi, M.; Stain, S.; Chapman, W.C.; Washington, M.K.; Willis, J.; Markowitz, S.D.; et al. CpG island methylation of genes accumulates during the adenoma progression step of the multistep pathogenesis of colorectal cancer. Genes Chromosom. Cancer 2006, 45, 781–789. [Google Scholar] [CrossRef]
  18. Konishi, K.; Watanabe, Y.; Shen, L.; Guo, Y.; Castoro, R.J.; Kondo, K.; Chung, W.; Ahmed, S.; Jelinek, J.; Boumber, Y.A.; et al. DNA Methylation Profiles of Primary Colorectal Carcinoma and Matched Liver Metastasis. PLoS ONE 2011, 6, e27889. [Google Scholar] [CrossRef]
  19. Murata, A.; Baba, Y.; Watanabe, M.; Shigaki, H.; Miyake, K.; Ishimoto, T.; Iwatsuki, M.; Iwagami, S.; Sakamoto, Y.; Miyamoto, Y.; et al. Methylation levels of LINE-1 in primary lesion and matched metastatic lesions of colorectal cancer. Br. J. Cancer 2013, 109, 408–415. [Google Scholar] [CrossRef]
  20. Chen, S.; Liu, T.; Bu, D.; Zhu, J.; Wang, X.; Pan, Y.; Liu, Y.; Lu, Z.J.; Wang, P. Methylome profiling identifies TCHH methylation in CfDNA as a noninvasive marker of liver metastasis in colorectal cancer. FASEB J. 2021, 35, e21720. [Google Scholar] [CrossRef]
  21. Ebert, M.P.; Mooney, S.H.; Tonnes-Priddy, L.; Lograsso, J.; Hoffmann, J.; Chent, J.; Rocken, C.; Schulz, H.-U.; Malfertheiner, P.; Lofton-Day, C. Hypermethylation of the TPEF/HPP1 Gene in Primary, Metastatic Colorectal Cancers. Neoplasia 2005, 7, 771–778. [Google Scholar] [CrossRef]
  22. Ju, H.-X.; An, B.; Okamoto, Y.; Shinjo, K.; Kanemitsu, Y.; Komori, K.; Hirai, T.; Shimizu, Y.; Sano, T.; Sawaki, A.; et al. Distinct Profiles of Epigenetic Evolution between Colorectal Cancers with and without Metastasis. Am. J. Pathol. 2011, 178, 1835–1846. [Google Scholar] [CrossRef]
  23. Hur, K.; Toiyama, Y.; Takahashi, M.; Balaguer, F.; Nagasaka, T.; Koike, J.; Hemmi, H.; Koi, M.; Boland, C.R.; Goel, A. MicroRNA-200c modulates epithelial-to-mesenchymal transition (EMT) in human colorectal cancer metastasis. Gut 2013, 62, 1315–1326. [Google Scholar] [CrossRef]
  24. De Krijger, I.; Mekenkamp, L.J.; Punt, C.J.; Nagtegaal, I.D. MicroRNAs in colorectal cancer metastasis. J. Pathol. 2011, 224, 438–447. [Google Scholar] [CrossRef] [PubMed]
  25. Del Rio, M.; Mollevi, C.; Vezzio-Vie, N.; Bibeau, F.; Ychou, M.; Martineau, P. Specific Extracellular Matrix Remodeling Signature of Colon Hepatic Metastases. PLoS ONE 2013, 8, e74599. [Google Scholar] [CrossRef]
  26. Stevens, J.R.; Herrick, J.S.; Wolff, R.K.; Slattery, M.L. Power in pairs: Assessing the statistical value of paired samples in tests for differential expression. BMC Genom. 2018, 19, 953. [Google Scholar] [CrossRef]
  27. Rodger, E.J.; Gimenez, G.; Ajithkumar, P.; Stockwell, P.A.; Almomani, S.; Bowden, S.A.; Leichter, A.L.; Ahn, A.; Pattison, S.; McCall, J.L.; et al. An epigenetic signature of advanced colorectal cancer metastasis. iScience 2023, 26, 106986. [Google Scholar] [CrossRef]
  28. Ashekyan, O.; Shahbazyan, N.; Bareghamyan, Y.; Kudryavzeva, A.; Mandel, D.; Schmidt, M.; Loeffler-Wirth, H.; Uduman, M.; Chand, D.; Underwood, D.; et al. Transcriptomic Maps of Colorectal Liver Metastasis: Machine Learning of Gene Activation Patterns and Epigenetic Trajectories in Support of Precision Medicine. Cancers 2023, 15, 3835. [Google Scholar] [CrossRef]
  29. Decruyenaere, P.; Verniers, K.; Poma-Soto, F.; Van Dorpe, J.; Offner, F.; Vandesompele, J. RNA Extraction Method Impacts Quality Metrics and Sequencing Results in Formalin-Fixed, Paraffin-Embedded Tissue Samples. Lab. Investig. 2023, 103, 100027. [Google Scholar] [CrossRef]
  30. Külahoglu, C.; Bräutigam, A. Quantitative Transcriptome Analysis Using RNA-seq. In Plant Circadian Networks: Methods and Protocols; Staiger, D., Ed.; Springer: New York, NY, USA, 2014; pp. 71–91. [Google Scholar]
  31. Krueger, F.; Andrews, S.R. Bismark: A flexible aligner and methylation caller for Bisulfite-Seq applications. Bioinformatics 2011, 27, 1571–1572. [Google Scholar] [CrossRef]
  32. Schillebeeckx, M.; Schrade, A.; Löbs, A.-K.; Pihlajoki, M.; Wilson, D.B.; Mitra, R.D. Laser capture microdissection–reduced representation bisulfite sequencing (LCM-RRBS) maps changes in DNA methylation associated with gonadectomy-induced adrenocortical neoplasia in the mouse. Nucleic Acids Res. 2013, 41, e116. [Google Scholar] [CrossRef]
  33. Gu, H.; Bock, C.; Mikkelsen, T.S.; Jäger, N.; Smith, Z.D.; Tomazou, E.; Gnirke, A.; Lander, E.S.; Meissner, A. Genome-scale DNA methylation mapping of clinical samples at single-nucleotide resolution. Nat. Methods 2010, 7, 133–136. [Google Scholar] [CrossRef]
  34. Chatterjee, A.; Stockwell, P.A.; Rodger, E.J.; Morison, I.M. Genome-scale DNA methylome and transcriptome profiling of human neutrophils. Sci. Data 2016, 3, 160019. [Google Scholar] [CrossRef]
  35. Chatterjee, A.; Macaulay, E.C.; Ahn, A.; Ludgate, J.L.; Stockwell, P.A.; Weeks, R.J.; Parry, M.F.; Foster, T.J.; Knarston, I.M.; Eccles, M.R.; et al. Comparative assessment of DNA methylation patterns between reduced representation bisulfite sequencing and Sequenom EpiTyper methylation analysis. Epigenomics 2017, 9, 823–832. [Google Scholar] [CrossRef] [PubMed]
  36. Kim, D.; Langmead, B.; Salzberg, S.L. HISAT: A fast spliced aligner with low memory requirements. Nat. Methods 2015, 12, 357–360. [Google Scholar] [CrossRef] [PubMed]
  37. Li, P.; Conley, A.; Zhang, H.; Kim, H.L. Whole-Transcriptome profiling of formalin-fixed, paraffin-embedded renal cell carcinoma by RNA-seq. BMC Genom. 2014, 15, 1087. [Google Scholar] [CrossRef] [PubMed]
  38. Shohdy, K.S.; Bareja, R.; Sigouros, M.; Wilkes, D.C.; Dorsaint, P.; Manohar, J.; Bockelman, D.; Xiang, J.Z.; Kim, R.; Ohara, K.; et al. Functional comparison of exome capture-based methods for transcriptomic profiling of formalin-fixed paraffin-embedded tumors. NPJ Genom. Med. 2021, 6, 1–10. [Google Scholar] [CrossRef] [PubMed]
  39. Rodger, E.J.; Stockwell, P.A.; Almomani, S.; Eccles, M.R.; Chatterjee, A. Protocol for generating high-quality genome-scale DNA methylation sequencing data from human cancer biospecimens. STAR Protoc. 2023, 4, 102714. [Google Scholar] [CrossRef]
  40. Ewels, P.; Magnusson, M.; Lundin, S.; Käller, M. MultiQC: Summarize analysis results for multiple tools and samples in a single report. Bioinformatics 2016, 32, 3047–3048. [Google Scholar] [CrossRef]
  41. Stockwell, P.A.; Chatterjee, A.; Rodger, E.J.; Morison, I. DMAP: Differential methylation analysis package for RRBS and WGBS data. Bioinformatics 2014, 30, 1814–1822. [Google Scholar] [CrossRef]
  42. Chatterjee, A.; Stockwell, P.A.; Rodger, E.J.; Morison, I.M. Comparison of alignment software for genome-wide bisulphite sequence data. Nucleic Acids Res. 2012, 40, e79. [Google Scholar] [CrossRef] [PubMed]
  43. Aronesty, E. ea-utils: Command-Line Tools for Processing Biological Sequencing Data. 2011. Available online: https://github.com/ExpressionAnalysis/ea-utils (accessed on 20 February 2023).
  44. Bahrami, A. Which Aligner Software is the Best for Our Study. J. Genet. Genome Res. 2020, 7, 048. [Google Scholar]
  45. Liao, Y.; Smyth, G.K.; Shi, W. feature Counts: An efficient general purpose program for assigning sequence reads to genomic features. Bioinformatics 2014, 30, 923–930. [Google Scholar] [CrossRef] [PubMed]
  46. Li, X.; Cooper, N.G.F.; O’Toole, T.E.; Rouchka, E.C. Choice of library size normalization and statistical methods for differential gene expression analysis in balanced two-group comparisons for RNA-seq studies. BMC Genom. 2020, 21, 75. [Google Scholar] [CrossRef]
  47. Yassi, M.; Chatterjee, A.; Parry, M. Application of deep learning in cancer epigenetics through DNA methylation analysis. Briefings Bioinform. 2023, 24, bbad411. [Google Scholar] [CrossRef]
Figure 1. Schematic view of the RRBS and RNA-Seq experiment and sequencing analysis workflow. DNA and RNA were extracted from 10 paired primary CRC and liver metastasis tissues. For RRBS (left), MspI digested libraries were bisulfite-converted and sequenced. The quality of raw RRBS data was checked, and adaptor sequences were removed. Reads were then mapped to the reference genome, and downstream data analyses were performed. For RNA-Seq (right), ribo-depleted libraries were constructed and sequenced, followed by quality assessment, quality trimming, mapping, generation of read counts and transcript per million (TPM). The figure was prepared using BioRender (www.biorender.com, accessed on 20 December 2023).
Data 09 00008 g001
Figure 2. MultiQC quality plots of RRBS and RNA-Seq data after trimming. (a) Mean quality values across each base position for all the RRBS samples, showing the read position on the X-axis and Phred score on the Y-axis. The y-axis with distinctions among high-quality calls (green), moderately acceptable calls (orange), and low-quality calls (red). (b) Per sequence GC content plot for all the RRBS samples—the X-axis is the percentage of GC, and the Y-axis is the percentage of reads. (c) Per base sequence quality plot for all RNA samples showing the read position on the X-axis and Phred score on the Y-axis. The Y-axis is categorised as high-quality calls (green), moderately acceptable calls (orange), and low-quality calls (red). (d) Sequence duplication levels for all RNA samples—the X-axis is the sequence duplication level, and the Y-axis is the percentage of library.
Data 09 00008 g002
Figure 3. The proportion of CpGs covered in genomic regions and CpG islands. (a) The percentage of common CpGs overlapping genomic regions. (b) The percentage of common CpG sites in relation to various CpG island features.
Data 09 00008 g003
Figure 4. Pie donut chart shows the percentage of genes distributed among the protein-coding and non-coding genes. The coding genes were further divided into protein coding, T cell receptor (TR) gene and Immunoglobulin (IG) genes. Non-coding genes are further classified into long non-coding RNA (lncRNA), non-coding RNA (ncRNA), processed transcript and pseudogene.
Data 09 00008 g004
Table 1. CRC patient details with RRBS and RNA-Seq accession number.
Patient No.Clinical DetailsCRC Primary Tumour Accession NumberLiver Metastasis Accession Number
SexAgePrimary
Tumour Site
RRBS DataRNA-Seq DataRRBS DataRNA-Seq Data
8M74ColonGSM6585685GSM6585705GSM6585695GSM6585715
87M74ColonGSM6585686GSM6585706GSM6585696GSM6585716
208M57ColonGSM6585687GSM6585707GSM6585697GSM6585717
241F60ColonGSM6585688GSM6585708GSM6585698GSM6585718
269F61ColonGSM6585689GSM6585709GSM6585699GSM6585719
270M64ColonGSM6585690GSM6585710GSM6585700GSM6585720
275F60RectumGSM6585691GSM6585711GSM6585701GSM6585721
311M57ColonGSM6585692GSM6585712GSM6585702GSM6585722
314M65ColonGSM6585693GSM6585713GSM6585703GSM6585723
316M75ColonGSM6585694GSM6585714GSM6585704GSM6585724
Table 2. Summary of RRBS alignment results for each sample.
Sample IDSequenced ReadsUnique ReadsMapping Efficiency (%)Total CpG Meth (%)Total Non-CpG Meth (%)
CRC867,293,600342,740,7050.9037.000.35
CRC8779,942,68942,651,39553.4056.200.49
CRC20815,865,5829,962,51962.8056.600.40
CRC24149,656,76930,745,53661.9050.400.42
CRC26954,605,56927,044,50249.5047.900.37
CRC27030,066,20216,094,32253.5042.500.38
CRC27590,499,30355,671,91061.5042.200.54
CRC31185,268,73146,371,40854.4048.500.45
CRC31494,196,06251,990,75955.2041.100.50
CRC31689,855,78850,133,33255.8048.400.53
LM873,033,86644,328,41660.7061.600.33
LM8798,621,90644,354,59245.0039.700.50
LM20874,482,75418,899,94025.4050.500.39
LM24190,013,16851,489,69157.2047.600.48
LM26978,414,51541,592,06953.0054.300.36
LM27089,824,23538,806,87743.2045.300.46
LM27571,135,24441,994,30059.0054.200.36
LM31162,045,34531,262,90550.4056.000.31
LM31469,843,99738,398,80355.0047.600.34
LM31633,679,59620,021,53155.7559.400.52
Average69,917,246.136,804,443.953.1849.350.424
Table 3. Summary of RNA-Seq alignment results for each sample.
Sample IDTotal Number of Sequenced ReadsTotal Number of Uniquely Mapped Reads (GRCh37)Uniquely Mapped Reads (%)Percentage of Reads Aligned to rRNA Regions (%)
CRC823,384,04619,026,42281.360.0003
CRC8724,339,81622,145,94090.990.0003
CRC20811,577,3347,738,15266.830.0002
CRC24128,268,75023,299,70082.420.0002
CRC26921,423,02018,013,12984.080.0002
CRC27019,305,81614,088,26472.980.0002
CRC27527,242,45823,347,21685.700.0002
CRC31114,002,0787,888,49756.340.0001
CRC31420,987,19218,011,05285.820.0004
CRC31620,464,57016,317,11579.730.0005
LM831,508,19026,257,88283.340.0001
LM8720,470,18214,708,25871.850.0003
LM20818,987,03215,298,38880.570.0002
LM24123,978,74820,965,13087.430.0003
LM26920,095,08414,373,69571.530.0004
LM27020,743,99418,185,86187.670.0002
LM27519,603,22816,678,52785.080.0005
LM31127,400,08022,939,46583.720.0002
LM31421,182,55417,709,59283.600.0002
LM31622,810,83019,212,32184.220.0003
Average21,888,750.117,810,230.380.260.0005
Disclaimer/Publisher’s Note: The statements, opinions and data contained in all publications are solely those of the individual author(s) and contributor(s) and not of MDPI and/or the editor(s). MDPI and/or the editor(s) disclaim responsibility for any injury to people or property resulting from any ideas, methods, instructions or products referred to in the content.

