
Dataset of the Optimization of a Low Power Chemoresistive Gas Sensor: Predictive Thermal Modelling and Mechanical Failure Analysis

 , , , and
Abstract
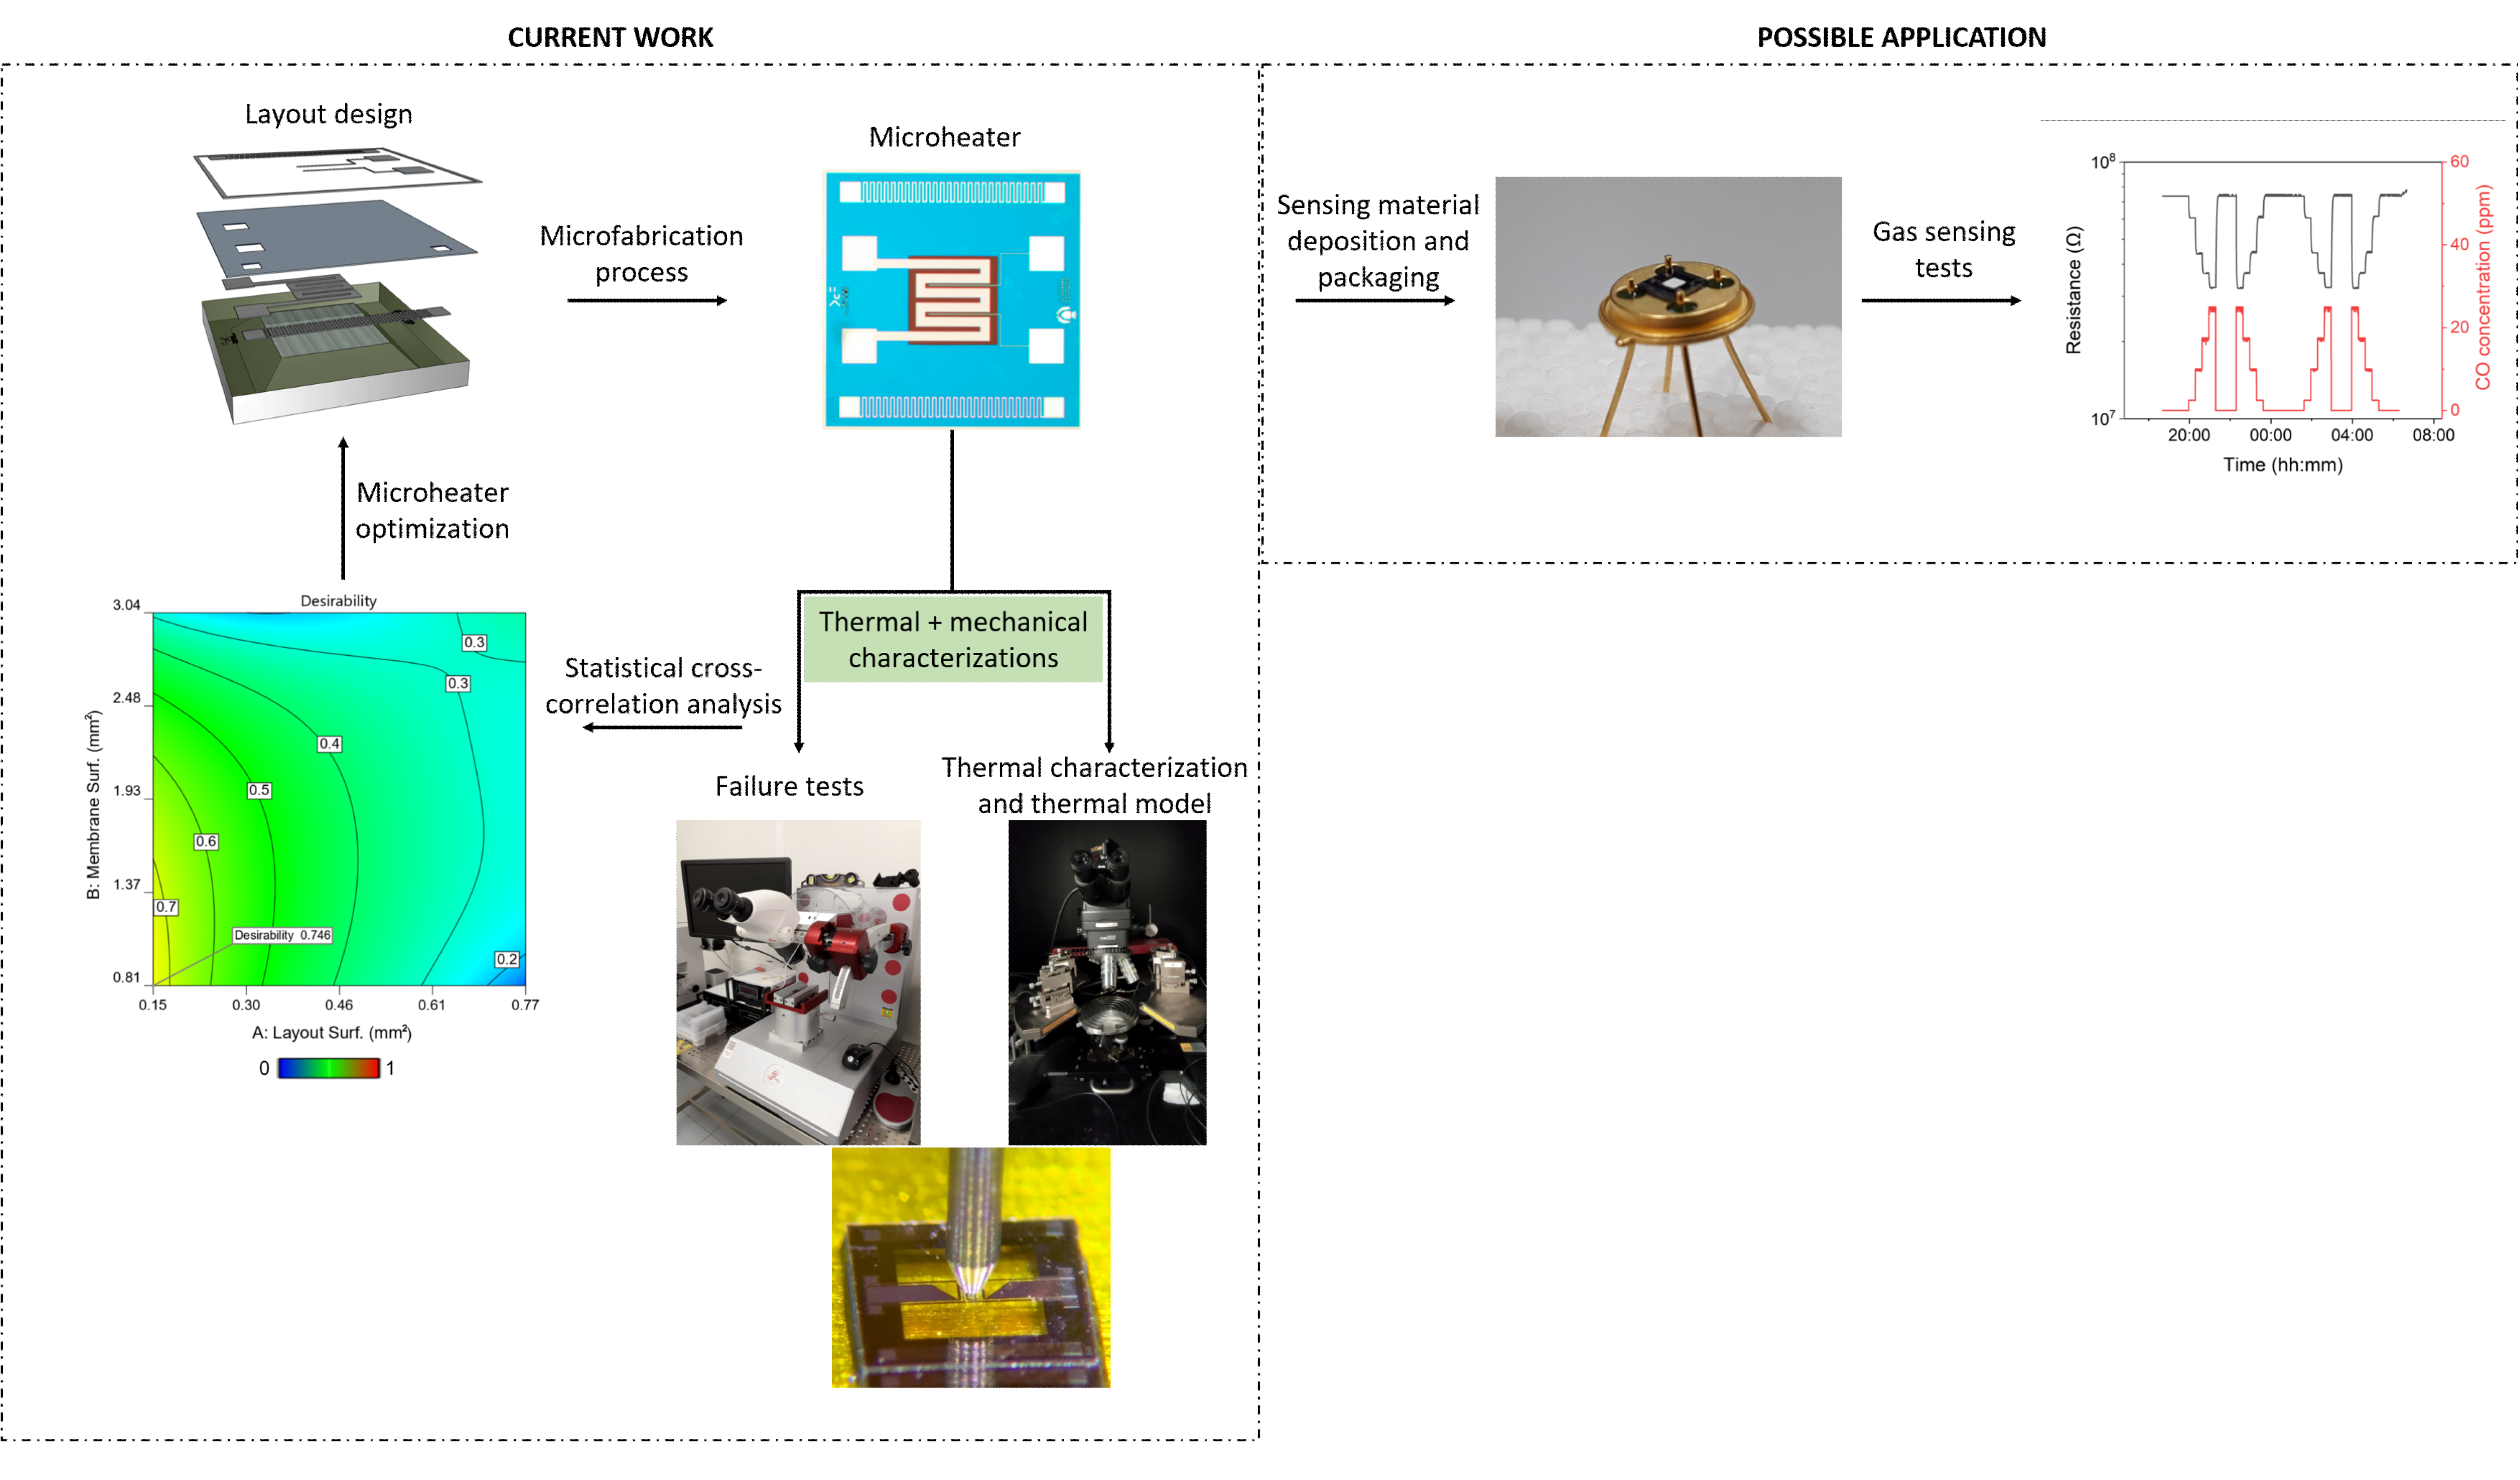
:1. Summary
2. Data Description
3. Methods
3.1. Device Fabrication
3.2. Thermal Analysis
3.3. Mechanical Analysis
3.4. Statistical Methods
4. Data Analysis
4.1. Preliminary Analysis
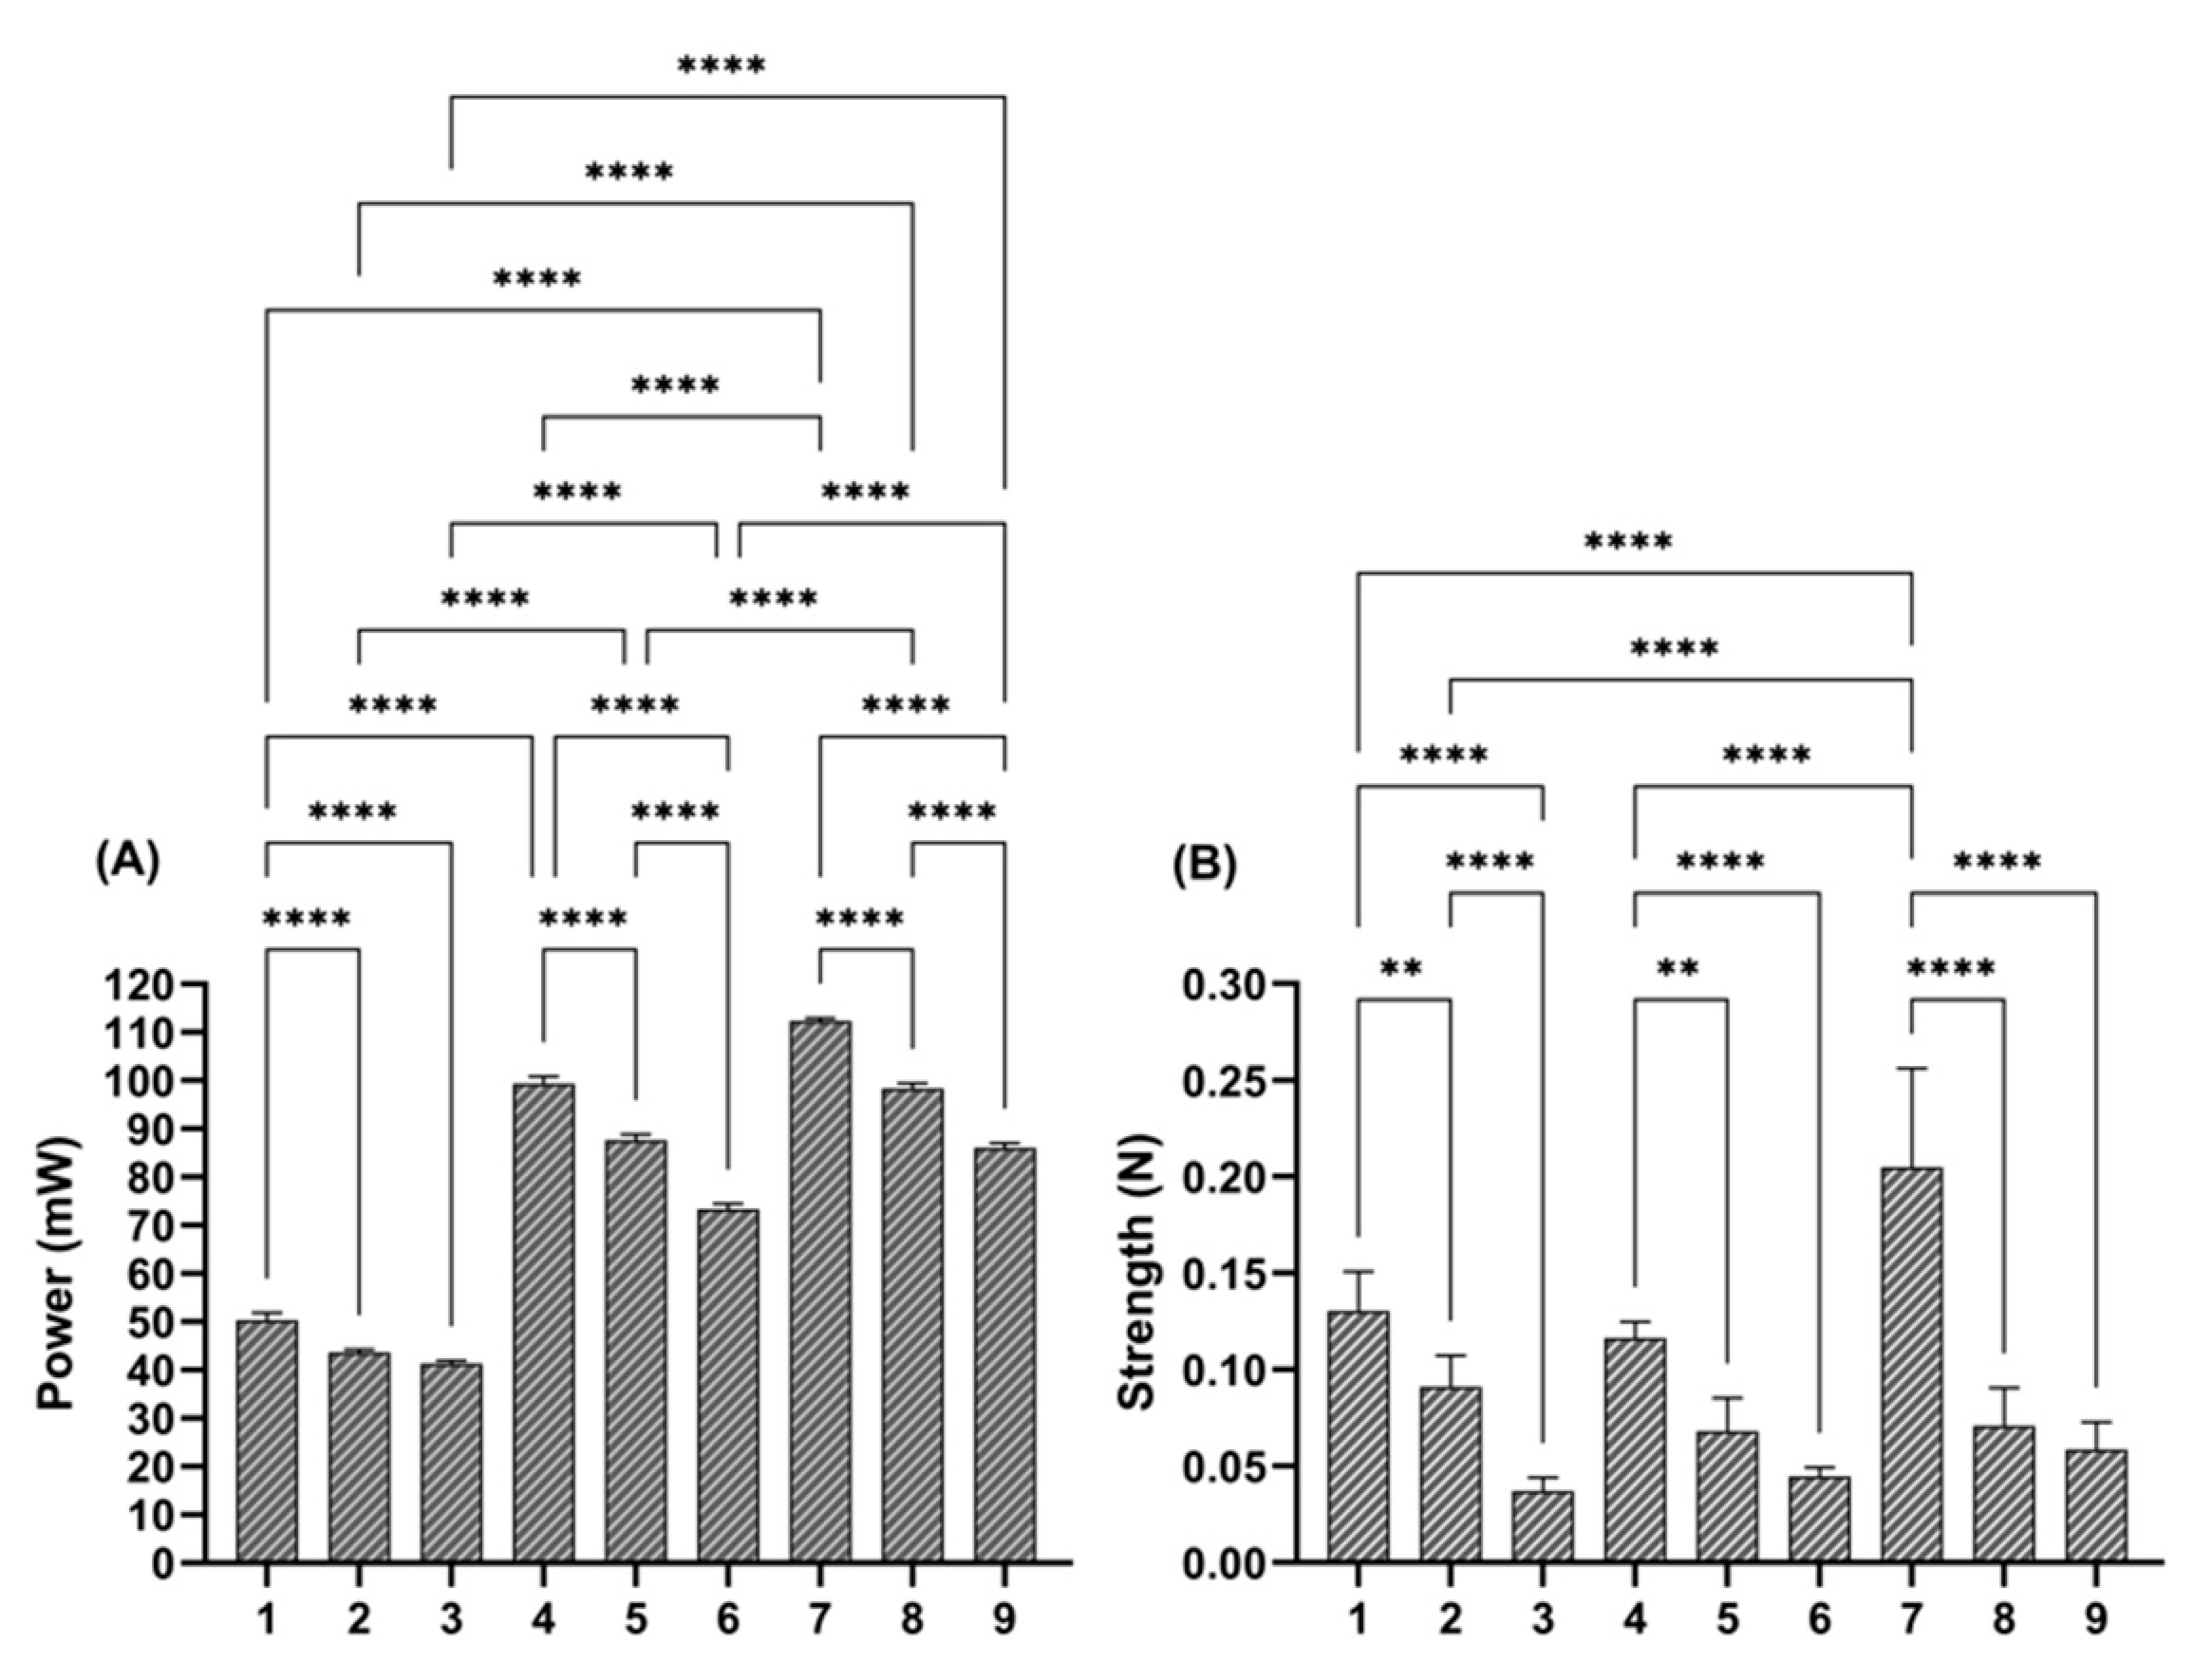
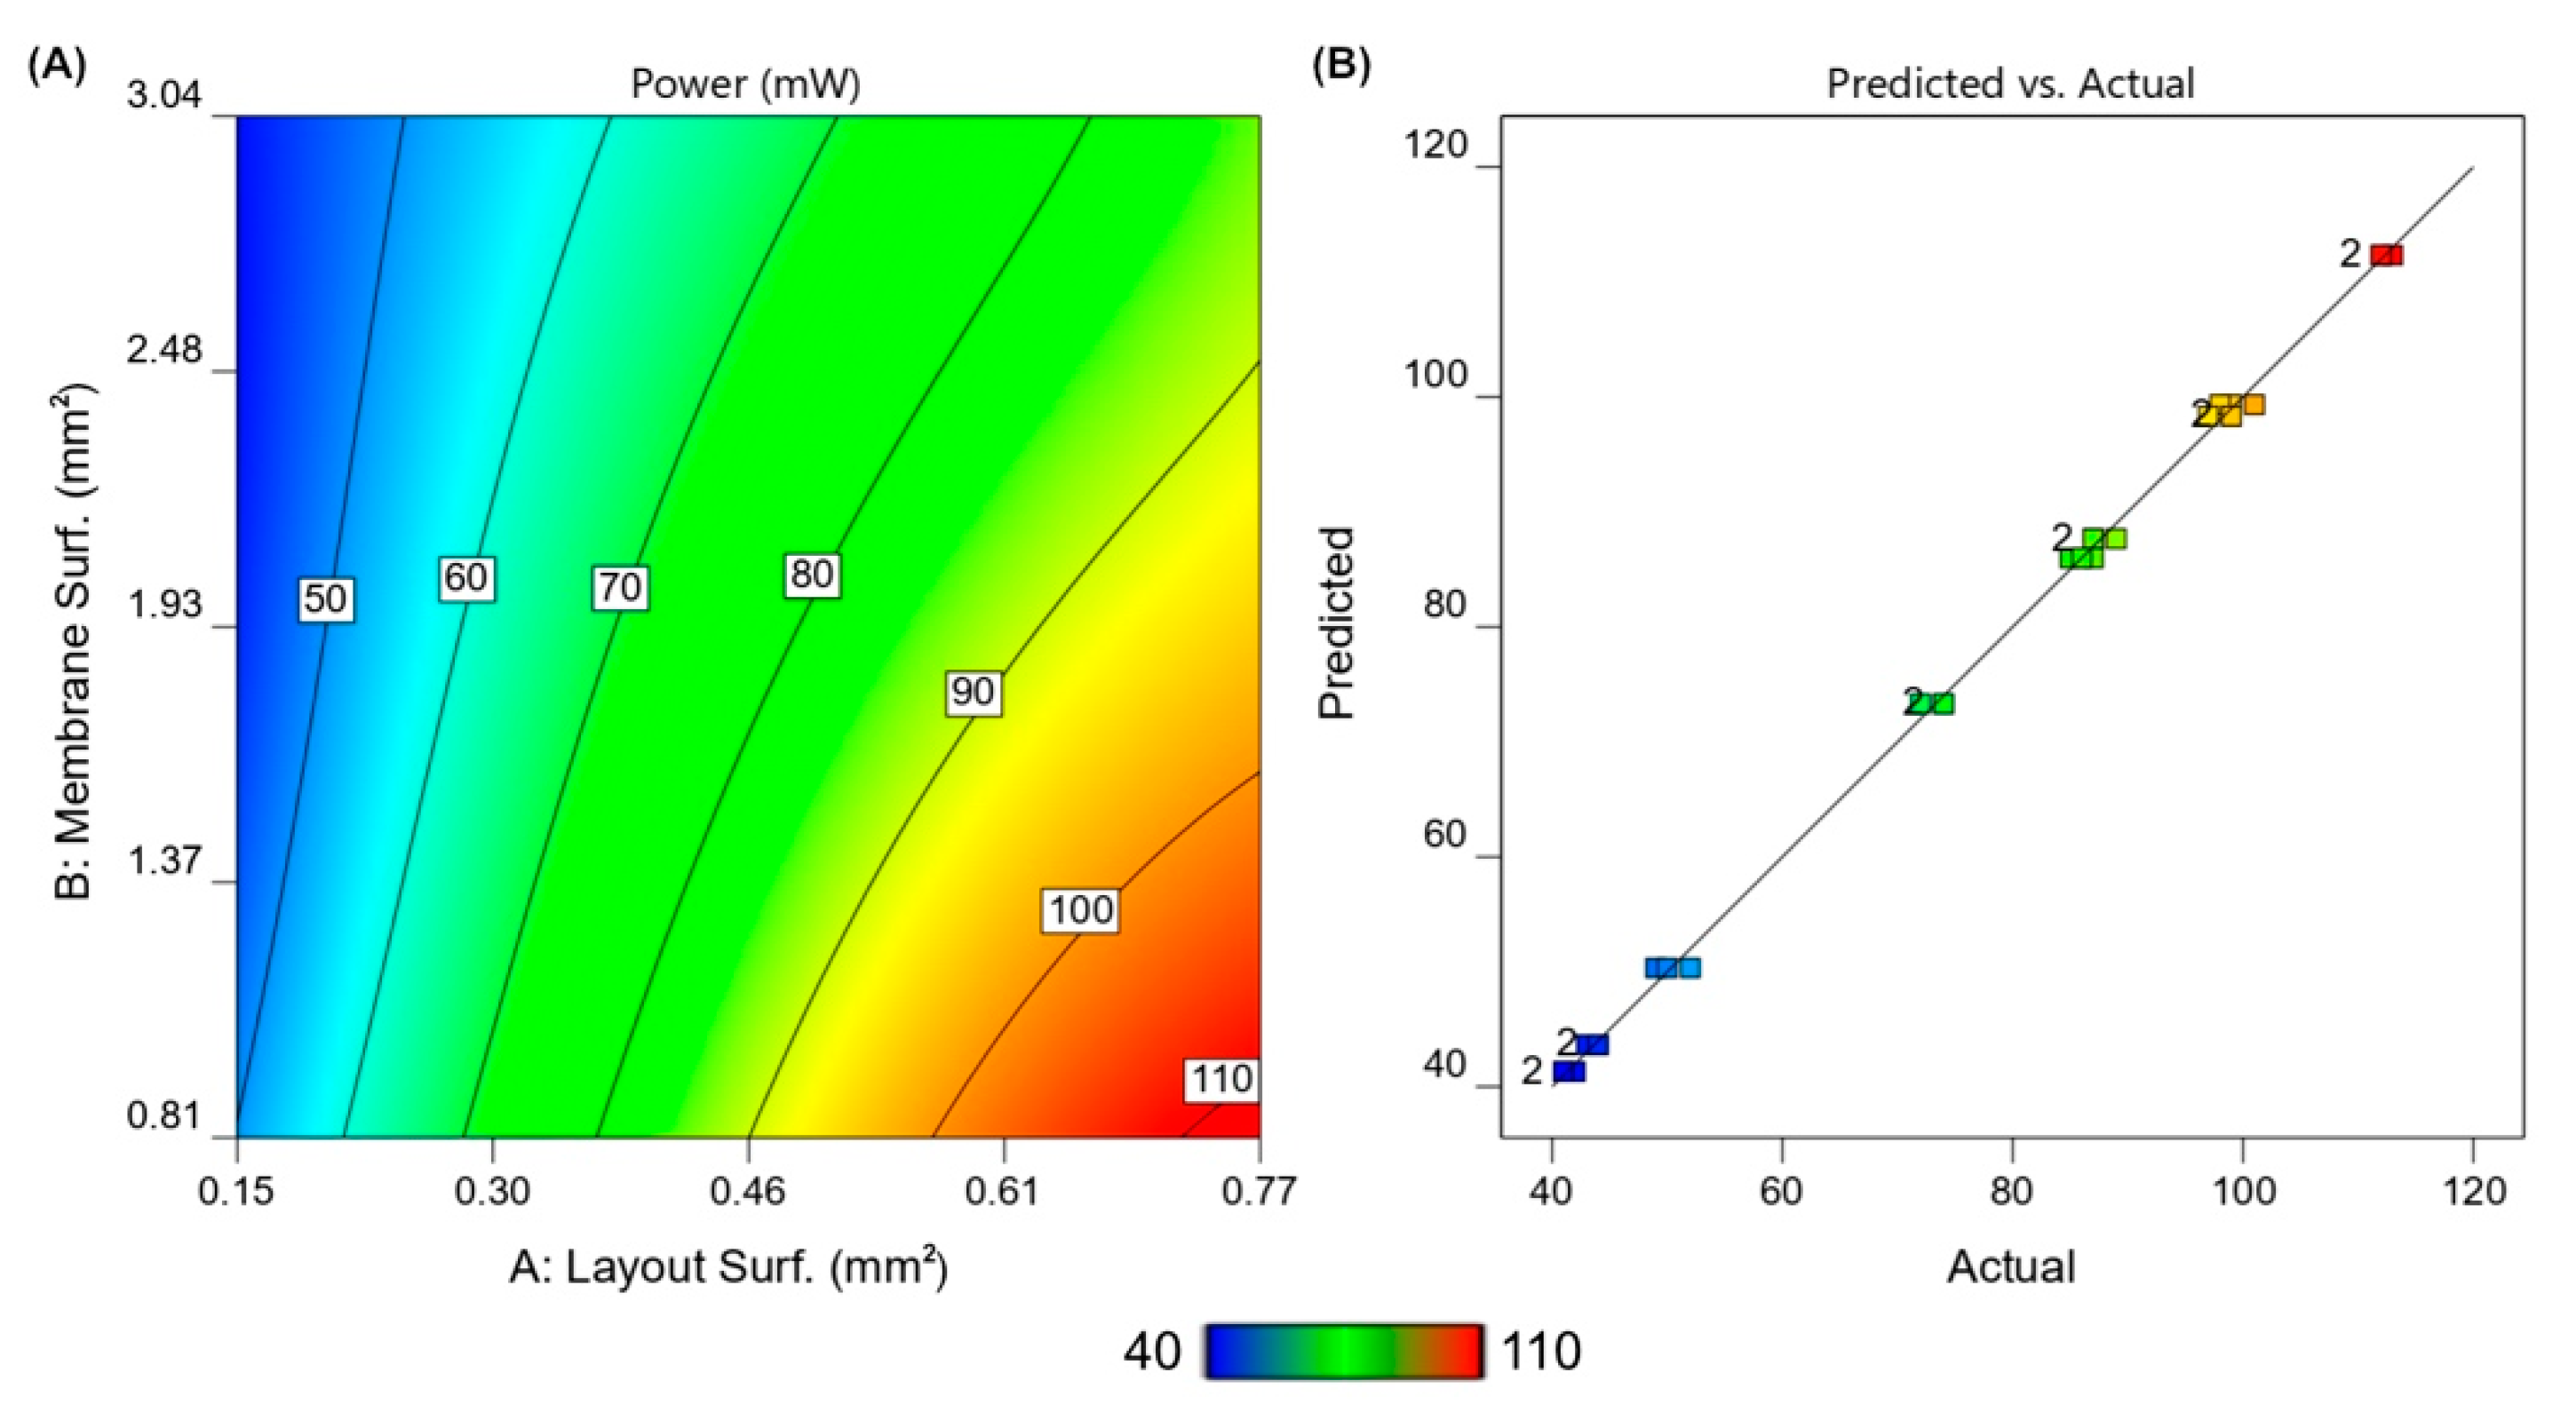
4.2. Thermal Data Analysis
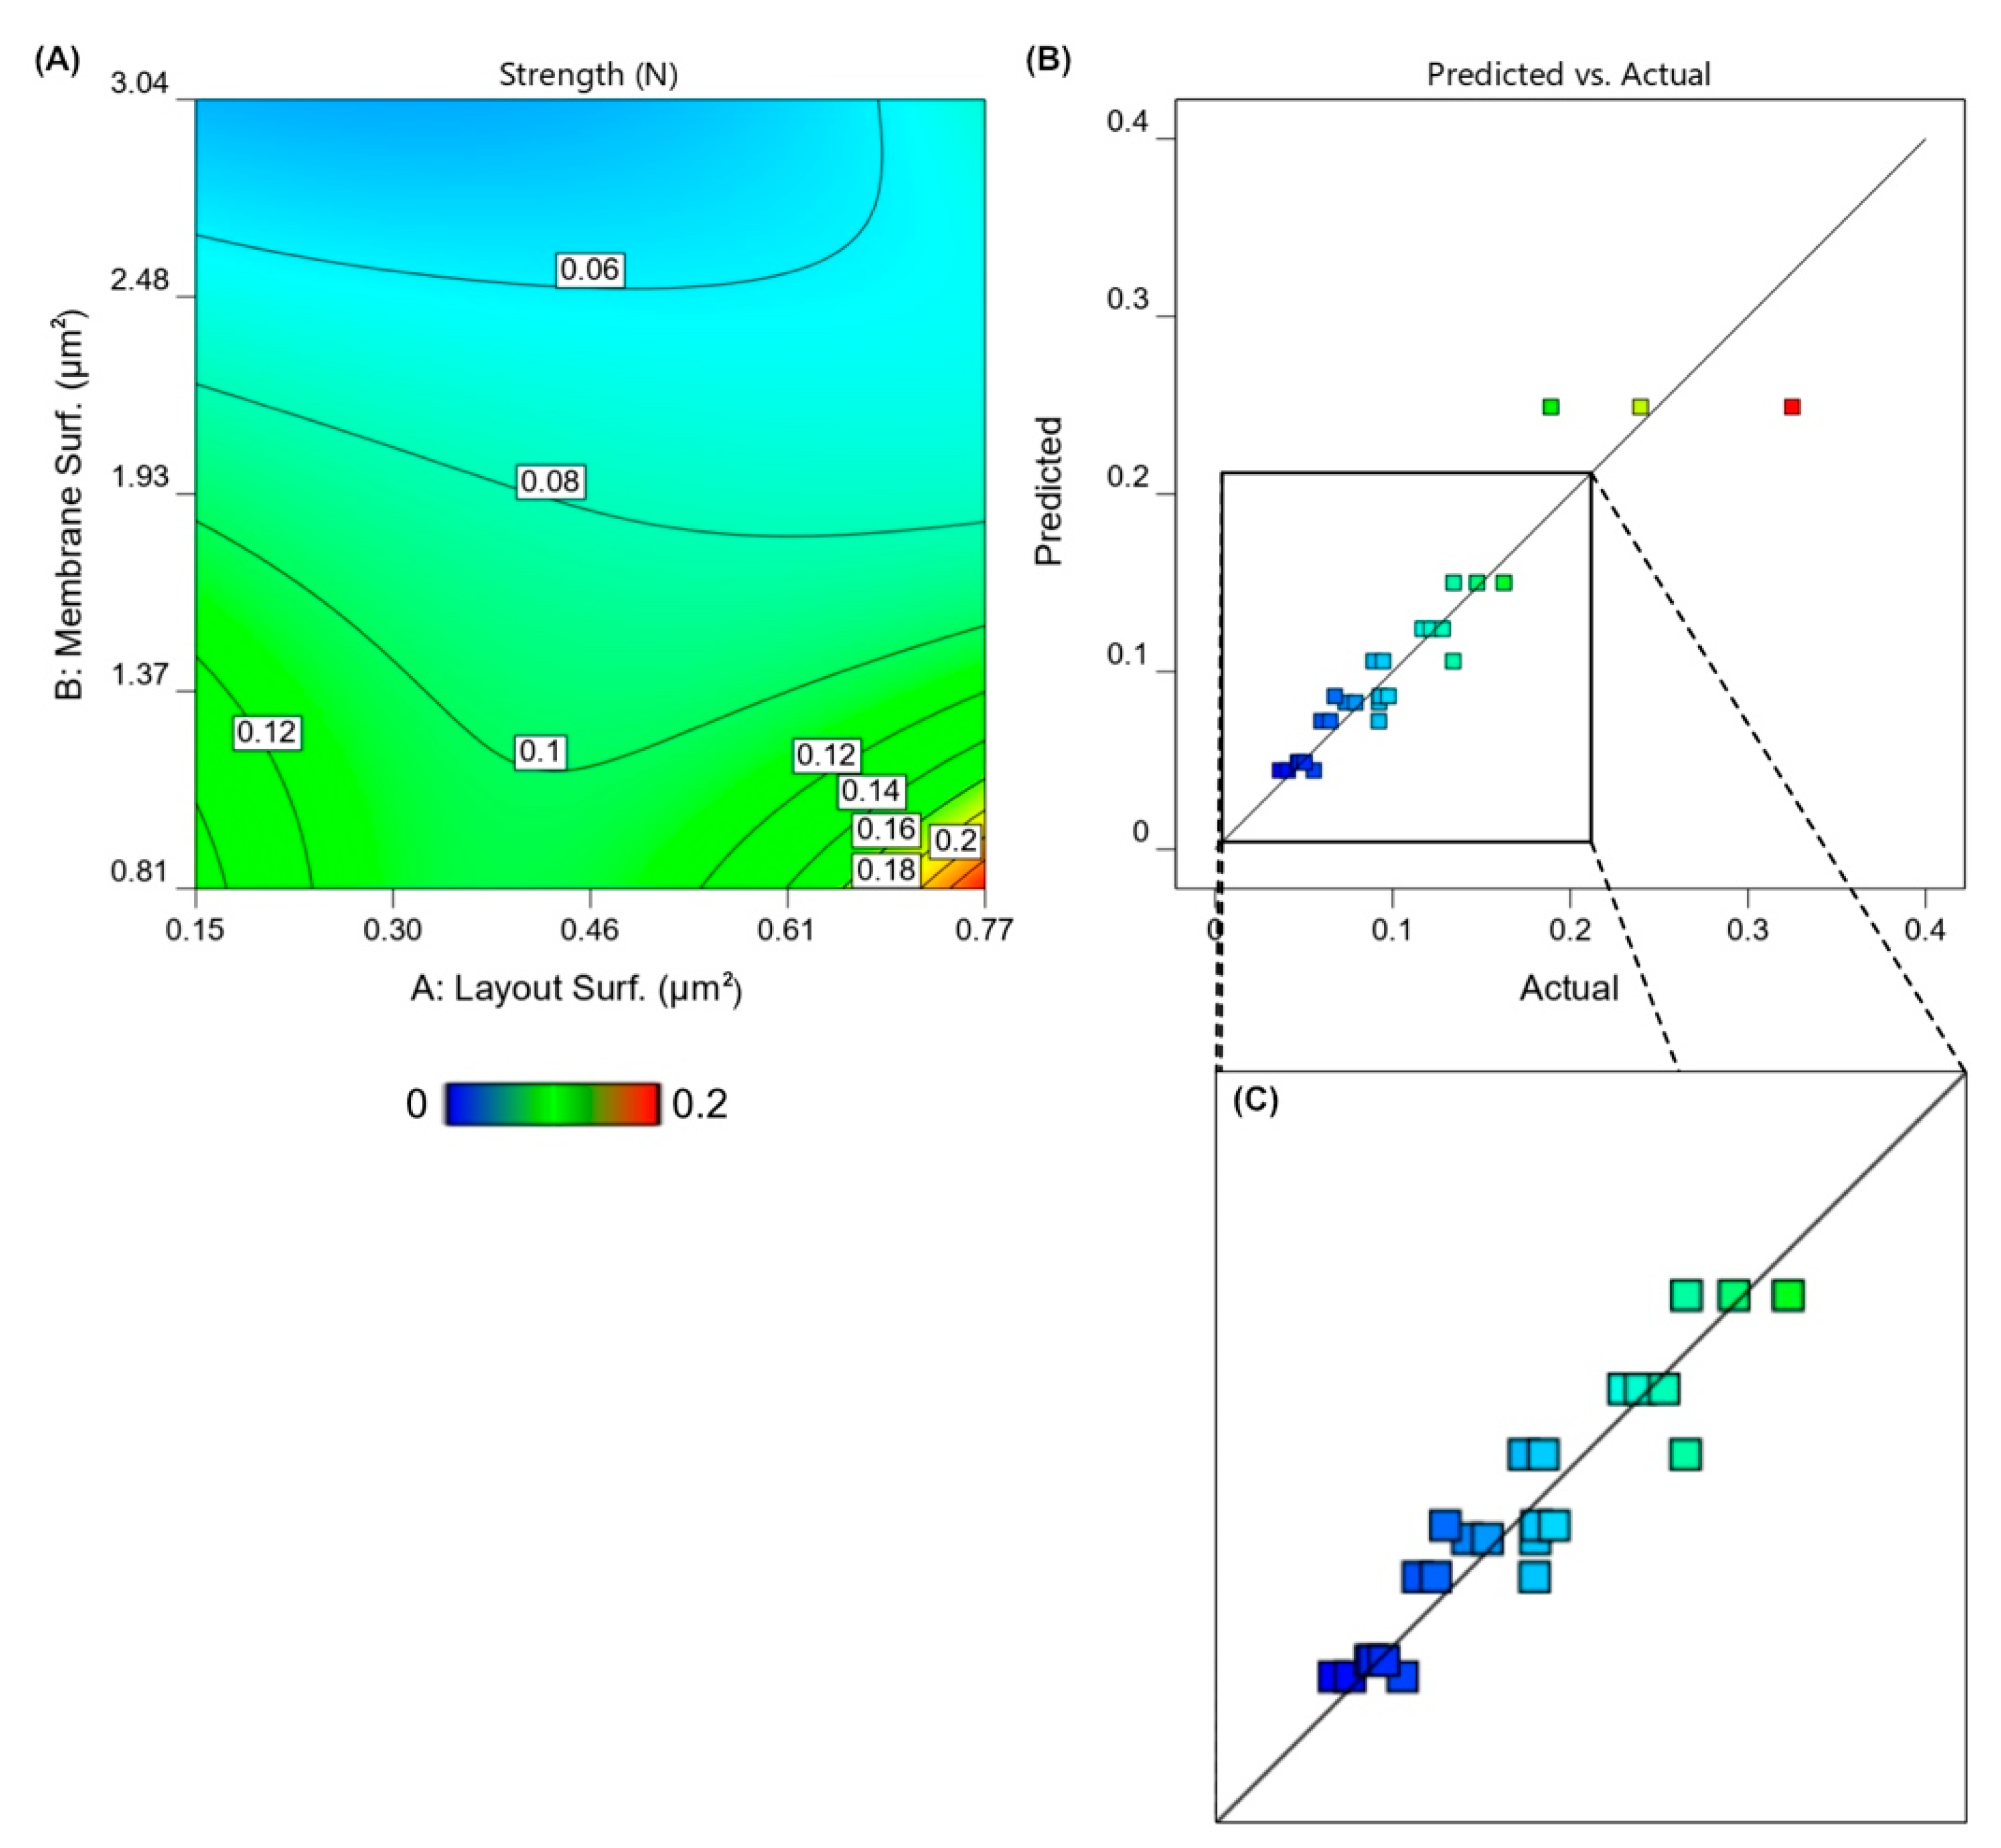
4.3. Mechanical Data Analysis
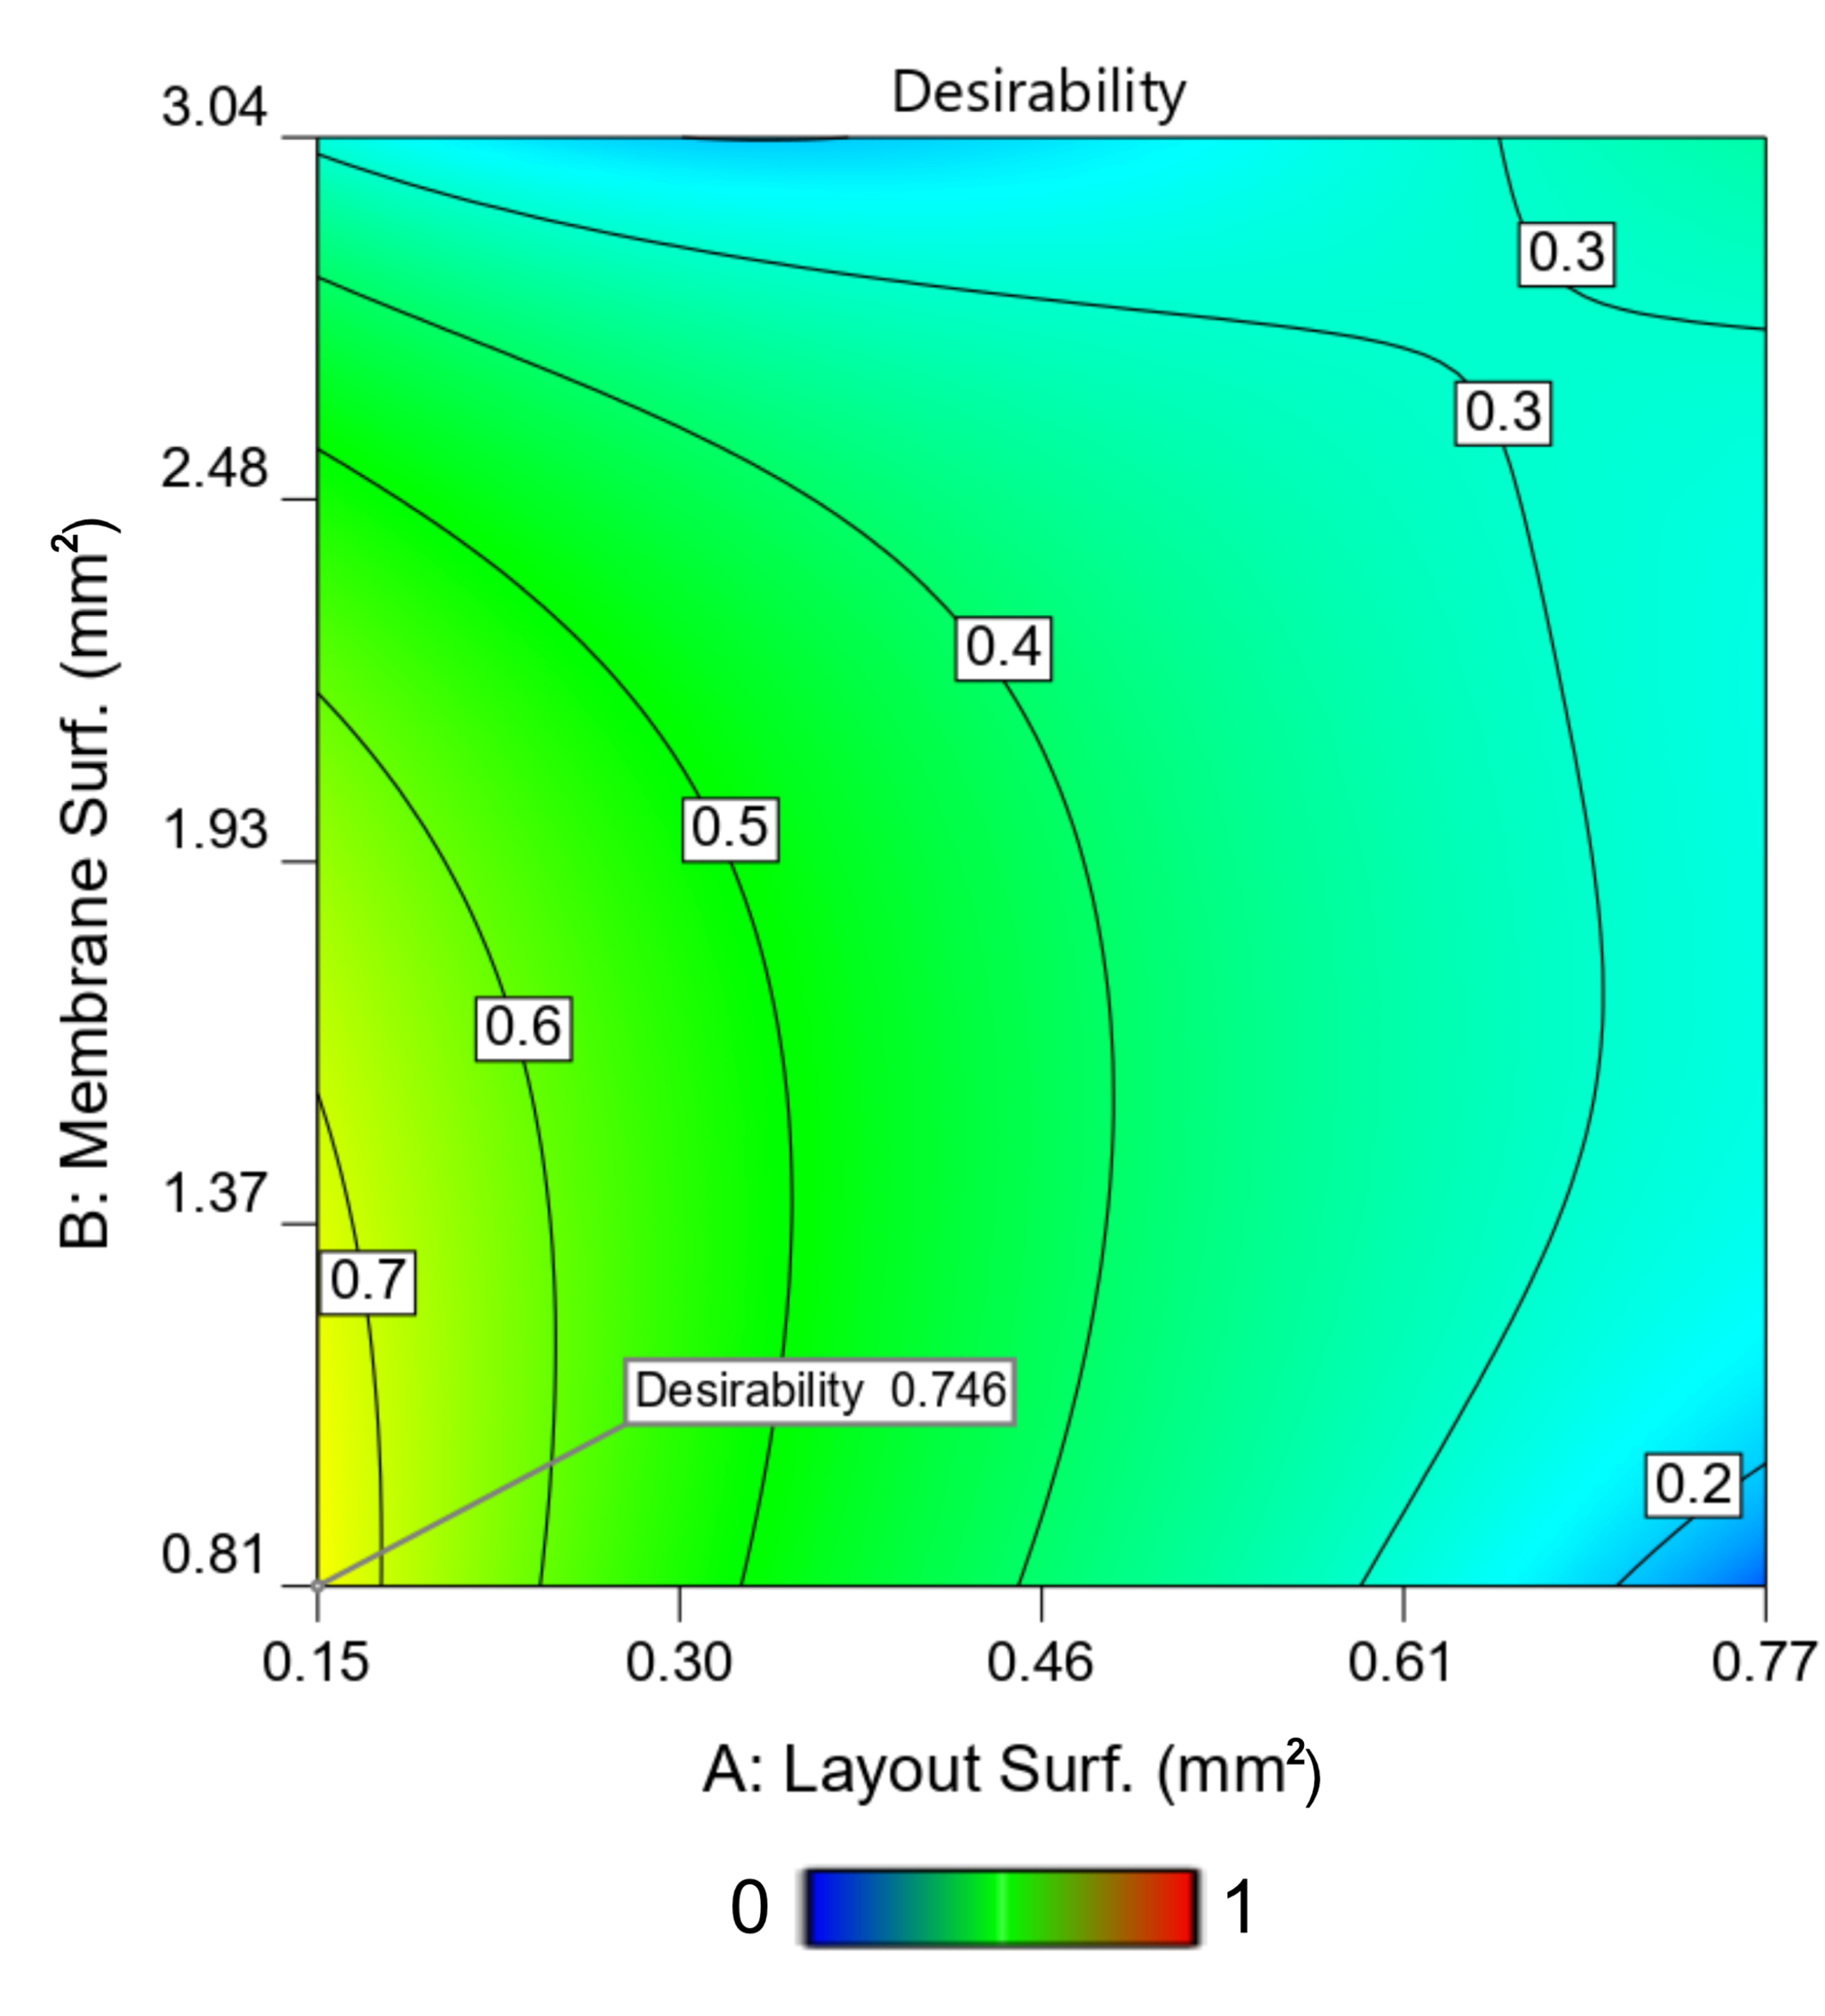
4.4. Optimization—Minimization P, Maximization s
5. User Note
Supplementary Materials
Author Contributions
Funding
Data Availability Statement
Conflicts of Interest
References
- Fabbri, B.; Valt, M.; Parretta, C.; Gherardi, S.; Gaiardo, A.; Malagù, C.; Mantovani, F.; Strati, V.; Guidi, V. Correlation of gaseous emissions to water stress in tomato and maize crops: From field to laboratory and back. Sens. Actuators B Chem. 2020, 303, 127227. [Google Scholar] [CrossRef]
- Gaiardo, A.; Demenev, E.; Bellutti, P.; Dolci, C.; Maestrini, A.; Antonelli, F.; Miotto, V. New Chemoresistive Gas Sensor Arrays for Outdoor Air Quality Monitoring: A Combined R&D and Outreach Activities. In ECS Meeting Abstracts; IOP Publishing: Bristol, UK, 2020; p. 2203. [Google Scholar]
- Valt, M.; Fabbri, B.; Gaiardo, A.; Gherardi, S.; Casotti, D.; Cruciani, G.; Pepponi, G.; Vanzetti, L.; Iacob, E.; Malagu, C. Aza-crown-ether functionalized graphene oxide for gas sensing and cation trapping applications. Mater. Res. Express 2019, 6, 075603. [Google Scholar] [CrossRef]
- Zonta, G.; Anania, G.; Astolfi, M.; Feo, C.; Gaiardo, A.; Gherardi, S.; Giberti, A.; Guidi, V.; Landini, N.; Palmonari, C. Chemoresistive sensors for colorectal cancer preventive screening through fecal odor: Double-blind approach. Sens. Actuators B Chem. 2019, 301, 127062. [Google Scholar] [CrossRef]
- Hunter, G.W.; Akbar, S.; Bhansali, S.; Daniele, M.; Erb, P.D.; Johnson, K.; Liu, C.-C.; Miller, D.; Oralkan, O.; Hesketh, P.J. Editors’ choice—Critical review—A critical review of solid state gas sensors. J. Electrochem. Soc. 2020, 167, 037570. [Google Scholar] [CrossRef]
- Neri, G. First fifty years of chemoresistive gas sensors. Chemosensors 2015, 3, 1–20. [Google Scholar] [CrossRef]
- Gaiardo, A.; Fabbri, B.; Giberti, A.; Valt, M.; Gherardi, S.; Guidi, V.; Malagù, C.; Bellutti, P.; Pepponi, G.; Casotti, D. Tunable formation of nanostructured SiC/SiOC core-shell for selective detection of SO2. Sens. Actuators B Chem. 2020, 305, 127485. [Google Scholar] [CrossRef]
- Gaiardo, A.; Bellutti, P.; Fabbri, B.; Gherardi, S.; Giberti, A.; Guidi, V.; Landini, N.; Malagù, C.; Pepponi, G.; Valt, M. Chemoresistive gas sensor based on SiC thick film: Possible distinctive sensing properties between H2S and SO2. Procedia Eng. 2016, 168, 276–279. [Google Scholar] [CrossRef]
- Guidi, V.; Fabbri, B.; Gaiardo, A.; Gherardi, S.; Giberti, A.; Malagù, C.; Zonta, G.; Bellutti, P. Metal sulfides as a new class of sensing materials. Procedia Eng. 2015, 120, 138–141. [Google Scholar] [CrossRef] [Green Version]
- Zonta, G.; Astolfi, M.; Casotti, D.; Cruciani, G.; Fabbri, B.; Gaiardo, A.; Gherardi, S.; Guidi, V.; Landini, N.; Valt, M. Reproducibility tests with zinc oxide thick-film sensors. Ceram. Int. 2020, 46, 6847–6855. [Google Scholar] [CrossRef]
- Gaiardo, A.; Zonta, G.; Gherardi, S.; Malagù, C.; Fabbri, B.; Valt, M.; Vanzetti, L.; Landini, N.; Casotti, D.; Cruciani, G. Nanostructured SmFeO3 Gas Sensors: Investigation of the Gas Sensing Performance Reproducibility for Colorectal Cancer Screening. Sensors 2020, 20, 5910. [Google Scholar] [CrossRef]
- Dey, A. Semiconductor metal oxide gas sensors: A review. Mater. Sci. Eng. B 2018, 229, 206–217. [Google Scholar] [CrossRef]
- Bagolini, A.; Gaiardo, A.; Crivellari, M.; Demenev, E.; Bartali, R.; Picciotto, A.; Valt, M.; Ficorella, F.; Guidi, V.; Bellutti, P. Development of MEMS MOS gas sensors with CMOS compatible PECVD inter-metal passivation. Sens. Actuators B Chem. 2019, 292, 225–232. [Google Scholar] [CrossRef]
- Ma, H.; Du, Y.; Wei, M.; Ding, E.; Lin, L. Silicon microheater based low-power full-range methane sensing device. Sens. Actuators A Phys. 2019, 295, 70–74. [Google Scholar] [CrossRef]
- Belmonte, J.C.; Puigcorbe, J.; Arbiol, J.; Vila, A.; Morante, J.; Sabate, N.; Gracia, I.; Cane, C. High-temperature low-power performing micromachined suspended micro-hotplate for gas sensing applications. Sens. Actuators B Chem. 2006, 114, 826–835. [Google Scholar] [CrossRef]
- Simon, I.; Bârsan, N.; Bauer, M.; Weimar, U. Micromachined metal oxide gas sensors: Opportunities to improve sensor performance. Sens. Actuators B Chem. 2001, 73, 1–26. [Google Scholar] [CrossRef]
- Gaiardo, A.; Novel, D.; Scattolo, E.; Crivellari, M.; Picciotto, A.; Ficorella, F.; Iacob, E.; Bucciarelli, A.; Petti, L.; Lugli, P. Optimization of a Low-Power Chemoresistive Gas Sensor: Predictive Thermal Modelling and Mechanical Failure Analysis. Sensors 2021, 21, 783. [Google Scholar] [CrossRef] [PubMed]
- Lahlalia, A.; Filipovic, L.; Selberherr, S. Modeling and simulation of novel semiconducting metal oxide gas sensors for wearable devices. IEEE Sens. J. 2018, 18, 1960–1970. [Google Scholar] [CrossRef]
- Micro-Nano Characterization and Fabrication Facility. Available online: https://cmm.fbk.eu/en/research/mnf-micro-nano-facility/ (accessed on 15 February 2021).
- Kang, J.-g.; Park, J.-S.; Park, K.-B.; Shin, J.; Lee, E.-A.; Noh, S.; Lee, H.-J. Temperature control of micro heater using Pt thin film temperature sensor embedded in micro gas sensor. Micro Nano Syst. Lett. 2017, 5, 1–5. [Google Scholar] [CrossRef] [Green Version]
- Hwang, W.-J.; Shin, K.-S.; Roh, J.-H.; Lee, D.-S.; Choa, S.-H. Development of micro-heaters with optimized temperature compensation design for gas sensors. Sensors 2011, 11, 2580–2591. [Google Scholar] [CrossRef] [Green Version]
- Glowacz, A. Fault diagnosis of electric impact drills using thermal imaging. Measurement 2021, 171, 108815. [Google Scholar] [CrossRef]
- Bhattacharyya, P. Technological journey towards reliable microheater development for MEMS gas sensors: A review. IEEE Trans. Device Mater. Reliab. 2014, 14, 589–599. [Google Scholar] [CrossRef]
- Spruit, R.G.; Van Omme, J.T.; Ghatkesar, M.K.; Garza, H.H.P. A review on development and optimization of microheaters for high-temperature in situ studies. J. Microelectromech. Syst. 2017, 26, 1165–1182. [Google Scholar] [CrossRef]
- Bucciarelli, A.; Adami, A.; Chandaiahgari, C.R.; Lorenzelli, L. Multivariable optimization of inkjet printing process of Ag nanoparticle ink on Kapton. In Proceedings of the 2020 IEEE International Conference on Flexible and Printable Sensors and Systems (FLEPS), Manchester, UK, 16–19 August 2020. [Google Scholar]
- Bucciarelli, A.; Olivetti, E.; Adami, A.; Lorenzelli, L. Design of experiment rational optimization of an inkjet deposition of silver on Kapton. IEEE Sens. J. 2021. [Google Scholar] [CrossRef]
- Bucciarelli, A.; Reddy Chandraiahgari, C.; Adami, A.; Mulloni, V.; Lorenzelli, L. Precise dot inkjet printing thought multifactorial statistical optimization of the piezoelectric actuator waveform. Flex. Print. Electron. 2020, 5, 045002. [Google Scholar] [CrossRef]
- Bucciarelli, A.; Chiera, S.; Quaranta, A.; Yadavalli, V.K.; Motta, A.; Maniglio, D. A Thermal—Reflow—Based Low—Temperature, High—Pressure Sintering of Lyophilized Silk Fibroin for the Fast Fabrication of Biosubstrates. Adv. Funct. Mater. 2019, 1901134, 1901134. [Google Scholar] [CrossRef]
- Bucciarelli, A.; Greco, G.; Corridori, I.; Pugno, N.M.; Motta, A. A Design of Experiment Rational Optimization of the Degumming Process and Its Impact on the Silk Fibroin Properties. ACS Biomater. Sci. Eng. 2021. [Google Scholar] [CrossRef] [PubMed]
- Bucciarelli, A.; Muthukumar, T.; Kim, J.S.; Kim, W.K.; Quaranta, A.; Maniglio, D.; Khang, G.; Motta, A. Preparation and Statistical Characterization of Tunable Porous Sponge Scaffolds using UV Cross-linking of Methacrylate-Modified Silk Fibroin. ACS Biomater. Sci. Eng. 2019. [Google Scholar] [CrossRef] [PubMed]


| Group | Factor A-Area Layout (mm2) | Factor B-Area Membrane (mm2) |
|---|---|---|
| 1 | 0.15 | 0.81 |
| 2 | 0.15 | 1.74 |
| 3 | 0.15 | 3.04 |
| 4 | 0.56 | 0.81 |
| 5 | 0.56 | 1.74 |
| 6 | 0.56 | 3.04 |
| 7 | 0.77 | 0.81 |
| 8 | 0.77 | 1.74 |
| 9 | 0.77 | 3.04 |
| Reported Measurement | Derivate From |
|---|---|
| Temperature | Resistance measurement |
| Power consumption | Current-voltage measurement |
| Failure force | Peak of force-deflection curve |
| Work of fracture | Integral of force-deflection curve |
| Measurement Sensitivity | |
|---|---|
| Manual IV probe | Current: 1 fA Voltage: 2 uV |
| Indentation test | Deflection: 30 nm Force: 0.1 mN |
| Source | Sum of Squares | df | Mean Square | F-Value | p-Value | Significance |
|---|---|---|---|---|---|---|
| Model | 16,514.52 | 8 | 2064.31 | 1741.77 | <0.0001 | *** |
| A-Layout Surf. | 3947.71 | 1 | 3947.71 | 3330.88 | <0.0001 | *** |
| B-Membrane Surf. | 633.00 | 1 | 633.00 | 534.09 | <0.0001 | *** |
| AB | 225.33 | 1 | 225.33 | 190.12 | <0.0001 | *** |
| A2 | 92.46 | 1 | 92.46 | 78.01 | <0.0001 | *** |
| B2 | 0.4885 | 1 | 0.4885 | 0.4122 | 0.5290 | |
| A2B | 28.66 | 1 | 28.66 | 24.18 | 0.0001 | *** |
| AB2 | 0.0172 | 1 | 0.0172 | 0.0146 | 0.9053 | |
| A2B2 | 5.89 | 1 | 5.89 | 4.97 | 0.0387 | * |
| Pure Error | 21.33 | 18 | 1.19 | |||
| Cor Total | 16,535.85 | 26 |
| Factor | Coefficient Estimate | 95% CI Low | 95% CI High |
|---|---|---|---|
| Intercept | 77.49 | 75.9 | 79.08 |
| A-Layout Surf. | 26.6 | 25.63 | 27.57 |
| B-Membrane Surf. | −11.90 | −12.98 | −10.82 |
| AB | −4.33 | −4.99 | −3.67 |
| A2 | −8.07 | −9.99 | −6.15 |
| B2 | 0.5921 | −1.35 | 2.53 |
| A2B | 3.06 | 1.76 | 4.37 |
| AB2 | 0.0679 | −1.11 | 1.25 |
| A2B2 | 2.49 | 0.1438 | 4.83 |
| Source | Sum of Squares | df | Mean Square | F-Value | p-Value | Significance |
|---|---|---|---|---|---|---|
| Model | 7.03 | 8 | 0.8785 | 83.09 | <0.0001 | *** |
| A-Layout Surf. | 0.1156 | 1 | 0.1156 | 10.94 | 0.0039 | ** |
| B-Membrane Surf. | 3.07 | 1 | 3.07 | 290.17 | <0.0001 | *** |
| AB | 0.0874 | 1 | 0.0874 | 8.27 | 0.0101 | * |
| A2 | 0.0992 | 1 | 0.0992 | 9.38 | 0.0067 | ** |
| B2 | 0.3511 | 1 | 0.3511 | 33.21 | <0.0001 | *** |
| A2B | 0.3574 | 1 | 0.3574 | 33.80 | <0.0001 | *** |
| AB2 | 6.436 × 10⁻⁶ | 1 | 6.436 × 10⁻⁶ | 0.0006 | 0.9806 | |
| A2B2 | 0.2120 | 1 | 0.2120 | 20.05 | 0.0003 | *** |
| Pure Error | 0.1903 | 18 | 0.0106 | |||
| Cor Total | 7.22 | 26 |
| Factor | Coefficient Estimate | 95% CI Low | 95% CI High |
|---|---|---|---|
| Intercept | −2.88 | −3.03 | −2.73 |
| A-Layout Surf. | 0.144 | 0.0525 | 0.2354 |
| B-Membrane Surf. | −0.8283 | −0.9305 | −0.7261 |
| AB | 0.0854 | 0.023 | 0.1477 |
| A2 | 0.2644 | 0.0831 | 0.4458 |
| B2 | 0.502 | 0.319 | 0.685 |
| A2B | 0.3422 | 0.2185 | 0.4659 |
| AB2 | −0.0013 | −0.113 | 0.1104 |
| A2B2 | −0.4722 | −0.6938 | −0.2507 |
| Number | Layout Surf. | Membrane Surf. | Power | Strength | Desirability |
|---|---|---|---|---|---|
| 1 | 0.148 | 0.810 | 50.333 | 0.148 | 0.746 |
| 2 | 0.148 | 0.857 | 49.892 | 0.146 | 0.745 |
| 3 | 0.148 | 1.000 | 48.630 | 0.140 | 0.741 |
| 4 | 0.148 | 1.077 | 47.985 | 0.137 | 0.738 |
Publisher’s Note: MDPI stays neutral with regard to jurisdictional claims in published maps and institutional affiliations. |
© 2021 by the authors. Licensee MDPI, Basel, Switzerland. This article is an open access article distributed under the terms and conditions of the Creative Commons Attribution (CC BY) license (http://creativecommons.org/licenses/by/4.0/).
Share and Cite
Gaiardo, A.; Novel, D.; Scattolo, E.; Bucciarelli, A.; Bellutti, P.; Pepponi, G. Dataset of the Optimization of a Low Power Chemoresistive Gas Sensor: Predictive Thermal Modelling and Mechanical Failure Analysis. Data 2021, 6, 30. https://doi.org/10.3390/data6030030
Gaiardo A, Novel D, Scattolo E, Bucciarelli A, Bellutti P, Pepponi G. Dataset of the Optimization of a Low Power Chemoresistive Gas Sensor: Predictive Thermal Modelling and Mechanical Failure Analysis. Data. 2021; 6(3):30. https://doi.org/10.3390/data6030030
Chicago/Turabian StyleGaiardo, Andrea, David Novel, Elia Scattolo, Alessio Bucciarelli, Pierluigi Bellutti, and Giancarlo Pepponi. 2021. "Dataset of the Optimization of a Low Power Chemoresistive Gas Sensor: Predictive Thermal Modelling and Mechanical Failure Analysis" Data 6, no. 3: 30. https://doi.org/10.3390/data6030030