Data Descriptor

A Public Dataset of 24-h Multi-Levels Psycho-Physiological Responses in Young Healthy Adults

1
Department of Computer Science, University of Pisa, 56127 Pisa, Italy
2
Department of Pharmacy, University of Pisa, 56126 Pisa, Italy
3
MOMILab, IMT School for Advanced Studies Lucca, 55100 Lucca, Italy
4
COSBI, 38068 Rovereto, Italy
5
Department of Engineering Science, University of Oxford, Oxford OX1 3PJ, UK
6
Huma Therapeutics Limited, London SW1P 4QP, UK
*
Author to whom correspondence should be addressed.
Submission received: 21 August 2020 / Revised: 11 September 2020 / Accepted: 12 September 2020 / Published: 25 September 2020
(This article belongs to the Special Issue Data from Smartphones and Wearables)

Abstract

:
Wearable devices now make it possible to record large quantities of physiological data, which can be used to obtain a clearer view of a person’s health status and behavior. However, to the best of our knowledge, there are no open datasets in the literature that provide psycho-physiological data. The Multilevel Monitoring of Activity and Sleep in Healthy people (MMASH) dataset presented in this paper provides 24 h of continuous psycho-physiological data, that is, inter-beat intervals data, heart rate data, wrist accelerometry data, sleep quality index, physical activity (i.e., number of steps per second), psychological characteristics (e.g., anxiety status, stressful events, and emotion declaration), and sleep hormone levels for 22 participants. The MMASH dataset will enable the investigation of possible relationships between the physical and psychological characteristics of people in daily life. Data were validated through different analyses that showed their compatibility with the literature.
Dataset: Multilevel Monitoring of Activity and Sleep in Healthy People (MMASH), https://physionet.org/content/mmash/1.0.0/.
Dataset License: Open Database License (ODbL) v1.0

1. Summary

Wearable activity trackers allow users to collect data 24 h a day, 7 days a week. In the last few years, these devices have become increasingly popular for monitoring physical activity, heart rate (HR), and sleep quality. With the help of the data extracted from these devices, we can now obtain a clearer overview of a person’s health status and behaviors, making it possible to evaluate the user’s well-being (e.g., cardiovascular status, sleep quality, and physical activity) [1]. However, it was found that motion artifacts that affect the HR recorded with wearable devices [2] can negatively affect the accuracy and validity of well-being prediction. For that reason, a dataset providing 24 h of psycho-physiological data collected using gold-standard devices is useful for researchers and companies to develop tools that can predict users’ well-being during the day by simulating data extracted from wrist-worn activity trackers [2,3].
To the best of our knowledge, only a few open datasets provide long-term beat-to-beat data, but none of them are related to actigraphy and psychological data. For example, two open datasets focused on inter-beat interval (IBI) data are: (i) the Normal Sinus Rhythm RR Interval Database by PhysioNet (https://physionet.org/physiobank/database/nsr2db/); and (ii) the Congestive Heart Failure RR Interval Database by PhysioNet (https://physionet.org/content/chf2db/1.0.0/). Based on these, researchers and companies have investigated several aspects, such as circadian rhythm [3], the effect of missing values in heart rate (HR) and heart rate variability (HRV) [2,4], and parasympathetic activity in healthy and unhealthy subjects [5,6]. Even though important results were found, the lack of several other pieces of information (e.g., saliva stress biomarkers, physical activity information, and psychological information) does not allow a complete view of subjects to be obtained. This could produce misleading results due to different HR responses caused by individuals’ characteristics.
In addition to continuous beat-to-beat data provided by the open datasets listed above, in the Multilevel Monitoring of Activity and Sleep in Healthy people (MMASH) dataset [7,8], a set of 24-h psychological and physiological characteristics (i.e., beat-to-beat data, triaxial accelerometer, anxiety status, stress events, emotions, and sleep quality) are provided from 22 healthy subjects. Moreover, in addition to individual characteristics such as chronotype and anthropomorphic data, we also provide information about cortisol and melatonin saliva concentrations and activity diaries. In conclusion, the MMASH dataset should be greatly beneficial to the scientific community, because it can contribute to several research fields by allowing one to assess any possible relationship between physiological and psychological characteristics and by providing a wide overview of all the individual aspects that could affect subjects’ psycho-physiological responses throughout the day and night.

2. Data Description

The MMASH dataset was released under the Open Database License (ODbL) v1.0 and is publicly available on PhysioNet (https://physionet.org/content/mmash/1.0.0/) [7,8]. It consists of seven files for each participant:
  • user_info.csv: anthropomorphic characteristics of the participant.
  • sleep.csv: sleep duration and quality of the participant.
  • RR.csv: beat-to-beat data.
  • questionnaire.csv: scores for all the questionnaires.
  • Acivity.csv: activity diary throughout the day.
  • Actigraph.csv: wrist triaxial accelerometer data.
  • saliva.csv: cortisol and melatonin saliva concentrations recorded before sleeping and immediately after waking up.
In this section we describe the structure of each file in detail.

2.1. User Data

The file user_info.csv provides all the individual anthropocentric characteristics:
  • Gender: M (male) and F (female).
  • Height: height of the participant expressed in centimeters (cm).
  • Weight: participant weight in kilograms (kg).
  • Age: age of the participant expressed in years (yrs).

2.2. Questionnaire Data

The answers provided by participants in the questionnaires were combined into a final questionnaire score and included in the questionnaire.csv file for each user. These contain nineteen scores corresponding to:
  • MEQ: morningness–eveningness questionnaire value. The MEQ score ranges from 16 to 86 and is grouped into three main chronotypes: MEQ scores lower than 41, between 42 and 58, and higher than 59 reflect evening, intermediate, and morning types, respectively [9].
  • STAI-Y 1: state anxiety value obtained from the State-Trait Anxiety Inventory. STAI-Y 1 ranges from 20 to 80: scores less than 31, between 31 and 49, and higher than 50 indicate low or no state anxiety, an average level of anxiety or borderline levels, and high level, respectively [10].
  • STAI-Y 2: trait anxiety value obtained from the State-Trait Anxiety Inventory. STAI-Y 2 ranges from 20 to 80: scores less than 31, between 31 and 49, and higher than 50 indicate low or no anxiety, an average level or borderline levels, and high level, respectively [10].
  • Pittsburgh: Pittsburgh sleep quality questionnaire index. It gives a score from 0 to 21. Pittsburgh values lower than 6 indicate a good sleep quality [11].
  • BIS/BAS: behavioral inhibition/activation systems scales [12]. The BIS/BAS self-reported questionnaire evaluates the different facets related to the biological basis of individual personality according to the reinforcement sensitivity theory (RST). The BIS/BAS facets describe the equilibrium between the avoidance and approaching behaviors (a high score in one factor represents a high level of that characteristic in the individual, compared to the score of the original sample):
    Bis: regards the tendency to perform avoidance behaviors and the sensibility toward negative situations;
    Drive: describes individual’s perseverance and constancy in achieving goals;
    Reward: identifies the “reward responsiveness”, that is, the predisposition to experience positive effects from reward-related stimuli;
    Fun: corresponds to the “fun-seeking” facet, connected to the preference for risky situations, impulsive behaviors, and seeking stimuli that provide immediate and sensory pleasure.
  • Daily_stress: the Daily Stress Inventory (DSI) is a 58-item self-reported measure which allows people to indicate stressful events that they engaged in in the last 24 h. In addition, participants have to indicate the magnitudes of the stressful events engaged in during the past days on a Likert scale from 1 (occurred but was not stressful) to 7 (caused me to panic). Daily_stress gives a score between 0 and 406, where the higher the values, the higher the frequency and magnitude of the stressful events perceived during the day [13].
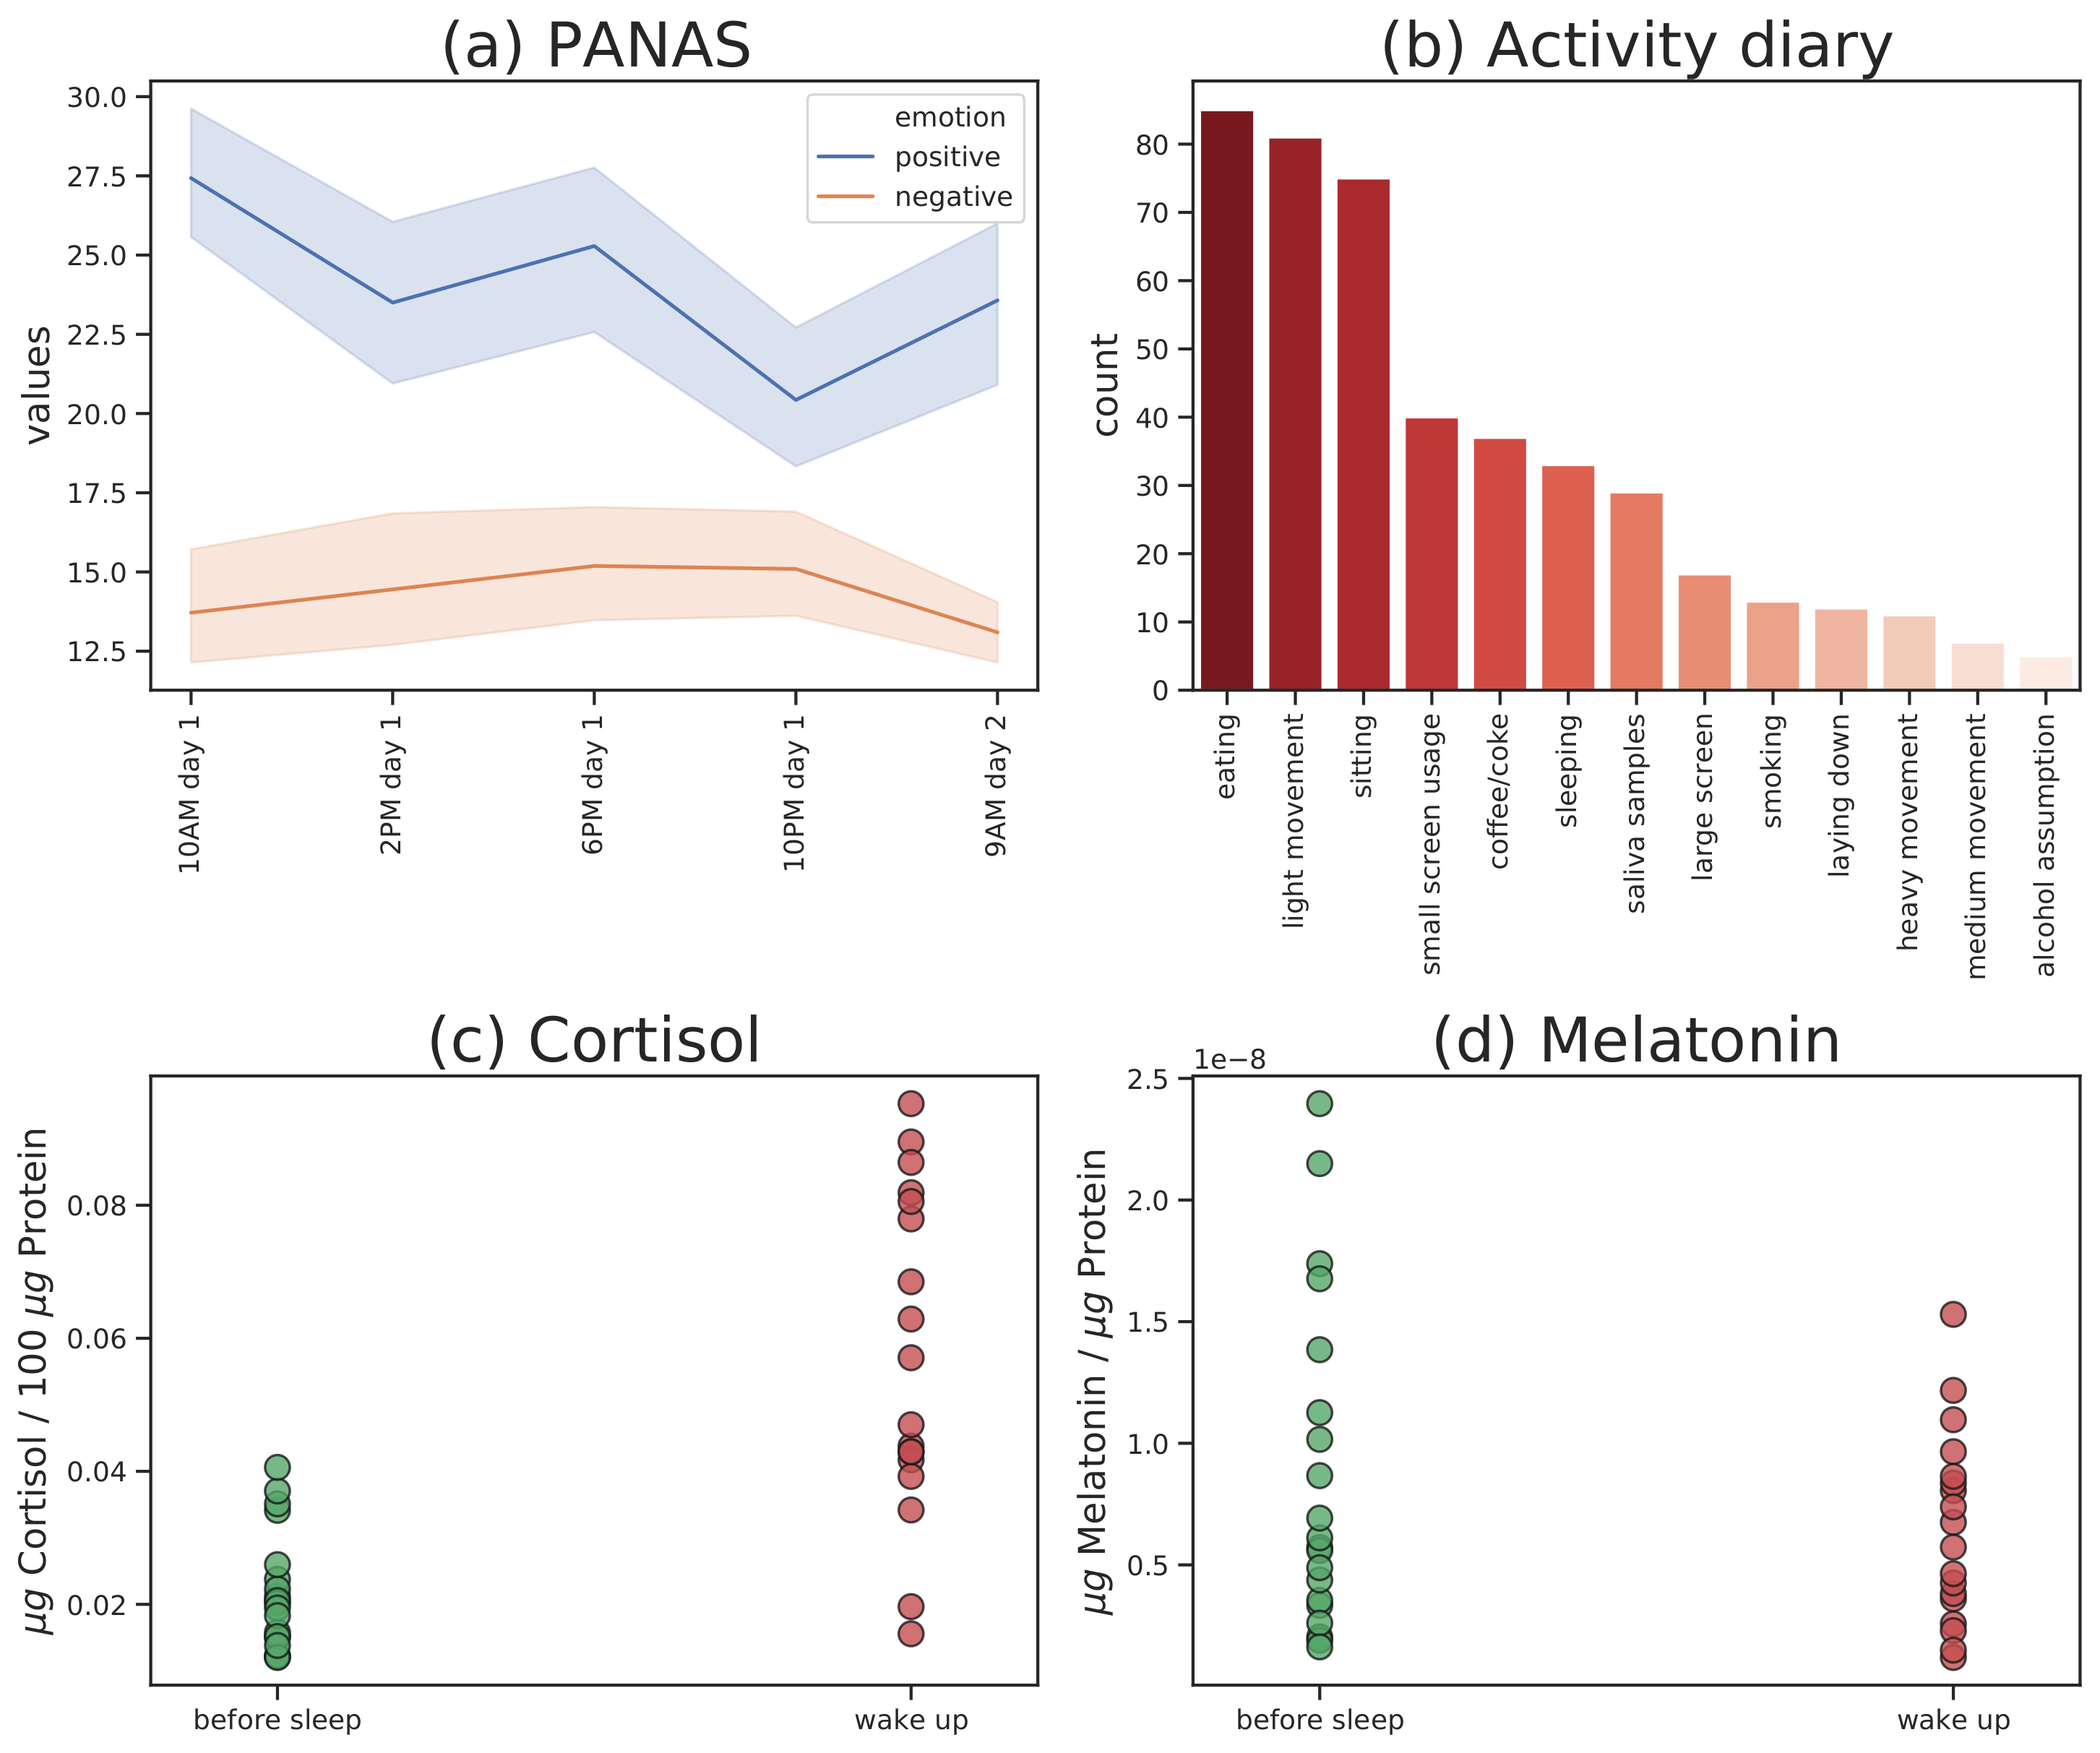
  • PANAS: Positive and Negative Affect Schedule. PANAS scores range between 5 and 50 for both positive (pos) and negative emotions (neg) [14]. A high PANAS value indicates high perceived emotion, while a low PANAS value refers to a weak emotion. In the MMASH dataset, columns that include 10, 14, 22, and 9 + 1 refer to the time of day when the questionnaire was filled in; 9 + 1 indicates 9 AM on the second recording day.

2.3. Activity Diary

The activities reported by each participant are provided in the file Activity.csv using the numerical categories listed in the Methods section. For each activity, we provide: category; start time; end time; day. The day field can take two values: 1 for the first day; 2 for the second day. This to distinguish between morning activities immediately after starting the measurements and those of the next day, immediately before stopping the measurements.

2.4. Wearable Devices

2.4.1. Heart Rate Monitor

Heart data for each user are provided in the RR.csv file that contains the following columns:
  • Day: day when the beats happen (i.e., 1 refers to the first day and 2 to the second).
  • Time: time of the day when the beats happen.
  • IBI: time between two consecutive beats expressed in seconds.

2.4.2. ActiGraph

The Actigraph.csv file contains actigraphy data with the following columns:
  • Axis1: X axis accelerometer data expressed in Newton-meters.
  • Axis2: Y axis accelerometer data expressed in Newton-meters.
  • Axis3: Z axis accelerometer data expressed in Newton-meters.
  • Steps: number of steps per second.
  • Heart Rate: number of heart beats per second.
  • Inclinometer Off: this parameter indicates the activation of the inclinometer. In particular, 1 is reported when the inclinometer is not active. The values are reported per second.
  • Inclinometer Standing: this parameter indicates if the participant is in a standing position (1) or not (0) every second.
  • Inclinometer Sitting: this parameter indicates if the participant is in a sitting position (1) or not (0) every second.
  • Inclinometer Lying: this parameter indicates if the participant is in a lying position (1) or not (0) every second.
  • Vector Magnitude: magnitude of the three accelerometer axes.
  • day: day when the activity values were recorded (i.e., 1 refers to the first day and 2 to the second day).
  • time: time of day when the activity values were recorded.
Sleep data are included in the sleep.csv file for each user:
  • In Bed Date: day when the user went to bed (1 refers to the first day, while 2 refers to the second)
  • In Bed Time: time of day when the user went to bed.
  • Out Bed Date: day when the user got up from bed (i.e., 1 refers to the first day, while 2 refers to the second).
  • Out Bed Time: time of day when the user got up from bed.
  • Onset Date: day when the user fell asleep (i.e., 1 refers to the first day and 2 refers to the second).
  • Onset Time: time of day when the user fell asleep.
  • Latency: time in minutes needed to fall asleep.
  • Total Minutes in Bed.
  • Total Sleep Time (TST) in minutes.
  • Efficiency: the ratio between total sleep time and total minutes in bed (TST/TMB).
  • Wake After Sleep Onset (WASO): time spent awake after falling asleep the first time.
  • Number of Awakenings
  • Average Awakening Length in minutes.
  • Movement Index (MI): number of minutes without movement, expressed as a percentage of the movement phase (i.e., number of periods with arm movement).
  • Fragmentation Index (FI): number of minutes with movement expressed as a percentage of the immobile phase (i.e., number of periods without arm movement).
  • Sleep Fragmentation Index (SFI): the ratio between Movement and Fragmentation indexes.

2.5. Biomarker Assessments

Melatonin and cortisol measurements from saliva samples are provided in the file saliva.csv. Two saliva samples per participant were collected. The first was collected just before sleep and the second just after waking up, as indicated by the SAMPLES data column. This peculiar sample collection was necessary because the goal of the research was to verify the possible correlations between specific physiological endpoints related to sleep (thus related to the phase of falling asleep and awakening) and the parameters monitored by the wrist devices. For this purpose, the subjects were instructed to take saliva samples just before falling asleep and in the first few minutes after awakening. We were not interested in either looking for the hormonal peak response, or in identifying differences between the circadian rhythms of the participants. Melatonin and cortisol levels are reported in μ g of melatonin per μ g of proteins and in μ g of cortisol per 100 μ g of protein, respectively.

3. Methods

The data described in this paper were collected and provided by BioBeats (https://biobeats.com, a company owned by Huma https://huma.com) and researchers from the University of Pisa. BioBeats is a health science company that produces IoT wrist-worn devices that allow the detection of people’s psycho-physiological stress. The data were recorded by experts from several research fields (e.g., sports and health, psychology, and neurochemistry) with the aim of building a dataset making it possible to assess psycho-physiological responses to stress stimuli and sleep.
Twenty two healthy young adult males (mainly students from the University of Pisa) were recruited. As this is an exploratory pilot study, it was important to seek a sample of subjects that was as homogeneous as possible, in order to limit inter-individual variables and to maintain a small number of subjects. In order to engage in this study, the participants signed an informed consent which provided them information about the protocol of this study, any possible risks during data recording, and details about data usage, in accordance with the General Data Protection Regulation: Regulation EU 2016/679 of the European Parliament and of the Council 27/04/2016 on the protection of private persons with regard to the processing of personal data and on the free movement of such data. This study was approved by the Ethical Committee of the University of Pisa (#0077455/2018).
Anthropomorphic characteristics (i.e., age, height, and weight) and psychological status (i.e., MEQ, STAI-Y, Pittsburgh Sleep Quality Index (PSQI), and BIS/BAS) of the participants were recorded at the start of the data recording. Over the course of 24 h, the participants were continuously monitored by two devices: (i) a heart rate monitor to record heart beats; and (ii) an actigraph to record actigraphy information such as accelerometer data, sleep quality, and number of steps per second. Moreover, participants reported all of the activities that they performed during the day (e.g., sleep, naps, smoking physical activity, meals, and use of devices) on an activity diary. Moreover, participants filled in the PANAS questionnaire at different times of day (i.e., 10 A.M., 2 P.M., 6 P.M., 10 P.M., and 9 A.M. of the next day) and DSI before going to sleep in order to summarize the magnitude of stressful events that the participants had engaged in during the day.
Finally, twice a day (i.e., before sleeping and after waking up), the subjects collected saliva samples at home in appropriate vials. Saliva samples were used to assess cortisol and melatonin. In order to take part in this study, participants were asked to perform a washout period from drugs or psychotropic substances (i.e., melatonin, benzodiazepines) of at least a week in order to reduce any possible alteration in hormone saliva concentration.
In the rest of this section, we describe in detail the questionnaires and instruments used.

3.1. Questionnaires

3.1.1. Morningness–Eveningness Questionnaire (MEQ)

The MEQ is a self-assessment chronotype questionnaire developed by researchers James A. Horne and O. Östberg in 1976 [9]. Its main purpose is to measure whether a person’s circadian rhythm produces peak alertness in the morning, in the evening, or in between, defining a person as morning, evening, or neither types [15]. Morning types prefer to wake up early in the morning and reach the peak body temperature at rest earlier in the day than the other two types. Neither types do not show strong preferences for either earlier or later activities, and they can adapt as easily to advanced or delayed sleep–wake schedules, although they tend to wake up and fall asleep later than morning types but before evening ones [16,17,18].
MEQ is characterized by 19 numerical/multiple choice items (4–5 point scale) enquiring about participants’ preferences for engaging in different activities (e.g., when they would prefer to wake up or start sleep, rather than when they actually do). The sum of the answers gives a chronotype score ranging from 16 to 86: MEQ scores lower than 41, between 42 and 58, and higher than 59 reflect evening, intermediate, and morning types, respectively [9]. A proportion of 49.8% of the total population was classified as morning type compared to 5.6% having an evening type preference.

3.1.2. State-Trait Anxiety Inventory (STAI-Y)

STAI-Y is a commonly used measure of trait and state anxiety [10]. It can be used in clinical settings to diagnose anxiety and to distinguish it from depressive syndromes. It is also often used in research as an indicator of caregivers’ distress.
STAI-Y is divided into two parts of 20 items each that measure momentary (state) and chronic (trait) anxiety symptoms in adult subjects. State anxiety (STAI-Y 1) is a measure of anxiety experienced at the time of the test, while trait anxiety (STAI-Y 2) is a measure of a general tendency for anxiety. Each item is scored from 1 to 4 points, which yields a total score that can range from 20 to 80. According to the questionnaire guidelines, total test scores less than 31, between 31 and 49, and higher than 50 indicate low or no anxiety, an average level of anxiety or borderline levels, and high level of anxiety, respectively [10].

3.1.3. Pittsburgh Sleep Quality Questionnaire Index (PSQI)

The PSQI is a tool used to measure the quality and patterns of sleep in the past month [11]. It differentiates “poor” from “good” sleep by measuring seven domains: subjective sleep quality, sleep latency, sleep duration, habitual sleep efficiency, sleep disturbances, use of sleep medication, and daytime dysfunction over the last month. The participant self-rates each of these seven areas of sleep. The scoring of the answers is based on a 0 to 3 scale, whereby 3 reflects the negative valence on the Likert scale. PSQI gives a score ranging from 0 to 21, with values lower than 6 indicating good sleep quality.

3.1.4. Behavioral Inhibition System/Behavioral Activation System Scales (BIS/BAS)

Carver and White (1994) [12] developed a questionnaire with the aim of measuring the dual motivational theory based on the behavioral activation system (BAS) and the behavioral inhibition system (BIS). Carver and White’s scales focus primarily on the affective self-regulatory functions of these two constructs.
The questionnaire derives from Grey’s bio-psychological theory of personality that describes individual disposition during interaction with the surrounding environment [19]. Different BIS/BAS facets aim at measuring individuals’ approach toward negative events or appealing stimuli, balancing the BIS and the BAS.
Specifically, the BIS facet only reflects subject sensitivity toward adverse events that promote avoidance behaviors, while the three other components in which BAS is divided represent different sides of the propensity to approach positive stimuli. The “drive” sub-scale of BAS describes individual persistence and motivational intensity; “fun seeking” is related to impulsivity and immediate reward due to sensation stimuli or risky situations; and “reward responsiveness” indicates a propensity to show a higher degree of positive emotion for goal attainment. The Italian version of BIS/BAS is composed of 24 items (20 score items and 4 fillers, each measured on five-point Likert scale) [20].

3.1.5. Positive and Negative Affect Schedule (PANAS)

Positive affect (PA) and negative affect (NA) are the most general dimensions that describe affective experience. PA and NA are the affective, emotional components of psychological or subjective well-being [14,21]. Measures of PA and NA also have relevance in clinical research and practice, where they are considered to be the identifying features which distinguish anxiety from depression [22]. Finally, PA and NA are found to be strongly related to extraversion and neuroticism personality factors, respectively [23,24], and represent core components of the two broad personality dimensions [25].
PANAS is characterized by 20 items (10 for PA and 10 for NA) rated on a 5-point scale. These items measure the extent to which participants experience each affect using trait and state formats. First, participants are asked to report the intensity (from “not at all” to “extremely”) of their current affect, and how they are feeling “right now”, which is intended to assess state affect [14].

3.1.6. Daily Stress Inventory (DSI)

DSI is a 58-item self-report measure that allows a person to indicate potentially stressful events that they have experienced in the past 24 h [13]. After indicating which events occurred, individuals rate the stressfulness of those events on a Likert scale from 1 (“occurred but was not stressful”) to 7 (“caused me to panic”). DSI scores are computed as the sum of the total of the impact rating of these events.

3.2. Activity Diary

Participants reported all the activities performed throughout the recording day in a diary, with start and end times. In order to enable meaningful data analysis, we manually processed the logs and grouped the activities in 13 categories which are related with physical activity. The categories are: (i) sleeping; (ii) lying down; (iii) sitting (e.g., studying, eating, and driving); (iv) light movement (e.g., slow/medium walking, chores, and work); (v) medium (e.g., fast walking and cycling); (vi) heavy (e.g., gym, running); (vii) eating; (viii) small screen usage (e.g., smartphone and computer); (ix) large screen usage (e.g., TV and cinema); (x) caffeinated drink consumption (e.g., coffee or soda); (xi) smoking; (xii) alcohol consumption; (xiii) saliva sample.

3.3. Instruments

3.3.1. Polar H7 Heart Rate Monitor Chest Strap

The Polar H7 heart rate monitor (Polar Electro Inc., Bethpage, NY, USA) is a Bluetooth Low-Energy chest strap with an ECG sensor that provides information about inter-beat intervals (IBI). Based on these data, it provides continuous measurements of subjects’ HR and HRV [26].

3.3.2. ActiGraph GT9X

The ActiGraph wGT3X-BT (ActiGraph LLC, Pensacola, FL, USA) is a triaxial accelerometer and one of the most commonly used devices for assessing physical activity. The dimensions of the sensor are 4.6 × 3.3 × 1.5 cm with a weight of 19 g and frequency range between 30 and 100 Hz. The accelerometer has a dynamic range of ±8g and a precision of 12 bit. Besides raw accelerometer data, we also provide sleep data extracted using the Cole–Kripke algorithm [27].

3.4. Biomarker Assessments by Saliva Sample

Saliva samples were collected by a straw into a polypropylene tube (IBL international, Hamburg, Germany). Samples suspected of being contaminated with blood were discarded. A protease inhibitor cocktail (Sigma-Aldrich S.r.l., Milan, Italy) was added to the samples (1:1000). Samples were frozen once at −20 C prior to the test run in order to precipitate interfering mucoproteins and facilitate the manipulation. After thawing and before assay, the samples were centrifuged at 986× g, 4 C for 15 min to remove solid particulates. For a longer period the saliva samples were stored in aliquots at −20 C.
Melatonin and cortisol levels in saliva samples were quantified using commercial enzyme-linked immunosorbent assay (ELISA) according to the manufacturer’s recommendations (Cortisol Saliva ELISA RE52611, Melatonin direct Saliva ELISA RE54041- IBL International, Hamburg, Germany).
For melatonin quantification, 100 μ L of each analyte standard dilution, control, and sample (saliva undiluted) were pipetted in duplicate into the multi-plate wells and 50 μ L of the antiserum solution was added. After covering with adhesive foil, the plate was incubated for 16 h at 4 C. All wells were then washed four times with 250 μ L wash buffer. An amount of 100 μ L of biotin solution was added and the plate was incubated for 1 h at room temperature, while shaking continuously (500 rpm, Thermomixer comfort, Eppendorf). Then, all the wells were washed four times with 250 μ L wash buffer and 100 μ L of enzyme conjugate solution was added. After 1 h incubation at room temperature while shaking, samples were aspirated and 100 μ L of TMB substrate solution was added. Chemiluminescence at 450 nm was read 15 min after the addition of 100 μ L of stop solution. The EnSight multimode plate reader, equipped with Kaleido Data Acquisition and Analysis Software (Perkin Elmer, Waltham, MA, USA), was used. The obtained optical densities (ODs) of the standards (Y-axis, linear) were plotted against their concentration (X-axis, logarithmic) on semi-logarithmic graph paper. The concentration of the samples was read directly from the standard curve.
In brief, for cortisol assessment, 50 μ L of each analyte standard dilution, control, and sample (saliva undiluted) were pipetted in duplicate into the wells and 100 μ L of the antiserum solution was added. After covering with adhesive foil, the plate was incubated for 2 h at room temperature, while shaking. Then, all wells were washed four times with 250 μ L wash buffer and 100 μ L of TMB substrate solution was added. Chemiluminescence at 450 nm was read 30 min after the addition of 100 μ L of stop solution. The EnSight multimode plate reader, equipped with Kaleido Data Acquisition and Analysis Software (Perkin Elmer, Waltham, MA, USA), was used. The obtained ODs of the standards (Y-axis, linear) were plotted against their concentration (X-axis, logarithmic) on semi-logarithmic graph paper. The concentration of the samples was read directly from the standard curve.
Furthermore, values obtained by melatonin and cortisol quantification were normalized to the protein content of each sample. Protein concentrations were estimated by the method of Lowry and colleagues with bovine serum albumin (BSA) as standard [28].

4. Usage Notes

MMASH is the first open dataset that provides multidimensional information about several psycho-physiological aspects of people’s everyday life. In particular, this dataset provides data of cardiovascular responses (i.e., inter-beat intervals), psychological perceptions (e.g., stress, anxiety, and emotions), sleep quality, movement information (e.g., wrist triaxial accelerometer data and number of steps per second) and activity descriptions on 24 h.
Thanks to this variety of information, experts from several research fields could investigate the users’ psycho-physiological responses having a comprehensive overview of their daily life. As an example, it could be possible to assess if the perceived sleep quality (i.e., PSQI) is related to the objective quality (i.e., melatonin and cortisol levels during the night, sleep fragmentation, and sleep length) taking into consideration any possible influence of individual characteristics such as daily stress, anxiety status, and emotions. Moreover, it could be possible to develop complex models able to predict daily activities, emotions, or individual predisposition to react to adverse or positive events and stress in accordance with cardiovascular responses and/or actigraphy data. By means of these algorithms, companies and researchers could passively assess people’s routine by using data continuously recorded by wrist-worn devices that have become more popular in the last two decades.
The motivations for releasing MMASH as a public dataset were the challenges of recording all of these data together continuously for a long period (24 h) and to provide at the scientific community with a dataset that allows for a comprehensive overview of people’s daily life. Humans are a complex system characterized by several related factors. For this reason, analyses taking into account a limited set of factors incur the risk of reaching misleading results, as possible mediators are not measured. The heterogeneous types of data present in MMASH offer an all-encompassing overview of the individual’s characteristics, enabling a better understanding of the relationships between psycho-physiological features. Finally, researchers and companies could use MMASH to investigate and develop predictive models to assess people’s well-being by evaluating all of the psycho-physiological responses together.
In Section 4.1 we provide some practical examples of how to analyze the data. A Github repository (bit.ly/MMASH_github) contains source code of examples of how to read and analyze the data. All the examples are provided in the Python 3 language.

4.1. Practical Examples

MMASH includes data for 22 healthy males with the following characteristics: age = 27.29 ± 4.21 years; height = 179.91 ± 8.22 cm; weight = 75.05 ± 12.79 kg.
Table 1 summarizes the questionnaire data for MEQ, STAI-Y, PSQ, DSI, and BIS/BAS, while Figure 1a,b show the evolution of positive and negative emotions expressed as PANAS scores and the number of specific activity log events reported by the participants throughout the day, respectively. Moreover, the sleep data extracted from the ActiGraph measurements are summarized in Table 2, showing heterogeneous behavior and sleep quality among participants. Finally, Figure 1c,d show the levels found in saliva for cortisol and melatonin before and after sleep period for each participant, respectively.
Some missing values are present in the data set:
  • U s e r _ 1 shows two sleep phases because the subject woke up for an extended amount of time (more than 40 minutes) during the night, resulting in two independent sleep periods.
  • U s e r _ 7 did not fill in the STAI-Y 2 questionnaire.
  • U s e r _ 11 does not have sleep data due to technical problems with data recording.
  • U s e r _ 18 did not provide his age data.
  • U s e r _ 21 did not provide salivary samples of sufficient quality to assess hormone levels.
The values observed in this data set cover a wide range of psycho-psychological status scores. This enables analyses that link them in order to investigate several aspects of people’s daily life in order to assess their well-being. In this section we provide information relevant to data reuse.

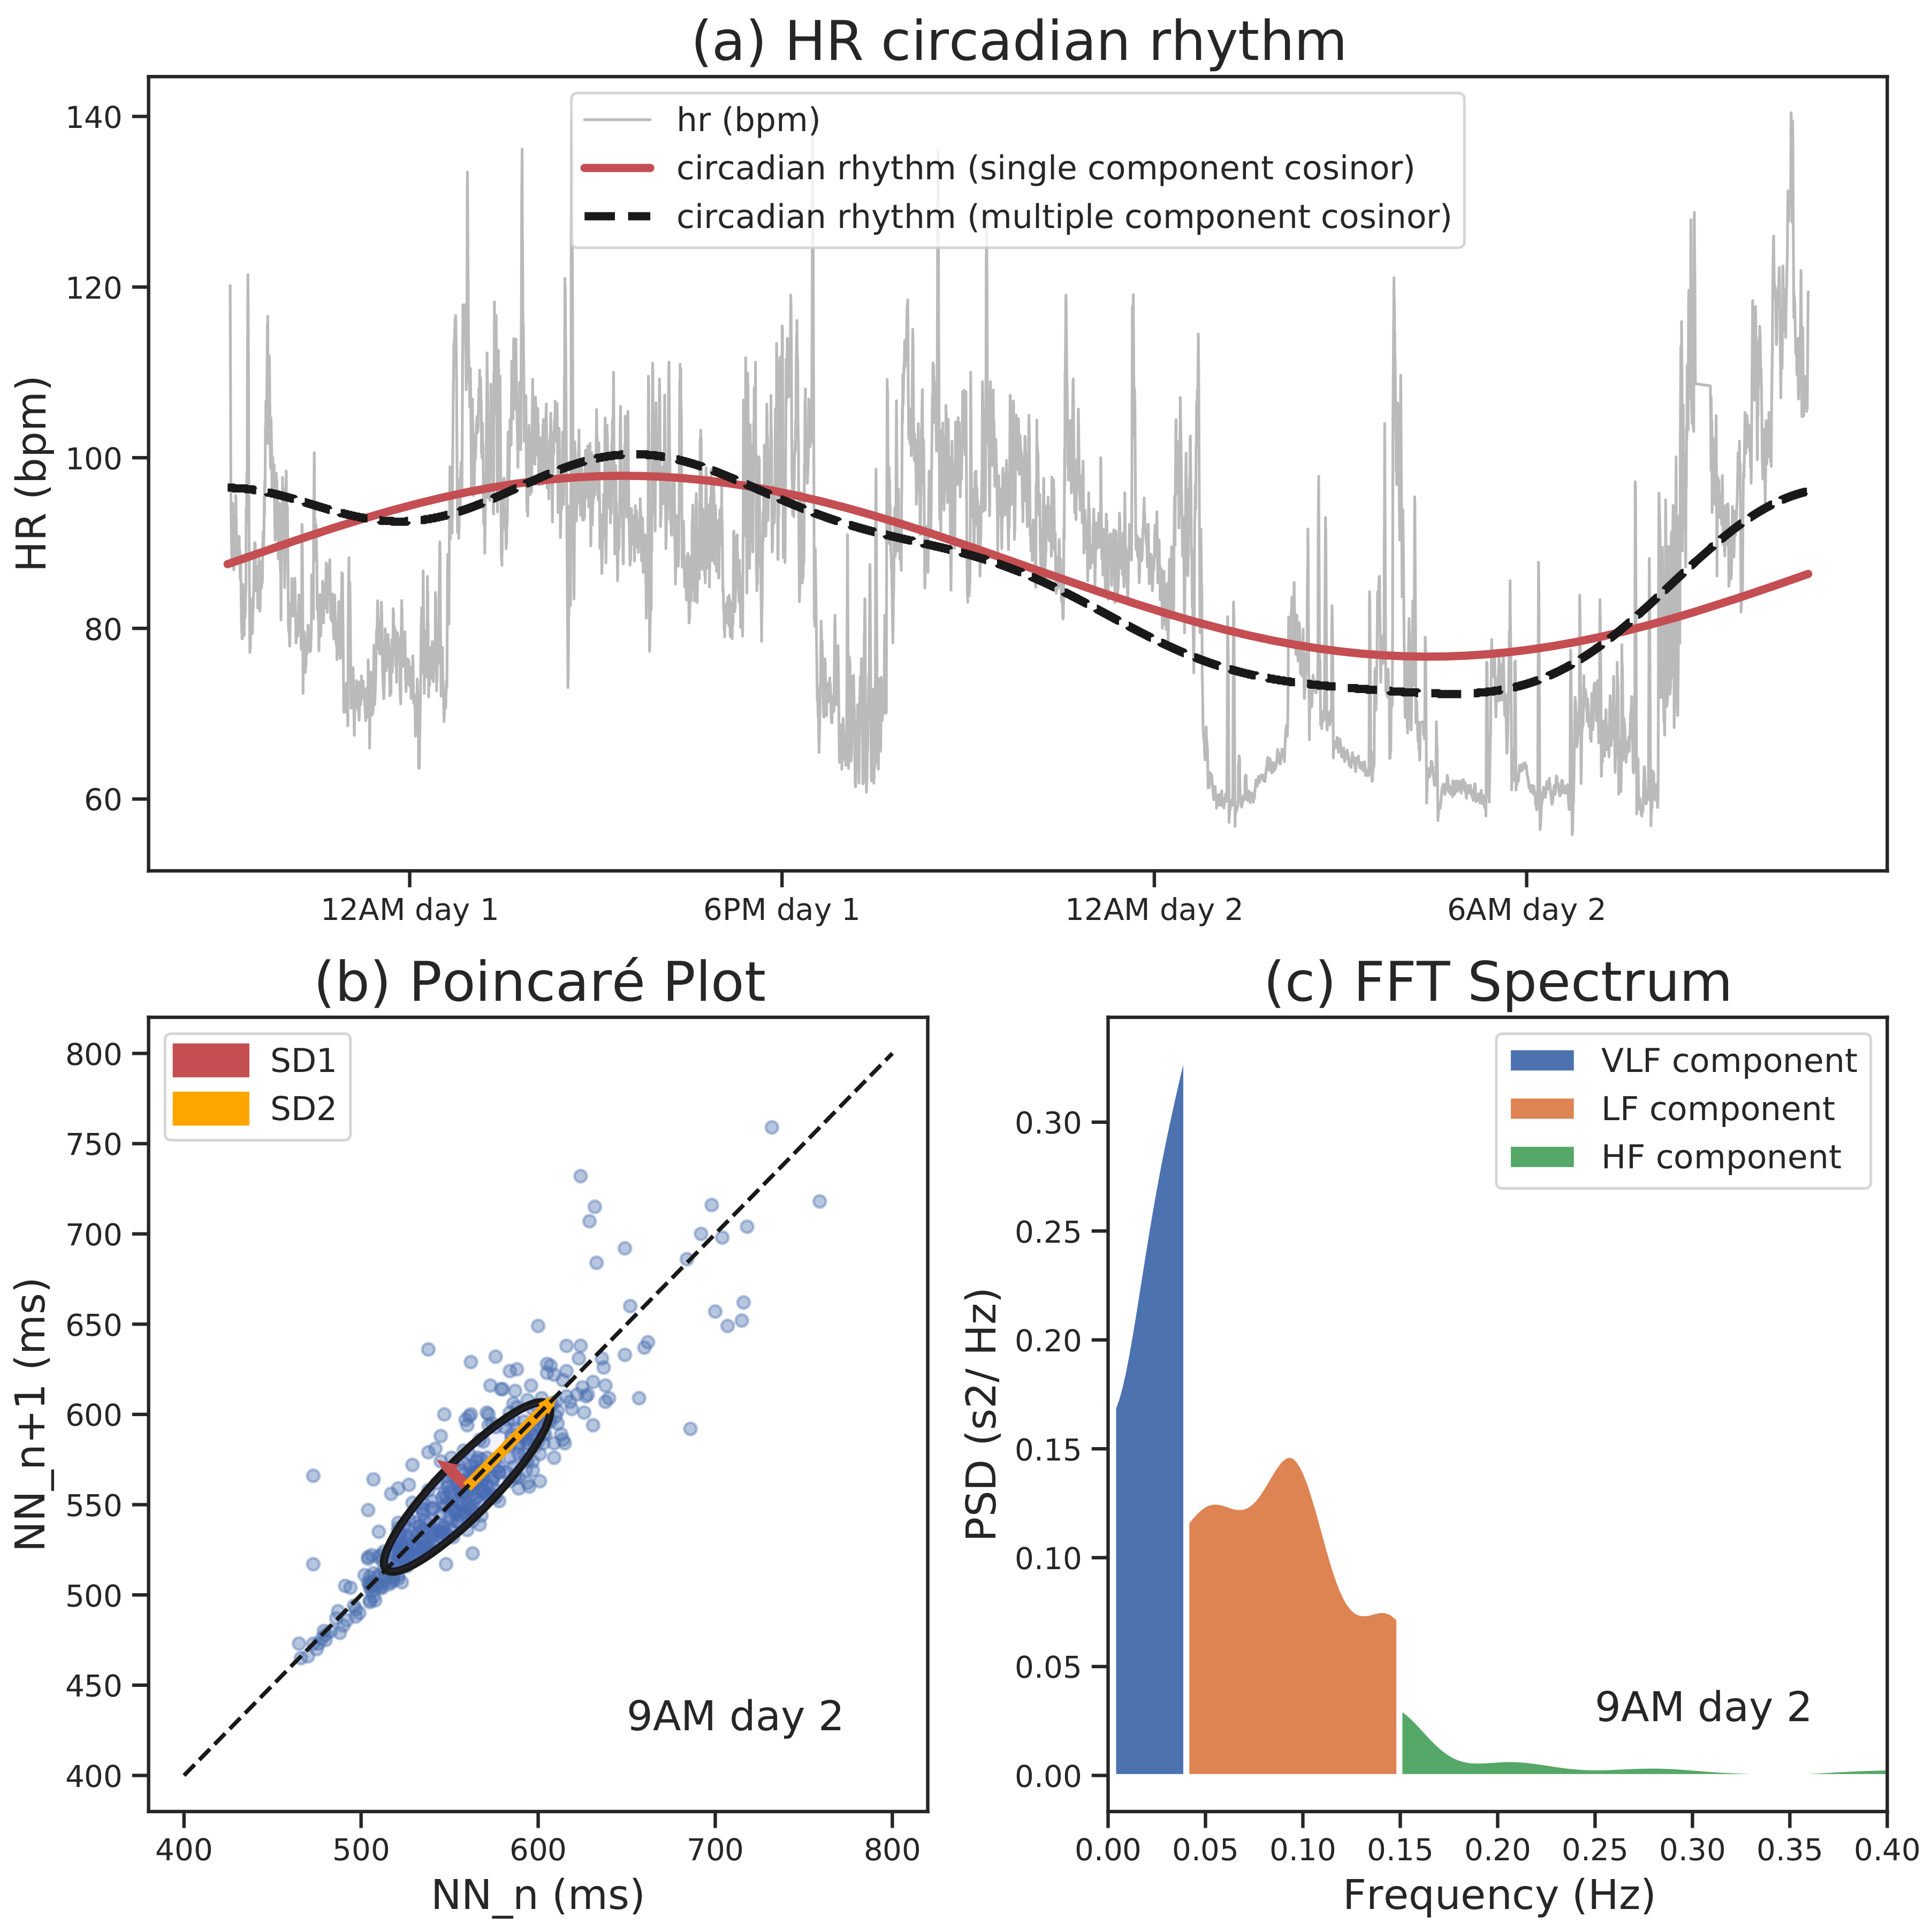
4.1.1. HR Circadian Rhythm

The circadian rhythm is a variation in physiological parameters induced by the sleep–wake cycle over a 24 h period [29]. Physiological characteristics such as HR, temperature, and melatonin show a circadian rhythm. For example, it was found that the circadian rhythm for body temperature is associated with melatonin production and rest–activity rhythms, as well as with physiological responses to exercise [30]. Figure 2a shows the HR time series and its single- and multiple-component cosinor analyses of the circadian rhythm [3] for one of the participants in our data set. From this analysis it is possible to extract information about the circadian rhythm parameters such as the MESOR (the mid-value of the single component cosinor fitted curve), the acrophase (the time of the peak of the single component cosinor fitted curve), and the amplitude (the difference between the maximum and the MESOR of the fitted curve). Table 3 provides descriptive statistics of the cosinor circadian rhythm parameters for all participants.

4.1.2. Heart Rate Variability

In the last two decades, interest in heart rate variability (HRV) has widely increased in the psycho-physiological research fields. Assessment of inter-beat intervals (IBI) variability is possible in time, frequency, and nonlinear domains, providing parameters able to quantify the amount of variation between heartbeats, thus giving an indirect index of autonomic nervous system (ANS) regulation. In particular, HRV features are useful to provide insights about sympathetic–parasympathetic balance of cardiac vagal tone, which was found to be an indicator of cognitive, emotional, social, and health status [31]. HRV is affected by a multitude of factors, so in order to reduce this “noise” and gain a clearer picture of ANS activity (i.e., stress and recovery status) general guidelines recommend taking HRV readings first thing in the morning after waking in order to avoid other influences on ANS, such as change in posture [31].
In this section we provide a description of the HRV features computed in time, frequency and non-linear domains for the subjects in our data set, limiting the analysis to the 5 min before waking up. For our participants, the mean IBI was about 812.75 ± 71.40 milliseconds (ms), which is equal to 73.82 ± 17.54 beats per minute (bpm). Table 4 summarises the three types of features computed on all our participants. Again, we see a good range of values for each feature.

Time Domain

Four HRV features were computed in the time domain: (i) HR m e a n , i.e., mean heart rate (60/IBI); (ii) RMSSD, i.e., root mean squared of successive differences; (iii) SDNN, i.e., standard deviation of IBI; and (iv) PNN50, i.e., the ratio between the number of pairs of successive IBIs that differ by more than 50 ms and the total number of IBIs.

Frequency Domain

Power spectral density (PSD) describes the distribution of power into frequency components composing that signal. I B I data naturally consist of unevenly spaced data. To perform spectral analysis of IBI data, periodogram methods should be used [32,33]. The activities of the sympathetic and parasympathetic nervous systems have an effect on different ranges of the spectrum. VLF (power in the very-low-frequencies range, i.e., less than 0.04 Hz); LF (power in the low-frequencies range, i.e., 0.04–0.15 Hz); HF (power in the high-frequencies range, i.e., 0.15–0.4 Hz); and total power (power in all the listed frequency ranges) were obtained by the sum of the power in the relevant frequency ranges in the spectrum. Figure 2c shows periodogram spectrum estimates using Welch’s method, which are the result of converting a signal from the time domain to the frequency domain by fast Fourier transformation (FFT). This plot shows that the part of the spectrum with higher power is characterized by VLF (less than 0.04 Hz, blue spot) which relates to rhythms with periods longer than 25 s. The orange area shows the LF range, which relates to frequencies with periods between 25 and 6 s, showing a peak reflecting breathing rhythm. Finally, the HF range (rhythm faster than 6 s) is the small, green part of the power spectrum.

Nonlinear Domain

The Poincaré plot is a type of recurrence plot used to quantify self-similarity in processes. Figure 2b shows a Poincaré plot obtained from a participant’s 5-min IBI time series. This is a graph that plots the IBI value in a time interval n + 1 ( IBI n + 1 ) against the previous one ( IBI n ). From this scatter plot, it is possible to quantitatively analyze the variance of IBI intervals by fitting an ellipse to the plotted shape. SD1 is the standard deviation of the Poincaré plot perpendicular to the line-of-identity, while SD2 is the standard deviation of the Poincaré plot along the line-of-identity.

Author Contributions

Conceptualization, E.D.P., D.M. (Dario Menicagli), C.P. and D.M. (Davide Morelli); Data curation, A.R.; Formal analysis, A.R., E.D.P. and A.S.; Funding acquisition, D.M. (Davide Morelli); Investigation, E.D.P., C.T. and C.M.; Methodology, A.R., E.D.P., D.M. (Dario Menicagli), C.T., C.M. and D.M. (Davide Morelli); Project administration, E.D.P. and D.M. (Davide Morelli); Supervision, E.D.P., D.A.C. and D.M. (Davide Morelli); Validation, A.R., E.D.P., D.M. (Dario Menicagli) and A.S.; Visualization, A.R.; Writing—original draft, A.R., E.D.P., D.M. (Dario Menicagli) and C.M.; Writing—review & editing, C.P., D.A.C. and D.M. (Davide Morelli). All authors have read and agreed to the published version of the manuscript.

Funding

This research was partially funded by SoBigData grant number 871042.

Acknowledgments

This work is partially supported by the European Community’s H2020 Program under the funding scheme INFRAIA-2019-1: Research Infrastructures grant agreement 871042, www.sobigdata.eu, SoBigData. There was no additional external funding received for this study.

Conflicts of Interest

The authors declare no conflict of interest.

References

  1. Blaine, R.; Alexandria, D. Health at hand: A systematic review of smart watch uses for health and wellness. J. Biomed. Inform. 2016, 63, 269–276. [Google Scholar] [CrossRef]
  2. Morelli, D.; Rossi, A.; Cairo, M.; Clifton, D.A. Analysis of the Impact of Interpolation Methods of Missing RR-intervals Caused by Motion Artifacts on HRV Features Estimations. Sensors 2019, 19, 3163. [Google Scholar] [CrossRef] [PubMed] [Green Version]
  3. Morelli, D.; Bartoloni, L.; Rossi, A.; Clifton, D.A. A computationally efficient algorithm to obtain an accurate and interpretable model of the effect of circadian rhythm on resting heart rate. Physiol. Meas. 2019, 19. [Google Scholar] [CrossRef] [PubMed]
  4. Bigger, J.T.; Fleiss, L.F.; Steinman, R.C.; Rolnitzky, L.M.; Stein, P.K. RR variability in healthy, middle-age persons compared with patients with chronic coronary heart disease or recent acute myocardial infarction. Circulation 1995, 91, 1936–1943. [Google Scholar] [CrossRef]
  5. Goldsmith, R.L.; Bigger, J.T.; Bloomfield, D.M.; Krum, H.; Steinman, R.C.; Sackner-Bernstein, J.; Packer, M. Long-term carvedilol therapy increases parasympathetic nervous system activity in chronic congestive heart failure. J. Am. Coll. Cardiol. 1997, 80, 1101–1104. [Google Scholar] [CrossRef]
  6. Goldsmith, R.L.; Bigger, J.T.; Steinman, R.C. Comparison of 24-h parasympathetic activity in endurance-trained and untrained young men. J. Am. Coll. Cardiol. 1992, 20, 552–558. [Google Scholar] [CrossRef] [Green Version]
  7. Rossi, A.; Da Pozzo, E.; Menicagli, D.; Tremolanti, C.; Priami, C.; Sirbu, A.; Clifton, D.; Martini, C.; Morelli, D. Multilevel Monitoring of Activity and Sleep in Healthy People (version 1.0.0). Physionet 2020. [Google Scholar] [CrossRef]
  8. Goldberger, A.; Amaral, L.; Glass, L.; Hausdorff, J.; Ivanov, P.C.; Mark, R.; Stanley, H.E. PhysioBank, PhysioToolkit, and PhysioNet: Components of a new research resource for complex physiologic signals. Circulation 2000, 101, 215–220. [Google Scholar] [CrossRef] [Green Version]
  9. Horne, J.A.; Ostberg, O. A Self Assessment Questionnaire to Determine Morningness Eveningness in Human Circadian Rhythms. Int. J. Chronobiol. 1976, 4, 97–110. [Google Scholar]
  10. Spielberger, C.D.; Gorsuch, R.L.; Lushene, R.; Vagg, P.R.; Jacobs, G.A. Manual for the State Trait Anxiety Inventory. (Form Y); Consulting Psychologists Press: Palo Alto, CA, USA, 1983. [Google Scholar]
  11. Curcio, G.; Tempesta, D.; Scarlata, S.; Marzano, C.; Moroni, F.; Rossini, P.M.; Ferrara, M.; De Gennaro, L. Validity of the Italian Version of the Pittsburgh Sleep Quality Index (PSQI). Neurol. Sci. 2013, 34, 511–519. [Google Scholar] [CrossRef]
  12. Carver, C.S.; White, T.L. Behavioral inhibition, behavioral activation, and affective responses to impending reward and punishment: The BIS/BAS Scales. J. Personal. Soc. Psychol. 1994, 67, 319–333. [Google Scholar] [CrossRef]
  13. Brantley, P.J.; Waggoner, C.; Jones, J.; Rappaport, N. A Daily Stress Inventory: Development, reliability, and validity. J. Behav. Med. 1987, 10, 61–73. [Google Scholar] [CrossRef]
  14. Crawford, J.R. The Positive and Negative Affect Schedule (PANAS): Construct validity, measurement properties and normative data in a large non-clinical sample. Br. J. Clin. Psychol. 2004, 43, 245–265. [Google Scholar] [CrossRef] [PubMed]
  15. Baehr, E.K.; Revelle, W.; Eastman, C.I. Individual differences in the phase and amplitude of the human circadian temperature rhythm: With an emphasis on morningness-eveningness. J. Sleep Res. 2000, 9, 117–127. [Google Scholar] [CrossRef] [PubMed]
  16. Muro, A.; Gomà-i-Freixanet, M.; Adan, A.; Cladellas, R. Circadian typology, age, and the Alternative Five-Factor Personality Model in an adult women sample. Chronobiol. Int. 2011, 28, 690–696. [Google Scholar] [CrossRef]
  17. Vitale, J.A.; Roveda, E.; Montaruli, A.; Galasso, L.; Weydahl, A.; Caumo, A.; Carandente, F. Chronotype influences activity circadian rhythm and sleep: Differences in sleep quality between weekdays and weekend. Chronobiol. Int. 2015, 32, 405–415. [Google Scholar] [CrossRef] [PubMed]
  18. Rossi, A.; Formenti, D.; Vitali, J.A.; Calogiuri, G.; Weydahl, A. The effect of chronotype on psychophysiological responses during aerobic self-paced exercises. Percept. Mot. Ski. 2015, 121, 840–855. [Google Scholar] [CrossRef]
  19. Gray, J.A. A critique of Eysenck’s theory of personality. In A Model for Personality; Springer: Berlin/Heidelberg, Germany, 1981. [Google Scholar]
  20. Leone, L.; Pierro, A.; Mannetti, L. Validità della versione italiana delle scale BIS/BAS di Carver e White (1994): Generalizzabilità della struttura e relazioni con costrutti affini. G. Ital. Psicol. 2002, 29, 413–436. [Google Scholar] [CrossRef]
  21. Diener, E.; Emmons, R.A.; Larsen, R.J.; Griffin, S. The Satisfaction With Life Scale. J. Personal. Assess. 1985, 49, 71–75. [Google Scholar] [CrossRef]
  22. Clark, L.A.; Watson, D. Tripartite model of anxiety and depression: Psychometric evidence and taxonomic implications. J. Abnorm Psychol. 1991, 100, 316–336. [Google Scholar] [CrossRef]
  23. Costa, P.T.; McCrae, R.R. Influence of extraversion and neuroticism on subjective well-being: Happy and unhappy people. J. Personal. Soc. Psychol. 1980, 38, 668–678. [Google Scholar] [CrossRef]
  24. Watson, D.; Clark, L.A. On traits and temperament: General and specific factors of emotional experience and their relation to the five-factor model. J. Personal. 1992, 60, 441–476. [Google Scholar] [CrossRef]
  25. Yik, M.S.M.; Russell, J.A.; Oceja, L.V.; Fernández Dols, J.M. Momentary affect in Spanish: Scales, structure, and relationship to personality. Eur. J. Psychol. Assess. 2000, 16, 160–176. [Google Scholar] [CrossRef]
  26. Plews, D.J.; Scott, B.; Altini, M.; Wood, M.; Kilding, A.E.; Laursen, P.B. Comparison of Heart-Rate-Variability Recording With Smartphone Photoplethysmography, Polar H7 Chest Strap, and Electrocardiography. Int. J. Sports Physiol. Perform. 2017, 12, 1324–1328. [Google Scholar] [CrossRef] [PubMed]
  27. Cole, R.J.; Kripke, D.F.; Gruen, W.; Mullaney, D.J.; Gillin, J.C. Automatic sleep/wake identification from wrist activity. Sleep 1992, 15, 461–469. [Google Scholar] [CrossRef] [PubMed]
  28. Lowry, O.H.; Rosebrough, N.J.; Farr, A.L.; Randall, R.J.J. Protein measurement with the Folin phenol reagent. J. Biol. Chem. 1951, 193, 265–275. [Google Scholar]
  29. Aschoff, J. Circadian Rhythms in Man. Science 1965, 148, 1427–1432. [Google Scholar] [CrossRef] [Green Version]
  30. Escames, G.; Ozturk, G.; Bano-Otálora, B.; Pozo, M.J.; Madrid, J.A.; Reiter, R.J.; Serrano, E.; Concepción, M.; Acuna-Castroviejo, D. Exercise and melatonin in humans: Reciprocal benefits. J. Pineal Res. 2012, 52, 1–11. [Google Scholar] [CrossRef]
  31. Laborde, S.; Mosley, E.; Thayer, J.F. Heart Rate Variability and Cardiac Vagal Tone in Psychophysiological Research—Recommendations for Experiment Planning, Data Analysis, and Data Reporting. Front. Psychol. 2017, 8, 213. [Google Scholar] [CrossRef] [Green Version]
  32. Kim, K.K.; Kim, J.S.; Lim, Y.G.; Park, K.S. The effect of missing RR-interval data on heart rate variability analysis in the frequency domain. Physiol. Meas. 2009, 30, 1039–1050. [Google Scholar] [CrossRef]
  33. Clifford, G.D.; Tarassenko, L. Quantifying errors in spectral estimates of HRV due to beat replacement and resampling. IEEE Trans. Biomed. Eng. 2005, 52, 630–638. [Google Scholar] [CrossRef] [PubMed] [Green Version]
Figure 1. (a) Evolution of positive and negative emotions throughout the day. (b) Number of events reported by the participants during their recording days. (c) Dot plot of cortisol concentration obtained from saliva sample. Difference between “before sleep” and “wake up” hormones concentrations. (d) Dot plot of melatonin concentration obtained from saliva sample; difference between “before sleep” and “wake up” hormones concentrations.
Data 05 00091 g001
Figure 2. (a) Example of single- and multiple-component cosinor analysis of heart rate (HR) to study the circadian rhythm of one participant. (b) Example Poincaré plot of a participant’s 5-min IBI time series. (c) Example of the Welch’s periodogram spectrum estimates of 5-min IBI timeseries for one participant. PSD, FFT, VLF, LF and HF refer to power spectral density, fast Fourier transformation, very low frequency, low frequency and high frequency, respectively.
Data 05 00091 g002
Table 1. Descriptive statistics of the questionnaire scores.
FeaturesMeanstdMinMedianMax
MEQ50.327.0338.0049.5064.00
STAI-Y 135.648.3324.0033.5054.00
STAI-Y 241.385.4227.0042.0049.00
PSQI5.321.992.005.009.00
DSI32.1816.3010.0030.5074.00
BIS/BAS bis22.242.4919.0022.0026.00
BIS/BAS reward19.472.7014.0019.0025.00
BIS/BAS drive12.381.998.0012.0016.00
BIS/BAS fun10.813.475.0011.0016.00
Table 2. Descriptive statistics of the sleep parameters.
FeaturesMeanstdMinMedianMax
In bed time12:49 A.M.74 min10:29 P.M.12:44 A.M.03:57 A.M.
Onset time12:50 A.M.74 min10:32 P.M.12:45 A.M.03:57 A.M.
Out bed time07:04 A.M.90 min03:31 A.M.07:00 A.M.11:00 A.M.
Latency1.501.710.000.504.00
Efficiency83.916.7573.4985.2294.23
Total minutes in bed (min)374.3296.18165.00368.50630.00
TST (min)313.0084.31144.00326.00578.00
WASO (min)59.8230.5017.0052.50118.00
Awakenings (n)19.279.784.0018.5044.00
Awakening (min)3.562.391.332.8112.25
MI13.514.386.7313.1920.67
FI10.339.220.009.7628.13
SFI23.8411.496.7322.1245.53
Table 3. Descriptive statistics for cosinor analysis of HR circadian rhythms.
FeaturesMeanstdMinMedianMax
MESOR—SCC78.377.2966.7877.4996.02
MESOR—MCC78.377.2966.7877.4996.02
acrophase—SCC14.452.816.0015.0020.00
acrophase—MCC15.732.666.0016.0020.00
amplitude—SCC10.995.610.9811.2426.49
amplitude—MCC12.335.672.4812.2426.52
RMSE—SCC16.024.7610.2415.0930.05
RMSE—MCC15.514.5610.0214.630.25
SCC: Single Component Cosinor; MCC: Multiple Component Cosinor; RMSE: Root Mean Squared Error.
Table 4. Descriptive statistics of HRV features extracted in 5-min time windows during the day. Red, green and blue cells refer to time, frequency and non linear domain features, respectively.
FeaturesMin25th PercentileMedian75th PercentileMax
mean IBI679.08791.75817.70834.04993.35
SDNN139.64149.76168.02190.95348.62
PNN506.4713.4117.8521.7553.45
RMSSD31.6647.3767.4285.72512.37
vlf1208.151519.791945.372049.475445.90
lf1131.841550.141870.792323.2411,697.00
hf275.73591.69900.381607.9435,915.60
total power2947.443844.574633.565837.0353,058.50
SD122.3933.4947.6860.61362.30
SD2191.18210.60235.25261.51342.10
SD1/SD20.923.745.407.3010.24

