

Obligation to Enhance OBIS Data for Sea- and Shorebirds of the Americas


College of Marine Science, University of South Florida, St Petersburg, FL 33701, USA
*
Author to whom correspondence should be addressed.
Diversity 2022, 14(12), 1099; https://doi.org/10.3390/d14121099
Submission received: 28 October 2022
/
Revised: 7 December 2022
/
Accepted: 8 December 2022
/
Published: 11 December 2022
(This article belongs to the Special Issue Diversity in 2022)
Abstract
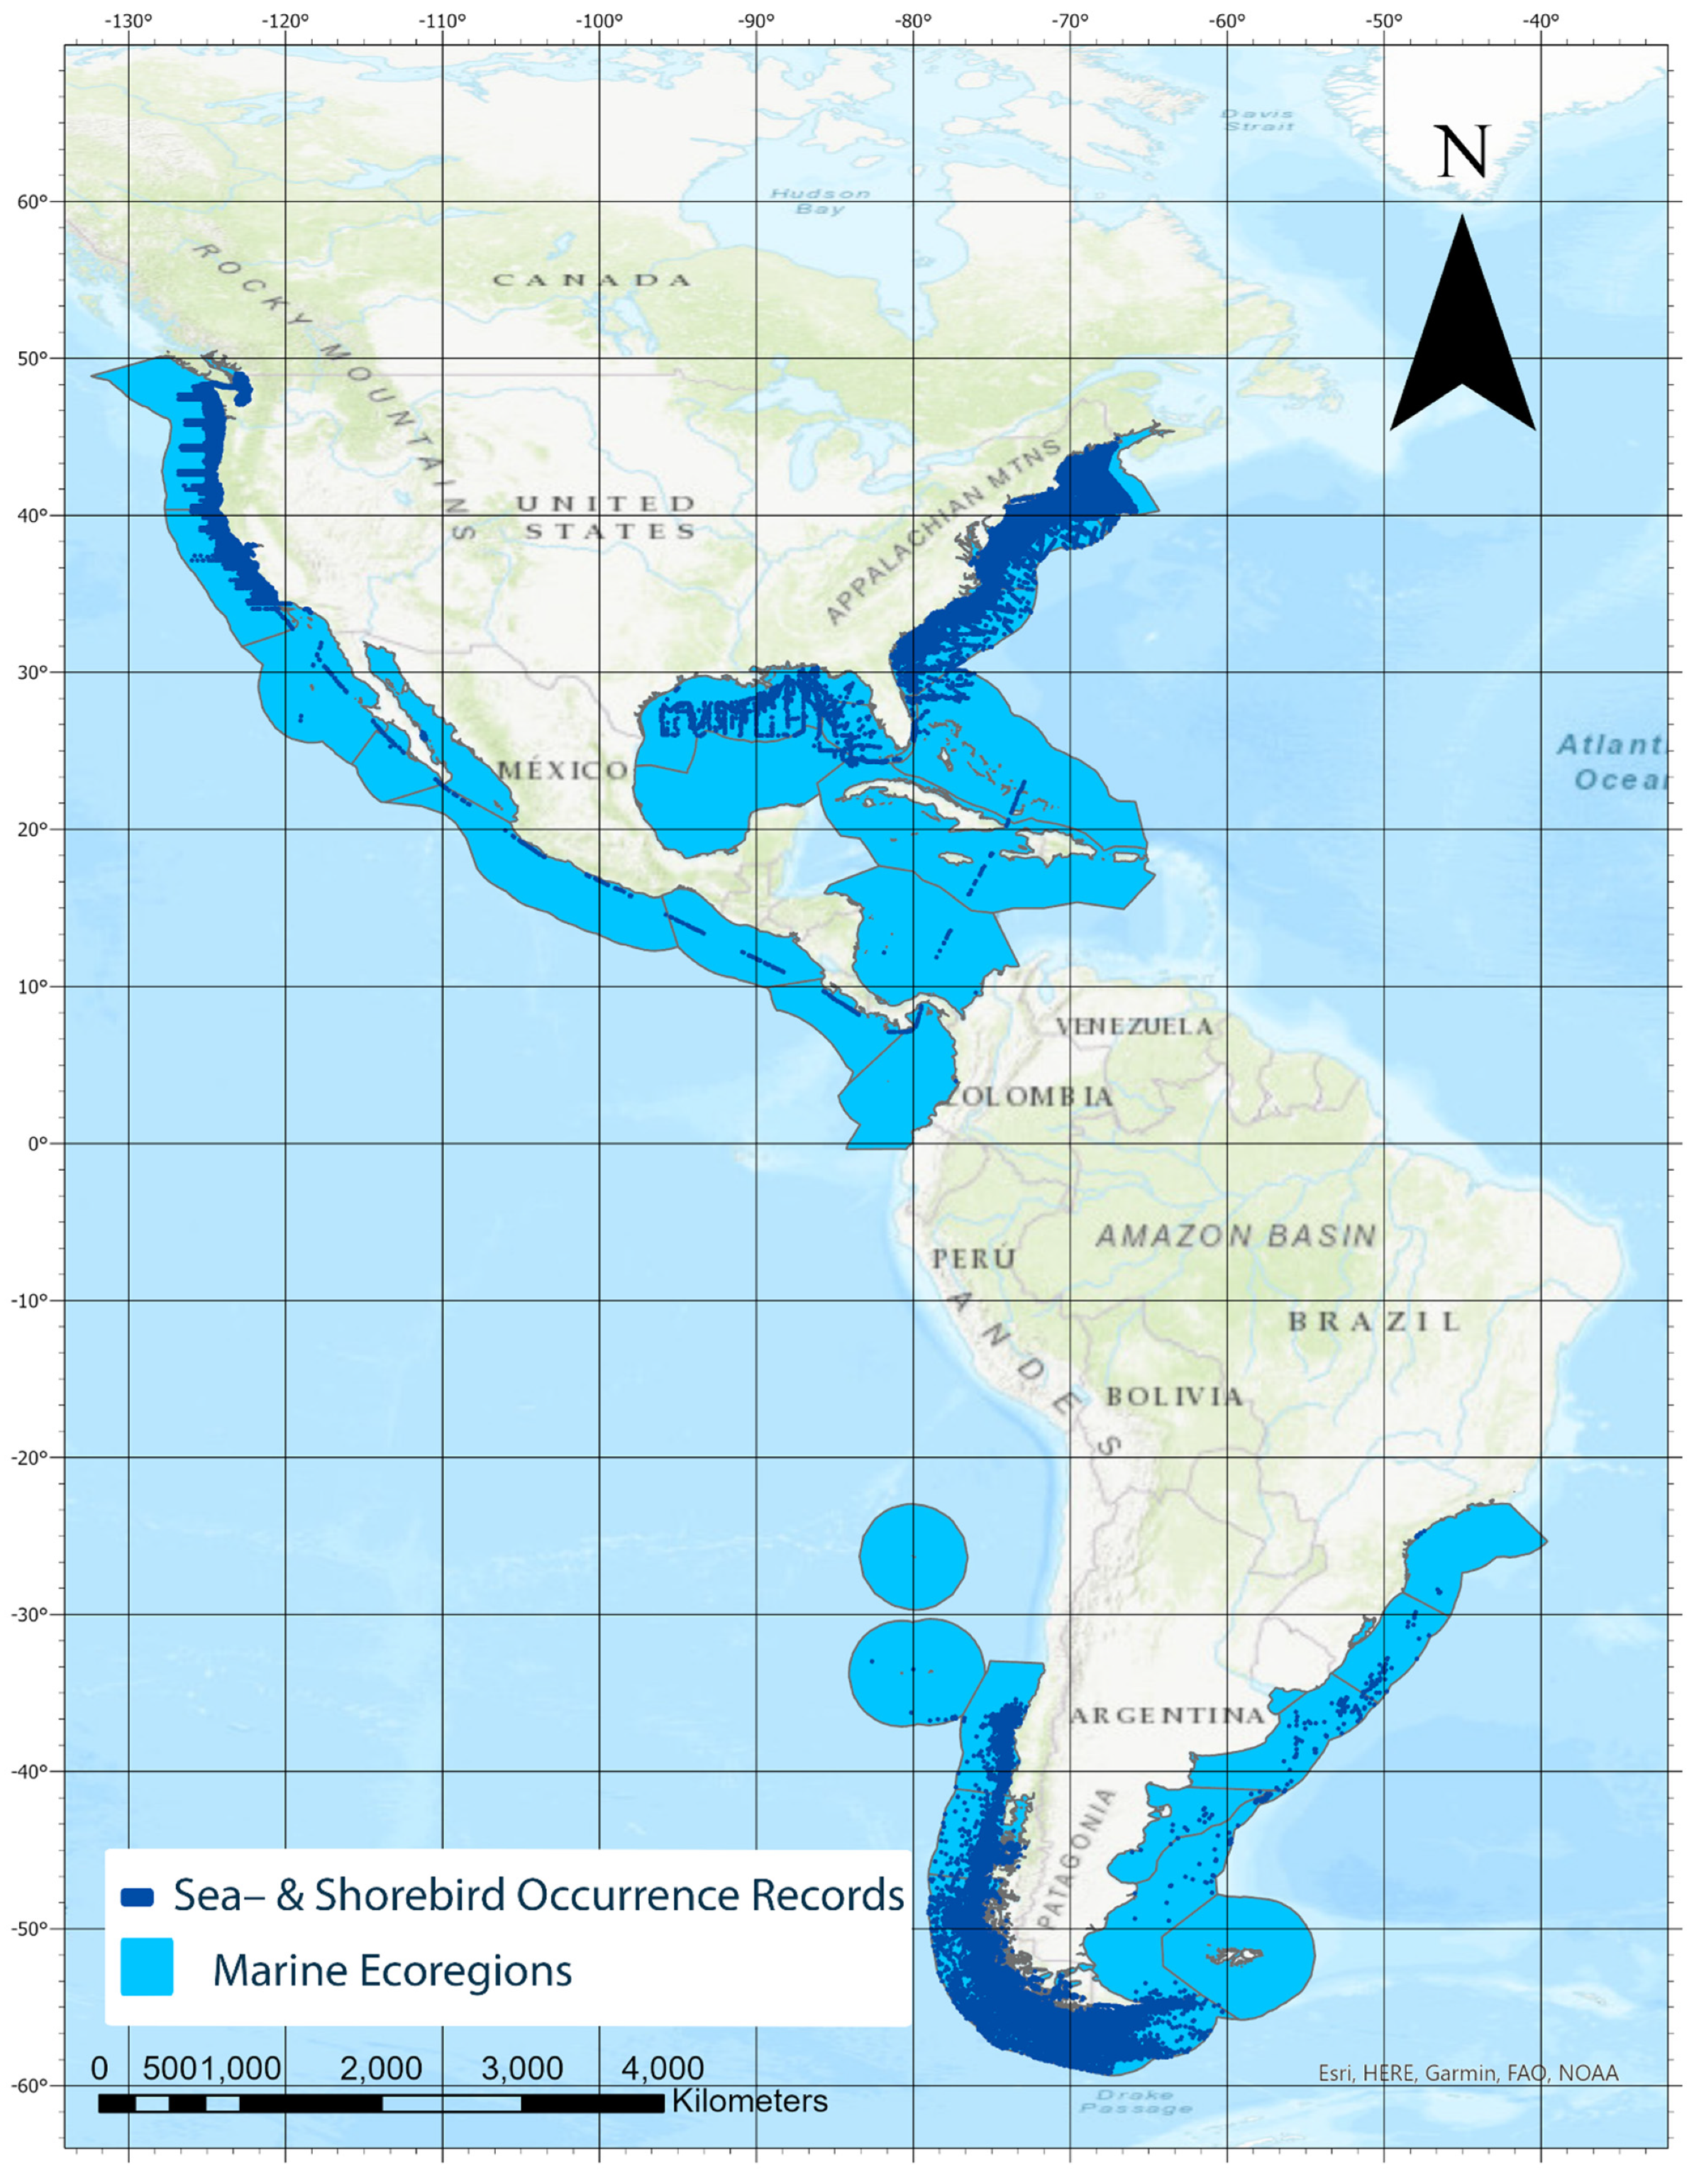
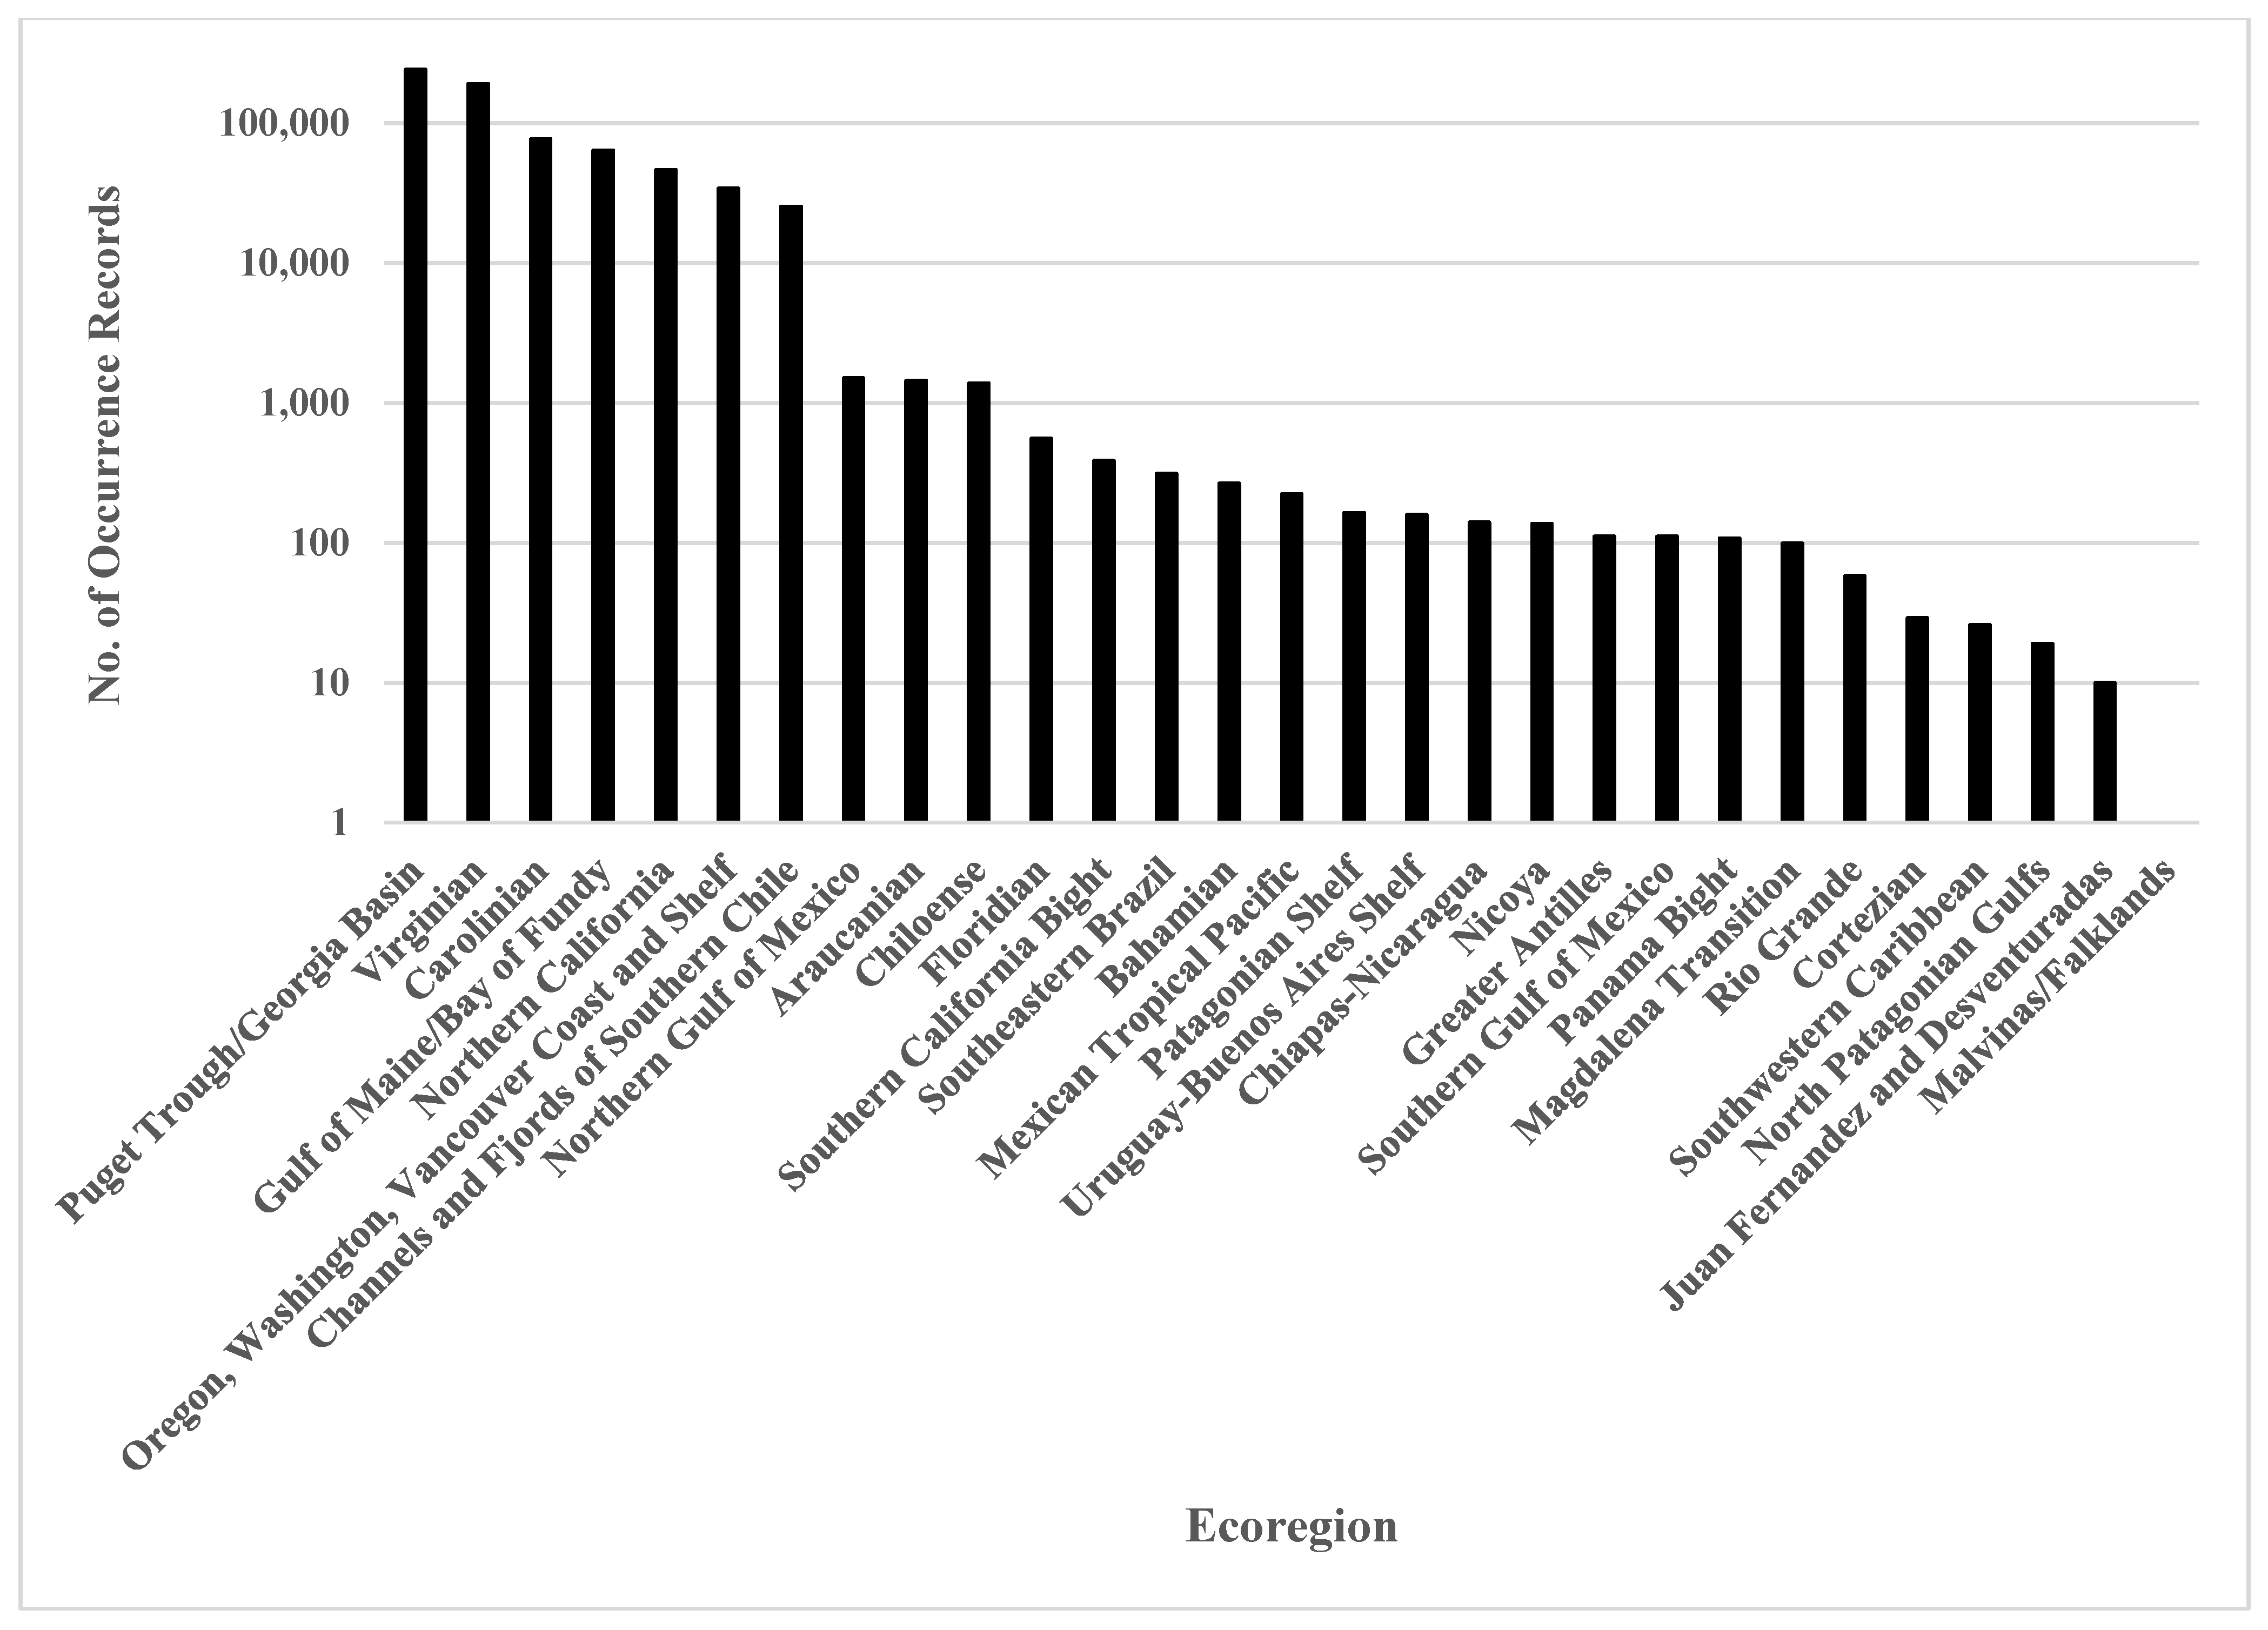
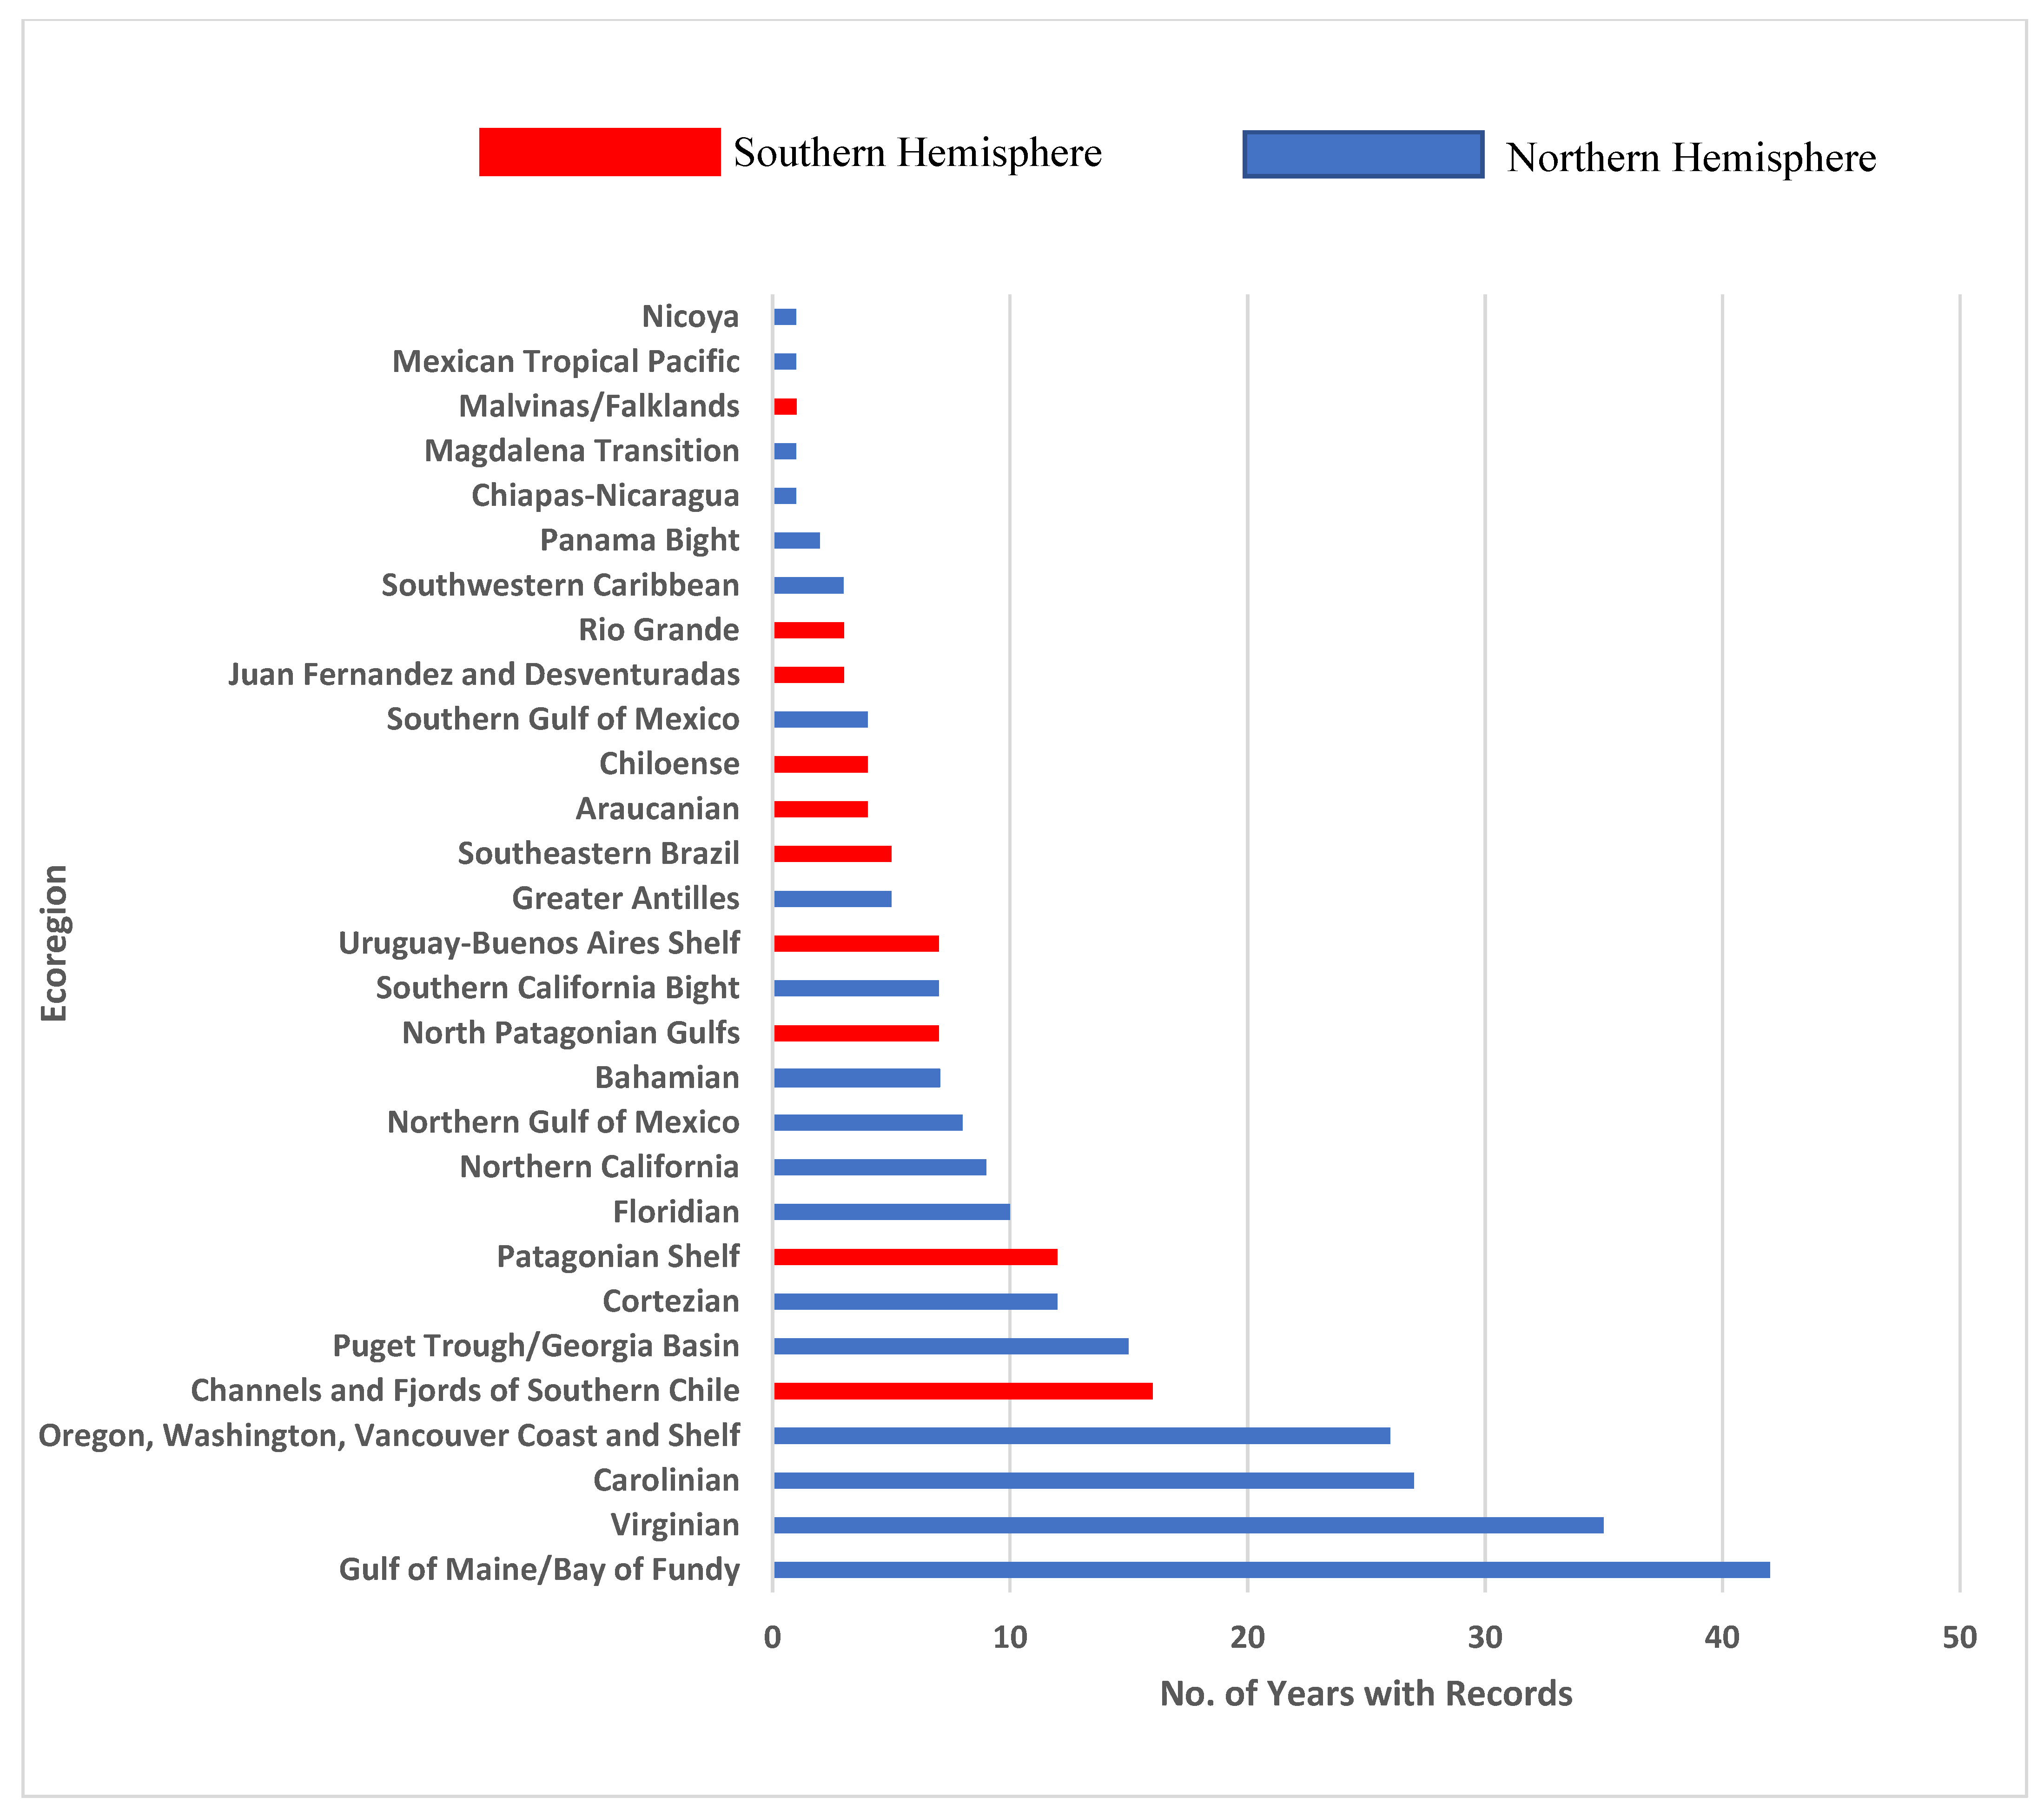
:The distributions of many sea- and shorebird species span large geographic areas, making them ideal candidates as biomonitors of ecosystem perturbations and long-term environmental trends. The basic question examined in this study was: Does a major open-access data archive contain sufficient temporal- and spatial-scale data to support more detailed inquiry into multi-decadal-scale responses in geographic distributions of specific taxa? The global-scale open-access data platform, Ocean Biodiversity Information System (OBIS), was searched to compile data on bird distributions of the Americas, including the Caribbean Sea. More than 680,000 occurrence records of 210 species, collected between 1965 and 2018, were located and evaluated by marine ecoregion. The Puget Trough/Georgia Basin marine ecoregion, along the United States/Canadian border, and the Virginian marine ecoregion on the US east coast, dominated occurrences, each with more than 100,000 records, while the Gulf of Maine/Bay of Fundy had the most years of records (42). Most records from South America (~29,000) came from the Channels and Fjords of Southern Chile, collected across 16 different years. More than 90% of the recorded data were collected since 1983, and more than 95% of the records were from North American marine ecoregions. We urge additional observations to be shared via OBIS to allow comprehensive large-scale and detailed meta-analyses of spatial and temporal trends in marine and shore-bird communities and their biodiversity.
1. Introduction
Sea and shorebird taxa are relatively well known, but their distributions and responses to environmental perturbations deserve further investigation. These taxa can serve as monitors of marine ecosystems because many species span large geographic ranges, inhabit different coastal and oceanic regimes, and feed on prey at various trophic levels. Changes in species occurrences and abundances, as well as changes in numbers and health of individuals within populations, can indicate changes in temperature, food supply, exposure to environmental contaminants, and other environmental and biological factors [1,2,3]. Sea- and shorebird populations are also widely-observed, making them ideal candidates to provide data on community composition and population distributions for biogeographic and macroecological analyses [4,5,6].
The Ocean Biodiversity Information System (OBIS) is a global, open-access data archive [7] that originated from the Census of Marine Life [8] and was adopted as a project of the Intergovernmental Oceanographic Data and Information Exchange of UNESCO. OBIS uses the Darwin Core Biodiversity Standard [9,10] to record observations related to individual species, including location, time of observation, and any other related measurements or facts. The system can also be used to document specimens and taxonomic information derived from museum collections, other taxonomic information (e.g., derived from genetic analyses, acoustics, imaging or other methods), and other historical observations documented in the literature. OBIS was established to provide access to historical and recently collected observations, all submissions require rigorous quality-control procedures that must be met prior to data being archived [7]. This platform ideally can be used in a multitude of ways, ranging from determining if an unusual observation is indeed unprecedented, to meta-data analyses of geographic distributions. Additionally, there are databases such as eBird [11] and the Seabird Tracking Database [12] which contain a multitude of seabird data; however, these databases, including OBIS, inevitably have gaps in coverage.
For this study, we examined records of sea- and shorebird occurrences in the Americas using data from the OBIS archive collected over the past ~50 years. The specific goals of this study were to (a) determine what bird-occurrence data are available in the major data platforms; (b) assess the available data with respect to when and where data were collected; and (c) document the challenges and need for additional data sharing to support research and enhance conservation actions.
2. Methods
Occurrence records for sea- and shorebirds were acquired from OBIS [7]. Records identified from latitudes 49°N–60°S within the EEZ of each country in the Americas and the Caribbean region were acquired from the OBIS platform on 7 August 2019. The overwhelming majority (~98%) of the records were based on field observations. Records based on preserved specimens were few in number and therefore excluded from further analyses, as were data from remote images that were analyzed using machine learning and artificial intelligence software. Data were quality controlled using [robis] and [obistools] from R programming (R version 4.0.2) [9]. Duplicates and organisms that were not identified to the species level were removed, as were species designated as purely terrestrial (<1% from OBIS data for North American EEZs). Occurrence records with a geographical coordinate located inland or seaward within 1 km of the coastline were also excluded from the analysis for standardization purposes.
Each OBIS record was standardized using coverage-based rarefaction. This method normalizes data across various datasets and allows for comparability [13]. Sampling effort could not be accounted for because numerous records did not discuss standardization methods a priori or include effort for post hoc standardization. The lead author attempted contact with collection agencies but was unsuccessful in obtaining necessary information. Data that were collected outside of a specific collection event, meaning they had no collection event identification or could not be identifiable as part of an overall project, were retained only for the analysis of South American data. If those had been excluded, there would be far fewer data available for much of South America. Data from North America were ultimately aggregated by collection event and then compared regionally, while data from South America were simply compared regionally due to sparce collection-event records. We used the detailed marine-ecoregions classification of Spalding et al. [14] to examine biogeographic distributions of OBIS records. Occurrence data were spatially joined with marine ecoregions using GIS [15]. Data collected in international waters (beyond 200 nm from a coast) were excluded from the analyses, resulting in the exclusion of approximately 2000 additional occurrence records.
3. Results
Seabird-occurrence records were found for 29 of 43 marine ecoregions of the Americas between 49° N and 60° S (Figure 1, Figure 2 and Figure 3). After screening, 685,454 bird-occurrence records were compiled from the OBIS (2019) database for the years 1965–2018 (Figure 2). No data were available for 1960–64, 1966–68, 1974, 1976, 1979, 2015, and 2016. In 1979–1982, ~20,000 records/year were found, then many fewer in the subsequent decade of 1983–1992. In 1993–2004 and 2008–10, 20,000–30,000 occurrence records were found per year. In 2018, nearly 100,000 records were entered into OBIS from the ‘U.S. Outer Continental Shelf Option Year 1’ and ‘Digital Aerial Baseline Survey of Marine Wildlife in Support of Offshore Wind Energy—OPA 2016 datasets’ [16,17].
The number of years when data were reported for individual ecoregions ranged from 0–42 (Figure 3). More than 20 years of data were available for only four ecoregions, all in North American waters. Considering the number of years and the 29 ecoregions for which data were found, North American ecoregions averaged 11 years (median 8 years) with documentation, while South American ecoregions averaged 6 years (median 4.5 years).
Approximately 96% of the occurrence records were from North America, as were ~83% (n = 47) of the documented collection events. The majority of South American records are attributed to one ecoregion, the high latitudes of the Channels and Fjords of Southern Chile. This ecoregion was the only South American marine ecoregion for which >10,000 occurrence records were found in the OBIS archive. In contrast, more than 100,000 occurrence records were acquired for each of two North American ecoregions, Puget Trough/Georgia Basin and Virginian Ecoregion. More than 10,000 records were available for each of four other North American ecoregions: Carolinian; Gulf of Maine/Bay of Fundy; Northern California; and the Oregon, Washington, Vancouver Coast and Shelf. More than 1000 records were found for only three additional ecoregions, the Northern Gulf of Mexico (NA), Araucanian and Chiloense (SA) ecoregions. Fewer than 1000 records were found for 18 remaining ecoregions (Figure 2), including those from Central America, the Caribbean, and South American coastlines outside of Chile. No records were found for 14 of the ecoregions in the Americas (Figure 1) [14].
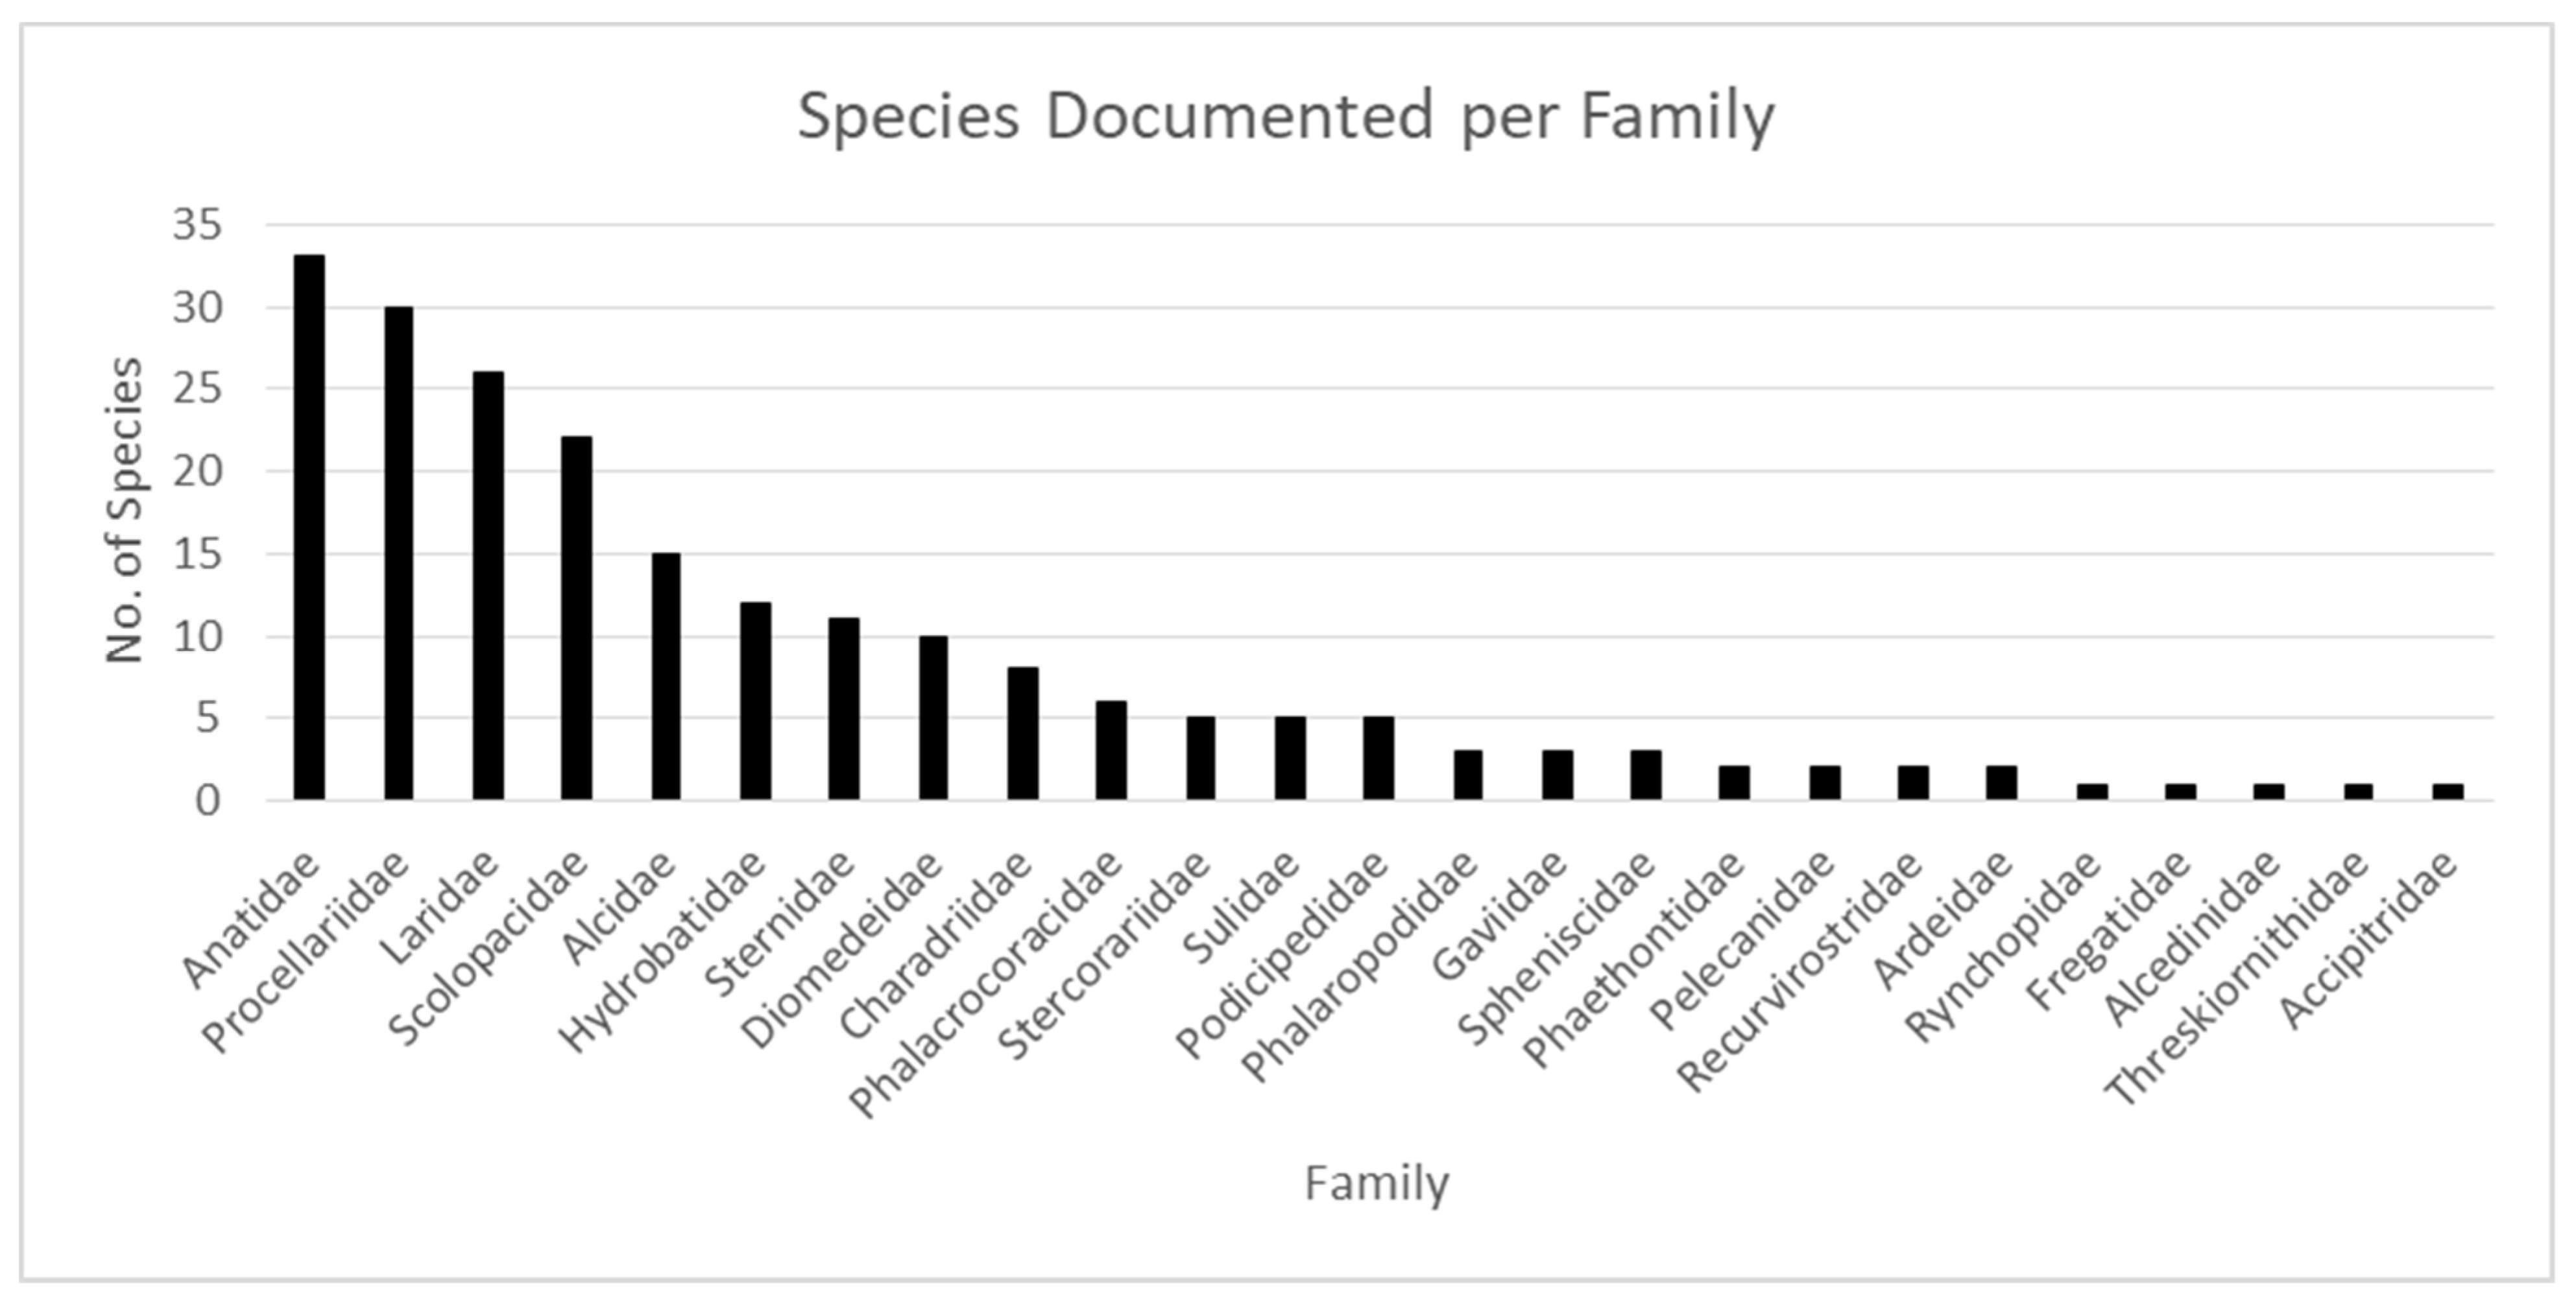
The dataset for sea- and shorebird occurrences included 210 species across 25 taxonomic families, primarily Anatidae, Procellariidae, Laridae, Scolopacidae, Alcidae, Hydrobatidae, Sternidae, and Diomedeidae (Table 1; Figure 4). More than 150,000 occurrence records were found for each of two families, the Anatidae (ducks and geese) and Laridae (gulls), accounting for 45% of the records. Supplementary Tables S1 and S2 show the five most abundant species per ecoregion and decade for which it was found. The most common species found for Anatidae were Melanitta fusca, Melanitta perspicillata, Mergus serattor, Melanitta nigra, and Somateria mollissima; Laridae species documented most frequently were Onychoprion fuscatus, Onychoprion anaethetus, Larus atricilla, Larus argentatus, and Rissa tridactyla. Between 10,000 and 100,000 records of occurrences of species from ten families were found, 100 to 1000 records were found for species in three families, with fewer than 100 occurrences recorded for five families.
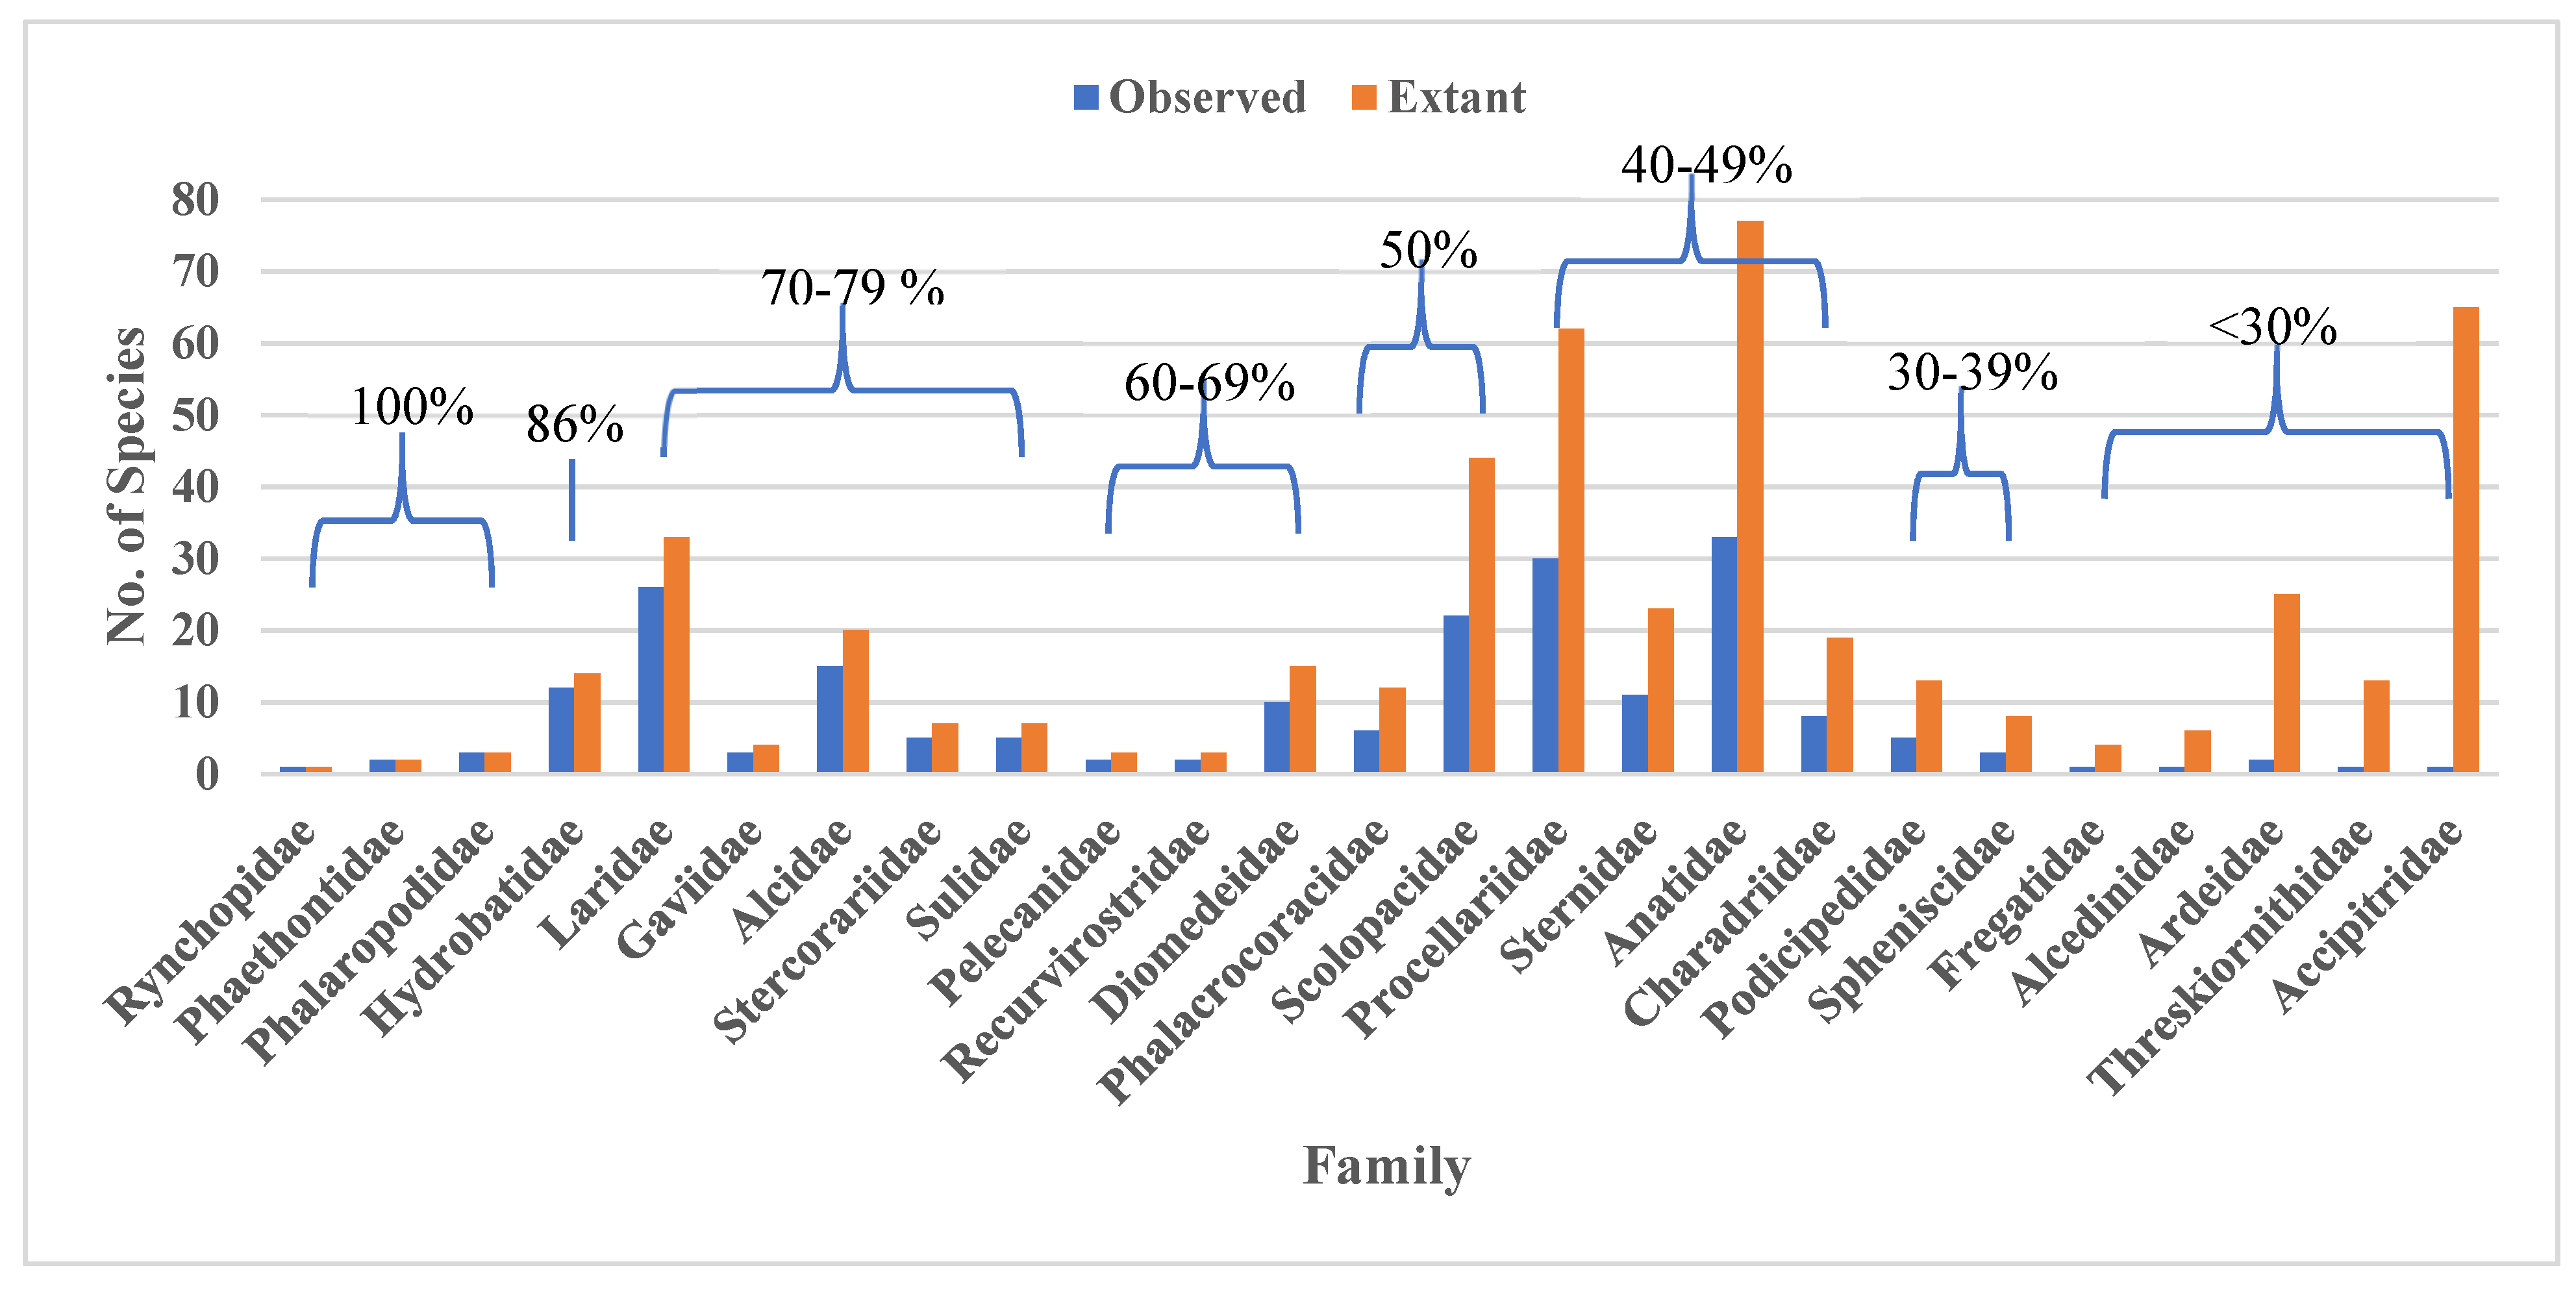
When the recorded families were compared to the number of observed species for each taxonomic group found in the Americas, all known species were recorded at least once for three families: Rynchopidae, Phaethontidae, and Phalaropidae (Figure 5). More than half the recognized species were recorded for an additional 11 families, while occurrences for the other 11 families included <50% of possible species (Figure 5), including one of the most abundant shorebird families, Charadriidae. Shorebird family Scolopacidae was documented at 50%. Families with fewer than 10 species tended to be documented at higher percentages (i.e., Rynchopidae, Phaethontidae, Phalaropidae, Gaviidae, Stercorariidae, Sulidae, Pelecanidae, and Recurvirostridae), though three such families had <30% of species documented (i.e., Spheniscidae, Fregatidae, and Alcedinidae, see Table 1).
The most widely recorded family was Procellariidae (petrels and shearwaters), which was documented in 24 of the 29 ecoregions for which data were found. The Hydrobatidae (northern storm petrels, 20 ecoregions) and Laridae (seagulls, 20), and Sternidae (terns, 17), were also widely recorded. Families whose species distributions were more restricted included the cold-water Alcidae (auks, murres, and puffins in 7 ecoregions) and Spheniscidae (penguins, 2). Families with species found in freshwater as well as marine environments, or that typically occur nearshore, included Anatidae and Gaviidae (ducks and geese, 6 species, and loons at 6), Podicipedidae (grebes, 5), Alcedinidae (kingfishers, 3), Recurvirostridae (stilts and avocets, 2), Rynchopidae (skimmers, 2), Threskiornithidae (ibises and spoonbills, 2), and Accipitridae (ospreys, 1) (Table 1).
In eleven South American ecoregions for which observations were recorded in OBIS [7], occurrence records for fewer than six families were found (Table 1), though all eleven ecoregions contained records for the family Diomedeidae (albatrosses). In contrast, in several North American ecoregions, the majority of species for each family were documented. Representatives of 63% of all avian families found in the study were recorded in the “Cold, Temperate Northeast Pacific” province, and more than half of the species of those families were recorded within the Puget Trough/Georgia Basin ecoregion. In the “Cold, Temperate Northwest Atlantic” province, representatives of 67% of the families were recorded the Gulf of Maine/Bay of Fundy ecoregion, 73% in the Virginian ecoregion and 81% in the Carolinian ecoregion.
4. Discussion
Sea- and shorebird occurrence records were found in OBIS for just over half of the marine ecoregions along the Americas and documented for 46 years. Almost half of the records were from Anatidae and Laridae families, but the Rynchopidae, Phaethontidae, and Phalaropodidae families were documented “completely”, meaning that 100% of the species in their families were documented. The Procellariidae family were documented in the most marine ecoregions (Table 1), while Laridae, in addition to Procellariidae, have the longest temporal record (Figure 6). The most abundant shorebird families, Scolopacidae and Charadriidae, are documented approximately half of the years of the study and seen over various marine ecoregions (Supplementary Table S3). Overall, the highest number of species recorded in the OBIS database has been recorded from the Puget Trough/Georgia Basin marine ecoregion (Figure 2).
OBIS is the “world’s largest scientific knowledge base on the diversity, distribution and abundance of marine organisms” and strives to provide “an integrated and standardized format” for data [42]. While there are other databases that could provide additional information, notably Global Biodiversity Information Facility, eBird, and the Seabird Tracking Database [8,11,12], authors decided to focus their search within OBIS as a brief foray into the realm of seabird records. Data from eBird is updated annually and made available through GBIF [43], and OBIS and GBIF share many similarities; however, OBIS uses the World Register of Marine Species as its taxonomic backbone, unlike GBIF. Additionally, OBIS requires geographic latitudes and longitudes of an organism’s occurrence to be reported and allows for researchers to input environmental data associated with the sampling events. GBIF data simply records occurrence. This sets OBIS up as a valuable platform for biogeographic study and complement to the eBird/GBIF databases. If data in future studies wish to focus on data outside of the marine ecoregions, the addition of the omitted OBIS records in conjunction with the Seabird Tracking Database could be invaluable.
Our results demonstrate the need for more data to be provided to OBIS, especially from ecoregions in the Caribbean, and Central and South America. This assessment is consistent with previous analyses of data available for other marine organisms that were based on OBIS data [44,45,46,47,48,49,50,51]. The majority of previous bird studies focused on a limited number of species or dealt extensively with terrestrial taxa [52,53,54,55]. We found that sea- and shorebird data available from OBIS are relatively sparse in many ecoregions, and both spatially and temporally fragmented. This reveals a vast need and an opportunity for data collection and archiving, to provide additional contributions that can improve the applicability of sea- and shorebird observations to address changes in coastal and marine environments.
Our study was originally designed to focus on seabirds, accounting for decision to exclude data recorded within 1 km of the coastline. However, when Anatidae (ducks and geese) and Laridae (gulls) accounted for 45% of the records, and many other families include taxa that utilize or migrate through a range of terrestrial and marine habitats (Table 1), we included shorebirds in our analyses. The five primarily pelagic families, and the three families with pelagic representatives, represent ~32% of the species records and more than 10,000 records were found for six of those eight families. Thus, our results do provide a substantial dataset for primarily pelagic species.
Many observations and data archives have been lost or forgotten [56,57]; therefore, it is important to share data via standardized and open databases, like OBIS, before data collection effort is wasted. If FAIR (i.e., Findable, Accessible, Interoperable, and Reusable) data principles are utilized in future, automated data input/collection and management can facilitate meta-data analyses and other reuse by individuals, agencies, and others [58]. Ideally, all collected data should be included in standardized biodiversity databases [59]. Building institutional and professional capacity is critical for providing data to specific open-access databases, such as OBIS.
Croxall et al. [60] noted that the total number of seabird species recorded within EEZ waters represents a key area of interest for ecological studies and for resource management. The data collected from EEZs can be used to specify goals for interregional collaboration and to designate mainland jurisdiction for conservation purposes. With the exception of the Channels and Fjords of Southern Chile Ecoregion, OBIS data from marine ecoregions in the Caribbean Sea and Central and South America are too sparse for detailed analyses. In contrast, OBIS data from marine ecoregions along the United States coastline can provide a sources of information for establishing conservation goals, especially considering the Puget Trough/Georgia Basin, Gulf of Maine Bay of Fundy, and Virginian marine ecoregions. While seabird species are found outside of EEZs, data from the high seas were excluded from this analysis, because they could complicate the interpretation of data used for country stewardship, since no country has sole responsibility for the management of those areas. While there is fragmented governance of international waters, there is a fluidity when it comes to environmental protection and management.
Families Fregatidae, Alcedinidae, and Threskiornithidae had the lowest percentages of species documented in the OBIS database. These include many species found along the coastlines of Central and South America [25,30,31]. Similarly, other families within the Americas with relatively few extant species, such as Spheniscidae, were poorly documented. The lack of documented studies on these taxa, specifically among tropical species, leads to the low percentages of species documented compared to better known temperate and boreal species.
Previous studies have observed higher avifaunal diversity along the equator compared to higher latitudes [54,61,62,63,64,65,66]. In contrast, Chown et al. [67] reported that pelagic seabird orders, such as Procellariiformes, have greater species richness at higher latitudes. Chown et al. [67] attributed this diversity to location along fishing routes and availability of prey from these anthropogenic interactions with the environment. Additional seabird studies from equatorial ecoregions may help address these questions. We recommend that any such studies share data via OBIS.
The abundance of occurrence records submitted to OBIS, as well as the diverse assemblages of recognized sea- and shorebird taxa, indicate that population-distribution analyses may be conducted for the Gulf of Maine/Bay of Fundy, and Oregon, Washington, Vancouver Coast and Shelf marine ecoregions. Data for other ecoregions were too limited for meaningful meta-analyses as of 2019.
5. Conclusions
- The OBIS platform can provide baseline data for sea- and shorebird distributions in future studies for several North American marine ecoregions.
- More observations, especially from Central and South American ecoregions and from the Caribbean Sea, should be shared via open-access databases like OBIS for monitoring and ecological analyses within and across those marine ecoregions.
- Capacity development focused on best practices for seabird and environmental observations, including standardized meta-data formatting and sharing of observations via open databases like OBIS is important to improve the scientific understanding of sea- and shorebirds, as well as providing opportunities for scientists to contribute to the growth and well-being of open-access data initiatives.
Supplementary Materials
Please confirm if the following supporting information can be downloaded at: https://www.mdpi.com/article/10.3390/d14121099/s1, Table S1: Anatidae species documented per marine ecoregion per decade; Table S2: Laridae species documented per marine ecoregion per decade; Table S3: Shorebird families Scolopacidae and Charadriidae and the marine ecoregions in which they were documented
Author Contributions
Conceptualization; Investigation; Data curation; Validation; Writing—review and editing, S.H., P.H. and F.M.-K.; Formal analysis, Savannah Hartman; Funding acquisition, F.M.-K.; Methodology, S.H.; Project administration, F.M.-K.; Software, S.H.; Supervision, P.H. and F.M.-K.; Visualization, S.H. and P.H.; Writing—original draft, S.H. All authors have read and agreed to the published version of the manuscript.
Funding
This research was funded by: the National Oceanic and Atmospheric Administration: NA19NOS0120199; National Oceanic and Atmospheric Administration and Gulf of Mexico Coastal Ocean Observing System Cooperative Agreement #NA16NOS0120018; National Aeronautics and Space Administration: NNX14AP62A, 80NSSC20K0017, and 80NSSC22K1779; Alfred P. Sloan Foundation University Center of Exemplary Mentoring (UCEM) award: G-2017-9717.
Institutional Review Board Statement
Not applicable.
Data Availability Statement
Occurrence records publicly available on OBIS. Computer code necessary to reproduce this work can be found on the lead author’s Github: (https://github.com/hart2/AvesOBIS (last accessed on 9 December 2022).
Acknowledgments
Florida Education Fund’s McKnight Doctoral Fellowship provided support to S.H. Authors wish to acknowledge intellectual contributions from the Institution of Marine Remote Sensing at the University of South Florida’s College of Marine Science, and we appreciate the support provided by the Ocean Biodiversity Information System (OBIS) in accessing the observations used in this study. This manuscript is also a contribution to the Marine Biodiversity Observation Network (MBON) of the Group on Earth Observations Biodiversity Observation Network. Support for S.H. and F.M.-K. was provided by the US Integrated Ocean Observing System (IOOS) Program Office (NOAA grant numbers NA19NOS0120199 and NA16NOS0120018), NASA (grants NNX14AP62A, 80NSSC20K0017, and 80NSSC22K1779), and Alfred P. Sloan Foundation University Center of Exemplary Mentoring (UCEM) award: G-2017-9717.
Conflicts of Interest
The authors declare no conflict of interest.
Biosketch
Savannah Hartman is a Ph.D. candidate at the Institute of Marine Remote Sensing (IMaRS), College of Marine Science, University of South Florida, USA. Her current research focuses on marine biodiversity, specifically biogeography and its connection to climate change using species distribution modelling.
References
- Dunnet, G.M.; Crisp, D.J.; Conan, G.; Bourne, W.R.P. Oil pollution and seabird populations. Philos. Trans. R. Soc. B Biol. Sci. 1982, 297, 413–427. [Google Scholar] [CrossRef]
- Valle, C.A.; Cruz, F.; Cruz, J.B.; Merlen, G.; Coulter, M.C. The impact of the 1982–1983 El-Nino-Southern Oscillation on seabirds in the Galapagos-Islands, Equador. J. Geophys. Res.-Oceans 1987, 92, 14437–14444. [Google Scholar] [CrossRef]
- Martini, R.; Mangini, P.R.; Lange, R.R. Seabirds health and conservation medicine in Brazil. J. Nat. Cons. 2022, 69, 126238. [Google Scholar] [CrossRef]
- Hortal, J.; de Bello, F.; Diniz-Filho, J.A.F.; Lewinsohn, T.M.; Lobo, J.M.; Ladle, R.J. Seven shortfalls that beset large-scale knowledge of biodiversity. Annu. Rev. Ecol. Evol. Syst. 2015, 46, 523–549. [Google Scholar] [CrossRef] [Green Version]
- Orgeret, F.; Thiebault, A.; Kovacs, K.M.; Lydersen, C.; Hindell, M.A.; Thompson, S.A.; Sydeman, W.J.; Pistorius, P.A. Climate change impacts on seabirds and marine mammals: The importance of study duration, thermal tolerance and generation time. Ecol. Lett. 2022, 25, 218–239. [Google Scholar] [CrossRef]
- Morera-Pujol, V.; Catry, P.; Magalhães, M.; Péron, C.; Reyes-González, J.M.; Granadeiro, J.P.; Militão, T.; Dias, M.P.; Oro, D.; Dell’Omo, G.; et al. Methods to detect spatial biases in tracking studies caused by differential representativeness of individuals, populations and time. Divers. Distrib. 2022, 00, 1–20. [Google Scholar] [CrossRef]
- Ocean Biogeographic Information System (OBIS). Intergovernmental Oceanographic Commission of UNESCO. Available online: https://obis.org (accessed on 23 October 2022).
- Grassle, J.F. The Ocean Biogeographic Information System (OBIS): An on-line, worldwide atlas for accessing, modeling and mapping marine biological data in a multidimensional geographic context. Oceanography 2000, 13, 5–7. [Google Scholar] [CrossRef]
- Provoost, P.; Appeltans, W.; Lambert, A. OBIS Github. Available online: https://github.com/iobis (accessed on 1 October 2021).
- Wieczorek, J.; Bloom, D.; Guralnick, R.; Blum, S.; Döring, M.; Giovanni, R.; Robertson, T.; Vieglais, D. Darwin Core: An evolving community-developed biodiversity data standard. PLoS ONE 2012, 7, e29715. [Google Scholar] [CrossRef] [Green Version]
- eBird: An Online Database of Bird Distribution and Abundance [Web Application]. eBird, Cornell Lab of Ornithology, Ithaca, New York. Available online: http://www.ebird.org (accessed on 24 November 2022).
- Seabird Tracking Database. BirdLife International. Available online: http://www.seabirdtracking.org (accessed on 27 November 2022).
- Chao, A.; Jost, L. Coverage-based rarefaction and extrapolation: Standardizing samples by completeness rather than size. Ecology 2012, 93, 2533–2547. [Google Scholar] [CrossRef]
- Spalding, M.D.; Fox, H.E.; Allen, G.R.; Davidson, N.; Ferdaña, Z.A.; Finlayson, M.; Halpern, B.S.; Jorge, M.A.; Lombana, A.; Lourie, S.A.; et al. Marine ecoregions of the world: A bioregionalization of coastal and shelf areas. BioScience 2007, 57, 573–583. [Google Scholar] [CrossRef]
- Price, M.H. Mastering ArcGIS Pro, 1st ed.; McGraw-Hill Education: New York, NY, USA, 2020; ISBN 978-1-260-58733-3. [Google Scholar]
- Digital Aerial Baseline Survey of Marine Wildlife in Support of Offshore Wind Energy—OPA 2016. Available online: http://seamap.env.duke.edu/dataset/1817 (accessed on 27 October 2022).
- OBIS-SEAMAP: The World Data Center for Marine Mammal, Seabird, Sea Turtle, Shark & Ray Distributions. Available online: https://seamap.env.duke.edu/ (accessed on 27 October 2022).
- PIROP Northwest Pacific 1965–1992. Available online: https://seamap.env.duke.edu/dataset/280 (accessed on 1 December 2022).
- SEFSC Caribbean Survey 1995 Dataset. Available online: https://seamap.env.duke.edu/dataset/11 (accessed on 1 December 2022).
- Tracy, D.M.; Schamel, D.; Dale, J. Red Phalarope (Phalaropus Fulicarius), Version 1.0. In Birds of the World; Billerman, S.M., Keeney, B.K., Rodewald, P.G., Schulenberg, T.S., Eds.; Cornell Lab of Ornithology: Ithaca, NY, USA, 2020. [Google Scholar]
- Winkler, D.W.; Billerman, S.M.; Lovette, I.J. Albatrosses (Diomedeidae), Version 1.0. In Birds of the World; Billerman, S.M., Keeney, B.K., Rodewald, P.G., Schulenberg, T.S., Eds.; Cornell Lab of Ornithology: Ithaca, NY, USA, 2020. [Google Scholar]
- Winkler, D.W.; Billerman, S.M.; Lovette, I.J. Auks, Murres, and Puffins (Alcidae), Version 1.0. In Birds of the World; Billerman, S.M., Keeney, B.K., Rodewald, P.G., Schulenberg, T.S., Eds.; Cornell Lab of Ornithology: Ithaca, NY, USA, 2020. [Google Scholar]
- Winkler, D.W.; Billerman, S.M.; Lovette, I.J. Cormorants and Shags (Phalacrocoracidae), Version 1.0. In Birds of the World; Billerman, S.M., Keeney, B.K., Rodewald, P.G., Schulenberg, T.S., Eds.; Cornell Lab of Ornithology: Ithaca, NY, USA, 2020. [Google Scholar]
- Winkler, D.W.; Billerman, S.M.; Lovette, I.J. Ducks, Geese, and Waterfowl (Anatidae), Version 1.0. In Birds of the World; Billerman, S.M., Keeney, B.K., Rodewald, P.G., Schulenberg, T.S., Eds.; Cornell Lab of Ornithology: Ithaca, NY, USA, 2020. [Google Scholar]
- Winkler, D.W.; Billerman, S.M.; Lovette, I.J. Frigatebirds (Fregatidae), Version 1.0. In Birds of the World; Billerman, S.M., Keeney, B.K., Rodewald, P.G., Schulenberg, T.S., Eds.; Cornell Lab of Ornithology: Ithaca, NY, USA, 2020. [Google Scholar]
- Winkler, D.W.; Billerman, S.M.; Lovette, I.J. Grebes (Podicipedidae), Version 1.0. In Birds of the World; Billerman, S.M., Keeney, B.K., Rodewald, P.G., Schulenberg, T.S., Eds.; Cornell Lab of Ornithology: Ithaca, NY, USA, 2020. [Google Scholar]
- Winkler, D.W.; Billerman, S.M.; Lovette, I.J. Gulls, Terns, and Skimmers (Laridae), Version 1.0. In Birds of the World; Billerman, S.M., Keeney, B.K., Rodewald, P.G., Schulenberg, T.S., Eds.; Cornell Lab of Ornithology: Ithaca, NY, USA, 2020. [Google Scholar]
- Winkler, D.W.; Billerman, S.M.; Lovette, I.J. Hawks, Eagles, and Kites (Accipitridae), Version 1.0. In Birds of the World; Billerman, S.M., Keeney, B.K., Rodewald, P.G., Schulenberg, T.S., Eds.; Cornell Lab of Ornithology: Ithaca, NY, USA, 2020. [Google Scholar]
- Winkler, D.W.; Billerman, S.M.; Lovette, I.J. Herons, Egrets, and Bitterns (Ardeidae), Version 1.0. In Birds of the World; Billerman, S.M., Keeney, B.K., Rodewald, P.G., Schulenberg, T.S., Eds.; Cornell Lab of Ornithology: Ithaca, NY, USA, 2020. [Google Scholar]
- Winkler, D.W.; Billerman, S.M.; Lovette, I.J. Ibises and Spoonbills (Threskiornithidae), Version 1.0. In Birds of the World; Billerman, S.M., Keeney, B.K., Rodewald, P.G., Schulenberg, T.S., Eds.; Cornell Lab of Ornithology: Ithaca, NY, USA, 2020. [Google Scholar]
- Winkler, D.W.; Billerman, S.M.; Lovette, I.J. Kingfishers (Alcedinidae), Version 1.0. In Birds of the World; Billerman, S.M., Keeney, B.K., Rodewald, P.G., Schulenberg, T.S., Eds.; Cornell Lab of Ornithology: Ithaca, NY, USA, 2020. [Google Scholar]
- Winkler, D.W.; Billerman, S.M.; Lovette, I.J. Loons (Gaviidae), Version 1.0. In Birds of the World; Billerman, S.M., Keeney, B.K., Rodewald, P.G., Schulenberg, T.S., Eds.; Cornell Lab of Ornithology: Ithaca, NY, USA, 2020. [Google Scholar]
- Winkler, D.W.; Billerman, S.M.; Lovette, I.J. Northern Storm-Petrels (Hydrobatidae), Version 1.0. In Birds of the World; Billerman, S.M., Keeney, B.K., Rodewald, P.G., Schulenberg, T.S., Eds.; Cornell Lab of Ornithology: Ithaca, NY, USA, 2020. [Google Scholar]
- Winkler, D.W.; Billerman, S.M.; Lovette, I.J. Pelicans (Pelecanidae), Version 1.0. In Birds of the World; Billerman, S.M., Keeney, B.K., Rodewald, P.G., Schulenberg, T.S., Eds.; Cornell Lab of Ornithology: Ithaca, NY, USA, 2020. [Google Scholar]
- Winkler, D.W.; Billerman, S.M.; Lovette, I.J. Penguins (Spheniscidae), Version 1.0. In Birds of the World; Billerman, S.M., Keeney, B.K., Rodewald, P.G., Schulenberg, T.S., Eds.; Cornell Lab of Ornithology: Ithaca, NY, USA, 2020. [Google Scholar]
- Winkler, D.W.; Billerman, S.M.; Lovette, I.J. Plovers and Lapwings (Charadriidae), Version 1.0. In Birds of the World; Billerman, S.M., Keeney, B.K., Rodewald, P.G., Schulenberg, T.S., Eds.; Cornell Lab of Ornithology: Ithaca, NY, USA, 2020. [Google Scholar]
- Winkler, D.W.; Billerman, S.M.; Lovette, I.J. Sandpipers and Allies (Scolopacidae), Version 1.0. In Birds of the World; Billerman, S.M., Keeney, B.K., Rodewald, P.G., Schulenberg, T.S., Eds.; Cornell Lab of Ornithology: Ithaca, NY, USA, 2020. [Google Scholar]
- Winkler, D.W.; Billerman, S.M.; Lovette, I.J. Shearwaters and Petrels (Procellariidae), Version 1.0. In Birds of the World; Billerman, S.M., Keeney, B.K., Rodewald, P.G., Schulenberg, T.S., Eds.; Cornell Lab of Ornithology: Ithaca, NY, USA, 2020. [Google Scholar]
- Winkler, D.W.; Billerman, S.M.; Lovette, I.J. Stilts and Avocets (Recurvirostridae), Version 1.0. In Birds of the World; Billerman, S.M., Keeney, B.K., Rodewald, P.G., Schulenberg, T.S., Eds.; Cornell Lab of Ornithology: Ithaca, NY, USA, 2020. [Google Scholar]
- Winkler, D.W.; Billerman, S.M.; Lovette, I.J. Tropicbirds (Phaethontidae), Version 1.0. In Birds of the World; Billerman, S.M., Keeney, B.K., Rodewald, P.G., Sculenberg, T.S., Eds.; Cornell Lab of Ornithology: Ithaca, NY, USA, 2020. [Google Scholar]
- Cornell Lab of Ornithology, Birds of the World. Available online: https://birdsoftheworld.org/bow/home (accessed on 1 October 2021).
- About OBIS. Available online: https://obis.org/about/ (accessed on 27 October 2022).
- Auer, T.; Barker, S.; Borgmann, K.; Charnoky, M.; Childs, D.; Curtis, J.; Davies, I.; Downie, I.; Fink, D.; Fredericks, T.; et al. EOD—EBird Observation Dataset; Cornell Lab of Ornithology: Ithaca, NY, USA, 2022. [Google Scholar] [CrossRef]
- Boakes, E.H.; McGowan, P.J.K.; Fuller, R.A.; Chang-Qing, D.; Clark, N.E.; O’Connor, K.; Mace, G.M. Distorted views of biodiversity: Spatial and temporal bias in species occurrence data. PLOS Biol. 2010, 8, e1000385. [Google Scholar] [CrossRef] [PubMed]
- Kot, C.Y.; Fujioka, E.; Hazen, L.J.; Best, B.D.; Read, A.J.; Halpin, P.N. Spatio-temporal gap analysis of OBIS-SEAMAP project data: Assessment and way forward. PLoS ONE 2010, 5, e12990. [Google Scholar] [CrossRef] [PubMed]
- Leles, S.G.; Mitra, A.; Flynn, K.J.; Tillmann, U.; Stoecker, D.; Jeong, H.J.; Burkholder, J.; Hansen, P.J.; Caron, D.A.; Gilbert, P.M.; et al. Sampling bias misrepresents the biogeographical significance of constitutive mixotrophs across global oceans. Glob. Ecol. Biogeogr. 2019, 28, 418–428. [Google Scholar] [CrossRef]
- Pardo, I.; Pata, M.P.; Gómez, D.; García, M.B. A novel method to handle the effect of uneven sampling effort in biodiversity databases. PLoS ONE 2013, 8, e52786. [Google Scholar] [CrossRef] [Green Version]
- Ruete, A. Displaying bias in sampling effort of data accessed from biodiversity databases using ignorance maps. Biodivers. Data J. 2015, 3, e5361. [Google Scholar] [CrossRef] [PubMed]
- Munira, A.N.; Nurul Salmi, A.L.; Shahrul Anuar, M.S.; Mohd Abdul Muin, M.A.; Amirrudin, A.; Juliani, S. Nur. Diversity and temporal distribution of birds in rice-growing landscape, northern peninsular Malaysia. Sains Malays. 2014, 43, 513–520. [Google Scholar]
- Dias, M.P.; Oppel, S.; Bond, A.L.; Carneiro, A.P.B.; Cuthbert, R.J.; González-Solís, J.; Wanless, R.M.; Glass, T.; Lascelles, B.; Small, C.; et al. Using globally threatened pelagic birds to identify priority sites for marine conservation in the South Atlantic Ocean. Biol. Conserv. 2017, 211, 76–84. [Google Scholar] [CrossRef]
- Hyrenbach, K.D.; Veit, R.R.; Weimerskirch, H.; Metzl, N.; Hunt, G.L. Community structure across a large-scale ocean productivity gradient: Marine bird assemblages of the southern Indian Ocean. Deep-Sea Res. Part I Oceanogr. Res. Pap. 2007, 54, 1129–1145. [Google Scholar] [CrossRef] [Green Version]
- Perry, J.; Kutt, A.; Perkins, G.; Vanderduys, E.; Colman, N. A bird survey method for Australian tropical savannas. Emu-Austral Ornithol. 2012, 112, 261–266. [Google Scholar] [CrossRef]
- Powers, K. Pelagic distributions of marine birds off the northeastern United States. In NOAA Technical Memorandum; NMFS-F/NEC-27; NOAA: Washington, DC, USA, 1983; pp. 1–201. [Google Scholar]
- Brunet, M.; Jones, P. Data rescue initiatives: Bringing historical climate data into the 21st century. Clim. Res. 2011, 47, 29–40. [Google Scholar] [CrossRef]
- Hawkins, B.A.; Diniz-Filho, J.A.F.; Jaramillo, C.A.; Soeller, S.A. Climate, niche conservatism, and the global bird diversity gradient. Am. Nat. 2007, 170, S16–S27. [Google Scholar] [CrossRef] [PubMed]
- Oro, D. Seabirds and climate: Knowledge, pitfalls, and opportunities. Front. Ecol. Evol. 2014, 2, 79. [Google Scholar] [CrossRef] [Green Version]
- Knockaert, C.; Tyberghein, L.; Goffin, A.; Vanhaecke, D.; Ong’anda, H.; Wakwabi, E.O.; Mees, J. Biodiversity data rescue in the framework of a long-term Kenya-Belgium cooperation in marine sciences. Sci. Data 2019, 6, 85. [Google Scholar] [CrossRef] [PubMed] [Green Version]
- Walker, D.; Nost, E.; Lemelin, A.; Lave, R.; Dillon, L. Practicing environmental data justice: From DataRescue to Data Together. Geo. Geogr. Environ. 2018, 5, e00061. [Google Scholar] [CrossRef]
- Wilkinson, M.D.; Dumontier, M.; Aalbersberg, I.J.; Appleton, G.; Axton, M.; Baak, A.; Blomberg, N.; Boiten, J.; da Silva Santos, L.B.; Bourne, P.E.; et al. The FAIR Guiding Principles for scientific data management and stewardship. Sci. Data 2016, 3, 160018. [Google Scholar] [CrossRef] [PubMed] [Green Version]
- Bayraktarov, E.; Ehmke, G.; O’Connor, J.; Burns, E.L.; Nguyen, H.A.; McRae, L.; Possingham, H.P.; Lindenmayer, D.B. Do big unstructured biodiversity data mean more knowledge? Front. Ecol. Evol. 2019, 6, 239. [Google Scholar] [CrossRef] [Green Version]
- Croxall, J.P.; Butchart, S.H.M.; Lascelles, B.; Stattersfield, A.J.; Sullivan, B.; Symes, A.; Taylor, P. Seabird conservation status, threats and priority actions: A global assessment. Bird Conserv. Int. 2012, 22, 1–34. [Google Scholar] [CrossRef] [Green Version]
- Gaston, K.J. Global patterns in biodiversity. Nature 2000, 405, 220–227. [Google Scholar] [CrossRef]
- Jablonski, D. The tropics as a source of evolutionary novelty through geological time. Nature 1993, 364, 142–144. [Google Scholar] [CrossRef]
- Jablonski, D.; Roy, K.; Valentine, J.W. Out of the tropics: Evolutionary dynamics of the latitudinal diversity gradient. Science 2006, 314, 102–106. [Google Scholar] [CrossRef]
- Kennedy, J.D.; Wang, Z.; Weir, J.T.; Rahbek, C.; Fjeldså, J.; Price, T.D. Into and out of the tropics: The generation of the latitudinal gradient among New World passerine birds. J. Biogeogr. 2014, 41, 1746–1757. [Google Scholar] [CrossRef]
- Smith, B.T.; Seeholzer, G.F.; Harvey, M.G.; Cuervo, A.M.; Brumfield, R.T. A latitudinal phylogeographic diversity gradient in birds. PLOS Biol. 2017, 15, e2001073. [Google Scholar] [CrossRef] [PubMed] [Green Version]
- Chown, S.L.; Gaston, K.J.; Williams, P.H. Global patterns in species richness of pelagic seabirds: The Procellariiformes. Ecography 2006, 21, 342–350. [Google Scholar] [CrossRef]
Figure 1.
Relevant marine ecoregions of the Americas (based on [14]) used to evaluate sea- and shorebird records found in OBIS ([7]; accessed 7 August 2019). OBIS records found are noted by blue dots, and all marine ecoregions and occurrence records are located off the coast. Marine ecoregions where no seabird records were found in OBIS are not shown. Dashed line along western Central America and across to the Caribbean Sea indicate that observations were recorded along a cruise track [18,19].

Figure 2.
Sea- and shorebird-occurrence records in OBIS [7] (accessed 7 August 2019) for Marine Ecoregions of the Americas [14]. Most records are from North American ecoregions, especially the coastlines of the United States. Only one occurrence record was found for the Malvinas/Falkland Islands marine ecoregion.

Figure 3.
Marine ecoregions of the Americas [14] and the number of years from 1960–2018 for which the OBIS database [7] contained sea- and shorebird data.

Figure 4.
The number of species documented by family in OBIS [7] from 1960–2018 for the ecoregions assessed. Common name equivalents can be found in Table 1.

Figure 5.
Number of species documented in OBIS [7] (accessed 7 August 2019) by family from 1960-2018 in the Spalding et al. [14] marine ecoregions of the Americas, plotted from highest (left) to lowest (right) percentages for each family (source of extant species data is [41]; common name equivalents can be found in Table 1).

Figure 6.
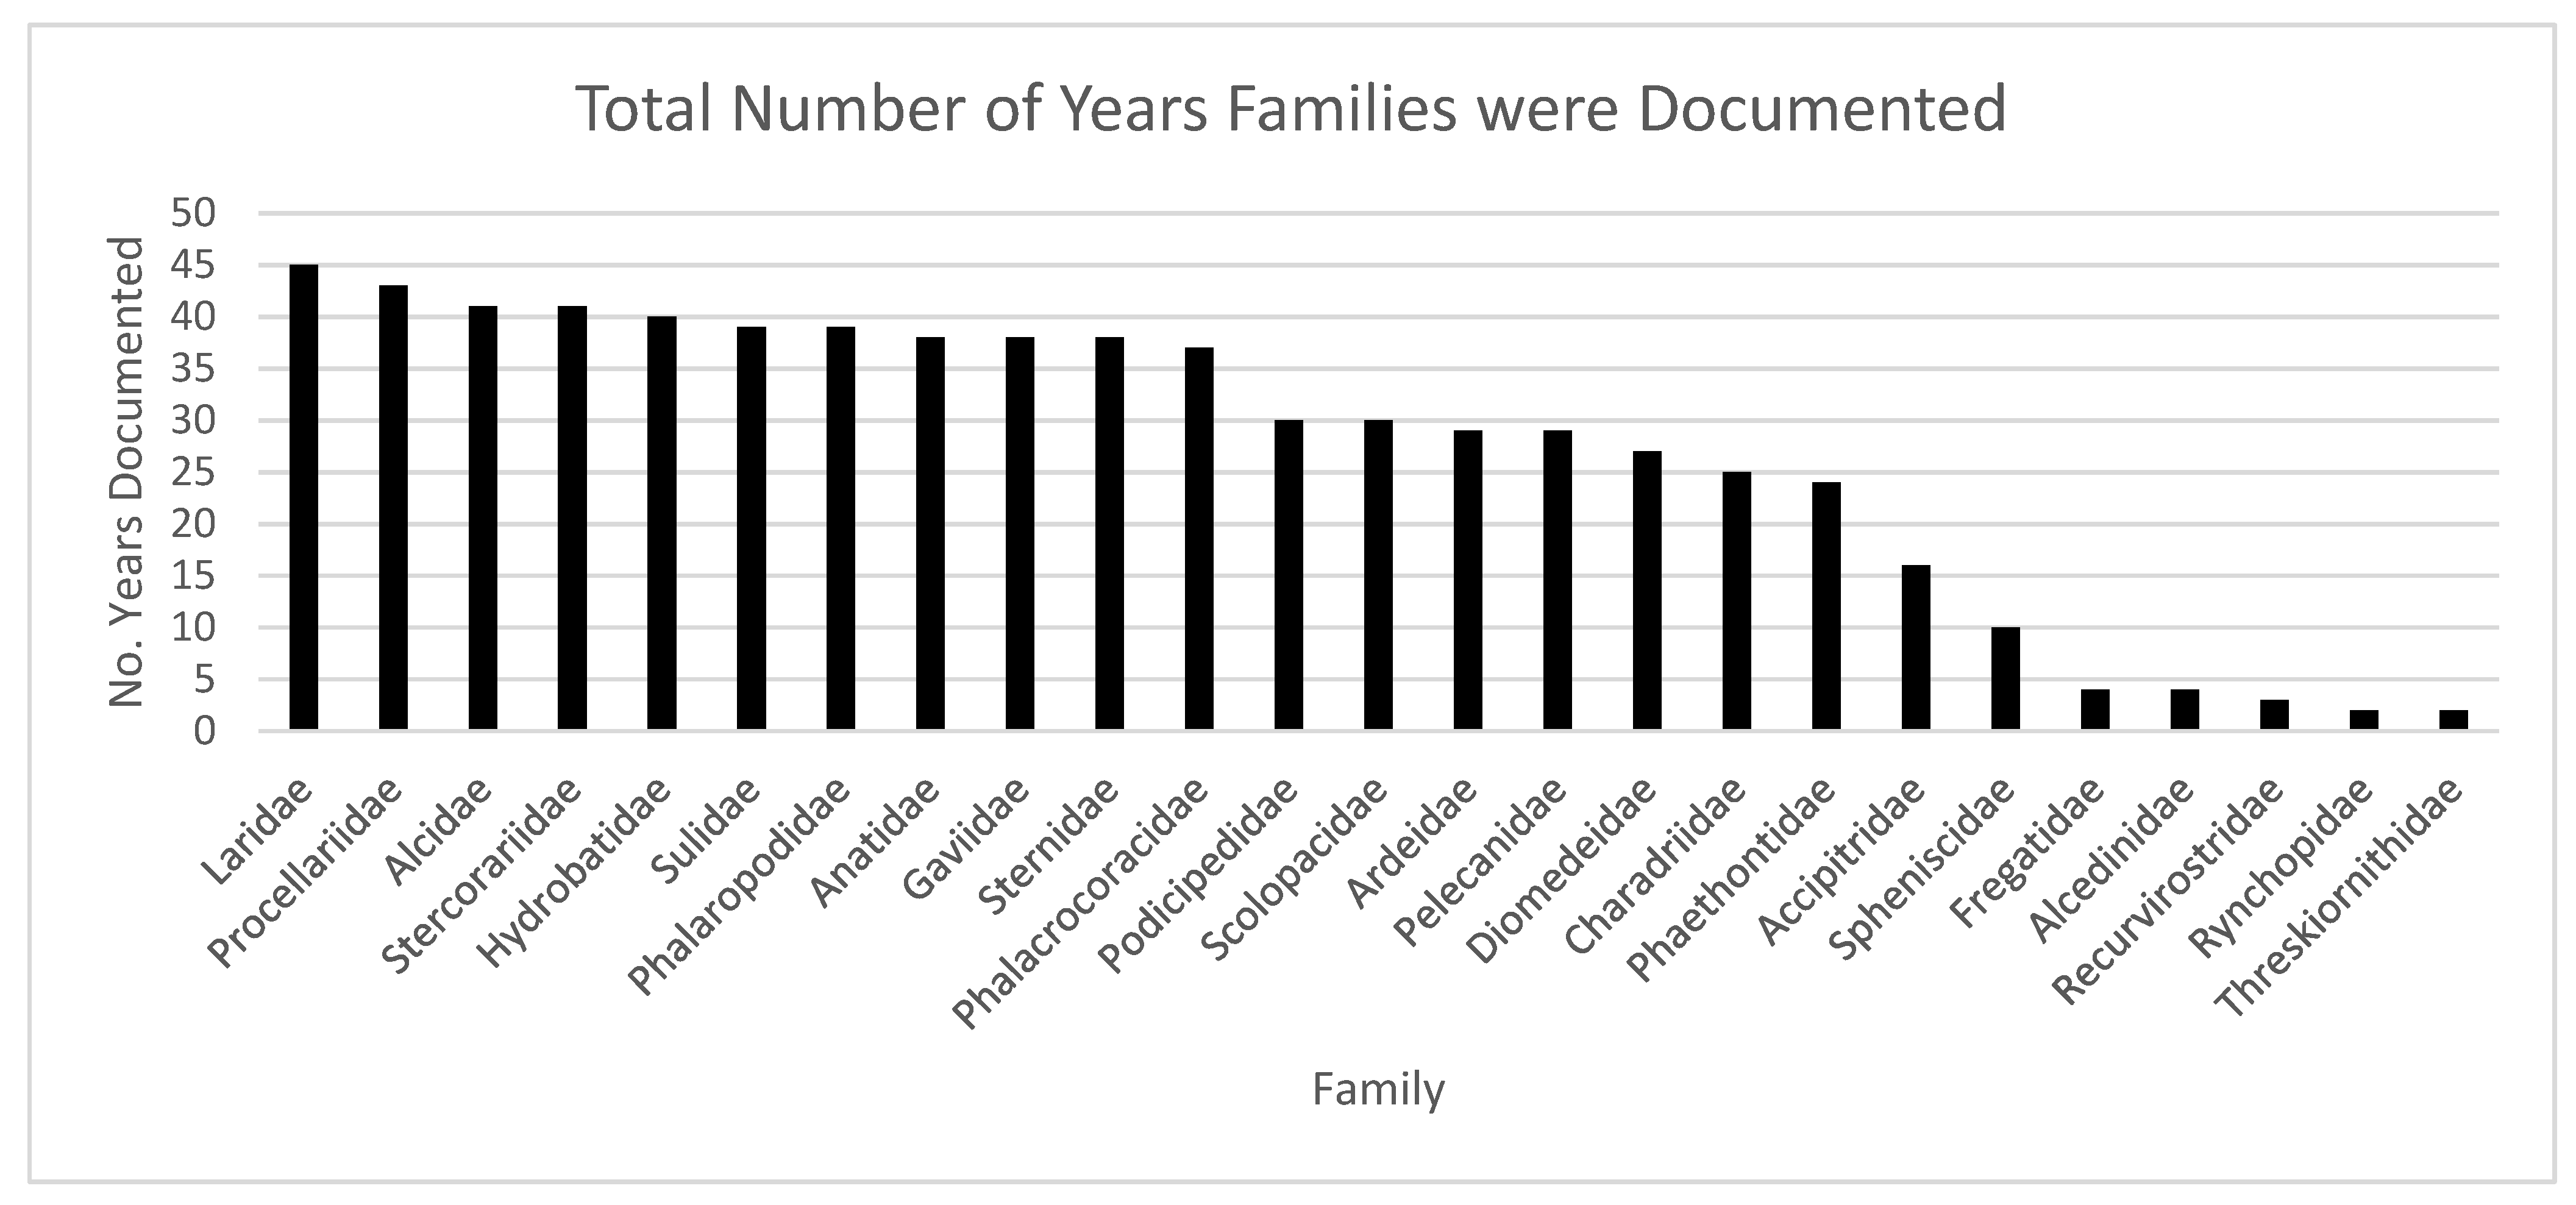
The total number of years each family was documented. Laridae and Procellariidae were documented for the most years (45 and 43 years, respectively). Rynchopidae and Threskiornithidae were documented the least, 2 years (common name equivalents can be found in Table 1).
Figure 6.
The total number of years each family was documented. Laridae and Procellariidae were documented for the most years (45 and 43 years, respectively). Rynchopidae and Threskiornithidae were documented the least, 2 years (common name equivalents can be found in Table 1).


Table 1.
Sea- and shorebird families, common names, general habitat, number of species recognized based on ([20,21,22,23,24,25,26,27,28,29,30,31,32,33,34,35,36,37,38,39,40] and occurrence records within the OBIS database [7]). The ecoregions with records were alphabetically assigned numbers (1–29) to show where records for each family were found: 1 Araucanian, 2 Bahamian, 3 Carolinian, 4 Channels and Fjords of Southern Chile, 5 Chiapas-Nicaraguan, 6 Chiloense, 7 Coretezian, 8 Floridian, 9 Greater Antilles, 10 Gulf of Maine/Bay of Fundy, 11 Juan Fernandez and Desventuradas, 12 Magdalena Transition, 13 Malvinas/Falklands, 14 Mexican Tropical Pacific, 15 Nicoya, 16 North Patagonian Gulfs, 17 Northern California, 18 Northern Gulf of Mexico, 19 Oregon, Washington, Vancouver Coast and Shelf, 20 Panama Bight, 21 Patagonian Shelf, 22 Puget Trough/Georgia Basin, 23 Rio Grande, 24 Southeastern Brazil, 25 Southern California Bight, 26 Southern Gulf of Mexico, 27 Southwestern Caribbean, 28 Uruguay-Buenos Aires Shelf, 29 Virginian.
| Family Name | Common Name/s | Habitat | # Species | # spp in OBIS | # Occurrence Records | No. of Each Marine Ecoregion with Records |
|---|---|---|---|---|---|---|
| Anatidae | Ducks, Geese | Coastal/inland | 174 | 33 | 158,392 | 3, 10, 17, 19, 22, 29 |
| Laridae | Gulls | Coastal/inland | 51 | 26 | 150,416 | 2, 3, 5, 7–10, 12, 14, 15, 17–20, 22, 24–27, 29 |
| Procellariidae | Petrels, Shearwaters | Pelagic | 96 | 30 | 72,975 | 2–5, 7–12, 14–22, 25–29 |
| Alcidae | Auks, Murres, Puffins | Cold water, coastal | 25 | 15 | 72,386 | 3, 10, 17, 19, 22, 25, 29 |
| Sulidae | Boobies, Gannets | Pelagic | 10 | 5 | 44,381 | 2, 3, 5, 7–10, 14, 15, 18 20, 26, 27, 29 |
| Gaviidae | Loons | Coastal/inland | 5 | 3 | 42,642 | 3, 10, 17, 19, 22, 29 |
| Diomedeidae | Albatrosses | Pelagic | 15 | 10 | 29,730 | 1, 4, 6, 11–13, 16, 17, 19, 21, 23–25, 28 |
| Hydrobatidae | Northern Storm Petrels | Pelagic | 18 | 12 | 28,277 | 2–5, 7–10, 12, 14, 15, 17–20, 25–29 |
| Phalacrocoracidae | Cormorants, Shags | Coastal & pelagic | 40 | 6 | 20,867 | 3, 8, 10, 17–19, 22, 29 |
| Podicipedidae | Grebes | Coastal/inland | 22 | 5 | 20,680 | 3, 17, 19, 22, 29 |
| Phalaropodidae | Phalaropes | Shorebirds | 3 | 2 | 16,425 | 3, 10, 14, 17, 19, 22, 25, 29 |
| Sternidae | Terns | Inland, coastal & pelagic | 45 | 11 | 10,318 | 2, 3, 8–10, 14, 15, 17–20, 22, 24, 26, 29 |
| Ardeidae | Herons, Egrets, Bitterns | Shorebirds | 68 | 2 | 7,526 | 3, 8, 10, 17, 19, 20, 22, 29 |
| Stercorariidae | Skuas | Cold water, coastal | 7 | 5 | 3,202 | 2, 3, 8–10, 14, 17–19, 22, 25, 26, 28, 29 |
| Scolopacidae | Sandpipers | Shorebirds | 97 | 22 | 2,373 | 3, 10, 17, 19, 20, 22, 27, 29 |
| Accipitridae | Hawks, Eagles, Kites | Mostly terrestrial | 250 | 1 | 2,224 | 10, 19, 22, 29 |
| Pelecanidae | Pelicans | Coastal/inland | 8 | 2 | 1,104 | 7, 8, 17–20, 22, 25, 26, 29 |
| Spheniscidae | Penguins | Southern cold waters | 18 | 3 | 712 | 4, 21 |
| Charadriidae | Plovers, Lapwings | Coastal/inland | 68 | 8 | 549 | 3, 7, 10, 19, 20, 22, 24, 29 |
| Phaethontidae | Tropicbirds | Islands & pelagic | 3 | 2 | 157 | 2, 3, 5, 7, 8, 10, 14, 15, 26, 29 |
| Rynchopidae | Skimmers | Coastal | 3 | 1 | 65 | 24, 29 |
| Fregatidae | Frigatebirds | Coastal & pelagic | 5 | 1 | 27 | 2, 3, 5, 8, 14, 15, 20, 27 |
| Recurvirostridae | Stilts, Avocets | Coastal/inland | 9 | 2 | 17 | 3, 17 |
| Alcedinidae | Kingfishers | Coastal/inland | 118 | 1 | 7 | 3, 10, 27 |
| Threskiornithidae | Ibises, Spoonbills | Shorebirds | 36 | 1 | 2 | 3, 27 |
Publisher’s Note: MDPI stays neutral with regard to jurisdictional claims in published maps and institutional affiliations. |
© 2022 by the authors. Licensee MDPI, Basel, Switzerland. This article is an open access article distributed under the terms and conditions of the Creative Commons Attribution (CC BY) license (https://creativecommons.org/licenses/by/4.0/).
Share and Cite
MDPI and ACS Style
Hartman, S.; Hallock, P.; Muller-Karger, F. Obligation to Enhance OBIS Data for Sea- and Shorebirds of the Americas. Diversity 2022, 14, 1099. https://doi.org/10.3390/d14121099
AMA Style
Hartman S, Hallock P, Muller-Karger F. Obligation to Enhance OBIS Data for Sea- and Shorebirds of the Americas. Diversity. 2022; 14(12):1099. https://doi.org/10.3390/d14121099
Chicago/Turabian StyleHartman, Savannah, Pamela Hallock, and Frank Muller-Karger. 2022. "Obligation to Enhance OBIS Data for Sea- and Shorebirds of the Americas" Diversity 14, no. 12: 1099. https://doi.org/10.3390/d14121099
Note that from the first issue of 2016, this journal uses article numbers instead of page numbers. See further details here.