
Genetic Architecture and Signatures of Selection in the Caqueteño Creole (Colombian Native Cattle)

 , , and
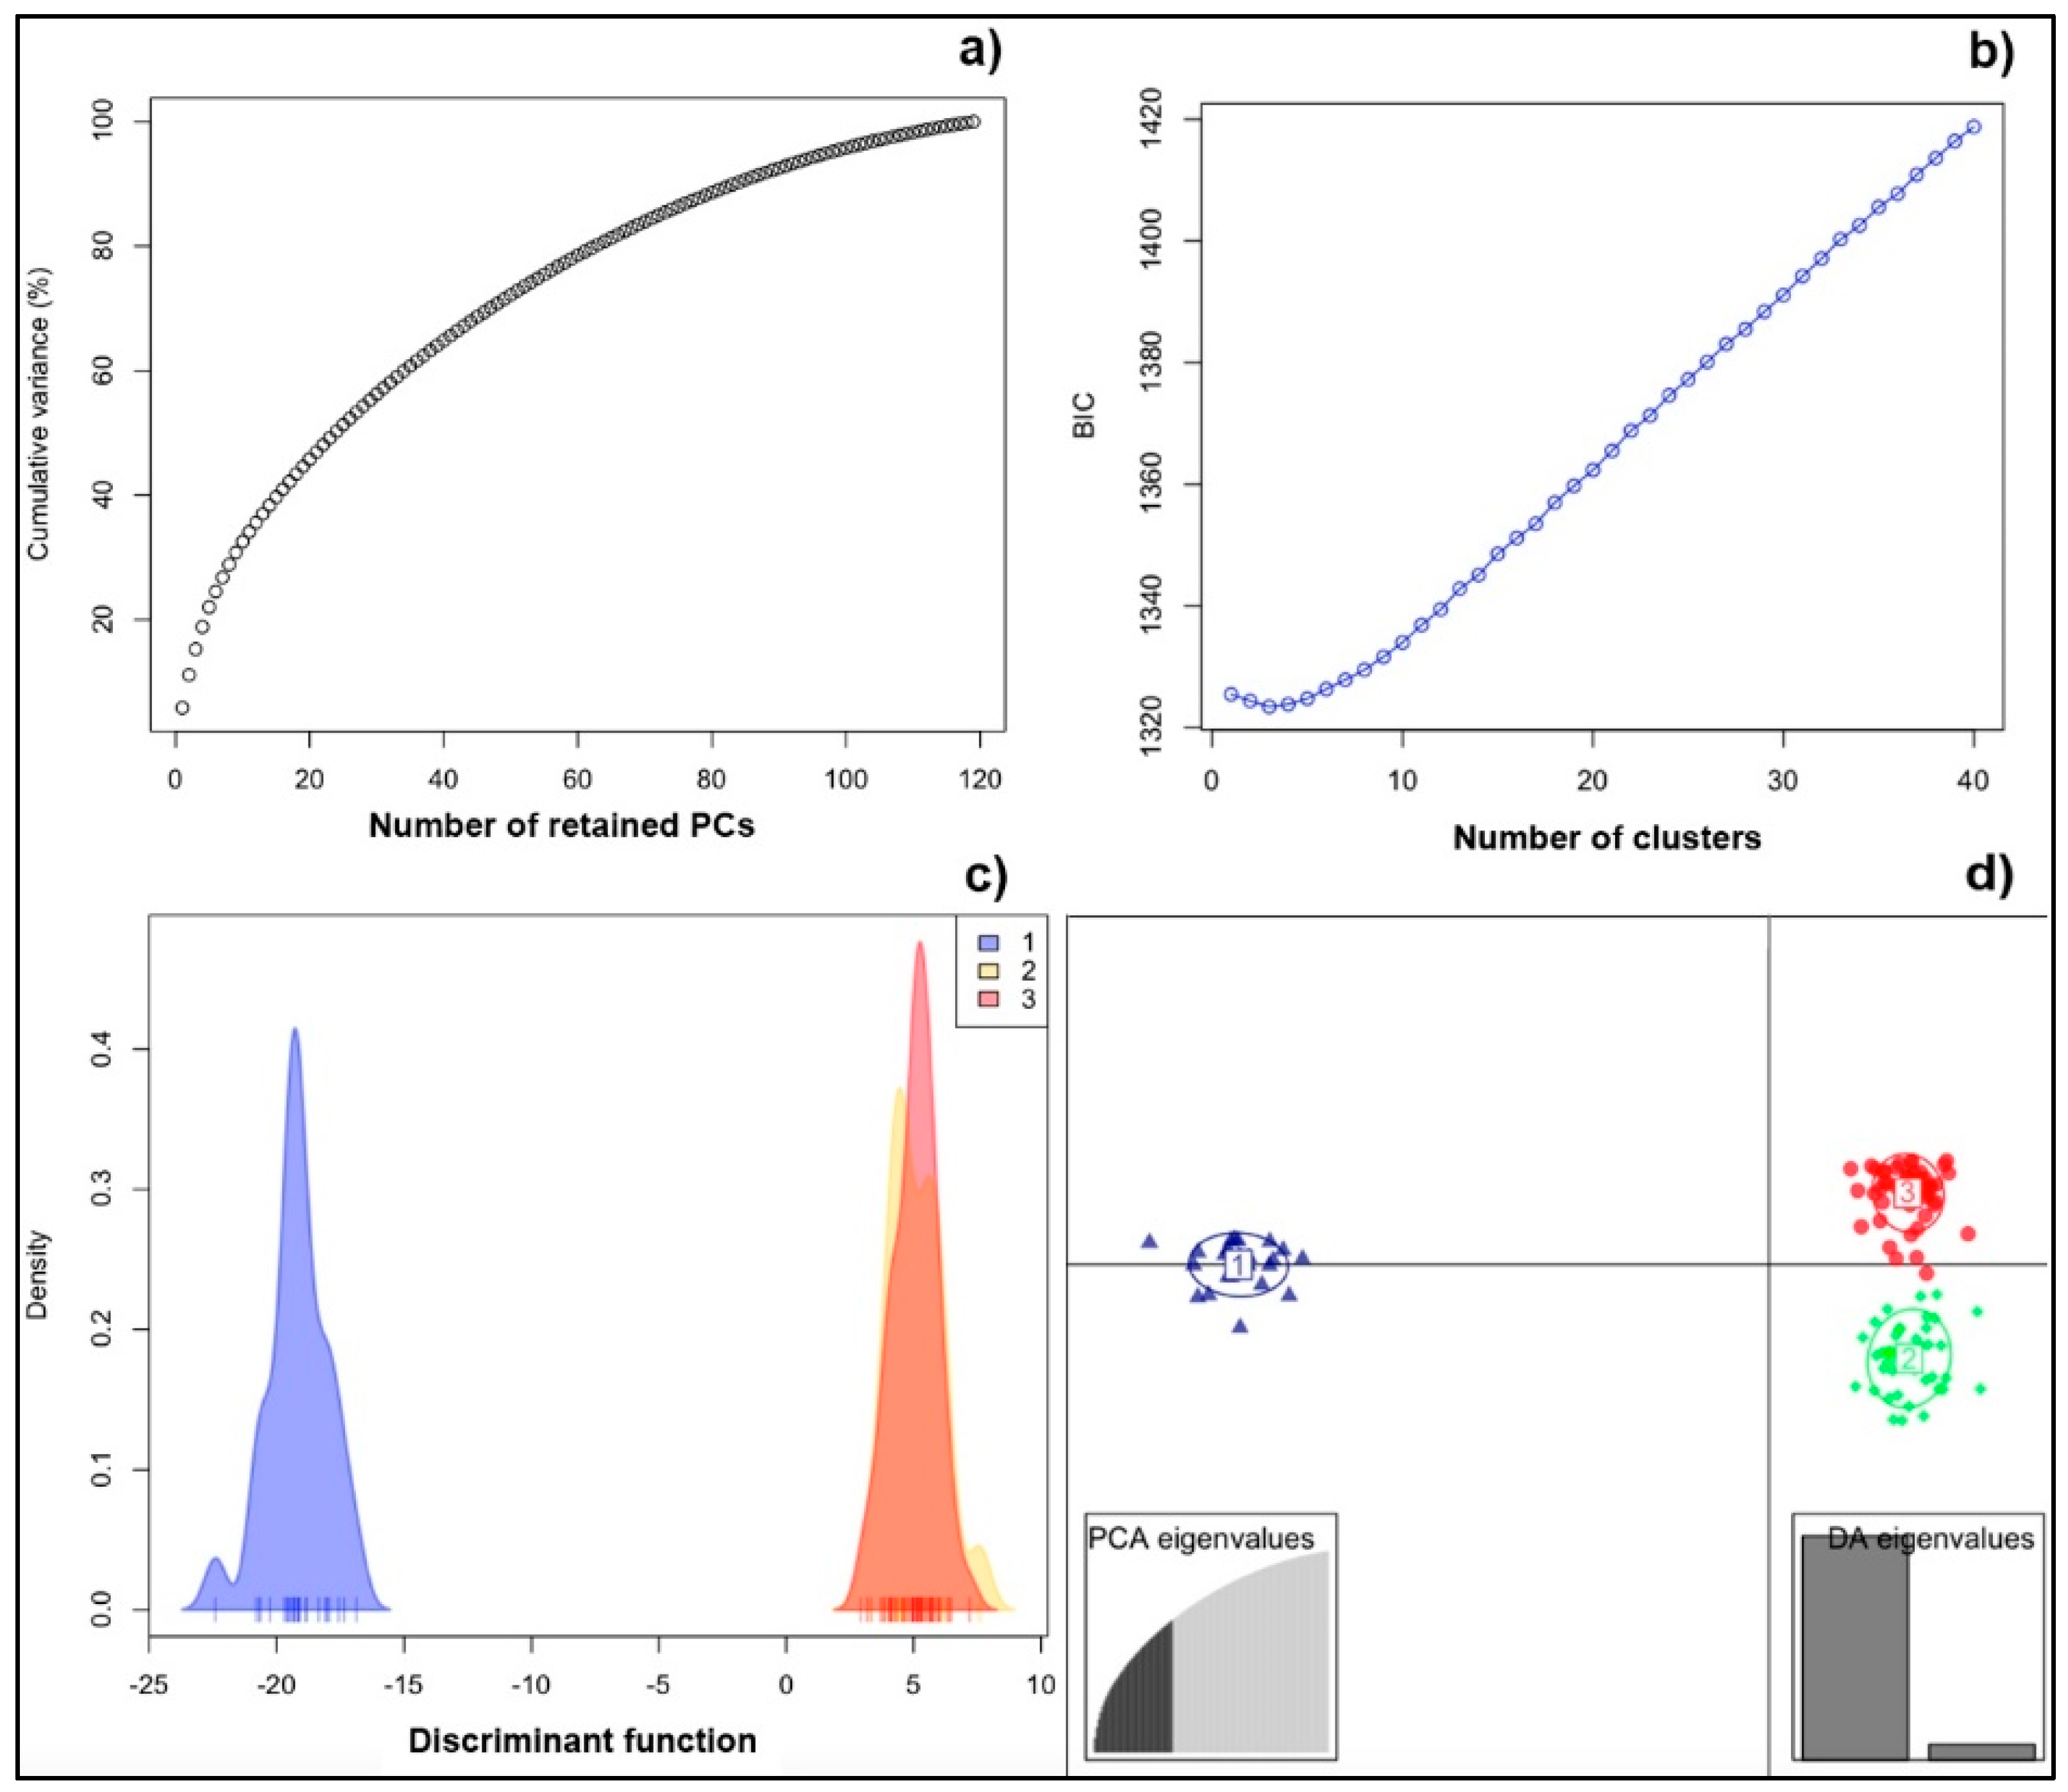
Abstract
:1. Introduction
2. Materials and Methods
2.1. Ethics Statement
2.2. Animals and Genotype
2.3. Genetic Structure of the Population
2.4. Integrated Haplotype Scoring (iHS)
2.5. The Fixation Indice (Fst) and XP-EHH Analysis
2.6. Candidate Genes and Functional Analysis
3. Results
3.1. Genetic Structure of the Population (PCA and DAPC)
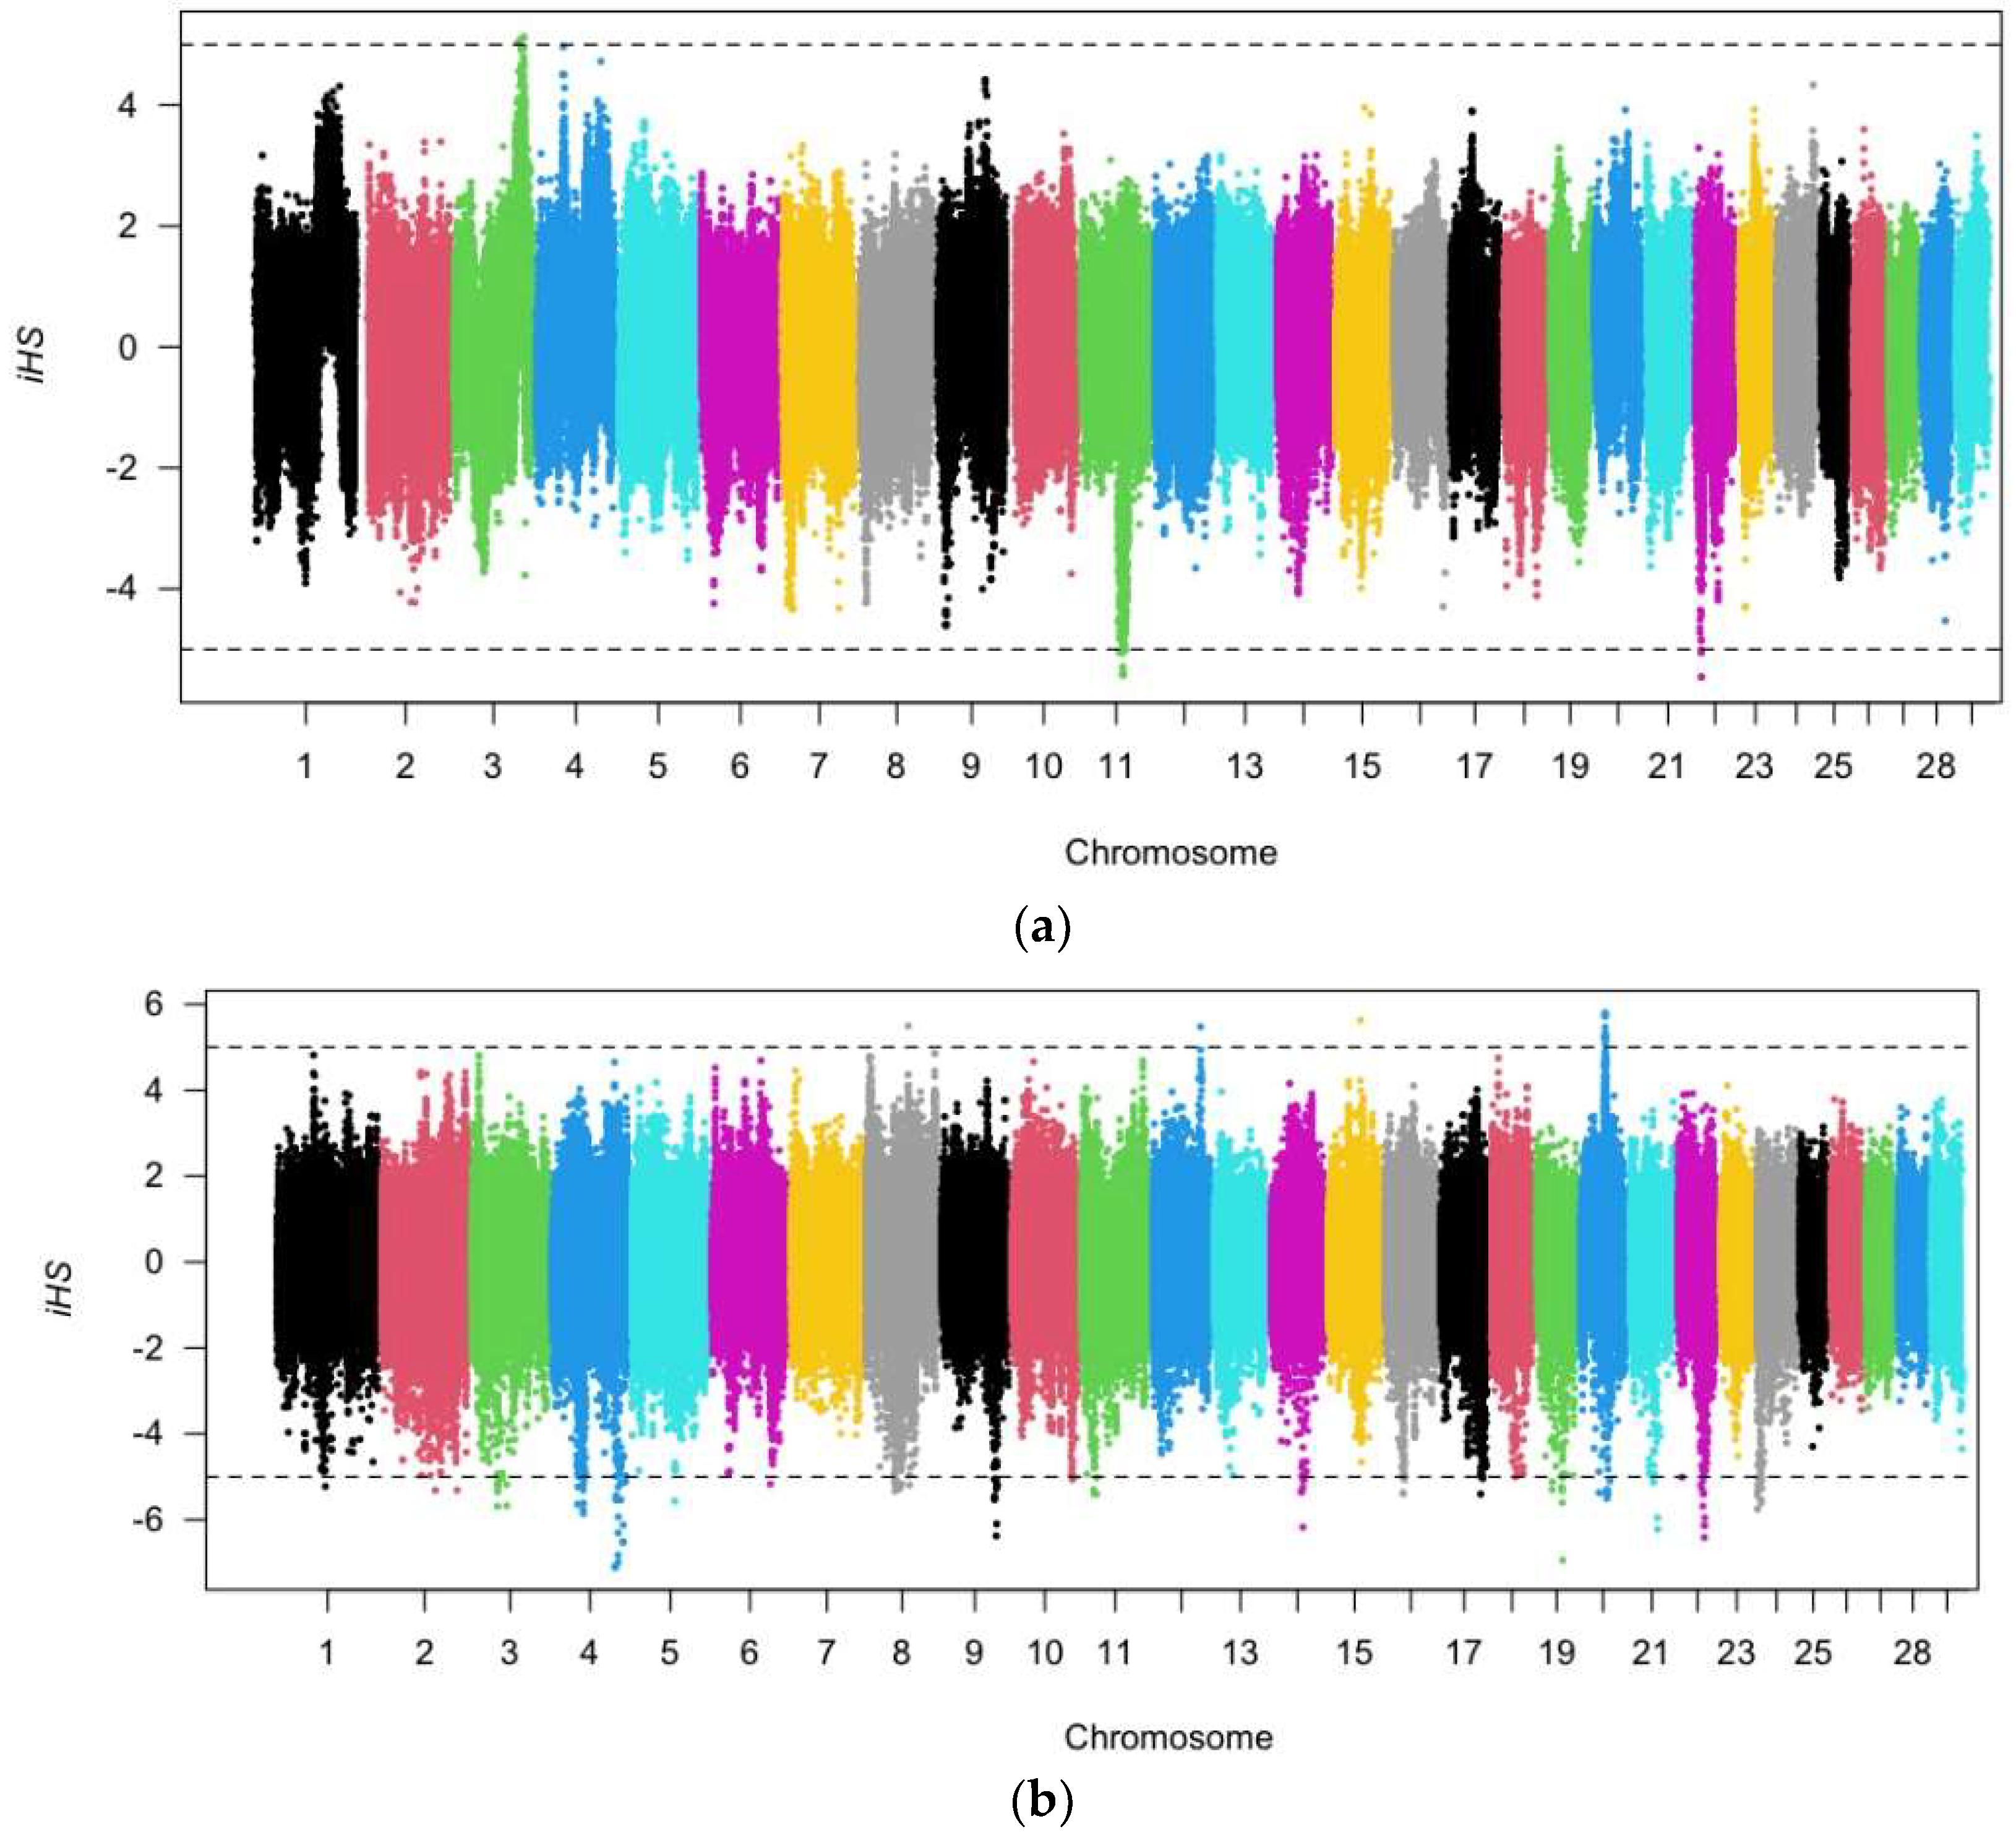
3.2. Selection Signature of iHS in CAQ
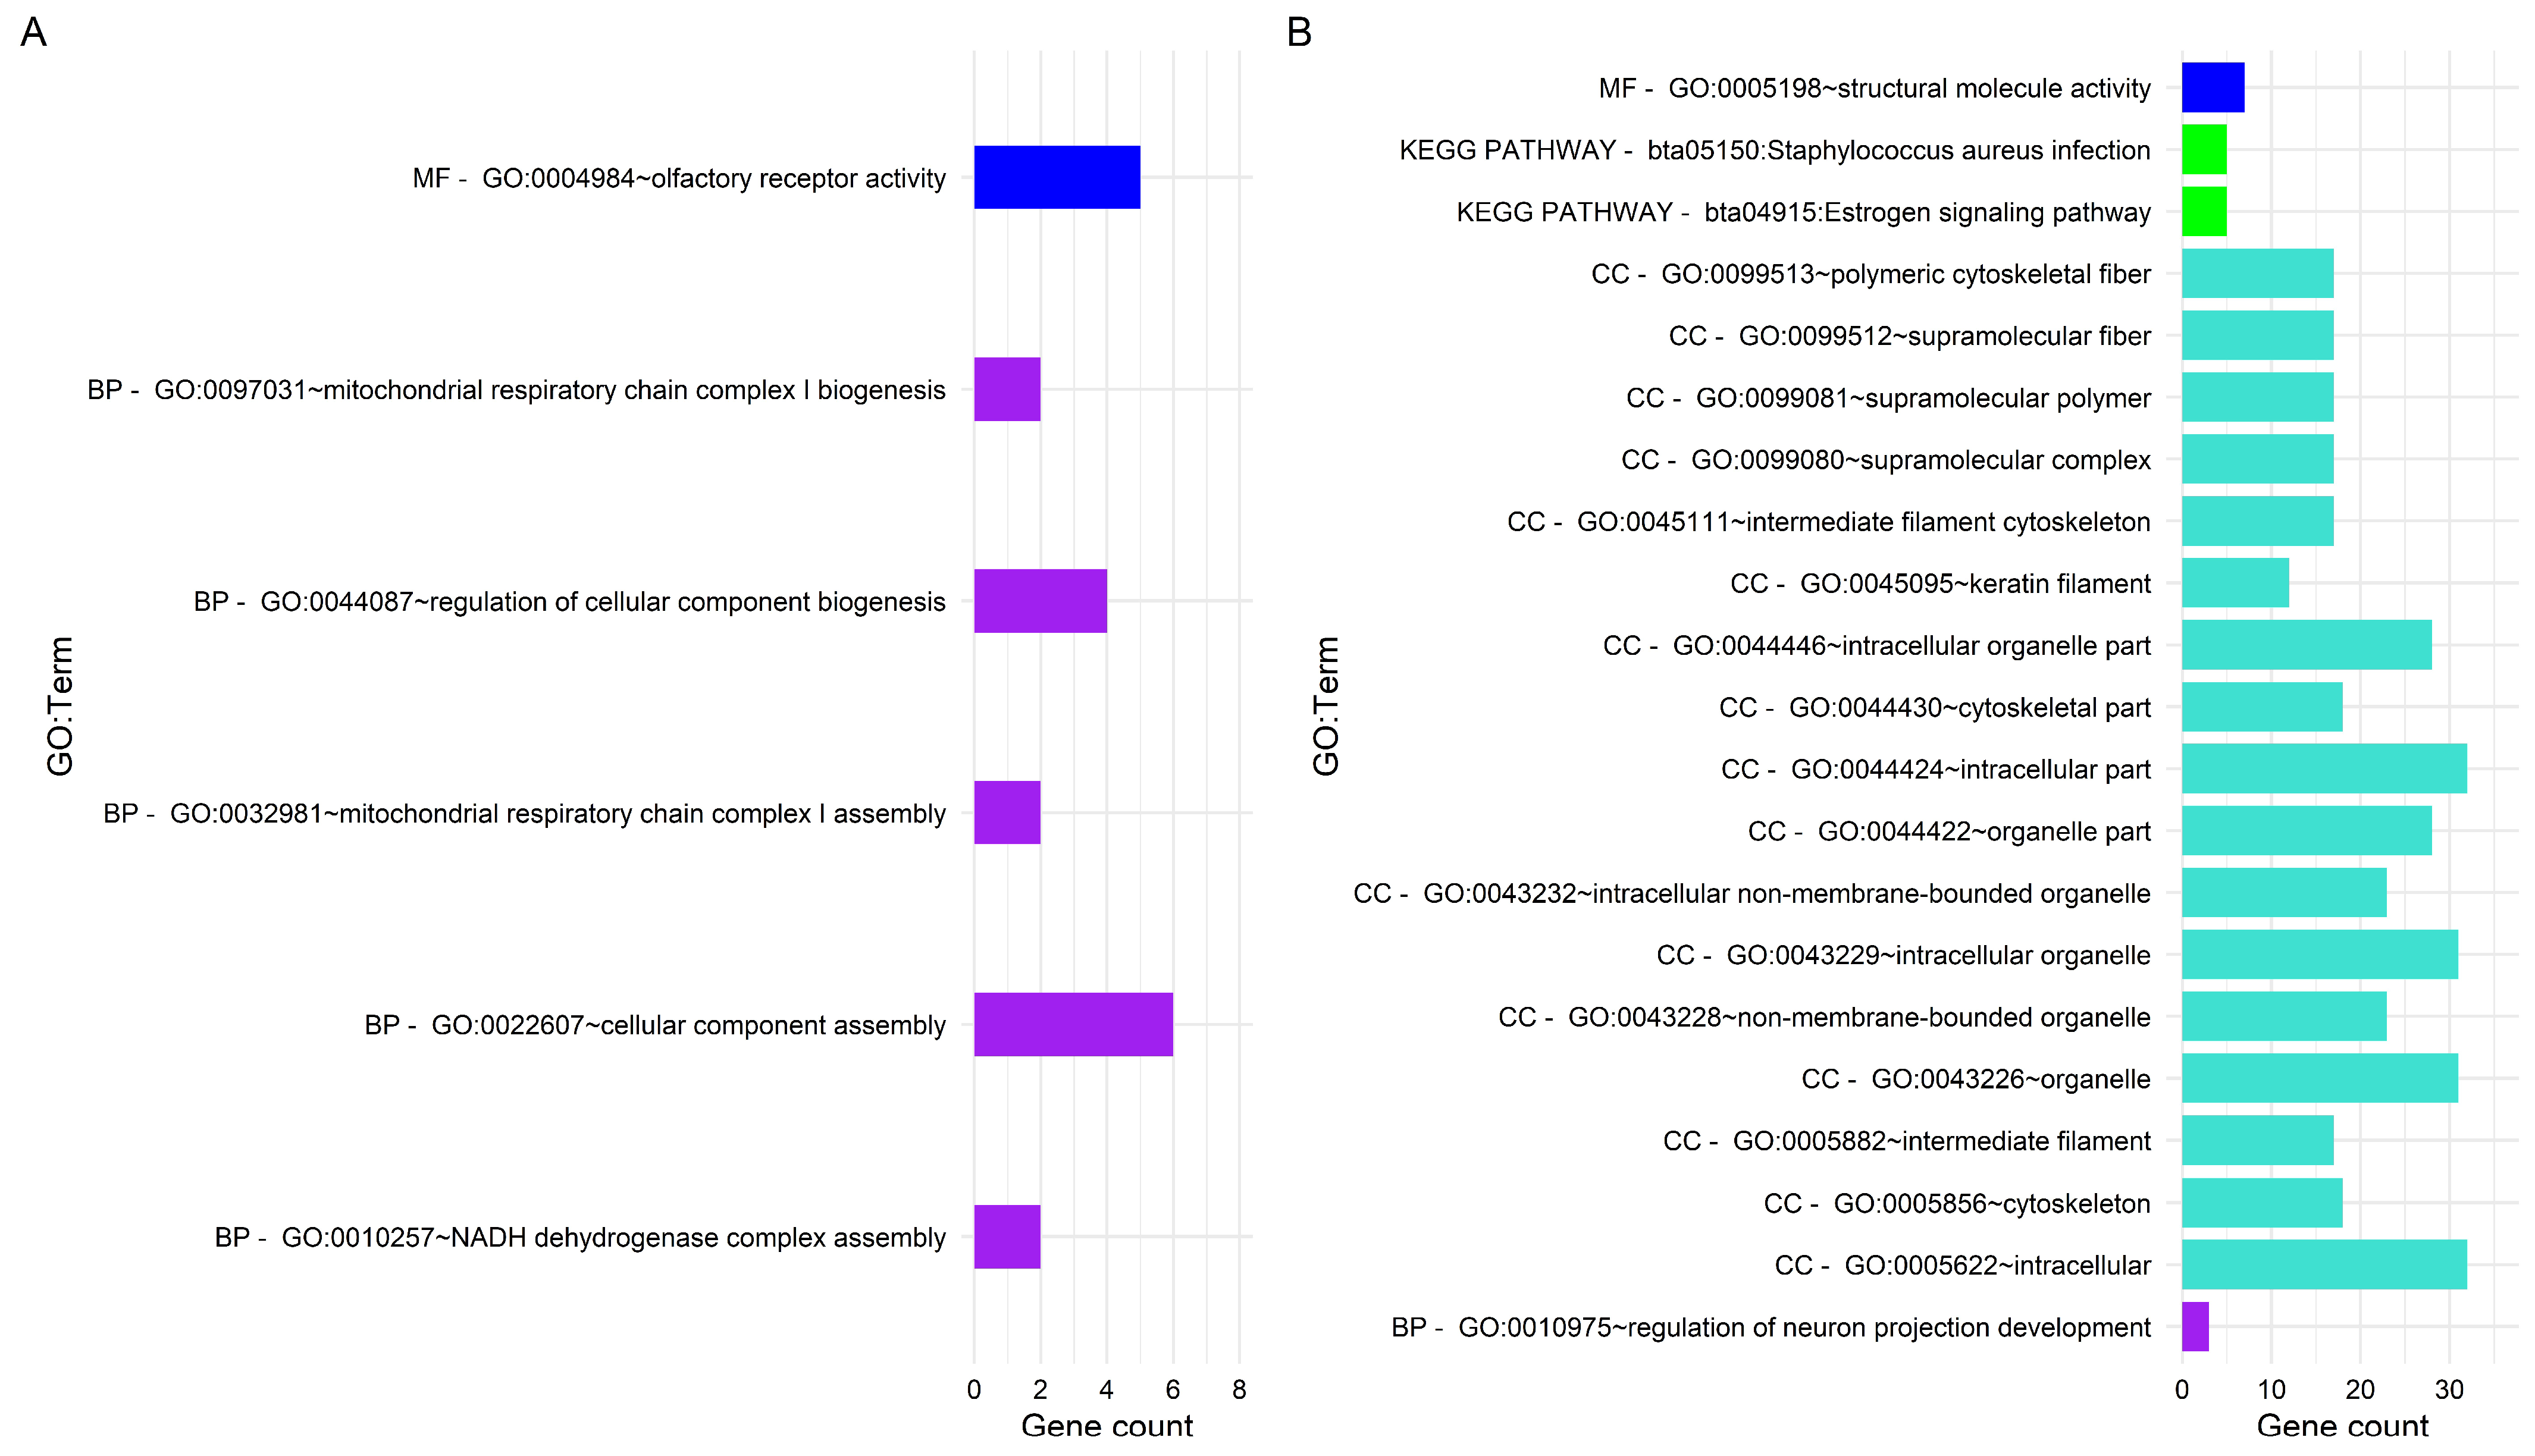
3.3. Gene Enrichment Analysis
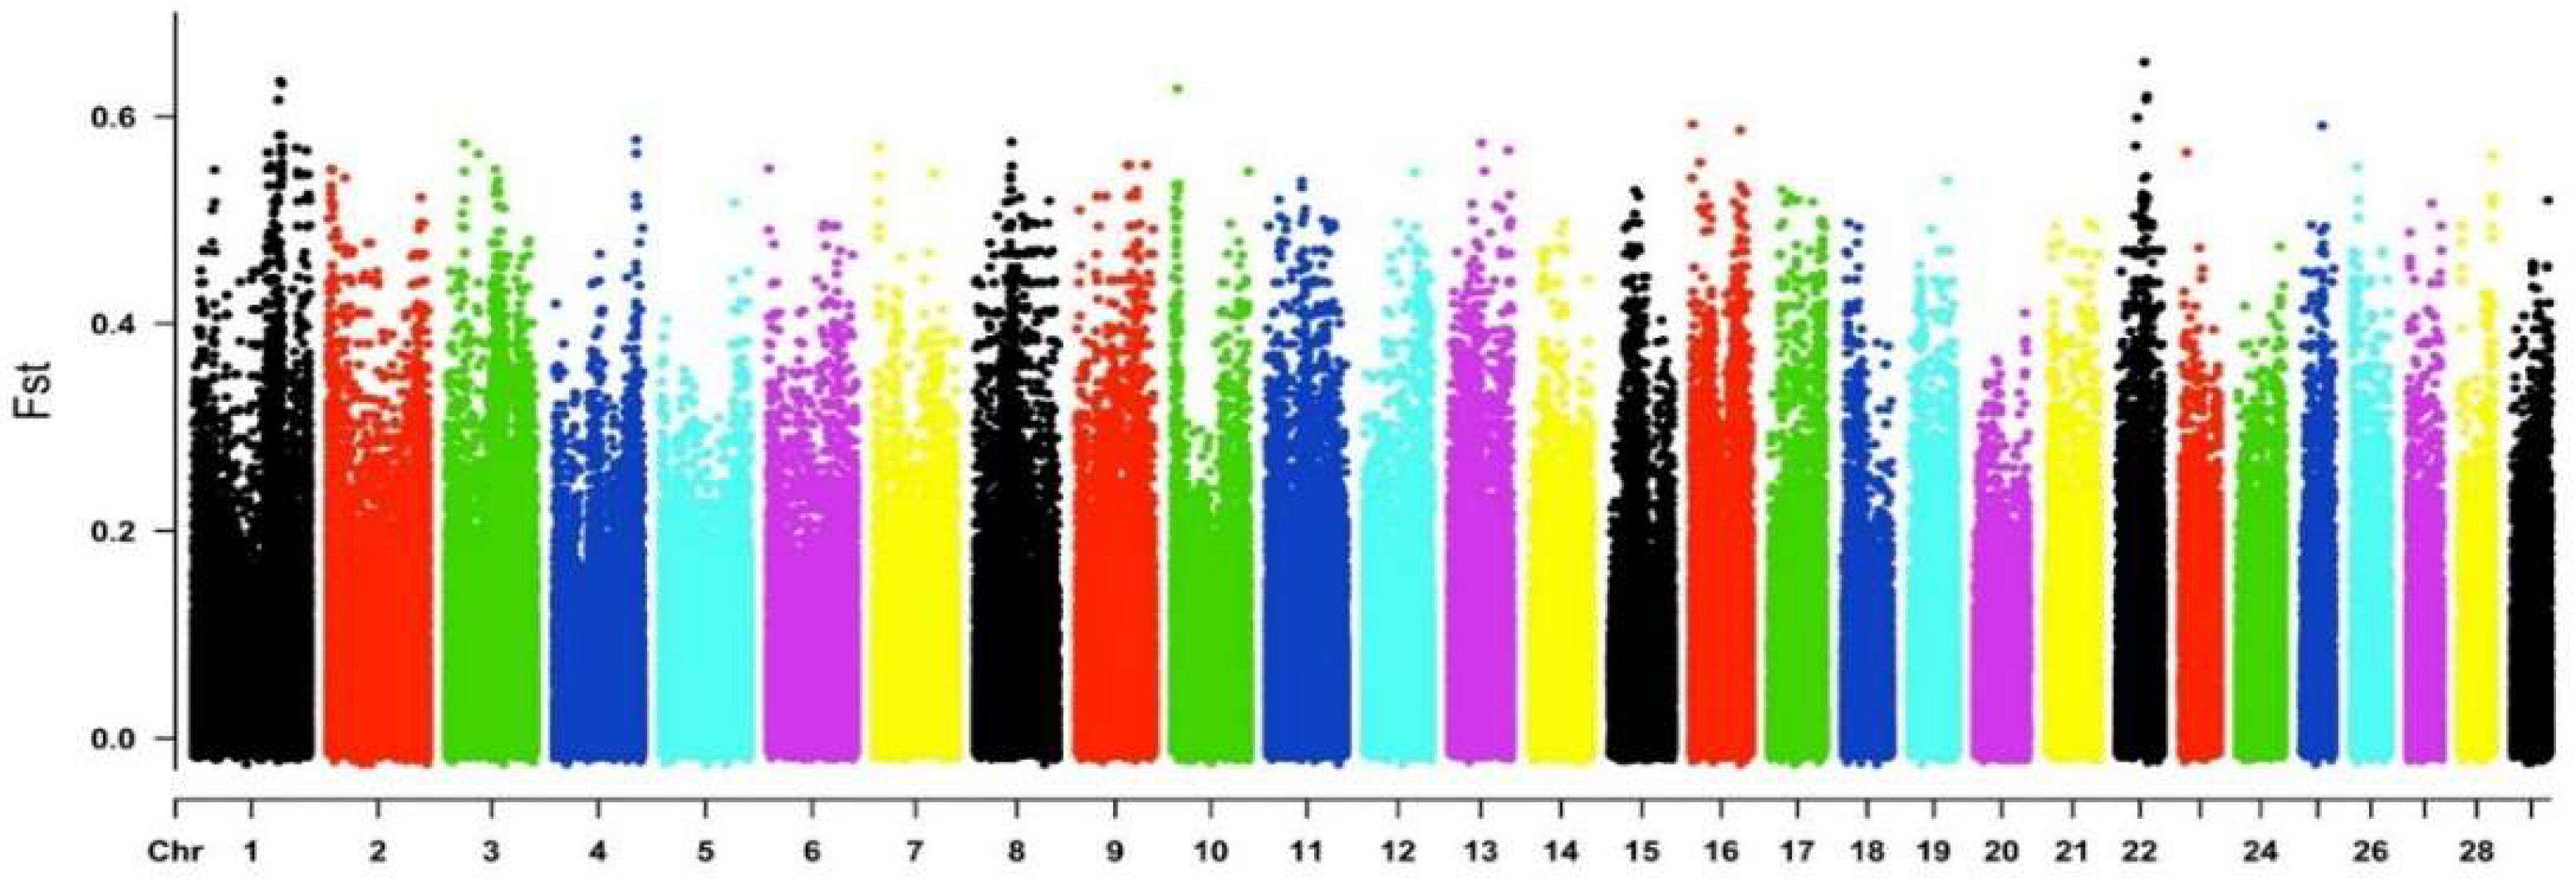
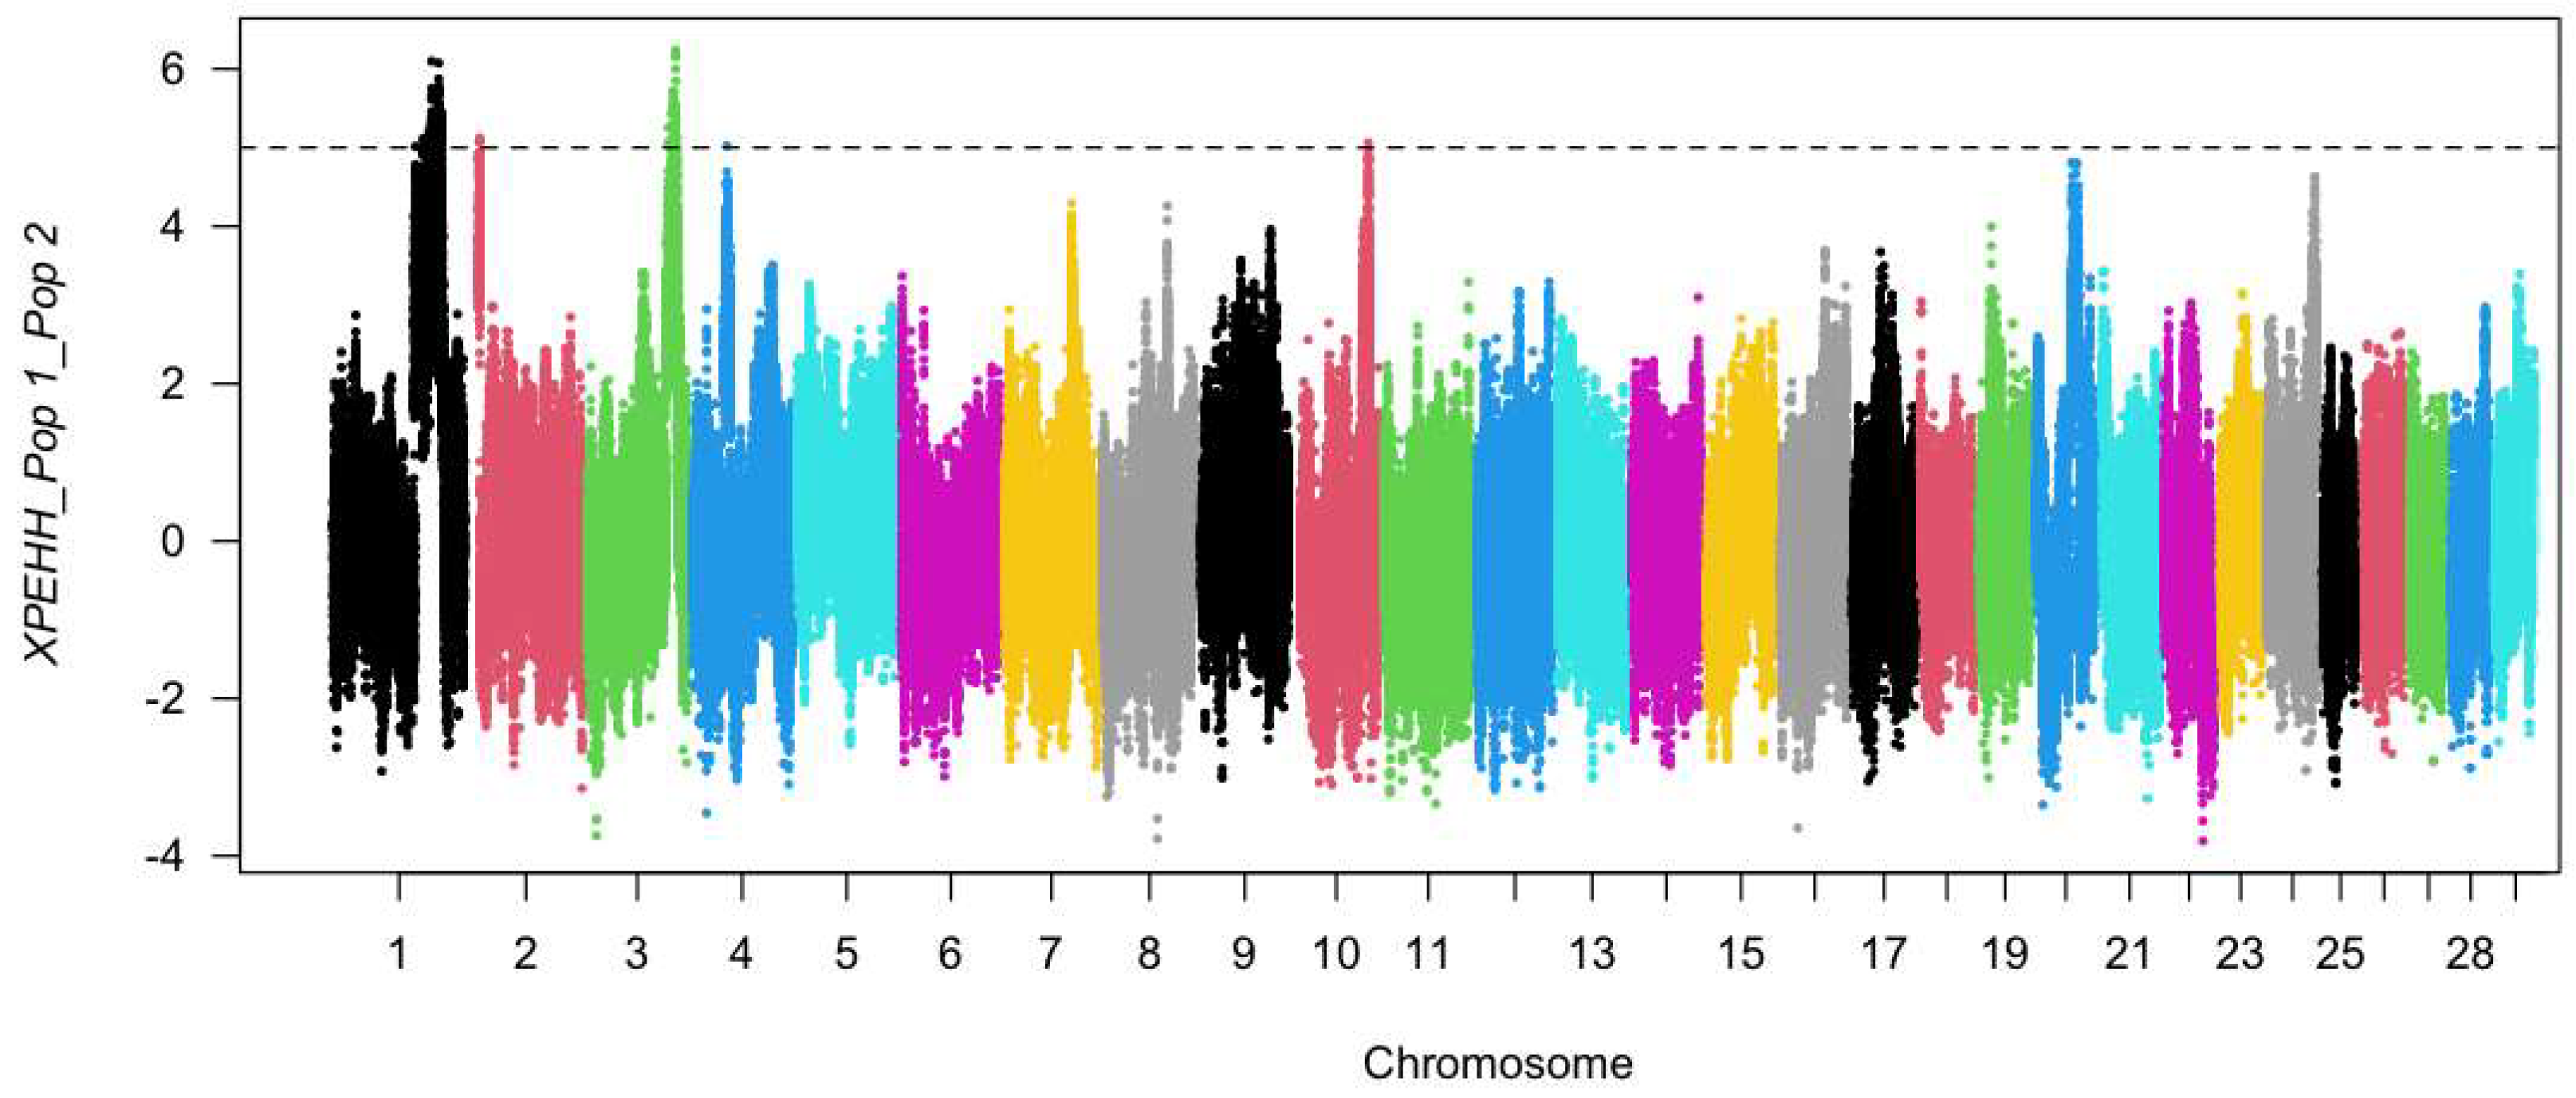
3.4. Diversity Genetics and Selection Signatures in Groups (Fst and XP-EHH)
4. Discussion
Identification of Candidate Genes within the Selection Signatures of iHS, Fst and XP-EHH in the Genome
5. Conclusions
Author Contributions
Funding
Institutional Review Board Statement
Data Availability Statement
Acknowledgments
Conflicts of Interest
References
- Primo, A.T. El Ganado Bovino Ibérico en Las Americas: 500 Años Después. Arch. Zootec. 1992, 41, 421–432. [Google Scholar]
- Gutiérrez, W.R.O.; Martínez, R.A.; Escobedo, C.D.M.; Anzola, H.J.V. Situación de Los Recursos Zoogenéticos en Colombia. 2003. Available online: https://repository.agrosavia.co/handle/20.500.12324/13117 (accessed on 16 August 2022).
- Alderson, G.L.H. Conservation of breeds and maintenance of biodiversity: Justification and methodology for the conservation of Animal Genetic Resources. Arch. Zootec. 2018, 67, 300–309. [Google Scholar] [CrossRef] [Green Version]
- Ortiz, M. Las Razas Autóctonas Españolas y su Participación en Los Bovinos Criollos Iberoamericanos. Razas Bov. Creadas Lat. Caribe 1997, 5, 1–12. [Google Scholar]
- Niño, O.A.; León, G.G.; Rey, F.G.; Salazar, A.R.; Salazar, C. Caquetá, Construcción de Un Territorio Amazónico En El Siglo XX; Giraldo, M., Ed.; Instituto Amazónico de Investigaciones Científicas “SINCHI”: Florencia, Colombia, 2002; ISBN 958-968781-4. [Google Scholar]
- Barrera, G.P.; Martínez, R.; Torrijos, R.; Ramón, F. Caracterización Molecular de Una Población de Ganado Caqueteño y su Relación Filogenética Con Razas Bovinas Criollas Colombianas. Cienc. Tecnol. Agropecu. 2006, 7, 33–41. [Google Scholar] [CrossRef] [Green Version]
- Toro-Ospina, A.M.; Herrera Rios, A.C.; Pimenta Schettini, G.; Vallejo Aristizabal, V.H.; Bizarria dos Santos, W.; Zapata, C.A.; Ortiz Morea, E.G. Identification of Runs of Homozygosity Islands and Genomic Estimated Inbreeding Values in Caqueteño Creole Cattle (Colombia). Genes 2022, 13, 1232. [Google Scholar] [CrossRef]
- Quiroz, B.E.P.; Restrepo, J.E.V.; Martínez, H.E.O.; Romero, N.E.B. Identificación de La Raza Criollo Caqueteño Mediante El Estudio De Las Características Fanerópticas. Rev. Fac. Cienc. Agropecu. 2019, 11, 23–32. [Google Scholar]
- Decker, J.E.; McKay, S.D.; Rolf, M.M.; Kim, J.; Molina Alcalá, A.; Sonstegard, T.S.; Hanotte, O.; Götherström, A.; Seabury, C.M.; Praharani, L.; et al. Worldwide Patterns of Ancestry, Divergence, and Admixture in Domesticated Cattle. PLoS Genet. 2014, 10, e1004254. [Google Scholar] [CrossRef] [Green Version]
- Mastrangelo, S.; Saura, M.; Tolone, M.; Salces-Ortiz, J.; Di Gerlando, R.; Bertolini, F.; Fontanesi, L.; Sardina, M.T.; Serrano, M.; Portolano, B. The Genome-Wide Structure of Two Economically Important Indigenous Sicilian Cattle Breeds. J. Anim. Sci. 2014, 92, 4833–4842. [Google Scholar] [CrossRef]
- Edea, Z.; Bhuiyan, M.S.A.; Dessie, T.; Rothschild, M.F.; Dadi, H.; Kim, K.S. Genome-Wide Genetic Diversity, Population Structure and Admixture Analysis in African and Asian Cattle Breeds. Animal 2015, 9, 218–226. [Google Scholar] [CrossRef] [Green Version]
- Veronika, Š.; Nina, M.; Anna, T.; Maja, F.; Ino, C.; Kasarda, R. Production Type of Slovak Pinzgau Cattle in Respect of Related Breeds. Acta Fytotech. Zootech. 2015, 2, 25–29. [Google Scholar]
- Gautier, M.; Faraut, T.; Moazami-Goudarzi, K.; Navratil, V.; Foglio, M.; Grohs, C.; Boland, A.; Garnier, J.-G.; Boichard, D.; Lathrop, G.M.; et al. Genetic and Haplotypic Structure in 14 European and African Cattle Breeds. Genetics 2007, 177, 1059–1070. [Google Scholar] [CrossRef] [PubMed] [Green Version]
- Sponenberg, D.P.; Bixby, D.E. Managing Breeds for a Secure Future: Strategies for Breeders and Breed Associations; ALBC: Pittsboro, NC, USA, 2007; ISBN 1887316078. [Google Scholar]
- Melka, M.G.; Schenkel, F.S. Analysis of Genetic Diversity in Brown Swiss, Jersey and Holstein Populations Using Genome-Wide Single Nucleotide Polymorphism Markers. BMC Res. Notes 2012, 5, 161. [Google Scholar] [CrossRef] [PubMed] [Green Version]
- Wright, S. The Genetical Structure of Populations. Ann. Eugen. 1949, 15, 323–354. [Google Scholar] [CrossRef]
- Voight, B.F.; Kudaravalli, S.; Wen, X.; Pritchard, J.K. A Map of Recent Positive Selection in the Human Genome. PLoS Biol. 2006, 4, e72. [Google Scholar] [CrossRef] [Green Version]
- Bahbahani, H.; Tijjani, A.; Mukasa, C.; Wragg, D.; Almathen, F.; Nash, O.; Akpa, G.N.; Mbole-Kariuki, M.; Malla, S.; Woolhouse, M.; et al. Signatures of Selection for Environmental Adaptation and Zebu × Taurine Hybrid Fitness in East African Shorthorn Zebu. Front. Genet. 2017, 8, 68. [Google Scholar] [CrossRef] [Green Version]
- Santos, W.; Schettini, G.; Fonseca, M.G.; Pereira, G.L.; Chardulo, L.A.; Neto, O.; Baldassini, W.A.; Oliveira, H.; Curi, R. Fine-scale Estimation of Inbreeding Rates, Runs of Homozygosity and Genome-wide Heterozygosity Levels in the Mangalarga Marchador Horse Breed. J. Anim. Breed. Genet. 2021, 138, 161–173. [Google Scholar] [CrossRef]
- Lenstra, J.A.; Groeneveld, L.F.; Eding, H.; Kantanen, J.; Williams, J.L.; Taberlet, P.; Nicolazzi, E.L.; Sölkner, J.; Simianer, H.; Ciani, E.; et al. Molecular Tools and Analytical Approaches for the Characterization of Farm Animal Genetic Diversity. Anim. Genet. 2012, 43, 483–502. [Google Scholar] [CrossRef]
- Signer-Hasler, H.; Burren, A.; Neuditschko, M.; Frischknecht, M.; Garrick, D.; Stricker, C.; Gredler, B.; Bapst, B.; Flury, C. Population Structure and Genomic Inbreeding in Nine Swiss Dairy Cattle Populations. Genet. Sel. Evol. 2017, 49, 83. [Google Scholar] [CrossRef] [PubMed] [Green Version]
- Rincon, F.J.; Lopez, H.A.; Echeverri, Z.J. Estructura y Diversidad Genética En Vacas Holstein de Antioquia Usando Un Polimorfismo Del Gen BGH. Rev. MVZ Córdoba 2013, 18, 3346–3354. [Google Scholar] [CrossRef] [Green Version]
- Rincón, J.C.; López, A.; Echeverri, J. Identifying Signatures of Recent Selection in Holstein Cattle in the Tropic. Rev. Colomb. Cienc. Pecu. 2018, 31, 45–58. [Google Scholar] [CrossRef] [Green Version]
- Zambrano, M.F.B.; Flórez, J.C.R.; Rios, A.C.H.; Portilla, C.E.S.; De Jesus Bedoya, G. Evaluation of Runs of Homozygosity and Genomic Inbreeding in Holstein Cattle from Colombia. Semin. Ciênc. Agrárias 2020, 41, 3397–3418. [Google Scholar] [CrossRef]
- Jombart, T.; Devillard, S.; Balloux, F. Discriminant Analysis of Principal Components: A New Method for the Analysis of Genetically Structured Populations. BMC Genet. 2010, 11, 94. [Google Scholar] [CrossRef] [Green Version]
- Santos, W.B.; Schettini, G.P.; Maiorano, A.M.; Bussiman, F.O.; Balieiro, J.C.C.; Ferraz, G.C.; Pereira, G.L.; Baldassini, W.A.; Neto, O.R.M.; Oliveira, H.N.; et al. Genome-Wide Scans for Signatures of Selection in Mangalarga Marchador Horses Using High-Throughput SNP Genotyping. BMC Genom. 2021, 22, 737. [Google Scholar] [CrossRef] [PubMed]
- Wright, S. The Interpretation of Population Structure by F-Statistics with Special Regard to Systems of Mating. Evolution 1965, 19, 395. [Google Scholar] [CrossRef]
- Sabeti, P.C.; Varilly, P.; Fry, B.; Lohmueller, J.; Hostetter, E.; Cotsapas, C.; Xie, X.; Byrne, E.H.; McCarroll, S.A.; Gaudet, R.; et al. Genome-Wide Detection and Characterization of Positive Selection in Human Populations. Nature 2007, 449, 913–918. [Google Scholar] [CrossRef] [PubMed] [Green Version]
- Gautier, M.; Vitalis, R. Rehh: An R Package to Detect Footprints of Selection in Genome-Wide SNP Data from Haplotype Structure. Bioinformatics 2012, 28, 1176–1177. [Google Scholar] [CrossRef] [PubMed] [Green Version]
- Edea, Z.; Dadi, H.; Dessie, T.; Uzzaman, M.R.; Rothschild, M.F.; Kim, E.-S.; Sonstegard, T.S.; Kim, K.-S. Genome-Wide Scan Reveals Divergent Selection among Taurine and Zebu Cattle Populations from Different Regions. Anim. Genet. 2018, 49, 550–563. [Google Scholar] [CrossRef] [PubMed]
- Lim, K.-S.; Chang, S.-S.; Choi, B.-H.; Lee, S.-H.; Lee, K.-T.; Chai, H.-H.; Park, J.-E.; Park, W.; Lim, D. Genome-Wide Analysis of Allele-Specific Expression Patterns in Seventeen Tissues of Korean Cattle (Hanwoo). Animals 2019, 9, 727. [Google Scholar] [CrossRef] [Green Version]
- Silva, D.B.S.; Fonseca, L.F.S.; Pinheiro, D.G.; Magalhães, A.F.B.; Muniz, M.M.M.; Ferro, J.A.; Baldi, F.; Chardulo, L.A.L.; Schnabel, R.D.; Taylor, J.F.; et al. Spliced Genes in Muscle from Nelore Cattle and Their Association with Carcass and Meat Quality. Sci. Rep. 2020, 10, 14701. [Google Scholar] [CrossRef]
- Zhang, X.; Chu, Q.; Guo, G.; Dong, G.; Li, X.; Zhang, Q.; Zhang, S.; Zhang, Z.; Wang, Y. Genome-Wide Association Studies Identified Multiple Genetic Loci for Body Size at Four Growth Stages in Chinese Holstein Cattle. PLoS ONE 2017, 12, e0175971. [Google Scholar] [CrossRef] [Green Version]
- Zhang, Z.; Aung, Z.T.; Simmons, D.G.; Dawson, P.A. Molecular Analysis of Sequence and Splice Variants of the Human SLC13A4 Sulfate Transporter. Mol. Genet. Metab. 2017, 121, 35–42. [Google Scholar] [CrossRef] [PubMed]
- Dias, M.M.; Souza, F.R.P.; Takada, L.; Feitosa, F.L.B.; Costa, R.B.; Diaz, I.D.P.S.; Cardoso, D.F.; Tonussi, R.L.; Baldi, F.; Albuquerque, L.G.; et al. Study of Lipid Metabolism-Related Genes as Candidate Genes of Sexual Precocity in Nellore Cattle. Genet. Mol. Res. 2015, 14, 234–243. [Google Scholar] [CrossRef] [PubMed]
- Ghoreishifar, S.M.; Eriksson, S.; Johansson, A.M.; Khansefid, M.; Moghaddaszadeh-Ahrabi, S.; Parna, N.; Davoudi, P.; Javanmard, A. Signatures of Selection Reveal Candidate Genes Involved in Economic Traits and Cold Acclimation in Five Swedish Cattle Breeds. Genet. Sel. Evol. 2020, 52, 52. [Google Scholar] [CrossRef]
- An, B.; Xia, J.; Chang, T.; Wang, X.; Xu, L.; Zhang, L.; Gao, X.; Chen, Y.; Li, J.; Gao, H. Genome-Wide Association Study Reveals Candidate Genes Associated with Body Measurement Traits in Chinese Wagyu Beef Cattle. Anim. Genet. 2019, 50, 386–390. [Google Scholar] [CrossRef]
- Liu, G.E.; Brown, T.; Hebert, D.A.; Cardone, M.F.; Hou, Y.; Choudhary, R.K.; Shaffer, J.; Amazu, C.; Connor, E.E.; Ventura, M.; et al. Initial Analysis of Copy Number Variations in Cattle Selected for Resistance or Susceptibility to Intestinal Nematodes. Mamm. Genome 2011, 22, 111–121. [Google Scholar] [CrossRef]
- Low, W.Y.; Tearle, R.; Liu, R.; Koren, S.; Rhie, A.; Bickhart, D.M.; Rosen, B.D.; Kronenberg, Z.N.; Kingan, S.B.; Tseng, E.; et al. Haplotype-Resolved Genomes Provide Insights into Structural Variation and Gene Content in Angus and Brahman Cattle. Nat. Commun. 2020, 11, 2071. [Google Scholar] [CrossRef]
- Maiorano, A.M.; Lourenco, D.L.; Tsuruta, S.; Ospina, A.M.T.; Stafuzza, N.B.; Masuda, Y.; Filho, A.E.V.; dos Santos Goncalves Cyrillo, J.N.; Curi, R.A.; de Vasconcelos Silva, J.A., II. Assessing Genetic Architecture and Signatures of Selection of Dual Purpose Gir Cattle Populations Using Genomic Information. PLoS ONE 2018, 13, e0200694. [Google Scholar] [CrossRef] [Green Version]
- Chen, M.; Pan, D.; Ren, H.; Fu, J.; Li, J.; Su, G.; Wang, A.; Jiang, L.; Zhang, Q.; Liu, J.-F. Identification of Selective Sweeps Reveals Divergent Selection between Chinese Holstein and Simmental Cattle Populations. Genet. Sel. Evol. 2016, 48, 76. [Google Scholar] [CrossRef]
- Smaragdov, M.G.; Kudinov, A.A. Assessing the Power of Principal Components and Wright’s Fixation Index Analyzes Applied to Reveal the Genome-Wide Genetic Differences between Herds of Holstein Cows. BMC Genet. 2020, 21, 47. [Google Scholar] [CrossRef]
- Caivio-Nasner, S.; López-Herrera, A.; González-Herrera, L.G.; Rincón, J.C. Diversity Analysis, Runs of Homozygosity and Genomic Inbreeding Reveal Recent Selection in Blanco Orejinegro Cattle. J. Anim. Breed. Genet. 2021, 138, 613–627. [Google Scholar] [CrossRef]
- Dunner, S.; Sevane, N.; García, D.; Cortés, O.; Valentini, A.; Williams, J.L.; Mangin, B.; Cañón, J.; Levéziel, H. Association of Genes Involved in Carcass and Meat Quality Traits in 15 European Bovine Breeds. Livest. Sci. 2013, 154, 34–44. [Google Scholar] [CrossRef]
- Feitosa, F.L.B.; Pereira, A.S.C.; Mueller, L.F.; de Souza Fonseca, P.A.; Braz, C.U.; Amorin, S.; Espigolan, R.; Lemos, M.A.; de Albuquerque, L.G.; Schenkel, F.S.; et al. Genome-Wide Association Study for Beef Fatty Acid Profile Using Haplotypes in Nellore Cattle. Livest. Sci. 2021, 245, 104396. [Google Scholar] [CrossRef]
- Zhao, C.; Zan, L.; Wang, Y.; Scott Updike, M.; Liu, G.; Bequette, B.J.; Baldwin VI, R.L.; Song, J. Functional Proteomic and Interactome Analysis of Proteins Associated with Beef Tenderness in Angus Cattle. Livest. Sci. 2014, 161, 201–209. [Google Scholar] [CrossRef]
- Gill, J.L.; Bishop, S.C.; McCorquodale, C.; Williams, J.L.; Wiener, P. Associations between Single Nucleotide Polymorphisms in Multiple Candidate Genes and Carcass and Meat Quality Traits in a Commercial Angus-Cross Population. Meat Sci. 2010, 86, 985–993. [Google Scholar] [CrossRef]
- Kong, L.; Liu, G.; Deng, M.; Lian, Z.; Han, Y.; Sun, B.; Guo, Y.; Liu, D.; Li, Y. Growth Retardation-Responsive Analysis of MRNAs and Long Noncoding RNAs in the Livr Tissue of Leiqiong Cattle. Sci. Rep. 2020, 10, 14254. [Google Scholar] [CrossRef] [PubMed]
- Liu, X.; Li, Z.; Yan, Y.; Li, Y.; Wu, H.; Pei, J.; Yan, P.; Yang, R.; Guo, X.; Lan, X. Selection and Introgression Facilitated the Adaptation of Chinese Native Endangered Cattle in Extreme Environments. Evol. Appl. 2021, 14, 860–873. [Google Scholar] [CrossRef]
- Luo, Y.; Zhang, R.; Gao, J.; Wang, Y.; Zhang, W.; Qing, S. The Localization and Expression of Epidermal Growth Factor and Epidermal Growth Factor Receptor in Bovine Ovary during Oestrous Cycle. Reprod. Domest. Anim. 2020, 55, 822–832. [Google Scholar] [CrossRef]
- Sugimura, S.; Richani, D.; Gilchrist, R.B. Follicular Guidance for Oocyte Developmental Competence. Anim. Reprod. 2018, 15, 721–726. [Google Scholar] [CrossRef]
- Steele, M.A.; Schiestel, C.; AlZahal, O.; Dionissopoulos, L.; Laarman, A.H.; Matthews, J.C.; McBride, B.W. The Periparturient Period Is Associated with Structural and Transcriptomic Adaptations of Rumen Papillae in Dairy Cattle. J. Dairy Sci. 2015, 98, 2583–2595. [Google Scholar] [CrossRef]
- Tahir, M.S.; Porto-Neto, L.R.; Gondro, C.; Shittu, O.B.; Wockner, K.; Tan, A.W.L.; Smith, H.R.; Gouveia, G.C.; Kour, J.; Fortes, M.R.S. Meta-Analysis of Heifer Traits Identified Reproductive Pathways in Bos Indicus Cattle. Genes 2021, 12, 768. [Google Scholar] [CrossRef]
- Yu, S.L.; Chung, H.J.; Sang, B.C.; Park, C.S.; Lee, J.H.; Yoon, D.H.; Lee, S.H.; Choi, K.D. Identification of Differentially Expressed Genes in Distinct Skeletal Muscles in Cattle Using CDNA Microarray. Anim. Biotechnol. 2007, 18, 275–285. [Google Scholar] [CrossRef] [PubMed]
- Wei, C.; Wang, H.; Liu, G.; Zhao, F.; Kijas, J.W.; Ma, Y.; Lu, J.; Zhang, L.; Cao, J.; Wu, M.; et al. Genome-Wide Analysis Reveals Adaptation to High Altitudes in Tibetan Sheep. Sci. Rep. 2016, 6, 26770. [Google Scholar] [CrossRef] [PubMed] [Green Version]


Publisher’s Note: MDPI stays neutral with regard to jurisdictional claims in published maps and institutional affiliations. |
© 2022 by the authors. Licensee MDPI, Basel, Switzerland. This article is an open access article distributed under the terms and conditions of the Creative Commons Attribution (CC BY) license (https://creativecommons.org/licenses/by/4.0/).
Share and Cite
Toro-Ospina, A.M.; Herrera Rios, A.C.; Bizarria Santos, W.; Pimenta Schettini, G.; Vallejo Aristizabal, V.H.; Tovar Claros, G.; Morea, E.G.O. Genetic Architecture and Signatures of Selection in the Caqueteño Creole (Colombian Native Cattle). Diversity 2022, 14, 828. https://doi.org/10.3390/d14100828
Toro-Ospina AM, Herrera Rios AC, Bizarria Santos W, Pimenta Schettini G, Vallejo Aristizabal VH, Tovar Claros G, Morea EGO. Genetic Architecture and Signatures of Selection in the Caqueteño Creole (Colombian Native Cattle). Diversity. 2022; 14(10):828. https://doi.org/10.3390/d14100828
Chicago/Turabian StyleToro-Ospina, Alejandra M., Ana C. Herrera Rios, Wellington Bizarria Santos, Gustavo Pimenta Schettini, Viviana H. Vallejo Aristizabal, Gilberto Tovar Claros, and Edna Gicela Ortiz Morea. 2022. "Genetic Architecture and Signatures of Selection in the Caqueteño Creole (Colombian Native Cattle)" Diversity 14, no. 10: 828. https://doi.org/10.3390/d14100828