Contrast-Enhanced Spectral Mammography Assessment of Patients Treated with Neoadjuvant Chemotherapy for Breast Cancer

 , , , , ,
  ,
,  , and
, and 
Abstract
:1. Introduction
2. Materials and Methods
2.1. Neoadjuvant Systemic Therapy
2.2. CESM Examination
2.3. Imaging Interpretation
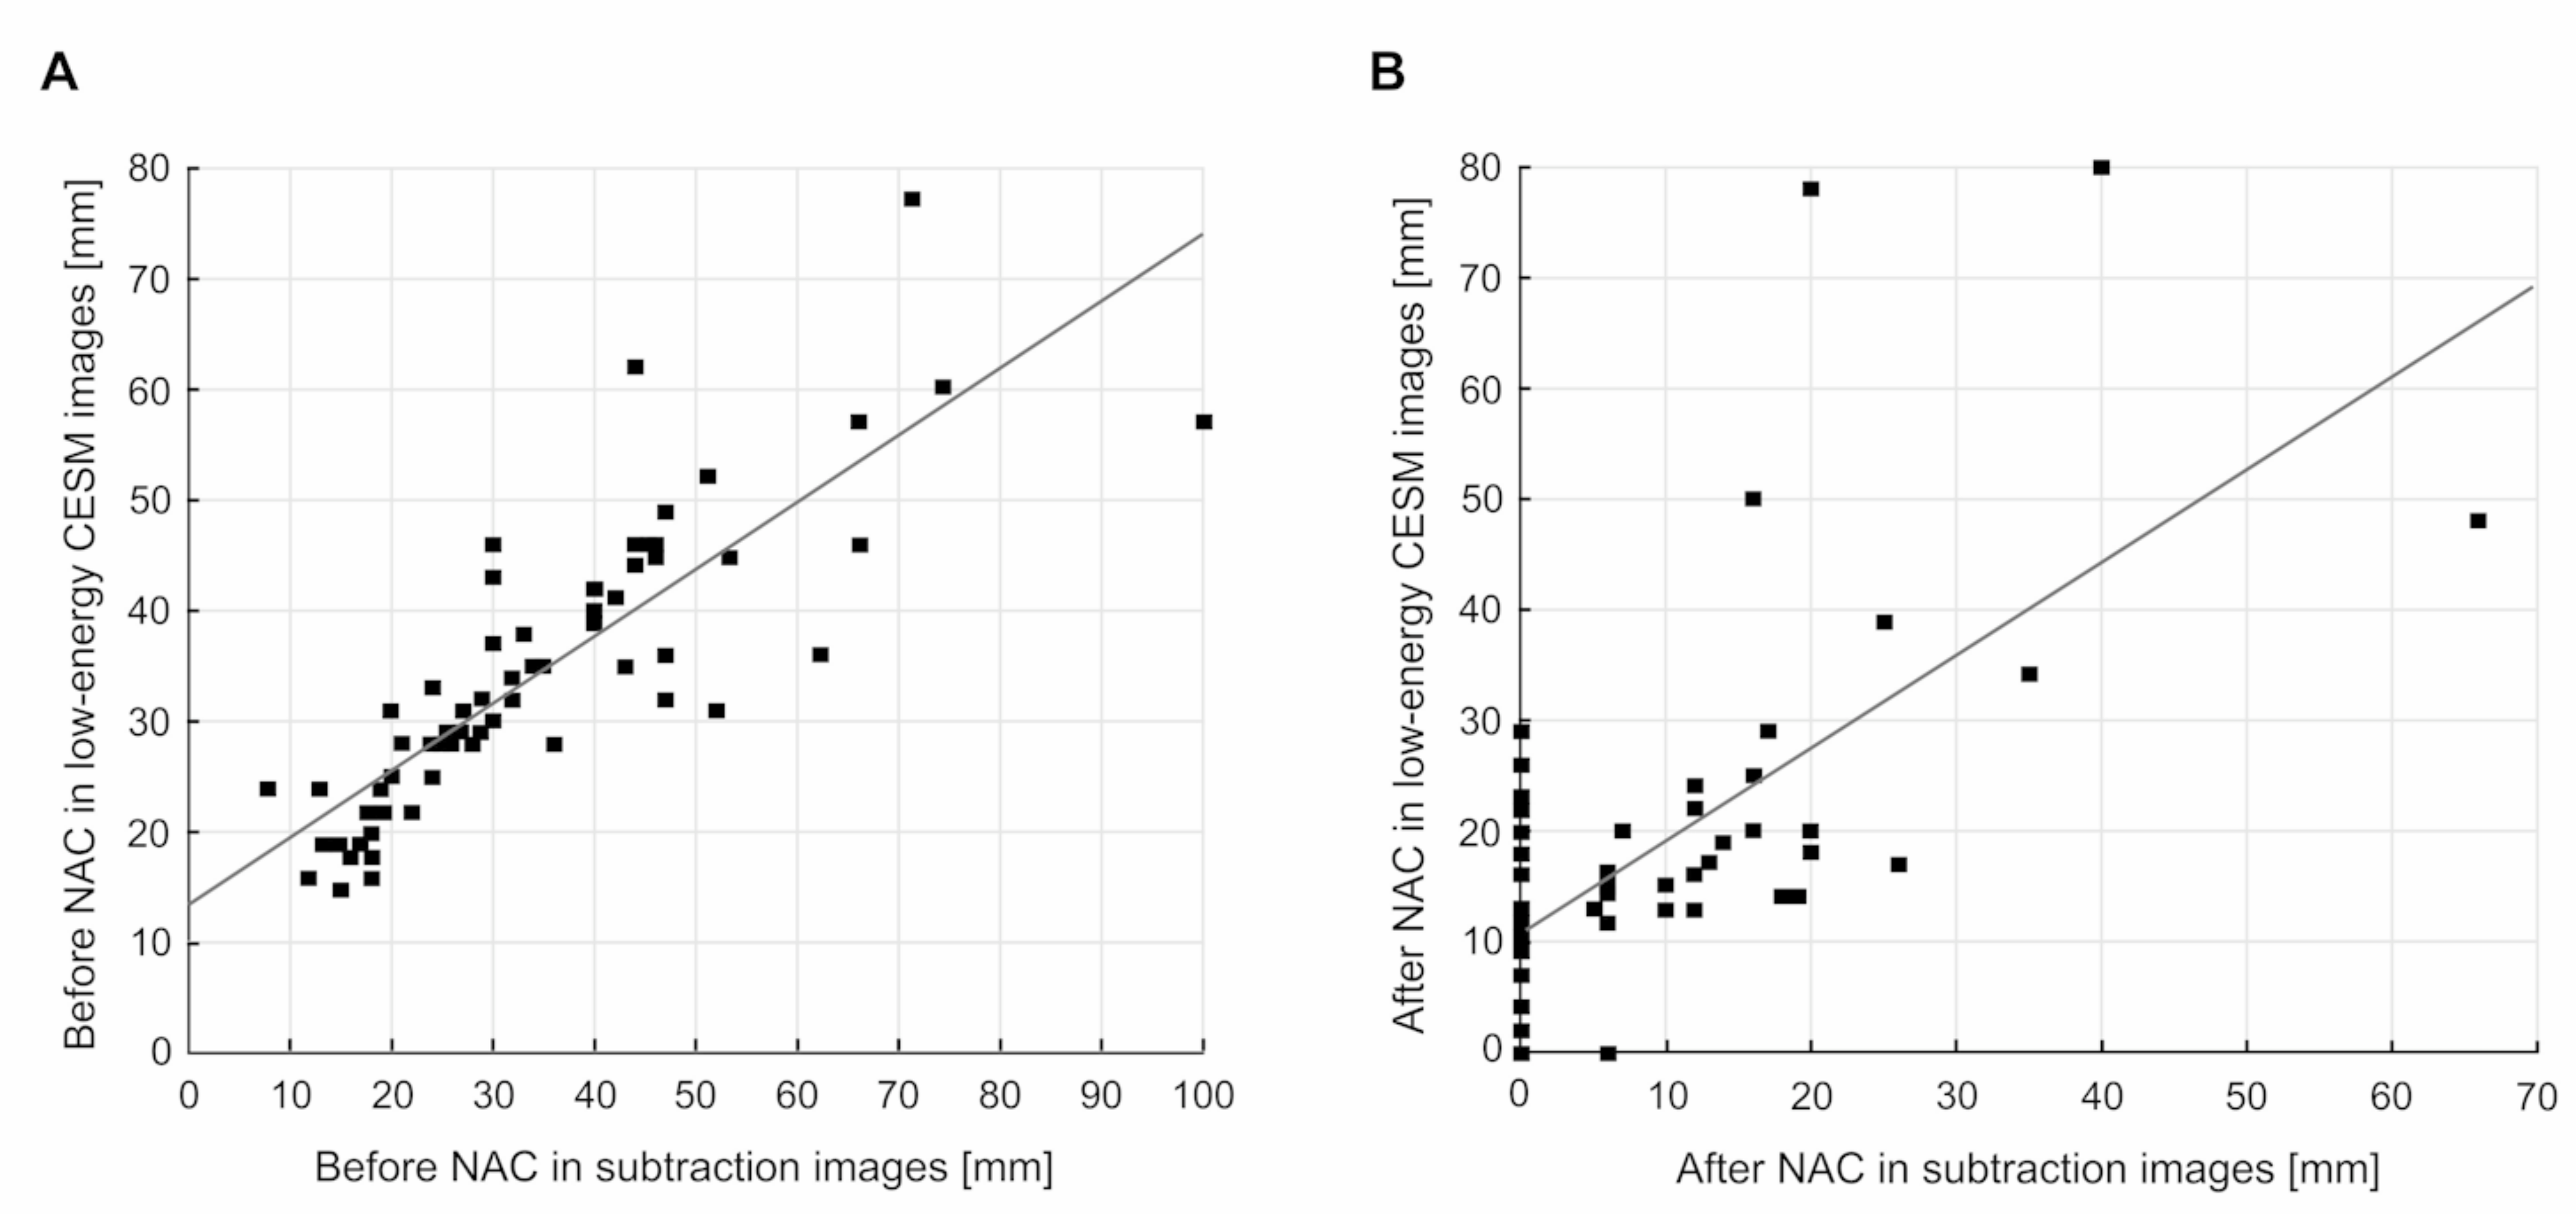
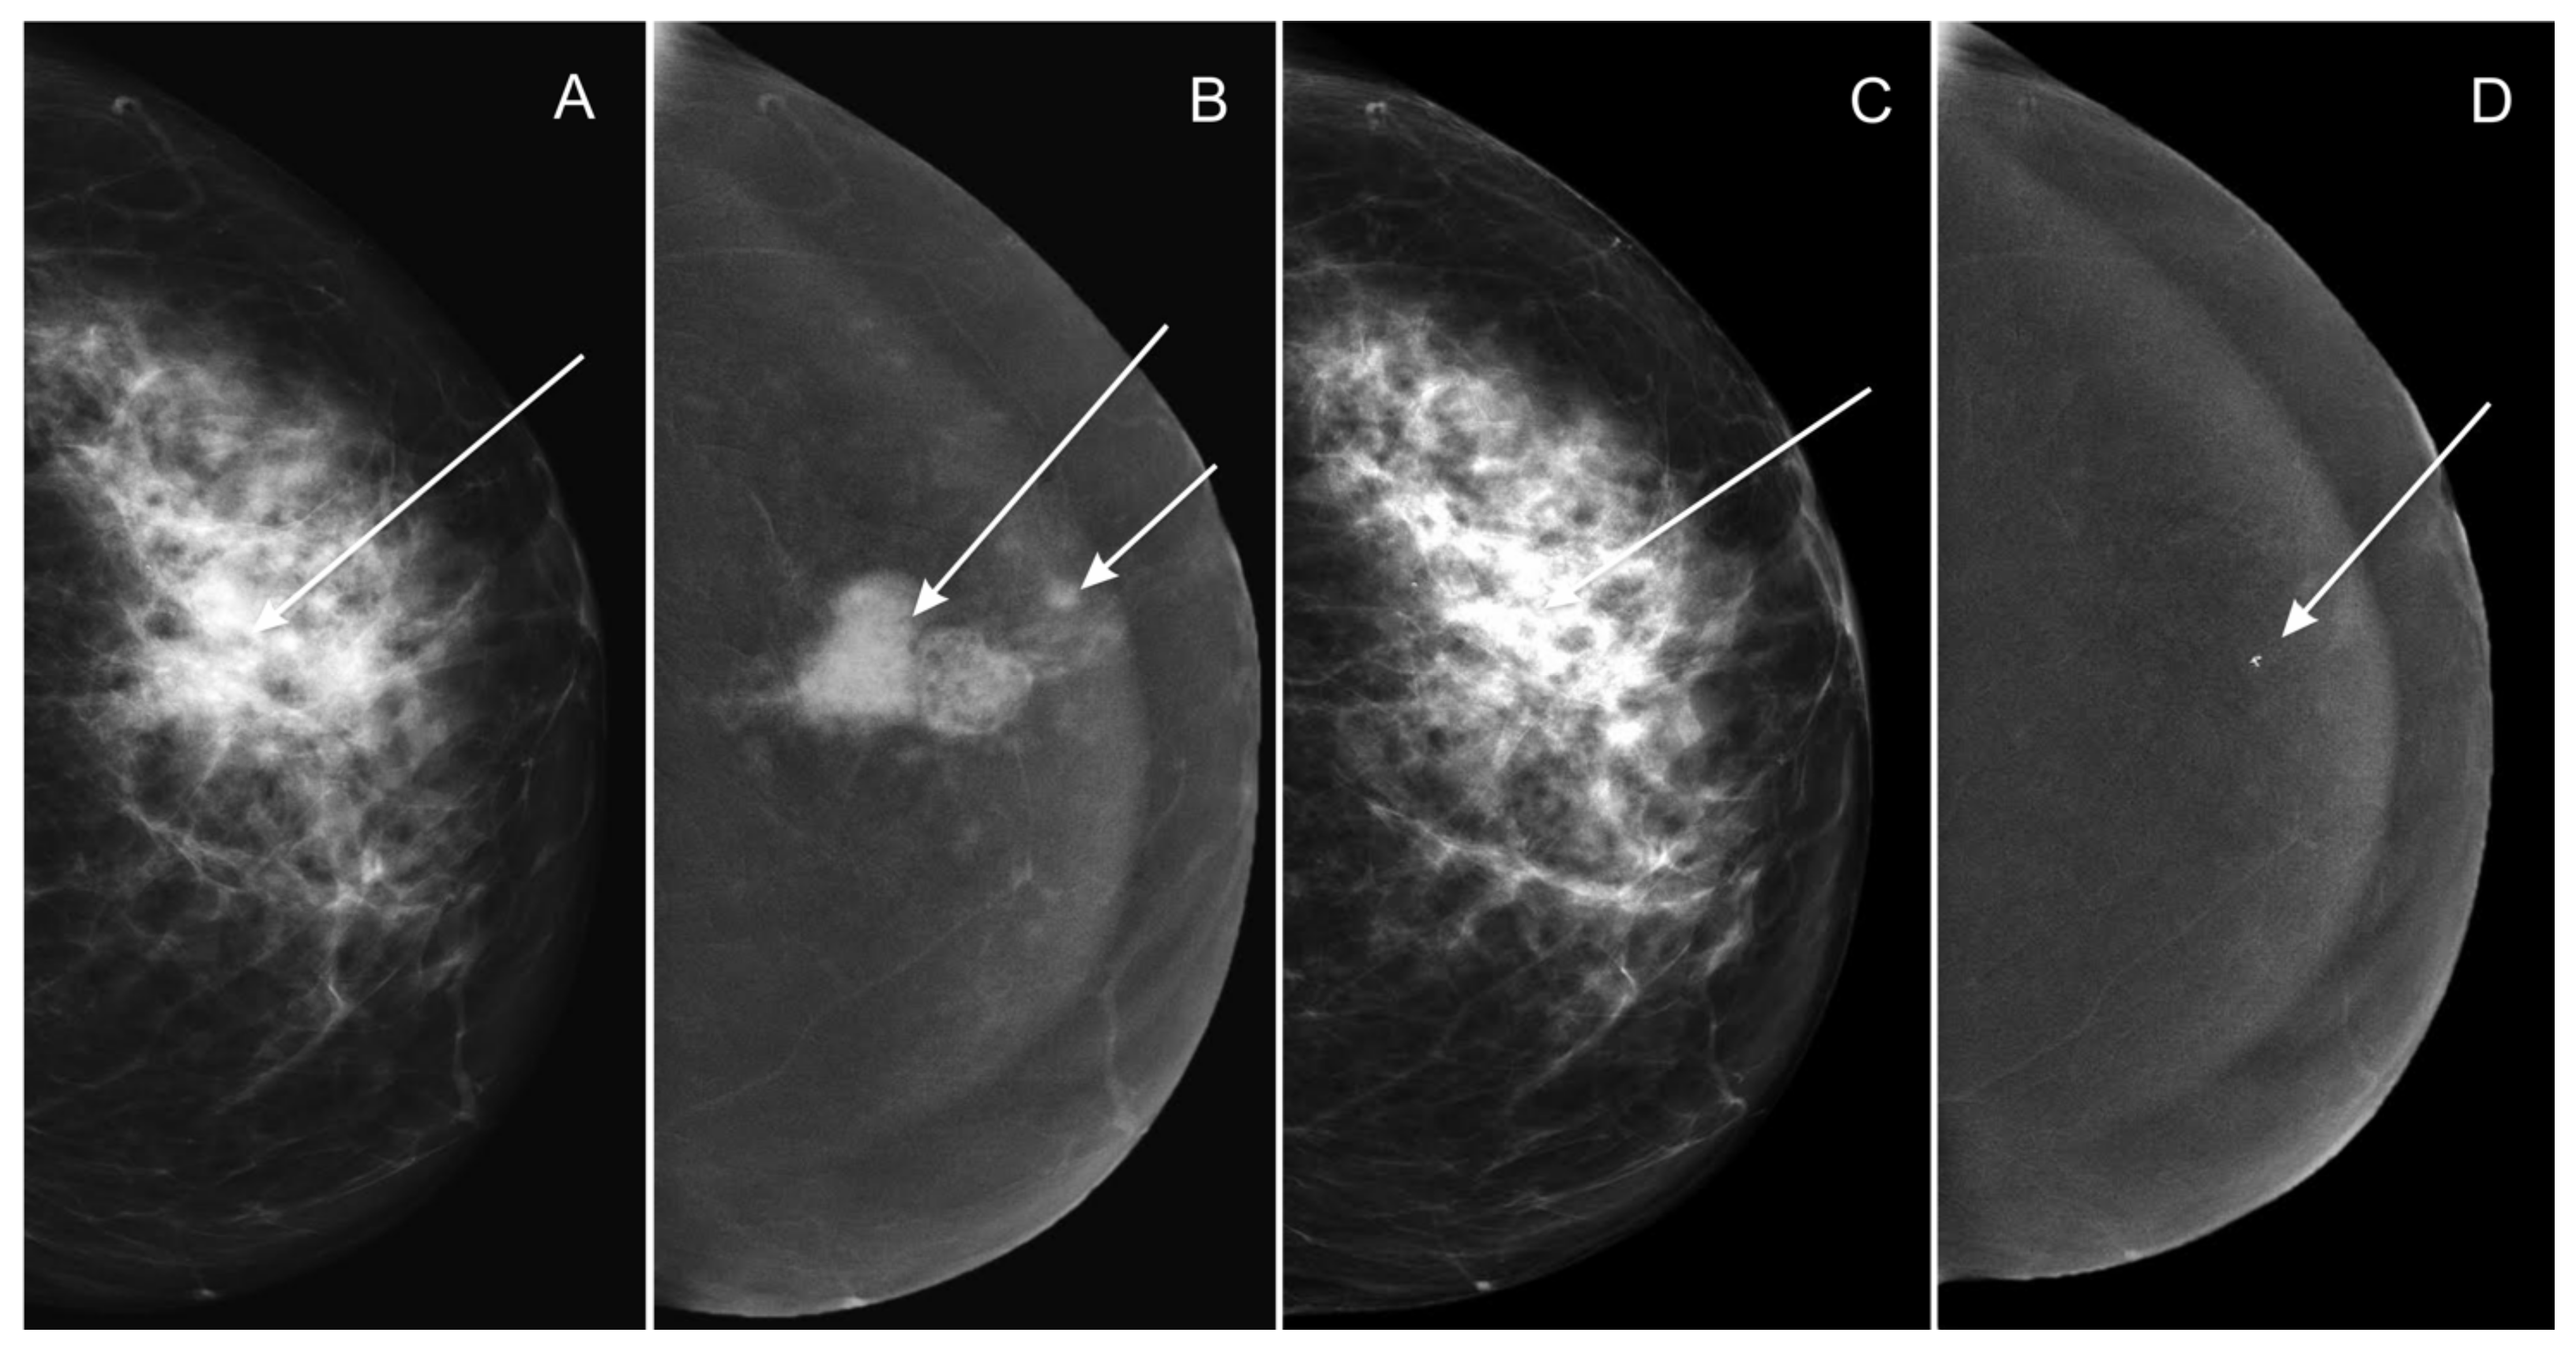
- Low-energy images from two consecutive contrast-enhanced spectral mammograms (taken before the start and at completion of neoadjuvant chemotherapy);
- Subtraction images from two consecutive contrast-enhanced spectral mammograms (taken before the start and at completion of neoadjuvant chemotherapy).
2.4. Histopathological Examination
2.5. Statistical Analysis
3. Results
4. Discussion
5. Conclusions
Author Contributions
Funding
Institutional Review Board Statement
Informed Consent Statement
Data Availability Statement
Conflicts of Interest
References
- Gradishar, W.J.; Anderson, B.O.; Balassanian, R.; Blair, S.L.; Burstein, H.J.; Cyr, A.; Elias, A.D.; Farrar, W.B.; Forero, A.; Giordano, S.H.; et al. Breast Cancer, Version 4.2017, NCCN Clinical Practice Guidelines in Oncology. J. Natl. Compr. Cancer Netw. 2018, 16, 310–320. [Google Scholar] [CrossRef] [PubMed]
- Cancer Research UK. Cancer Statistics. Breast Cancer. 2017. Available online: http://www.cancerresearchuk.org/health-professional/cancer-statistics/statistics-by-cancer-type/breast-cancer (accessed on 6 July 2021).
- Gao, W.; Guo, N.; Dong, T. Diffusion-Weighted Imaging in Monitoring the Pathological Response to Neoadjuvant Chemotherapy in Patients with Breast Cancer: A Meta-Analysis. World J. Surg. Oncol. 2018, 16, 145. [Google Scholar] [CrossRef] [Green Version]
- Masuda, N.; Lee, S.-J.; Ohtani, S.; Im, Y.-H.; Lee, E.-S.; Yokota, I.; Kuroi, K.; Im, S.-A.; Park, B.-W.; Kim, S.-B.; et al. Adjuvant Capecitabine for Breast Cancer after Preoperative Chemotherapy. N. Engl. J. Med. 2017, 376, 2147–2159. [Google Scholar] [CrossRef] [PubMed]
- Curigliano, G.; Burstein, H.J.; Winer, E.P.; Gnant, M.; Dubsky, P.; Loibl, S.; Colleoni, M.; Regan, M.M.; Piccart-Gebhart, M.; Senn, H.-J.; et al. De-Escalating and Escalating Treatments for Early-Stage Breast Cancer: The St. Gallen International Expert Consensus Conference on the Primary Therapy of Early Breast Cancer 2017. Ann. Oncol. 2017, 28, 1700–1712. [Google Scholar] [CrossRef] [PubMed]
- Cardoso, F.; Kyriakides, S.; Ohno, S.; Penault-Llorca, F.; Poortmans, P.; Rubio, I.T.; Zackrisson, S.; Senkus, E. Early Breast Cancer: ESMO Clinical Practice Guidelines for Diagnosis, Treatment and Follow-Up. Ann. Oncol. 2019, 30, 1194–1220. [Google Scholar] [CrossRef] [PubMed] [Green Version]
- Ditsch, N.; Untch, M.; Thill, M.; Müller, V.; Janni, W.; Albert, U.-S.; Bauerfeind, I.; Blohmer, J.; Budach, W.; Dall, P.; et al. AGO Recommendations for the Diagnosis and Treatment of Patients with Early Breast Cancer: Update 2019. Breast Care 2019, 14, 224–245. [Google Scholar] [CrossRef] [Green Version]
- Korde, L.A.; Somerfield, M.R.; Carey, L.A.; Crews, J.R.; Denduluri, N.; Hwang, E.S.; Khan, S.A.; Loibl, S.; Morris, E.A.; Perez, A.; et al. Neoadjuvant Chemotherapy, Endocrine Therapy, and Targeted Therapy for Breast Cancer: ASCO Guideline. J. Clin. Oncol. Off. J. Am. Soc. Clin. Oncol. 2021, 39, 1485–1505. [Google Scholar] [CrossRef]
- Morigi, C. Highlights of the 16th St Gallen International Breast Cancer Conference, Vienna, Austria, 20–23 March 2019: Personalised Treatments for Patients with Early Breast Cancer. Ecancermedicalscience 2019, 13, 924. [Google Scholar] [CrossRef]
- Bevers, T.B.; Helvie, M.; Bonaccio, E.; Calhoun, K.E.; Daly, M.B.; Farrar, W.B.; Garber, J.E.; Gray, R.; Greenberg, C.C.; Greenup, R.; et al. Breast Cancer Screening and Diagnosis, Version 3.2018, NCCN Clinical Practice Guidelines in Oncology. J. Natl. Compr. Cancer Netw. 2018, 16, 1362–1389. [Google Scholar] [CrossRef] [Green Version]
- Werutsky, G.; Untch, M.; Hanusch, C.; Fasching, P.A.; Blohmer, J.-U.; Seiler, S.; Denkert, C.; Tesch, H.; Jackisch, C.; Gerber, B.; et al. Locoregional Recurrence Risk after Neoadjuvant Chemotherapy: A Pooled Analysis of Nine Prospective Neoadjuvant Breast Cancer Trials. Eur. J. Cancer 2020, 130, 92–101. [Google Scholar] [CrossRef]
- United States Food and Drug Administration. Pathological Complete Response in Neoadjuvant Treatment of High-Risk Early-Stage Breast Cancer: Use as an Endpoint to Support Accelerated Approval Guidance for Industry. Available online: https://www.fda.gov/regulatory-information/search-fda-guidance-documents/pathological-complete-response-neoadjuvant-treatment-high-risk-early-stage-breast-cancer-use (accessed on 10 July 2021).
- Colleoni, M.; Goldhirsch, A. Neoadjuvant Chemotherapy for Breast Cancer: Any Progress? Lancet Oncol. 2014, 15, 131–132. [Google Scholar] [CrossRef] [Green Version]
- Vaidya, J.S.; Massarut, S.; Vaidya, H.J.; Alexander, E.C.; Richards, T.; Caris, J.A.; Sirohi, B.; Tobias, J.S. Rethinking Neoadjuvant Chemotherapy for Breast Cancer. BMJ 2018, 360, j5913. [Google Scholar] [CrossRef] [PubMed]
- Coleman, W.B.; Anders, C.K. Discerning Clinical Responses in Breast Cancer Based on Molecular Signatures. Am. J. Pathol. 2017, 187, 2199–2207. [Google Scholar] [CrossRef] [PubMed] [Green Version]
- Moo, T.-A.; Sanford, R.; Dang, C.; Morrow, M. Overview of Breast Cancer Therapy. PET Clin. 2018, 13, 339–354. [Google Scholar] [CrossRef] [PubMed]
- Wang, H.; Mao, X. Evaluation of the Efficacy of Neoadjuvant Chemotherapy for Breast Cancer. Drug Des. Dev. Ther. 2020, 14, 2423–2433. [Google Scholar] [CrossRef] [PubMed]
- Choi, W.J.; Kim, H.H.; Cha, J.H.; Shin, H.J.; Chae, E.Y. Comparison of Pathologic Response Evaluation Systems After Neoadjuvant Chemotherapy in Breast Cancers: Correlation with Computer-Aided Diagnosis of MRI Features. Am. J. Roentgenol. 2019, 213, 944–952. [Google Scholar] [CrossRef]
- Taydas, O.; Durhan, G.; Akpinar, M.G.; Basaran Demirkazik, F. Comparison of MRI and US in Tumor Size Evaluation of Breast Cancer Patients Receiving Neoadjuvant Chemotherapy. Eur. J. Breast Health 2019, 15, 119–124. [Google Scholar] [CrossRef]
- Negrão, E.M.S.; Souza, J.A.; Marques, E.F.; Bitencourt, A.G.V. Breast Cancer Phenotype Influences MRI Response Evaluation after Neoadjuvant Chemotherapy. Eur. J. Radiol. 2019, 120, 108701. [Google Scholar] [CrossRef]
- Goorts, B.; Dreuning, K.M.A.; Houwers, J.B.; Kooreman, L.F.S.; Boerma, E.-J.G.; Mann, R.M.; Lobbes, M.B.I.; Smidt, M.L. MRI-Based Response Patterns during Neoadjuvant Chemotherapy Can Predict Pathological (Complete) Response in Patients with Breast Cancer. Breast Cancer Res. 2018, 20, 34. [Google Scholar] [CrossRef]
- Yoshikawa, K.; Ishida, M.; Kan, N.; Yanai, H.; Tsuta, K.; Sekimoto, M.; Sugie, T. Direct Comparison of Magnetic Resonance Imaging and Pathological Shrinkage Patterns of Triple-Negative Breast Cancer after Neoadjuvant Chemotherapy. World J. Surg. Onc. 2020, 18, 177. [Google Scholar] [CrossRef]
- Vriens, B.E.P.J.; de Vries, B.; Lobbes, M.B.I.; van Gastel, S.M.; van den Berkmortel, F.W.P.J.; Smilde, T.J.; van Warmerdam, L.J.C.; de Boer, M.; van Spronsen, D.J.; Smidt, M.L.; et al. Ultrasound Is at Least as Good as Magnetic Resonance Imaging in Predicting Tumour Size Post-Neoadjuvant Chemotherapy in Breast Cancer. Eur. J. Cancer 2016, 52, 67–76. [Google Scholar] [CrossRef]
- Lalji, U.C.; Jeukens, C.R.L.P.N.; Houben, I.; Nelemans, P.J.; van Engen, R.E.; van Wylick, E.; Beets-Tan, R.G.H.; Wildberger, J.E.; Paulis, L.E.; Lobbes, M.B.I. Evaluation of Low-Energy Contrast-Enhanced Spectral Mammography Images by Comparing Them to Full-Field Digital Mammography Using EUREF Image Quality Criteria. Eur. Radiol. 2015, 25, 2813–2820. [Google Scholar] [CrossRef]
- Jochelson, M.S.; Lobbes, M.B.I. Contrast-Enhanced Mammography: State of the Art. Radiology 2021, 299, 36–48. [Google Scholar] [CrossRef]
- Xing, D.; Lv, Y.; Sun, B.; Xie, H.; Dong, J.; Hao, C.; Chen, Q.; Chi, X. Diagnostic Value of Contrast-Enhanced Spectral Mammography in Comparison to Magnetic Resonance Imaging in Breast Lesions. J. Comput. Assist. Tomogr. 2019, 43, 245–251. [Google Scholar] [CrossRef] [PubMed]
- Fallenberg, E.M.; Schmitzberger, F.F.; Amer, H.; Ingold-Heppner, B.; Balleyguier, C.; Diekmann, F.; Engelken, F.; Mann, R.M.; Renz, D.M.; Bick, U.; et al. Contrast-Enhanced Spectral Mammography vs. Mammography and MRI—Clinical Performance in a Multi-Reader Evaluation. Eur. Radiol. 2017, 27, 2752–2764. [Google Scholar] [CrossRef] [PubMed]
- Hobbs, M.M.; Taylor, D.B.; Buzynski, S.; Peake, R.E. Contrast-Enhanced Spectral Mammography (CESM) and Contrast Enhanced MRI (CEMRI): Patient Preferences and Tolerance: CESM and CEMRI Preferences and Tolerance. J. Med. Imaging Radiat. Oncol. 2015, 59, 300–305. [Google Scholar] [CrossRef] [PubMed]
- Sardanelli, F.; Fallenberg, E.M.; Clauser, P.; Trimboli, R.M.; Camps-Herrero, J.; Helbich, T.H.; Forrai, G.; for the European Society of Breast Imaging (EUSOBI), with Language Review by Europa Donna—The European Breast Cancer Coalition. Mammography: An Update of the EUSOBI Recommendations on Information for Women. Insights Imaging 2017, 8, 11–18. [Google Scholar] [CrossRef] [Green Version]
- La Forgia, D.; Catino, A.; Dentamaro, R.; Galetta, D.; Gatta, G.; Losurdo, L.; Massafra, R.; Scattone, A.; Tangaro, S.; Fanizzi, A. Role of the contrast-enhanced spectral mammography for the diagnosis of breast metastases from extramammary neoplasms. J. BUON 2019, 24, 1360–1366. [Google Scholar] [PubMed]
- Fanizzi, A.; Losurdo, L.; Basile, T.M.A.; Bellotti, R.; Bottigli, U.; Delogu, P.; Diacono, D.; Didonna, V.; Fausto, A.; Lombardi, A.; et al. Fully Automated Support System for Diagnosis of Breast Cancer in Contrast-Enhanced Spectral Mammography Images. J. Clin. Med. 2019, 8, 891. [Google Scholar] [CrossRef] [PubMed] [Green Version]
- Litière, S.; Collette, S.; de Vries, E.G.E.; Seymour, L.; Bogaerts, J. RECIST—Learning from the Past to Build the Future. Nat. Rev. Clin. Oncol. 2017, 14, 187–192. [Google Scholar] [CrossRef]
- Cortazar, P.; Zhang, L.; Untch, M.; Mehta, K.; Costantino, J.P.; Wolmark, N.; Bonnefoi, H.; Cameron, D.; Gianni, L.; Valagussa, P.; et al. Pathological Complete Response and Long-Term Clinical Benefit in Breast Cancer: The CTNeoBC Pooled Analysis. Lancet 2014, 384, 164–172. [Google Scholar] [CrossRef] [Green Version]
- Ahmed, S.H. Safety of neoadjuvant chemotherapy for the treatment of breast cancer. Expert Opin. Drug Saf. 2019, 18, 817–827. [Google Scholar] [CrossRef]
- Patel, B.K.; Hilal, T.; Covington, M.; Zhang, N.; Kosiorek, H.E.; Lobbes, M.; Northfelt, D.W.; Pockaj, B.A. Contrast-enhanced spectral mammography is comparable to mri in the assessment of residual breast cancer following neoadjuvant systemic therapy. Ann. Surg. Oncol. 2018, 25, 1350–1356. [Google Scholar] [CrossRef]
- Iotti, V.; Ravaioli, S.; Vacondio, R.; Coriani, C.; Caffarri, S.; Sghedoni, R.; Nitrosi, A.; Ragazzi, M.; Gasparini, E.; Masini, C.; et al. Contrast-enhanced spectral mammography in neoadjuvant chemotherapy monitoring: A comparison with breast magnetic resonance imaging. Breast Cancer Res. 2017, 19, 106. [Google Scholar] [CrossRef] [PubMed]
- Barra, F.R.; Sobrinho, A.B.; Barra, R.R.; Magalhães, M.T.; Aguiar, L.R.; de Albuquerque, G.F.L.; Costa, R.P.; Farage, L.; Pratesi, R. Contrast-enhanced mammography (CEM) for detecting residual disease after neoadjuvant chemotherapy: A comparison with breast magnetic resonance imaging (MRI). BioMed Res. Int. 2018, 2018, 8531916. [Google Scholar] [CrossRef] [PubMed]
- Tang, S.; Xiang, C.; Yang, Q. The Diagnostic Performance of CESM and CE-MRI in Evaluating the Pathological Response to Neoadjuvant Therapy in Breast Cancer: A Systematic Review and Meta-Analysis. Br. J. Radiol. 2020, 93, 20200301. [Google Scholar] [CrossRef]
- Fowler, A.M.; Mankoff, D.A.; Joe, B.N. Imaging Neoadjuvant Therapy Response in Breast Cancer. Radiology 2017, 285, 358–375. [Google Scholar] [CrossRef] [Green Version]
- Fasching, P.A.; Gass, P.; Hein, A. Neoadjuvant Treatment of Breast Cancer—Advances and Limitations. Breast Care 2016, 11, 313–314. [Google Scholar] [CrossRef] [Green Version]
- Xing, D.; Mao, N.; Dong, J.; Ma, H.; Chen, Q.; Lv, Y. Quantitative Analysis of Contrast Enhanced Spectral Mammography Grey Value for Early Prediction of Pathological Response of Breast Cancer to Neoadjuvant Chemotherapy. Sci. Rep. 2021, 11, 5892. [Google Scholar] [CrossRef]
- Moustafa, A.F.I.; Kamal, R.M.; Gomaa, M.M.M.; Mostafa, S.; Mubarak, R.; El-Adawy, M. Quantitative Mathematical Objective Evaluation of Contrast-Enhanced Spectral Mammogram in the Assessment of Response to Neoadjuvant Chemotherapy and Prediction of Residual Disease in Breast Cancer. Egypt. J. Radiol. Nucl. Med. 2019, 50, 44. [Google Scholar] [CrossRef]
- Massafra, R.; Bove, S.; Lorusso, V.; Biafora, A.; Comes, M.C.; Didonna, V.; Diotaiuti, S.; Fanizzi, A.; Nardone, A.; Nolasco, A.; et al. Radiomic Feature Reduction Approach to Predict Breast Cancer by Contrast-Enhanced Spectral Mammography Images. Diagnostics 2021, 11, 684. [Google Scholar] [CrossRef]
- Wang, Z.; Lin, F.; Ma, H.; Shi, Y.; Dong, J.; Yang, P.; Zhang, K.; Guo, N.; Zhang, R.; Cui, J.; et al. Contrast-Enhanced Spectral Mammography-Based Radiomics Nomogram for the Prediction of Neoadjuvant Chemotherapy-Insensitive Breast Cancers. Front. Oncol. 2021, 11, 605230. [Google Scholar] [CrossRef]
- Conti, A.; Duggento, A.; Indovina, I.; Guerrisi, M.; Toschi, N. Radiomics in Breast Cancer Classification and Prediction. Semin. Cancer Biol. 2021, 72, 238–250. [Google Scholar] [CrossRef]
- La Forgia, D.; Vestito, A.; Lasciarrea, M.; Comes, M.C.; Diotaiuti, S.; Giotta, F.; Latorre, A.; Lorusso, V.; Massafra, R.; Palmiotti, G.; et al. Response Predictivity to Neoadjuvant Therapies in Breast Cancer: A Qualitative Analysis of Background Parenchymal Enhancement in DCE-MRI. J. Pers. Med. 2021, 11, 256. [Google Scholar] [CrossRef] [PubMed]
- Teixeira, S.R.C.; de Camargo Júnior, H.S.A.; Cabello, C. Background Parenchymal Enhancement: Behavior during Neoadjuvant Chemotherapy for Breast Cancer and Relationship with a Pathological Complete Response. Radiol. Bras. 2020, 53, 95–104. [Google Scholar] [CrossRef] [PubMed]
- Arasu, V.A.; Miglioretti, D.L.; Sprague, B.L.; Alsheik, N.H.; Buist, D.S.M.; Henderson, L.M.; Herschorn, S.D.; Lee, J.M.; Onega, T.; Rauscher, G.H.; et al. Population-Based Assessment of the Association Between Magnetic Resonance Imaging Background Parenchymal Enhancement and Future Primary Breast Cancer Risk. J. Clin. Oncol. 2019, 37, 954–963. [Google Scholar] [CrossRef] [PubMed]
- Lorek, A.; Steinhof-Radwańska, K.; Barczyk-Gutkowska, A.; Zarębski, W.; Paleń, P.; Szyluk, K.; Lorek, J.; Grażyńska, A.; Niemiec, P.; Gisterek, I. The Usefulness of Spectral Mammography in Surgical Planning of Breast Cancer Treatment—Analysis of 999 Patients with Primary Operable Breast Cancer. Curr. Oncol. 2021, 28, 232. [Google Scholar] [CrossRef] [PubMed]
- Alexander, S.; Dulku, G.; Hashoul, S.; Taylor, D.B. Practical Uses of Contrast-enhanced Spectral Mammography in Daily Work: A Pictorial Review. J. Med. Imaging Radiat. Oncol. 2019, 63, 473–478. [Google Scholar] [CrossRef]
- Richter, V.; Hatterman, V.; Preibsch, H.; Bahrs, S.D.; Hahn, M.; Nikolaou, K.; Wiesinger, B. Contrast-Enhanced Spectral Mammography in Patients with MRI Contraindications. Acta Radiol. 2018, 59, 798–805. [Google Scholar] [CrossRef]
- Iotti, V.; Ragazzi, M.; Besutti, G.; Marchesi, V.; Ravaioli, S.; Falco, G.; Coiro, S.; Bisagni, A.; Gasparini, E.; Giorgi Rossi, P.; et al. Accuracy and Reproducibility of Contrast-Enhanced Mammography in the Assessment of Response to Neoadjuvant Chemotherapy in Breast Cancer Patients with Calcifications in the Tumor Bed. Diagnostics 2021, 11, 435. [Google Scholar] [CrossRef]


| Characteristics | Number | Percentage |
|---|---|---|
| Number of Patients | 63 | 100% |
| Age, years (median ± SD) | 53.32 ± 9.47 | - |
| Menopause | ||
| Before | 27 | 42.86 |
| After | 36 | 57.14 |
| Molecular characteristics | ||
| LumA | 5 | 8.06 |
| LumB | 34 | 54.84 |
| TNBC1-Jan | 24 | 38.71 |
| Type of tumor | ||
| Mixed IDC/ILC | 6 | 9.50 |
| ILC | 6 | 9.50 |
| IDC | 51 | 80.95 |
| TNM stage upon diagnosis | ||
| T1N+ | 2 | 3.17 |
| T2N0 | 13 | 20.63 |
| T2N+ | 13 | 20.63 |
| T3N0 | 11 | 17.46 |
| T3N+ | 16 | 25.40 |
| T4N0 | 3 | 4.76 |
| T4N+ | 5 | 7.94 |
| Minimal Dimension | Maximal Dimension | Mean ± SD | |
|---|---|---|---|
| PL-E CESM (mm) | 15.0 | 77.0 | 34.4 ± 12.6 |
| NL-E CESM (mm) | 0.0 | 80.0 | 17.6 ± 15.4 |
| PS CESM (mm) | 8.0 | 100.0 | 34.3 ± 17.4 |
| NS CESM (mm) | 0.0 | 66.0 | 8.5 ± 12.0 |
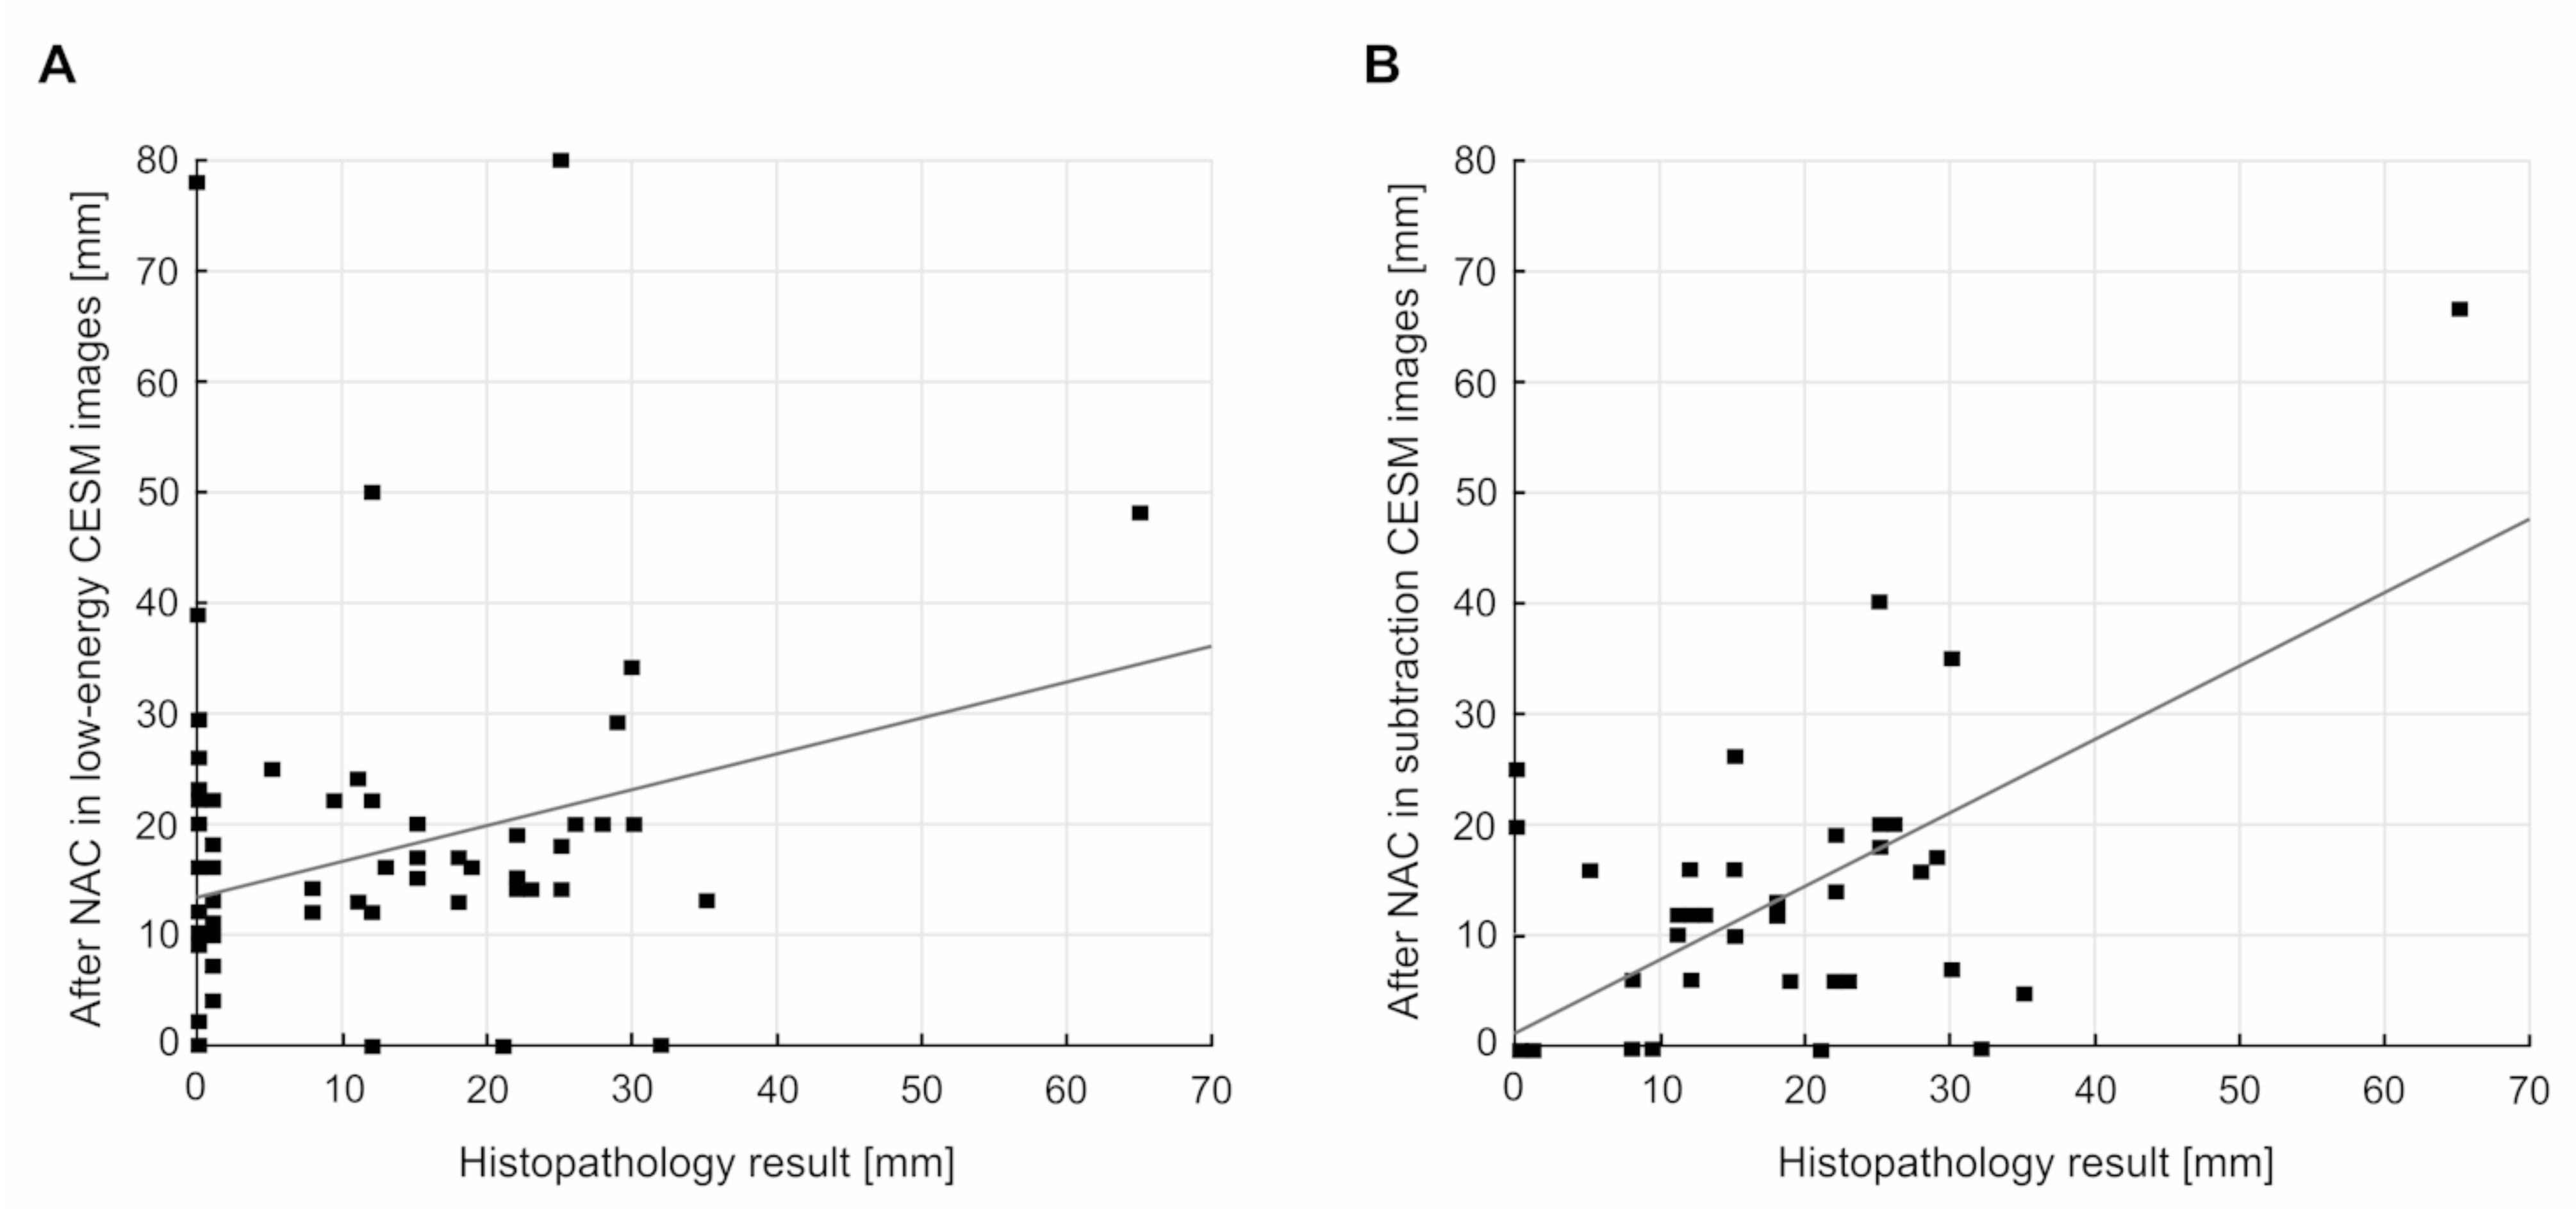
| NHP (mm) | 0.0 | 65.0 | 11.1 ± 12.8 |
| Low-Energy Images | Subtraction Images | |||
|---|---|---|---|---|
| n | % | n | % | |
| CR | 10 | 15.87 | 30 | 47.62 |
| PR | 43 | 68.25 | 31 | 49.20 |
| SD | 9 | 14.29 | 2 | 3.17 |
| PD | 1 | 1.59 | 0 | 0 |
| Pathological Response to NAC | IDC (n = 51) | Mixed IDC/ILC (n = 6) | ILC (n = 6) | ||||||
|---|---|---|---|---|---|---|---|---|---|
| Low- Energy CESM Images | Subtraction CESM Images | HP | Low-Energy CESM Images | Subtraction CESM Images | HP | Low-Energy CESM Images | Subtraction CESM Images | HP | |
| CR | 8 | 25 | 20 | 0 | 2 | 0 | 2 | 3 | 1 |
| Non-CR | 43 | 26 | 31 | 6 | 4 | 6 | 4 | 3 | 5 |
| Assessment | RECIST 1.1 | Histopathology CR | Histopathology Non-CR (PR, SD, PD) | |
|---|---|---|---|---|
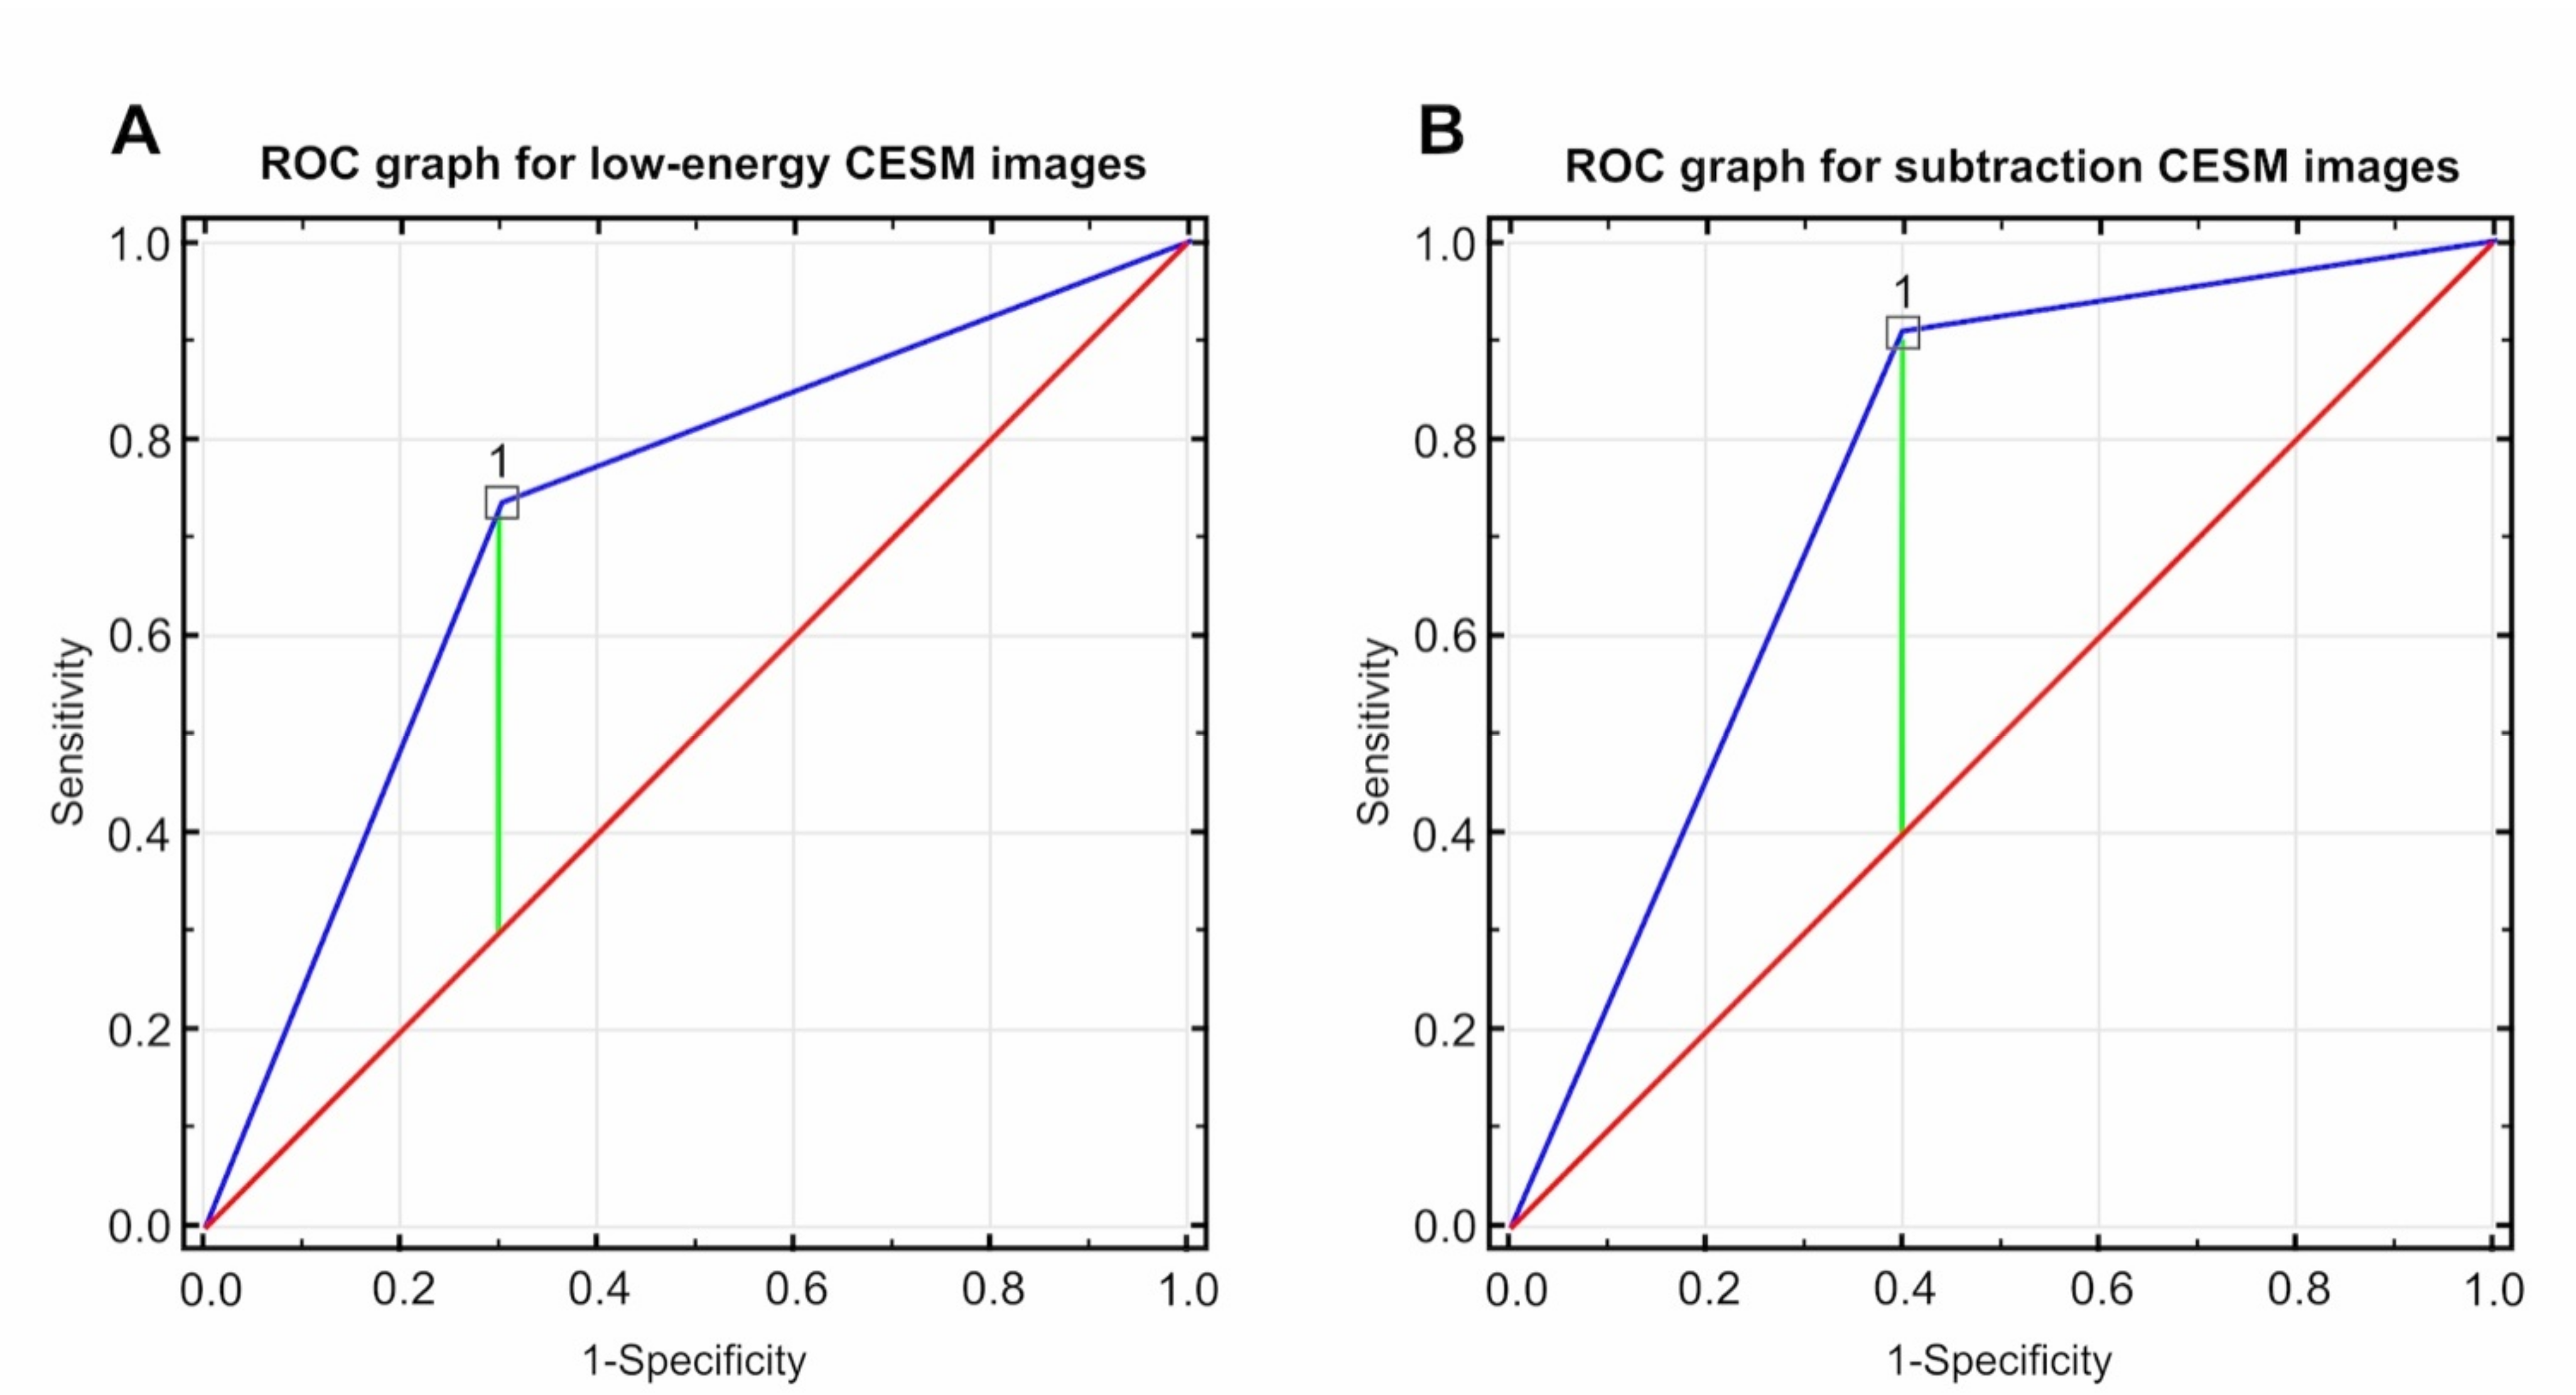
| Low-energy CESM images | CR | 7 | 3 | PPV: 70.0% 95% CI: 0.35–0.93 |
| Non-CR (PR, SD, PD) | 14 | 39 | NPV: 73.58% 95% CI: 0.60–0.85 | |
| Sensitivity: 33.33% 95% CI: 0.15–0.57 | Specificity: 92.86% 95% CI: 0.81–0.99 | |||
| Subtraction CESM images | CR | 18 | 12 | PPV: 60.00% 95% CI: 0.41–0.77 |
| Non-CR (PR, SD, PD) | 3 | 30 | NPV: 90.90% 95% CI: 0.76–0.98 | |
| Sensitivity: 85.71% 95% CI: 0.64–0.97 | Specificity: 71.42% 95% CI: 0.55–0.84 |
Publisher’s Note: MDPI stays neutral with regard to jurisdictional claims in published maps and institutional affiliations. |
© 2021 by the authors. Licensee MDPI, Basel, Switzerland. This article is an open access article distributed under the terms and conditions of the Creative Commons Attribution (CC BY) license (https://creativecommons.org/licenses/by/4.0/).
Share and Cite
Steinhof-Radwańska, K.; Grażyńska, A.; Lorek, A.; Gisterek, I.; Barczyk-Gutowska, A.; Bobola, A.; Okas, K.; Lelek, Z.; Morawska, I.; Potoczny, J.; et al. Contrast-Enhanced Spectral Mammography Assessment of Patients Treated with Neoadjuvant Chemotherapy for Breast Cancer. Curr. Oncol. 2021, 28, 3448-3462. https://doi.org/10.3390/curroncol28050298
Steinhof-Radwańska K, Grażyńska A, Lorek A, Gisterek I, Barczyk-Gutowska A, Bobola A, Okas K, Lelek Z, Morawska I, Potoczny J, et al. Contrast-Enhanced Spectral Mammography Assessment of Patients Treated with Neoadjuvant Chemotherapy for Breast Cancer. Current Oncology. 2021; 28(5):3448-3462. https://doi.org/10.3390/curroncol28050298
Chicago/Turabian StyleSteinhof-Radwańska, Katarzyna, Anna Grażyńska, Andrzej Lorek, Iwona Gisterek, Anna Barczyk-Gutowska, Agnieszka Bobola, Karolina Okas, Zuzanna Lelek, Irmina Morawska, Jakub Potoczny, and et al. 2021. "Contrast-Enhanced Spectral Mammography Assessment of Patients Treated with Neoadjuvant Chemotherapy for Breast Cancer" Current Oncology 28, no. 5: 3448-3462. https://doi.org/10.3390/curroncol28050298