Electrodynamics in Organic Dimer Insulators Close to Mott Critical Point

 , and
, and
Abstract
:1. Introduction
2. Antiferromagnet with Ferroelectric Character -(BEDT-TTF)Cu[N(CN)]Cl
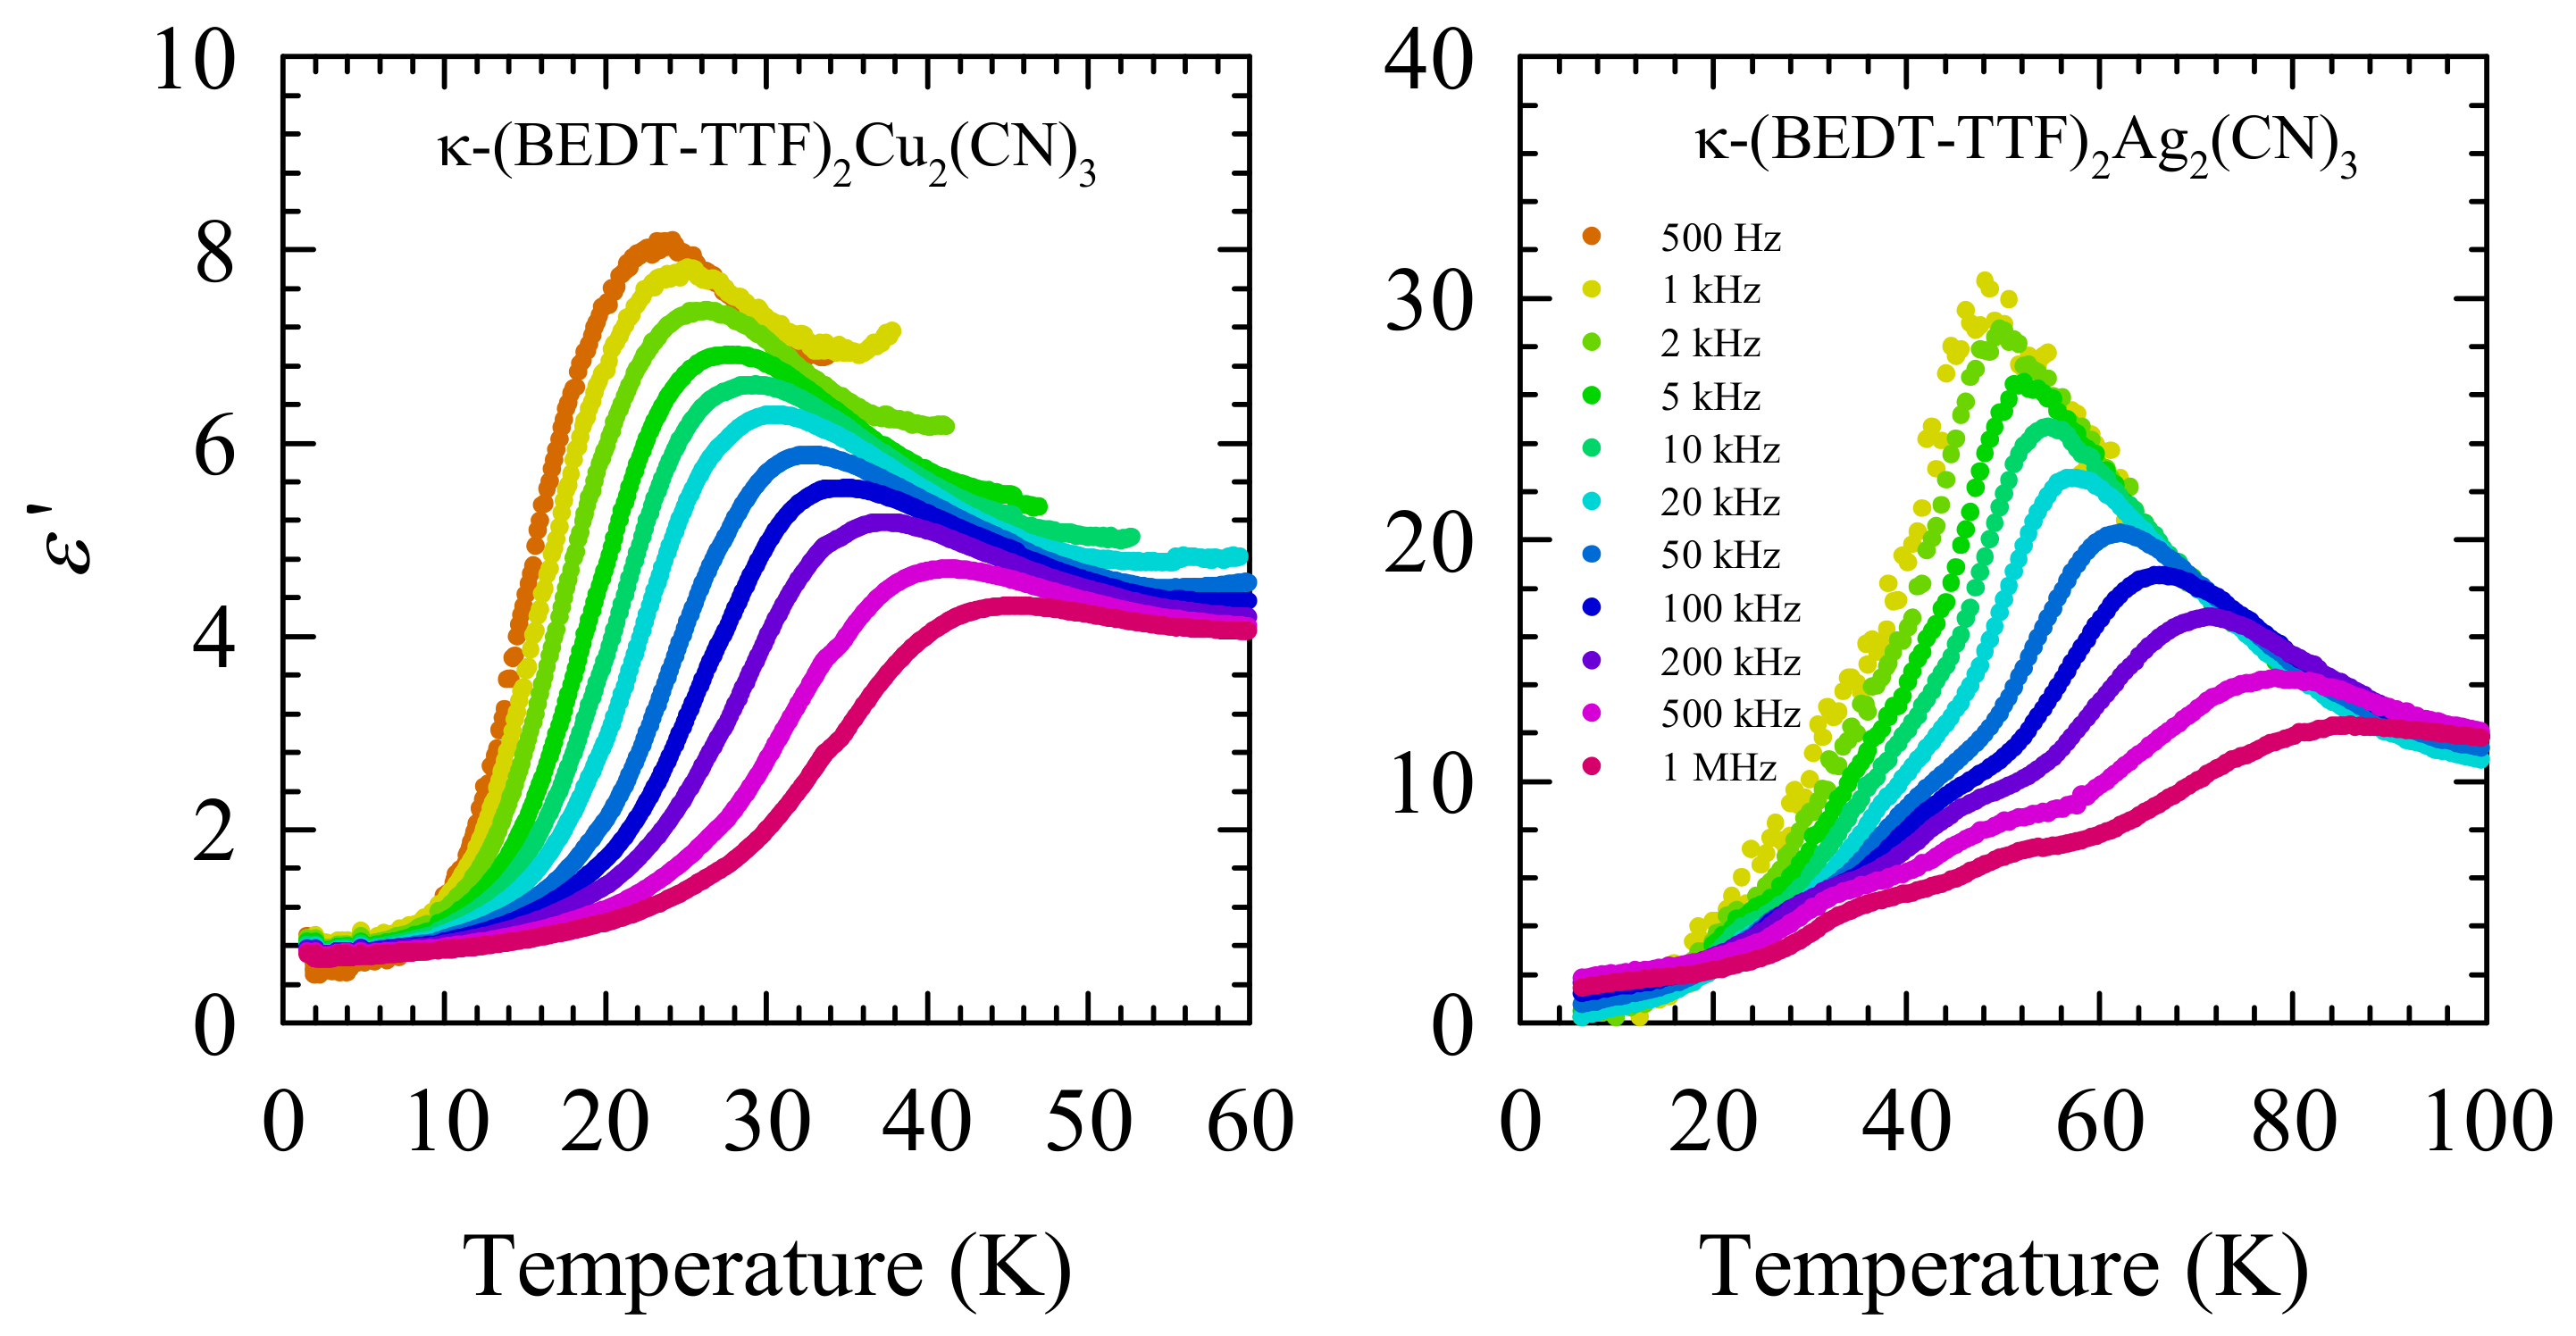
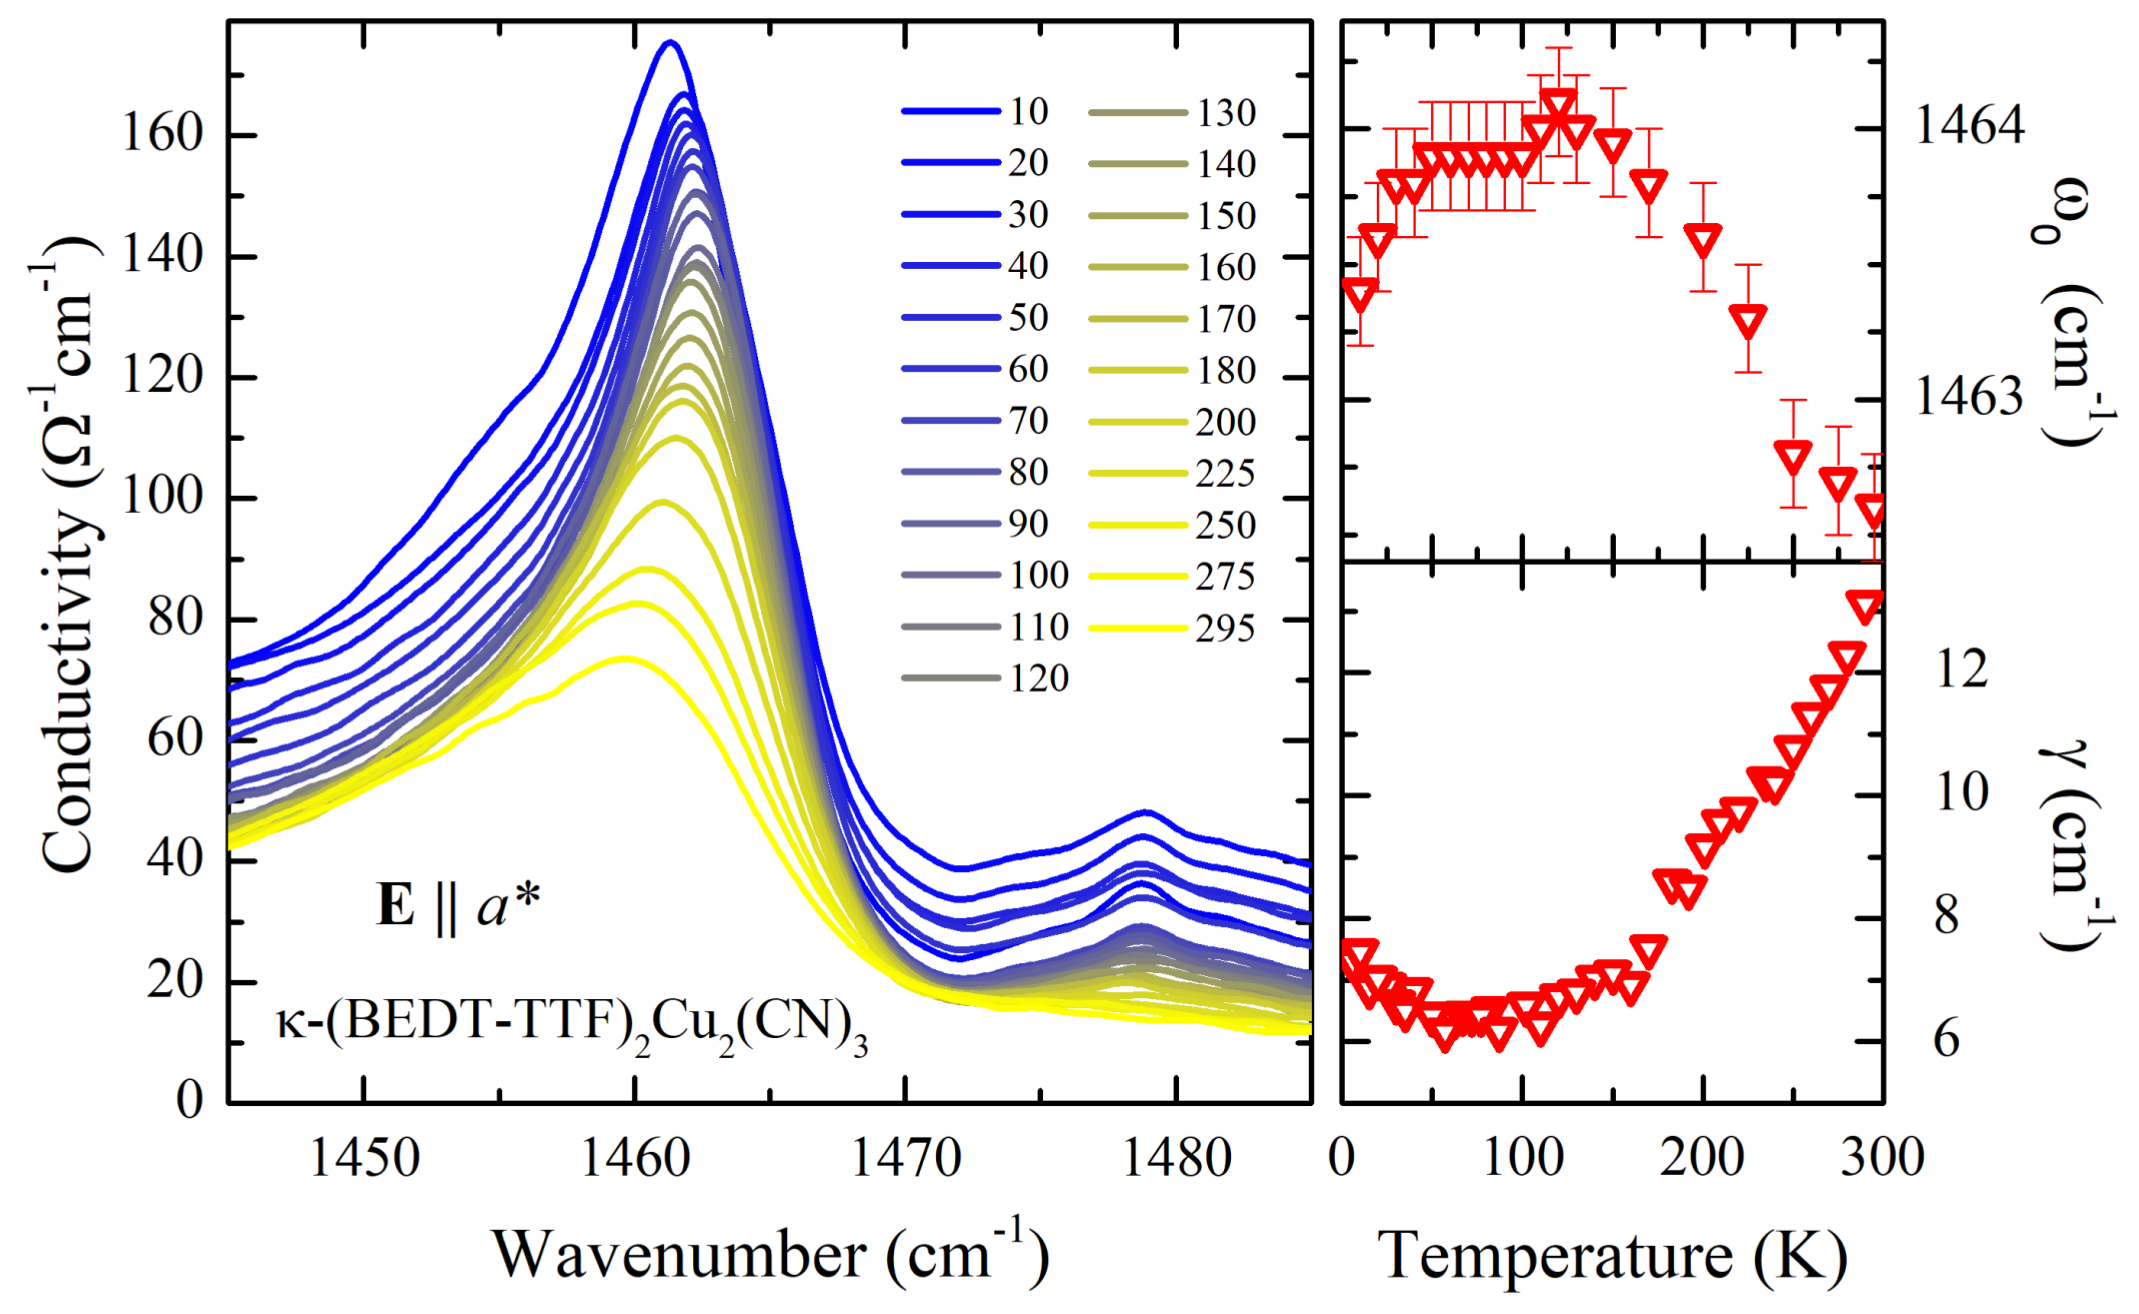
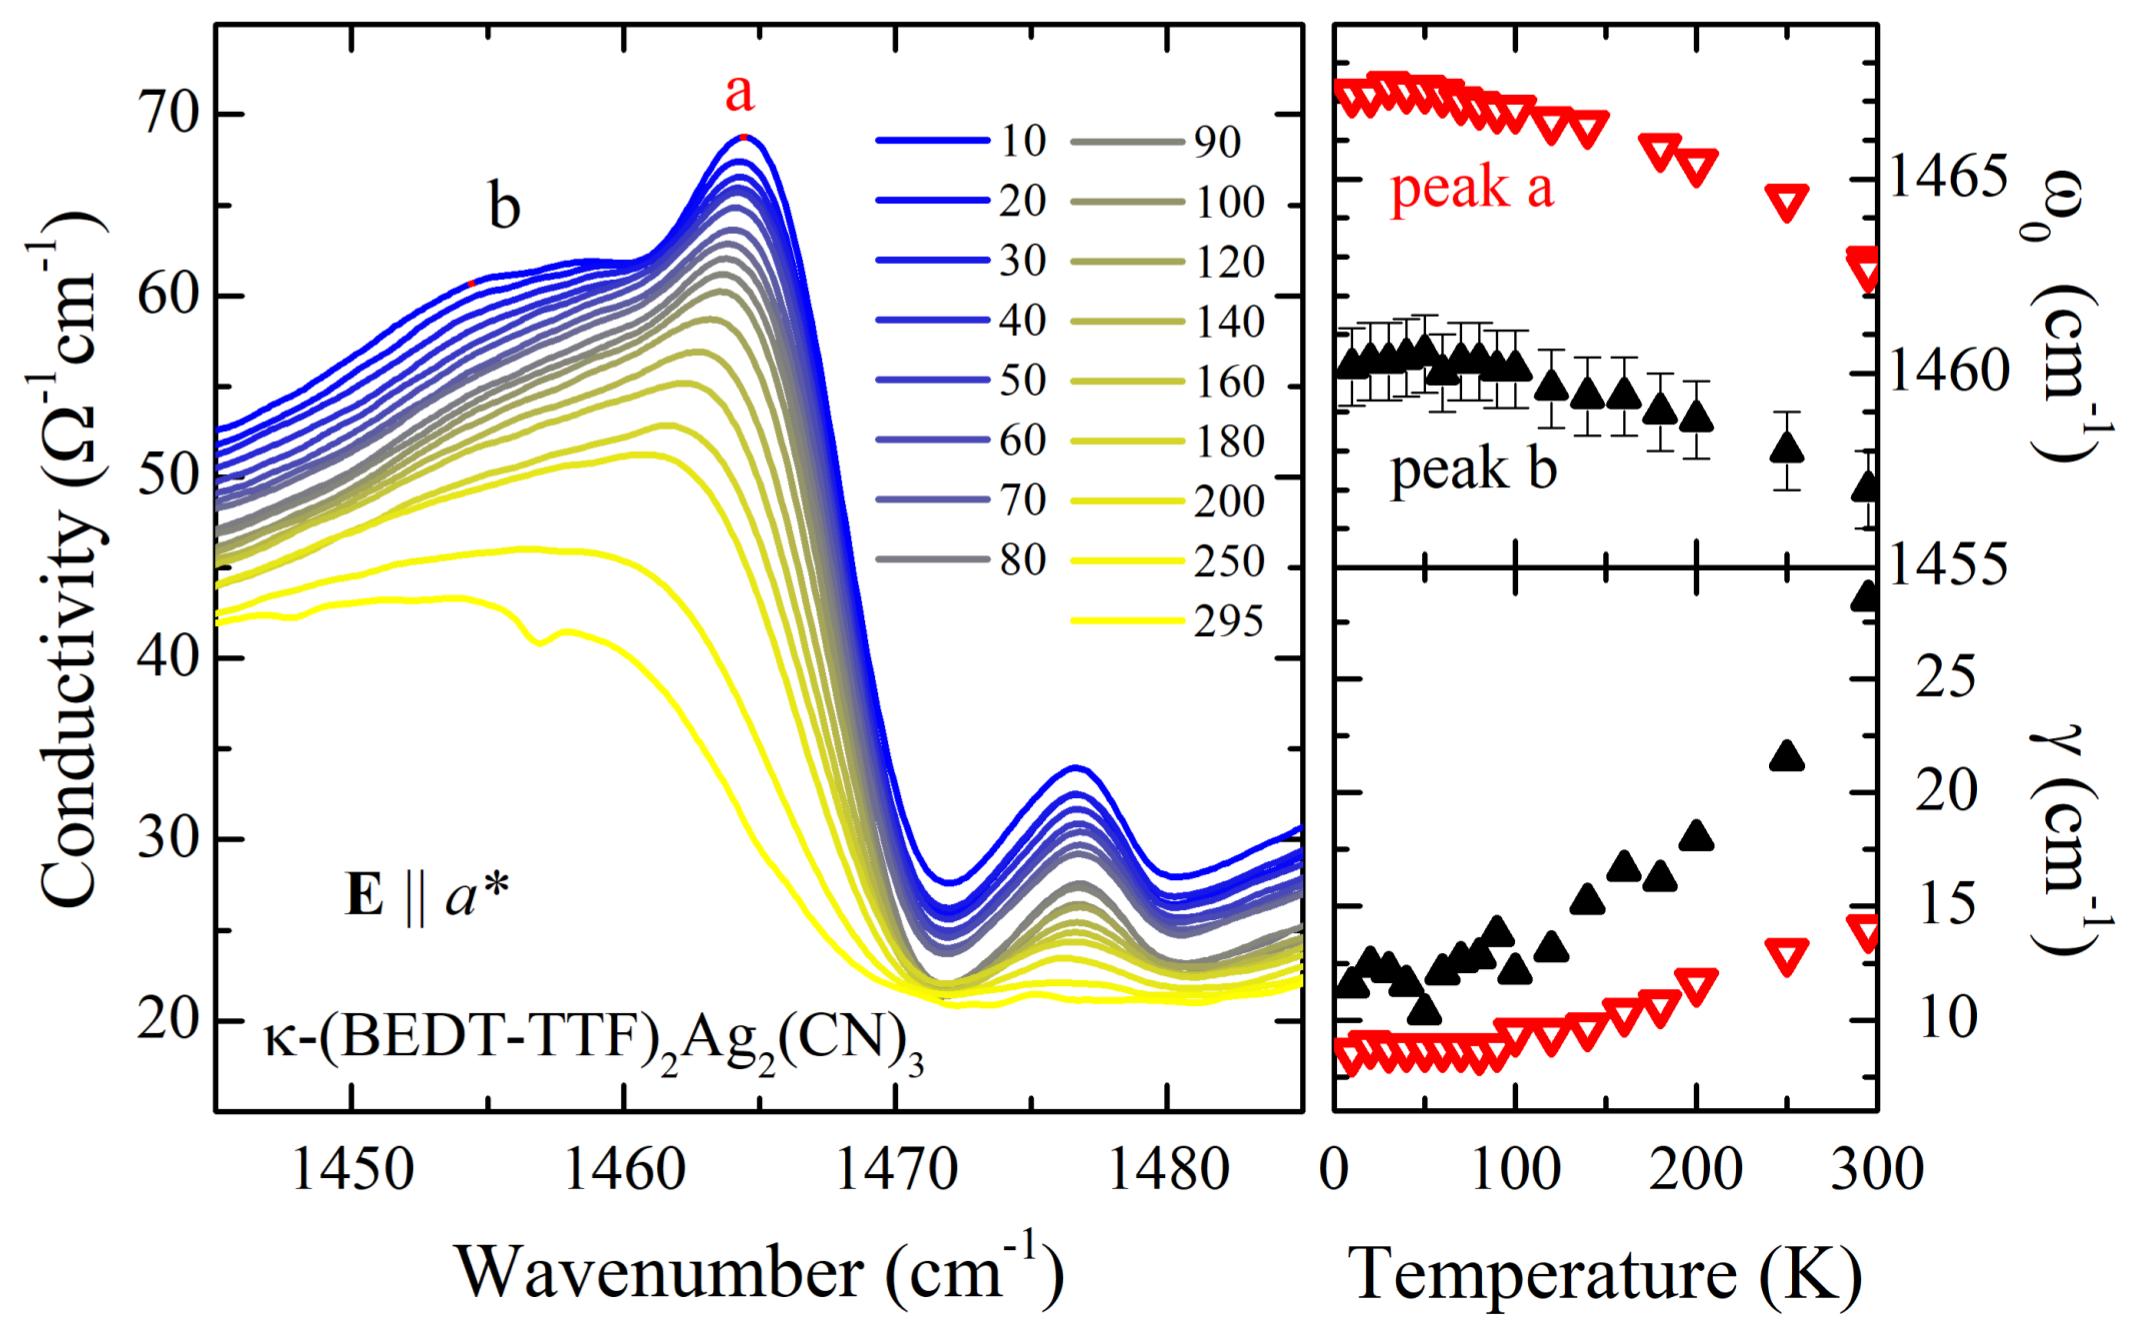
3. Quantum Spin Liquids in Disordered -(BEDT-TTF)Cu(CN) and -(BEDT-TTF)Ag(CN)
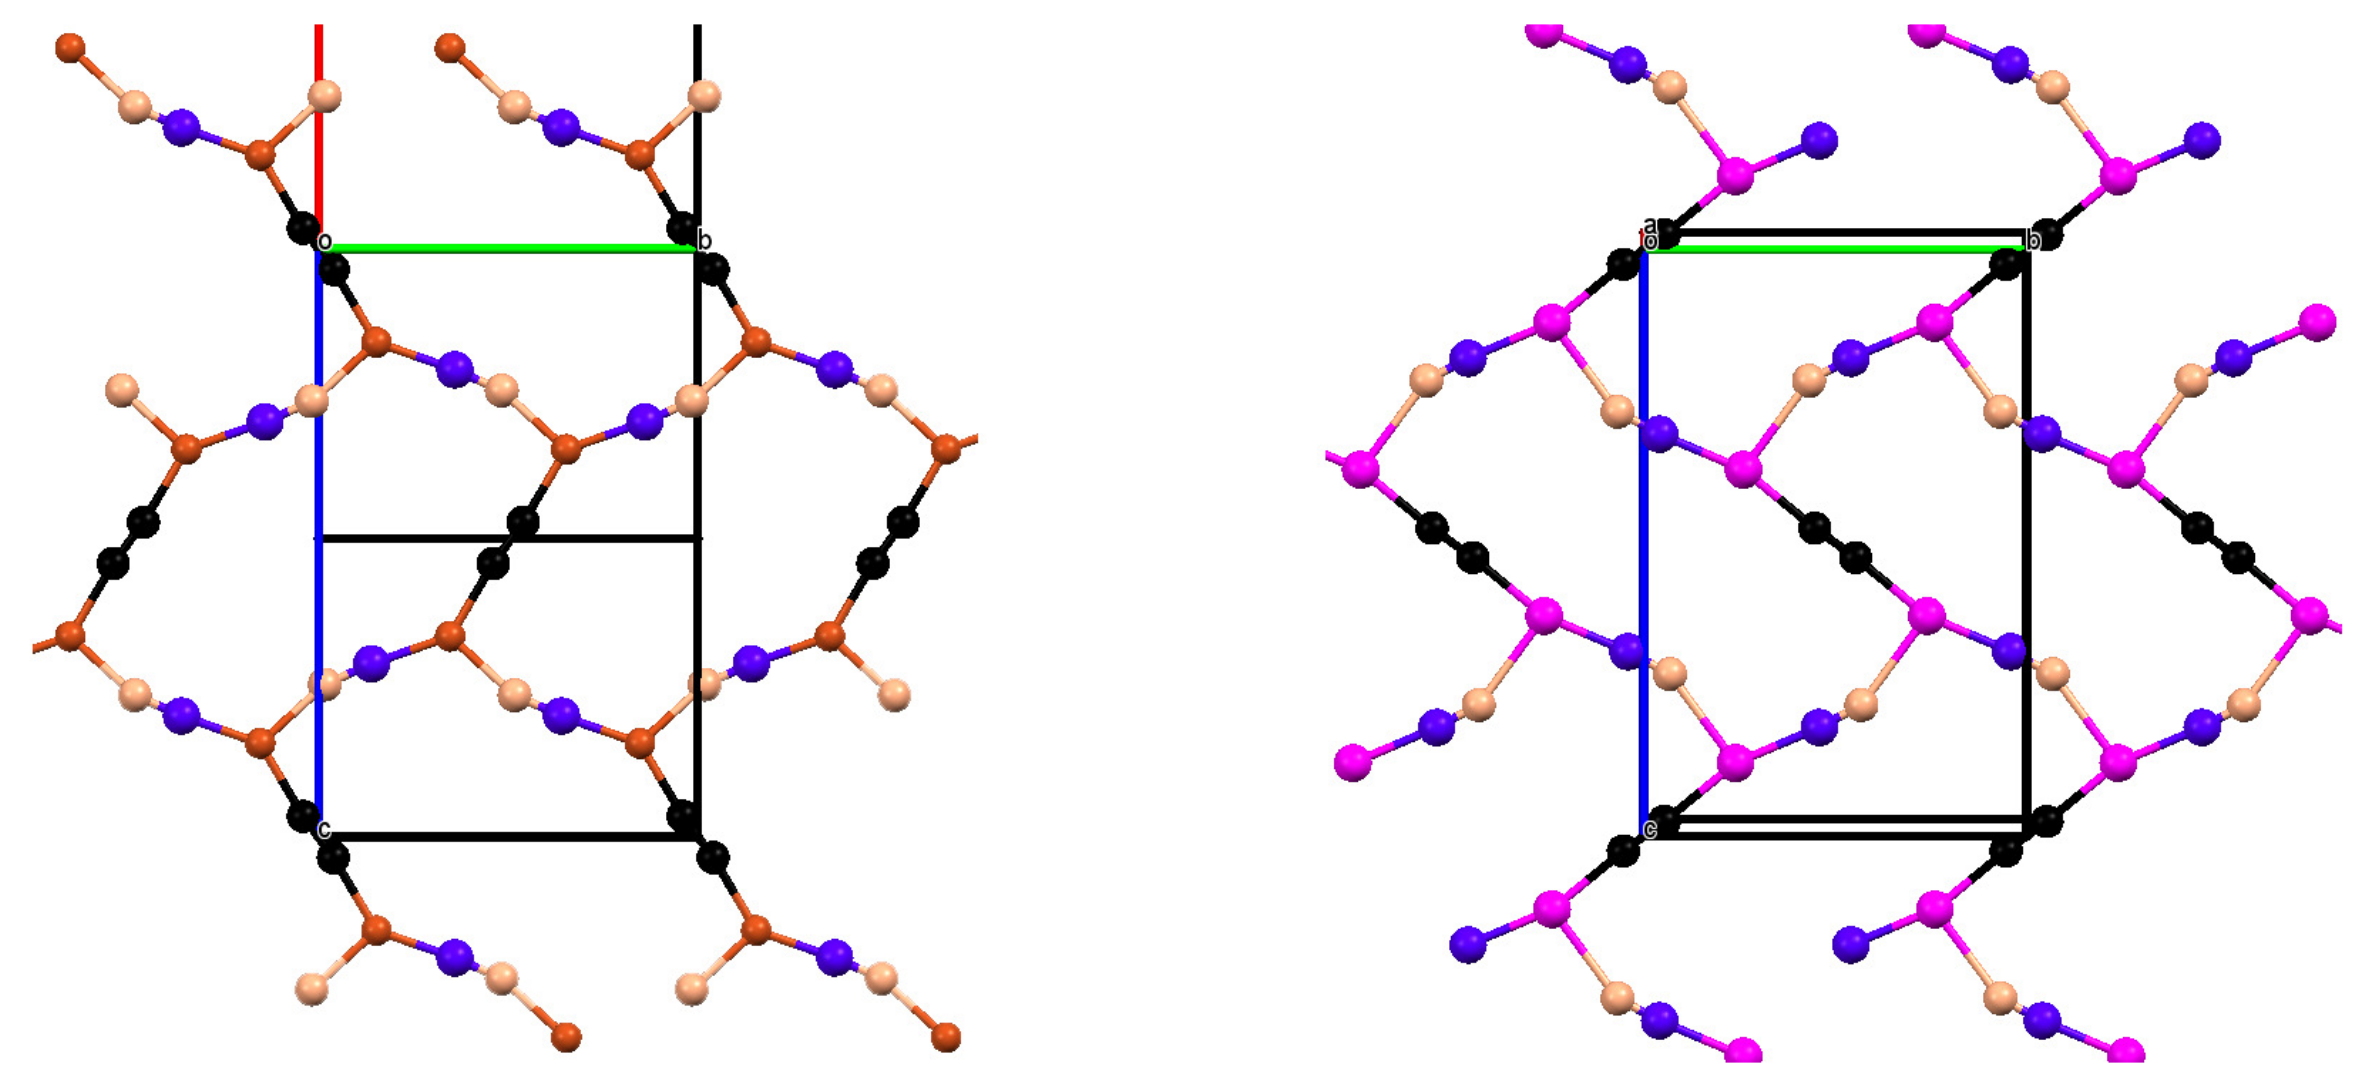
4. Van de Waals Interactions in -(BEDT-TTF); = Cu[N(CN)]Cl, Cu(CN) and Ag(CN)
5. Materials and Methods
6. Conclusions
Author Contributions
Acknowledgments
Conflicts of Interest
References
- Kanoda, K.; Kato, R. Mott Physics in Organic Conductors with Triangular Lattices. Annu. Rev. Condens. Matter Phys. 2011, 2, 167. [Google Scholar] [CrossRef]
- Powell, B.J.; McKenzie, R.H. Quantum frustration in organic Mott insulators: From spin liquids to unconventional superconductors. Rep. Prog. Phys. 2011, 74, 056501. [Google Scholar] [CrossRef]
- Kandpal, H.C.; Opahle, I.; Zhang, Y.-Z.; Jeschke, H.O.; Valentí, R. Revision of Model Parameters for κ-Type Charge Transfer Salts: An Ab Initio Study. Phys. Rev. Lett. 2009, 103, 067004. [Google Scholar] [CrossRef] [PubMed]
- Jeschke, H.O.; de Souza, M.; Valentí, R.; Manna, R.S.; Lang, M.; Schlueter, J.A. Temperature dependence of structural and electronic properties of the spin-liquid candidate κ-(BEDT-TTF)2Cu2(CN)3. Phys. Rev. B 2012, 85, 035125. [Google Scholar] [CrossRef]
- Koretsune, T.; Hotta, C. Evaluating model parameters of the κ and β′-type Mott insulating organic solids. Phys. Rev. B 2014, 89, 045102. [Google Scholar] [CrossRef]
- Hiramatsu, T.; Yoshida, Y.; Saito, G.; Otsuka, A.; Yamochi, H.; Maesato, M.; Shimizu, Y.; Ito, H.; Nakamura, Y.; Kishida, H.; et al. Design and preparation of a new quantum spin liquid candidate, κ-(ET)2Ag2(CN)3, having a nearby superconductivity. Bull. Chem. Soc. Jpn. 2017, 90, 1073–1082. [Google Scholar] [CrossRef]
- Miyagawa, K.; Kawamoto, A.; Nakazawa, Y.; Kanoda, K. Antiferromagnetic Ordering and Spin Structure in the Organic Conductor, κ-(BEDT-TTF)2Cu[N(CN)2]Cl. Phys. Rev. Lett. 1995, 75, 1174. [Google Scholar] [CrossRef] [PubMed]
- Pinterić, M.; Miljak, M.; Biškup, N.; Milat, O.; Aviani, I.; Tomić, S.; Schweitzer, D.; Strunz, W.; Heinen, I. Magnetic anisotropy and low frequency dielectric response of weak ferromagnetic phase in κ-(BEDT-TTF)2Cu[N(CN)2]Cl. Eur. Phys. J. B 1999, 11, 217. [Google Scholar]
- Smith, D.F.; De Soto, S.M.; Slichter, C.P. Dzialoshinskii-Moriya interaction in the organic superconductor κ-(BEDT-TTF)2Cu[N(CN)2]Cl. Phys. Rev. B 2003, 68, 024512. [Google Scholar] [CrossRef]
- Shimizu, Y.; Miyagawa, K.; Kanoda, K.; Maesato, M.; Saito, G. Spin liquid state in an organic Mott insulator with a triangular lattice. Phys. Rev. Lett. 2003, 91, 107001. [Google Scholar] [CrossRef] [PubMed]
- Shimizu, Y.; Hiramatsu, T.; Maesato, M.; Otsuka, A.; Yamochi, H.; Ono, A.; Itoh, M.; Yoshida, M.; Takigawa, M.; Yoshida, Y.; et al. Pressure-tuned exchange coupling of a quantum spin liquid in the molecular triangular lattice κ-(BEDT-TTF)2Ag2(CN)3. Phys. Rev. Lett. 2016, 117, 107203. [Google Scholar] [CrossRef] [PubMed]
- Zhou, Y.; Kanoda, K.; Ng, T.-K. Quantum spin liquid states. Rev. Mod. Phys. 2017, 89, 025003. [Google Scholar] [CrossRef]
- Balents, L. Spin liquids in frustrated magnets. Nature 2010, 464, 199. [Google Scholar] [CrossRef] [PubMed]
- Savary, L.; Balents, L. Quantum spin liquids: A review. Rep. Prog. Phys. 2017, 80, 016502. [Google Scholar] [CrossRef] [PubMed]
- Anderson, W.P. Resonating valence bonds: A new kind of insulator? Mat. Res. Bull. 1973, 8, 153–160. [Google Scholar] [CrossRef]
- Klanjšek, M.; Zorko, A.; Žitko, R.; Mravlje, J.; Jagličić, Z.; Kumar Biswas, P.; Prelovšek, P.; Mihailovic, D.; Arčon, D. A high-temperature quantum spin liquid with polaron spins. Nat. Phys. 2017, 13, 1130–1134. [Google Scholar] [CrossRef]
- Shimozawa, M.; Hashimoto, K.; Ueda, A.; Suzuki, Y.; Sugii, K.; Yamada, S.; Imai, Y.; Kobayashi, R.; Itoh, K.; Iguchi, S.; et al. Quantum-disordered state of magnetic and electric dipoles in an organic Mott system. Nat. Commun. 2017, 8, 1821. [Google Scholar] [CrossRef] [PubMed]
- Lunkenheimer, P.; Müller, J.; Krohns, S.; Schrettle, F.; Loidl, A.; Hartmann, B.; Rommel, R.; de Souza, M.; Hotta, C.; Schlueter, J.A.; et al. Multiferroicity in an organic charge-transfer salt that is suggestive of electric-dipole-driven magnetism. Nat. Mater. 2012, 11, 755. [Google Scholar] [CrossRef] [PubMed]
- Tomić, S.; Pinterić, M.; Ivek, T.; Sedlmeier, K.; Beyer, R.; Wu, D.; Schlueter, J.A.; Schweitzer, D.; Dressel, M. Magnetic ordering and charge dynamics in κ-(BEDT-TTF)2Cu[N(CN)2]Cl. J. Phys. Condens. Matter 2013, 25, 436004. [Google Scholar] [CrossRef] [PubMed]
- Abdel-Jawad, M.; Terasaki, I.; Sasaki, T.; Yoneyama, N.; Kobayashi, N.; Uesu, Y.; Hotta, C. Anomalous dielectric response in the dimer Mott insulator κ-(BEDT-TTF)2Cu2(CN)3. Phys. Rev. B 2010, 82, 125119. [Google Scholar] [CrossRef]
- Pinterić, M.; Čulo, M.; Milat, O.; Basletić, M.; Korin-Hamzić, B.; Tafra, E.; Hamzić, A.; Ivek, T.; Peterseim, T.; Miyagawa, K.; et al. Anisotropic charge dynamics in the spin-Liquid candidate κ-(BEDT-TTF)2Cu2(CN)3. Phys. Rev. B 2014, 90, 195139. [Google Scholar] [CrossRef]
- Tomić, S.; Dressel, M. Ferroelectricity in molecular solids: A review of electrodynamic properties. Rep. Prog. Phys. 2015, 78, 096501. [Google Scholar] [CrossRef] [PubMed]
- Pinterić, M.; Lazić, P.; Pustogow, A.; Ivek, T.; Kuveždić, M.; Milat, O.; Gumhalter, B.; Basletić, M.; Čulo, M.; Korin-Hamzić, B.; et al. Anions effects on the electronic structure and electrodynamic properties of the Mott insulator κ-(BEDT-TTF)2Ag2(CN)3. Phys. Rev. B 2016, 94, 161105(R). [Google Scholar] [CrossRef]
- Dressel, M.; Lazić, P.; Pustogow, A.; Zhukova, E.; Gorshunov, B.; Schlueter, J.A.; Milat, O.; Gumhalter, B.; Tomić, S. Lattice vibrations of the charge-transfer salt κ-(BEDT-TTF)2Cu2(CN)3: Comprehensive explanation of the electrodynamic response in a spin-liquid compound. Phys. Rev. B 2016, 93, 081201(R). [Google Scholar] [CrossRef]
- Sedlmeier, K.; Elsässer, S.; Neubauer, D.; Beyer, R.; Wu, D.; Ivek, T.; Tomić, S.; Schlueter, J.A.; Dressel, M. Absence of charge order in the dimerized κ-phase BEDT-TTF salts. Phys. Rev. B 2012, 86, 245103. [Google Scholar] [CrossRef]
- Hotta, C. Quantum electric dipoles in spin-liqiod dimer Mott insulator κ-(ET)2Cu2(CN)3. Phys. Rev. B 2010, 82, 241104. [Google Scholar] [CrossRef]
- Hotta, C. Theories on Frustrated Electrons in Two-Dimensional Organic Solids. Crystals 2012, 2, 1155–1200. [Google Scholar] [CrossRef]
- Naka, M.; Ishihara, S. Electronic ferroelectricity in a dimer mott insulator. J. Phys. Soc. Jpn. 2010, 79, 063707. [Google Scholar] [CrossRef]
- Naka, M.; Ishihara, S. Collective charge excitation in a dimer Mott insulating system. J. Phys. Soc. Jpn. 2013, 82, 023701. [Google Scholar] [CrossRef]
- Naka, M.; Ishihara, S. Quantum melting of magnetic order in an organic dimer-Mott insulating system. Phys. Rev. B 2016, 93, 195114. [Google Scholar] [CrossRef]
- Li, H.; Clay, R.T.; Mazumdar, S. The paired-electron crystal in the two-dimensional frustrated quarter-filled band. J. Phys. Condens. Matter 2010, 22, 272201. [Google Scholar] [CrossRef] [PubMed]
- Dayal, S.; Clay, R.T.; Li, H.; Mazumdar, S. Paired electron crystal: Order from frustration in the quarter-filled band. Phys. Rev. B 2011, 83, 245106. [Google Scholar] [CrossRef]
- Gomi, H.; Ikenaga, M.; Hiragi, Y.; Segawa, D.; Takahashi, A.; Inagaki, T.J.; Aihara, M. Ferroelectric states induced by dimer lattice disorder in dimer Mott insulators. Phys. Rev. B 2013, 87, 195126. [Google Scholar] [CrossRef]
- Gomi, H.; Inagaki, T.J.; Takahashi, A. Ferroelectric charge order enhanced by magnetic frustration in dimer Mott insulators. Phys. Rev. B 2016, 93, 035105. [Google Scholar] [CrossRef]
- Huse, D.A.; Elser, V. Simple Variational Wave Functions for Two-Dimensional Heisenberg Spin-1/2 Antiferromagnets. Phys. Rev. Lett. 1988, 60, 2351–2354. [Google Scholar] [CrossRef] [PubMed]
- Bernu, B.; Lhuillier, C.; Pierre, L. Signature of Néel order in exact spectra of quantum antiferromagnets on finite lattices. Phys. Rev. Lett. 1992, 69, 2590–2593. [Google Scholar] [CrossRef] [PubMed]
- Capriotti, L.; Trumper, A.E.; Sorella, S. Long-range Néel order in the triangular Heisenberg model. Phys. Rev. Lett. 1999, 82, 3899–3902. [Google Scholar] [CrossRef]
- Furukawa, T.; Miyagawa, K.; Itou, T.; Ito, M.; Taniguchi, H.; Saito, M.; Iguchi, S.; Sasaki, T.; Kanoda, K. Quantum spin liquid emerging from antiferromagnetic order by introducing disorder. Phys. Rev. Lett. 2015, 115, 077001. [Google Scholar] [CrossRef] [PubMed]
- Lazić, P.; Pinterić, M.; Rivas Góngora, D.; Pustogow, A.; Treptow, K.; Ivek, T.; Milat, O.; Gumhalter, B.; Došlić, N.; Dressel, M.; et al. Importance of van der Waals interactions and cation-anion coupling in an organic quantum spin liquid. arXiv, 2017; arXiv:1710.01942. [Google Scholar]
- Kornelsen, K.; Eldridge, J.E.; Wang, H.H.; Charlier, H.A.; Williams, J.M. Infrared study of the metal-insulator transition in the organic conductor κ-(BEDT-TTF)2Cu[N(CN)2]Cl. Solid State Commun. 1992, 4, 343–349. [Google Scholar] [CrossRef]
- Williams, J.M.; Kini, A.M.; Wang, H.H.; Carlson, K.D.; Geiser, U.; Montgomery, L.K.; Pyrka, G.J.; Watkins, D.M.; Kommers, J.M.; Boryschuk, S.J.; et al. From Semiconductor-Semiconductor Transition (42 K) to the Highest-Tc Organic Superconductor, κ-(BEDT-TTF)2Cu[N(CN)2]Cl (Tc = 12.5 K). Inorg. Chem. 1990, 29, 3272–3274. [Google Scholar] [CrossRef]
- Sushko, Y.V.; Andres, K. Superconducting Meissner effect under hydrostatic pressure in the ambient-pressure semiconductor κ-(BEDT-TTF)2Cu[N(CN)2]Cl, where BEDT-TTF is bis(ethylenedithio)tetrathiafulvalene. Phys. Rev. B 1993, 47, 330–333. [Google Scholar] [CrossRef]
- Lefebvre, S.; Wzietek, P.; Brown, S.; Bourbonnais, C.; Jérome, D.; Mézière, C.; Fourmigué, M.; Batail, P. Mott Transition, Antiferromagnetism, and Unconventional Superconductivity in Layered Organic Superconductors. Phys. Rev. Lett. 2000, 85, 5420–5423. [Google Scholar] [CrossRef] [PubMed]
- Dressel, M.; Gruener, G.; Carlson, K.D.; Wang, H.H.; Williams, J.M. Studies of the Microwave Resistivity of κ-(BEDT-TTF)2Cu[N(CN)2]Cl. Synth. Metals 1995, 70, 927–928. [Google Scholar] [CrossRef]
- Sushko, Y.V.; Ito, H.; Ishiguro, T.; Horiuchi, S.; Saito, G. Reentrant superconductivity in κ-(BEDT-TTF)2Cu[N(CN)2]Cl and its pressure phase diagram. Solid State Commun. 1993, 87, 997–1000. [Google Scholar] [CrossRef]
- Clay, R.T.; Mazumdar, S. From charge- and spin-ordering to superconductivity in the organic charge-transfer solids. arXiv, 2018; arXiv:1802.01551. [Google Scholar]
- Hiramatsu, T.; Yoshida, Y.; Saito, G.; Otsuka, A.; Yamochi, H.; Maesato, M.; Shimizu, Y.; Ito, H.; Kishida, H. Quantum spin liquid: Design of a quantum spin liquid next to a superconducting state based on a dimer-type ET Mott insulator. J. Mater. Chem. C 2015, 3, 1378. [Google Scholar] [CrossRef]
- Dressel, M.; Drichko, N. Optical Properties of Two-Dimensional Organic Conductors: Signatures of Charge Ordering and Correlation Effects. Chem. Rev 2004, 104, 5869. [Google Scholar] [CrossRef] [PubMed]
- Yamamoto, T.; Uruichi, M.; Yamamoto, K.; Yakushi, K.; Kawamoto, A.; Taniguchi, H. Examination of the Charge-Sensitive Vibrational Modes in Bis(ethylenedithio)tetrathiafulvalene. J. Phys. Chem. B 2005, 109, 15226. [Google Scholar] [CrossRef] [PubMed]
- Girlando, A. Charge Sensitive Vibrations and Electron-Molecular Vibration Coupling in Bis(ethylenedithio)- tetrathiafulvalene (BEDT-TTF). J. Phys. Chem. C 2011, 115, 19371. [Google Scholar] [CrossRef]
- Lang, M.; Lunkenheimer, P.; Müller, J.; Loidl, A.; Hartmann, B.; Hoang, N.H.; Gati, E.; Schubert, H.; Schlueter, J.A. Multiferroicity in the Mott insulating charge-transfer salt κ-(BEDT-TTF)2Cu[N(CN)2]Cl. IEEE Trans. Magn. 2014, 50, 2700107. [Google Scholar]
- Kawamoto, A.; Honma, Y.; Kumagai, K.I. Electron localization in the strongly correlated organic system κ-(BEDT-TTF)2 probed with nuclear magnetic resonance 13C-NMR. Phys. Rev. B 2004, 70, 060510(R). [Google Scholar] [CrossRef]
- Čulo, M.; Tafra, E.; Basletić, M.; Tomić, S.; Hamzić, A.; Korin-Hamzić, B.; Dressel, M.; Schlueter, J.A. Two-dimensional variable range hopping in the spin-liquid candidate κ-(BEDT-TTF)2Cu2(CN)3. Phys. B 2015, 460, 208–210. [Google Scholar] [CrossRef]
- Nad, F.; Monceau, P.; Kaboub, L.; Fabre, J.M. Divergence of the relaxation time in the vicinity of the ferroelectric charge-ordered phase transition in (TMTTF)2AsF6. Europhys. Lett. 2006, 73, 567–573. [Google Scholar] [CrossRef]
- Cava, R.J.; Schneemeyer, L.F.; Fleming, R.M.; Littlewood, P.B.; Rietman, E.A. Effects of impurities on the dielectric response of the charge-density wave in K0.3MoO3. Phys. Rev. B 1985, 32, 4088–4096. [Google Scholar] [CrossRef]
- Ngai, K.L. Relaxation and Diffusion in Complex Systems; Springer, New York, NY, USA, 2011; ISBN 978-1-4419-7649-9. [Google Scholar]
- Poirier, M.; Parent, S.; Côté, A.; Miyagawa, K.; Kanoda, K.; Shimizu, Y. Magnetodielectric effects and spin-charge coupling in the spin-liquid candidate κ-(BEDT-TTF)2Cu2(CN)3. Phys. Rev. B 2012, 85, 134444. [Google Scholar] [CrossRef]
- Manna, R.S.; Hartmann, S.; Gati, E.; Schlueter, J.A.; de Souza, M.; Lang, M. Low-Temperature Lattice Effects in the Spin-Liquid Candidate κ-(BEDT-TTF)2Cu2(CN)3. Crystals 2018, 8, 87. [Google Scholar] [CrossRef]
- Cross, L.E. Relaxor ferroelectrics. Ferroelectrics 1987, 76, 241–267. [Google Scholar] [CrossRef]
- Itoh, K.; Itoh, H.; Naka, M.; Saito, S.; Hosako, I.; Yoneyama, N.; Ishihara, S.; Sasaki, T.; Iwai, S. Collective Excitation of an Electric Dipole on a Molecular Dimer in an Organic Dimer-Mott Insulator. Phys. Rev. Lett. 2013, 110, 106401. [Google Scholar] [CrossRef] [PubMed]
- Geiser, U.; Wang, H.H.; Carlson, K.D.; Williams, J.M.; Charlier, H.A.; Heindl, J.E.; Yaconi, G.A.; Love, B.J.; Lathrop, M.W.; Schirber, J.E.; et al. Superconductivity at 2.8 K and 1.5 kbar in κ-(BEDT-TTF)2Cu2(CN)3: First Organic Superconductor Containing a Polymeric Copper Cyanide Anion. Inorg. Chem. 1991, 30, 2586. [Google Scholar] [CrossRef]
- Fukuyama, H.; Kishine, J.; Ogata, M. Energy Landscape of Charge Excitations in the Boundary Region between Dimer–Mott and Charge Ordered States in Molecular Solids. J. Phys. Soc. Jpn. 2017, 86, 123706. [Google Scholar] [CrossRef]
- Foury-Leylekian, P.; Ilakovac, V.; Balédent, V.; Fertey, P.; Arakcheeva, A.; Milat, O.; Petermann, D.; Guillier, G.; Miyagawa, K.; Kanoda, K.; et al. κ-(BEDT-TTF)2Cu2(CN)3 spin liquid: Beyond the average structure. Crystals 2018, 8, 158. [Google Scholar] [CrossRef]
- Nakamura, K.; Yoshimoto, Y.; Imada, M. Ab initio two-dimensional multiband low-energy models of EtMe3Sb[Pd(dmit)2]2 and κ-(BEDT-TTF)2Cu2(CN)3 with comparisons to single-band models. Phys. Rev. B 2012, 86, 205117. [Google Scholar] [CrossRef]
- Scriven, E.P.; Powell, B.J. Geometrical Frustration in the Spin Liquid β′-EtMe3Sb[Pd(dmit)2]2 and the Valence-Bond Solid Me3EtP[Pd(dmit)2]2. Phys. Rev. Lett. 2012, 109, 097206. [Google Scholar] [CrossRef] [PubMed]
- Tsumuraya, T.; Seo, H.; Tsuchiizu, M.; Kato, R.; Miyazaki, T. Cation Dependence of the Electronic States in Molecular Triangular Lattice System β′-X[Pd(dmit)2]2. J. Phys. Soc. Jpn. 2013, 82, 033709. [Google Scholar] [CrossRef]
- Jacko, A.C.; Tocchio, L.F.; Jeschke, H.O.; Valenti, R. Importance of anisotropy in the spin-liquid candidate EtMe3Sb[Pd(dmit)2]2. Phys. Rev. B 2013, 88, 155139. [Google Scholar] [CrossRef]
- Alemany, P.; Pouget, J.-P.; Canadell, E. Essential role of anions in the charge ordering transition of α-(BEDT-TTF)2I3. Phys. Rev. B 2012, 85, 195118. [Google Scholar] [CrossRef]
- Alemany, P.; Pouget, J.-P.; Canadell, E. Electronic structure and anion ordering in (TMTSF)2ClO4 and (TMTSF)2NO3: A first-principles study. Phys. Rev. B 2014, 89, 155124. [Google Scholar] [CrossRef]
- Alemany, P.; Pouget, J.-P.; Canadell, E. Structural and electronic control of the metal to insulator transition and local orderings in the θ-(BEDT-TTF)2X organic conductors. J. Phys. Condens. Matter 2015, 27, 465702. [Google Scholar] [CrossRef] [PubMed]
- Dion, M.; Rydber, H.; Schröder, E.; Langreth, D.C.; Lundqvist, B.I. Van derWaals Density Functional for General Geometries. Phys. Rev. Lett. 2004, 92, 246401. [Google Scholar] [CrossRef] [PubMed]
- Román-Pérez, G.; Soler, J.M. Efficient Implementation of a van derWaals Density Functional: Application to Double-Wall Carbon Nanotubes. Phys. Rev. Lett. 2009, 103, 096102. [Google Scholar] [CrossRef] [PubMed]
- Klimeš, J.; Bowler, D.R.; Michaelides, A. Van der Waals density functionals applied to solids. Phys. Rev. B 2011, 83, 195131. [Google Scholar] [CrossRef]
- Mittendorfer, F.; Garhofer, A.; Redinger, J.; Klimeš, J.; Harl, J.; Kresse, G. Graphene on Ni(111): Strong interaction and weak adsorption. Phys. Rev. B 2011, 84, 201401. [Google Scholar] [CrossRef]
- Monkhorst, H.J.; Pack, J.D. Special points for Brillonin-zone integrations. Phys. Rev. B 1976, 13, 5188. [Google Scholar] [CrossRef]
- Yasin, S.; Dumm, M.; Salameh, B.; Batail, P.; Meziere, C.; Dressel, M. Transport studies at the Mott transition of the two-dimensional organic metal κ-(BEDT-TTF)2Cu[N(CN)2]Brx Cl1−x. Eur. Phys. J. B 2011, 79, 383–390. [Google Scholar] [CrossRef] [Green Version]
- Sheldrick, G.M. A short history of SHELX. Acta Cryst. A 2008, 64, 112–122. [Google Scholar] [CrossRef] [PubMed]


| Unit Cell Parameters | Exp | Calc:PBE | Calc:vdW-DF |
|---|---|---|---|
| a | 15.9644 Å | 16.9706 Å (+6.3%) | 16.1809 Å (+1.4%) |
| b | 8.5618 Å | 8.75745 Å (+2.3%) | 8.62586 Å (+0.8%) |
| c | 13.2662 Å | 13.6497 Å (+2.9%) | 13.3523 Å (+0.7%) |
| 90.000 | 89.9968 | 90.0037 | |
| 114.067 | 116.409 | 114.088 | |
| 90.000 | 90.0037 | 89.9994 | |
| V | 1655.65 Å | 1816.90 Å (+9.7%) | 1701.35 Å (+2.8%) |
| Unit Cell Parameters | Exp | Calc:PBE | Calc:vdW-DF |
|---|---|---|---|
| a | 14.969900 Å | 15.6693 Å (+4.7%) | 15.1161 Å (+0.98%) |
| b | 8.656500 Å | 9.04653 Å (+4.5%) | 8.72513 Å (+0.79%) |
| c | 13.216900 Å | 13.8238 Å (+4.6%) | 13.3487 Å (+1.0%) |
| 90.000000 | 90.0000 | 90.0000 | |
| 91.389000 | 94.6823 | 91.3952 | |
| 90.000000 | 90.0000 | 90.0000 | |
| V | 1712.23 Å | 1953.03 Å (+14.1%) | 1760.03 Å (+2.8%) |
| Unit Cell Parameters | Exp | Calc:PBE | Calc:vdW-DF |
|---|---|---|---|
| a | 12.885200 Å | 12.9769 Å (+0.7%) | 12.8334 Å (−0.4%) |
| b | 29.575899 Å | 29.6637 Å (+0.3%) | 29.5323 Å (−0.2%) |
| c | 8.416100 Å | 8.45028 Å (+0.4%) | 8.23316 Å (−2.2%) |
| 90.000000 | 90.0000 | 90.0000 | |
| 90.000000 | 90.0000 | 90.0000 | |
| 90.000000 | 90.0000 | 90.0000 | |
| V | 3207.303 Å | 3252.875 Å (+1.4%) | 3120.366 Å |
© 2018 by the authors. Licensee MDPI, Basel, Switzerland. This article is an open access article distributed under the terms and conditions of the Creative Commons Attribution (CC BY) license (http://creativecommons.org/licenses/by/4.0/).
Share and Cite
Pinterić, M.; Rivas Góngora, D.; Rapljenović, Ž.; Ivek, T.; Čulo, M.; Korin-Hamzić, B.; Milat, O.; Gumhalter, B.; Lazić, P.; Sanz Alonso, M.; et al. Electrodynamics in Organic Dimer Insulators Close to Mott Critical Point. Crystals 2018, 8, 190. https://doi.org/10.3390/cryst8050190
Pinterić M, Rivas Góngora D, Rapljenović Ž, Ivek T, Čulo M, Korin-Hamzić B, Milat O, Gumhalter B, Lazić P, Sanz Alonso M, et al. Electrodynamics in Organic Dimer Insulators Close to Mott Critical Point. Crystals. 2018; 8(5):190. https://doi.org/10.3390/cryst8050190
Chicago/Turabian StylePinterić, Marko, David Rivas Góngora, Željko Rapljenović, Tomislav Ivek, Matija Čulo, Bojana Korin-Hamzić, Ognjen Milat, Branko Gumhalter, Predrag Lazić, Miriam Sanz Alonso, and et al. 2018. "Electrodynamics in Organic Dimer Insulators Close to Mott Critical Point" Crystals 8, no. 5: 190. https://doi.org/10.3390/cryst8050190