1. Introduction
Two-dimensional phononic crystals (PnC) are not only useful for controlling acoustic and elastic waves [
1], but have recently been shown to offer great possibilities for engineering thermal conduction, even at room temperatures [
2,
3,
4,
5], but most notably at ultra-low temperatures below 1 K [
6]. At room temperature, the mechanisms for thermal conductivity reduction in PnCs are still somewhat controversial [
4,
5,
7,
8], in particular there is a debate whether coherent effects, as already seen in 1D superlattices [
9], play a role or not. At low temperatures, the dominant thermal wavelengths of phonons can reach the micron length scale [
6]; moreover, most bulk scattering mechanisms die out. That leads to very strong coherent modification of the phonon dispersion relations [
6], if micron length scale periodic phononic crystal structures such as hole arrays are fabricated. In such structures, both the density of states and group velocities are strongly modified [
6,
10,
11], and these directly affect the thermal conductance at low temperatures as the phonon propagation is ballistic in the ultralow temperature regime [
12], even in the thin membrane geometry [
13].
In Reference [
6], the focus was in reduction of thermal conductance. A factor of 30 reduction was theoretically predicted and experimentally observed at 0.5 K, when using square arrays of holes with a filling factor 0.7, a period of 2.4 μm and a membrane thickness 485 nm. A later experimental study [
14] with a larger, 4 μm period square array of the same filling factor but thinner 300 nm membrane showed a much improved reduction factor of 130 at 0.4 K, an effect over two orders of magnitude. In that case, the observed effect was much larger than what was predicted by theory, as the ballistic conductance calculation predicted only a reduction factor ∼45. It is not clear yet what causes this strong discrepancy between experiment and theory at the larger period structures.
In our previous studies [
6,
14], we did not show systematical plots on how the thermal conductance evolves with geometric parameters such as period, membrane thickness, filling factor of the holes or lattice type. In the meantime, another study [
10] has shown that in the ballistic case the effect of lattice type (square, hexagonal, honeycomb) and membrane thickness are weak, and that the filling factor has a strong effect, with higher hole filling factors giving reduced conductance. Therefore, in this paper we present computational results concentrating on the effect of changing the period of a square lattice, alone, as it has the most profound effects. We also extend the calculations to much higher frequencies than in Reference [
6]. We find that by increasing the lattice constant, one can always reduce the thermal conductance at temperatures
mK, at least within the limits of our study. The largest reduction, compared to an uncut membrane of the same thickness, is achieved with the longest period 8 μm, reaching a value 40 at 0.3 K, and showing an increasing trend with increasing temperature. In addition, we predict that a thermal conductance enhancement is also possible for the smaller lattice constant structures, at most by a factor 3.2 at 0.14 K for the smallest period 62.5 nm studied here. This is quite unintuitive, as we predict that by removing material thermal conductance can increase.
2. Radiated Phonon Power
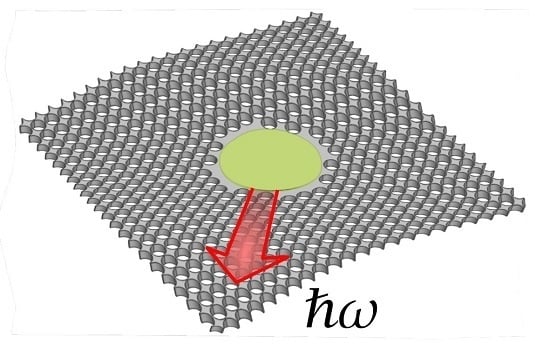
A typical sample geometry used in the measurements of thermal conductance of a 2D hole array PnC is the suspended geometry (
Figure 1), where the PnC or the uncut membrane is physically supported by a bulk silicon chip, see References [
6,
14]. Net phonon heat flow takes place outwards along the membrane in all directions, emitted by a heater. This heat flow is typically ballistic at such low temperatures as in References [
6,
14] (<1 K), meaning that we talk about radiative phonon emission, not diffusive. Only outward propagating phonon modes (mode index
j and wave vector
) with energies
carry this energy, so we can write for the radiated power the following relation for both PnCs and uncut membranes:
where Γ is the heater element boundary,
an outer unit normal of that boundary (in the membrane plane) and Θ is the Heaviside step function. Here
is the Bose-Einstein distribution describing the (assumed) phonon thermal occupation of the emitted phonons and
the group velocity of each mode. The only unknown is thus the set of dispersion relations
for the permitted phonon modes
j in the membrane, which have to be numerically calculated using for example the finite element method. The 2D
K-space integration extends over all
K-space for uncut membranes, but is replaced by integration over the first Brillouin zone for the PnCs. Differential thermal conductance can also easily be calculated from this quantity by differentiating with respect to
T. We also assume here that the membrane is infinite so that there is no backscattering from the membrane-bulk interface, and that the bath is at
K, so that there is no direct backflow term either.
We would like to point out that due to the group velocity term, it is
not possible in general to simplify the above equation to be just an integral over energies weighed by the density of states. This is because the PnC structures are not isotropic so that the group velocity is not a constant on a constant energy surface. Such assumptions [
15] lead to inaccuracies in the calculations.
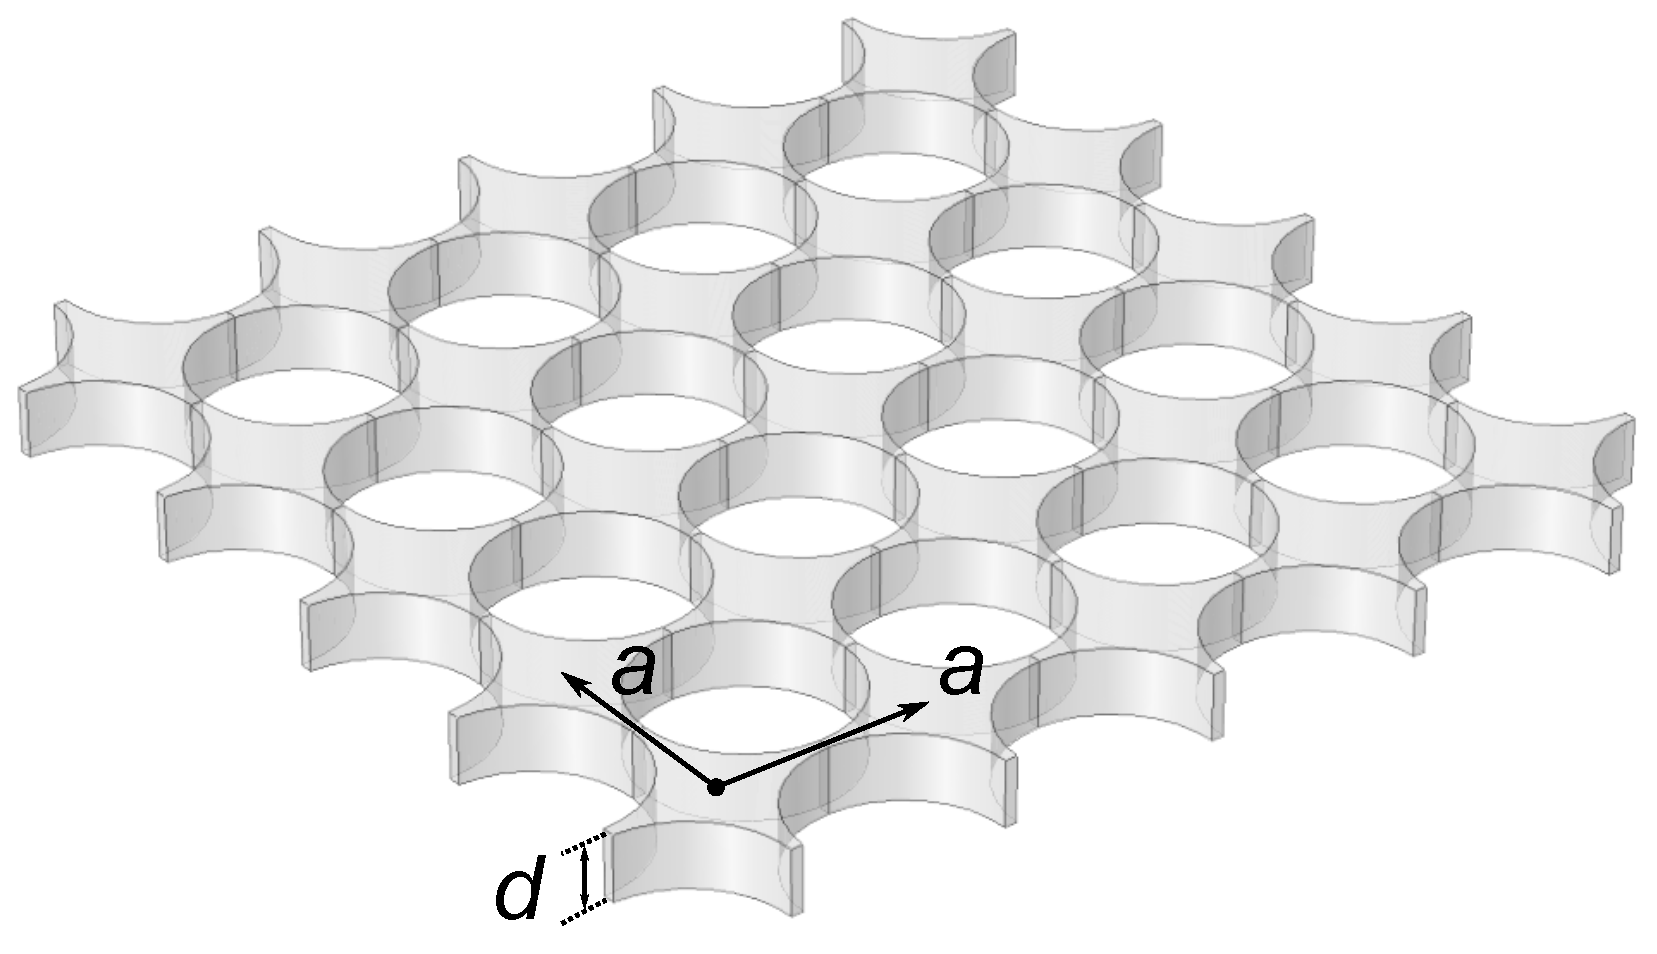
Here, we calculate the radiated phonon power from a line heater for Silicon Nitride (SiN) 2D phononic crystals with square lattice periodic circular holes in a membrane of thickness
nm, with varying lattice periodicity (lattice constant
a). The hole filling fraction is also fixed to
, following the experiment [
6], meaning that the hole diameter
D scales with period as
. The elastic stiffness of the isotropic SiN membrane material is defined by the values of the Young’s modulus
GPa and the Poisson ratio
, and the density is
kg/
. The dispersion relations for the PnCs were calculated using the finite element method as detailed in Reference [
6], whereas the solid membrane results were obtained with the help of the Rayleigh-Lamb theory [
16]. Depending on the value of
a, 1161–1829 eigenvalues were computed for 496–4005
K-values in the irreducible first Brillouin zone for the PnC structures.
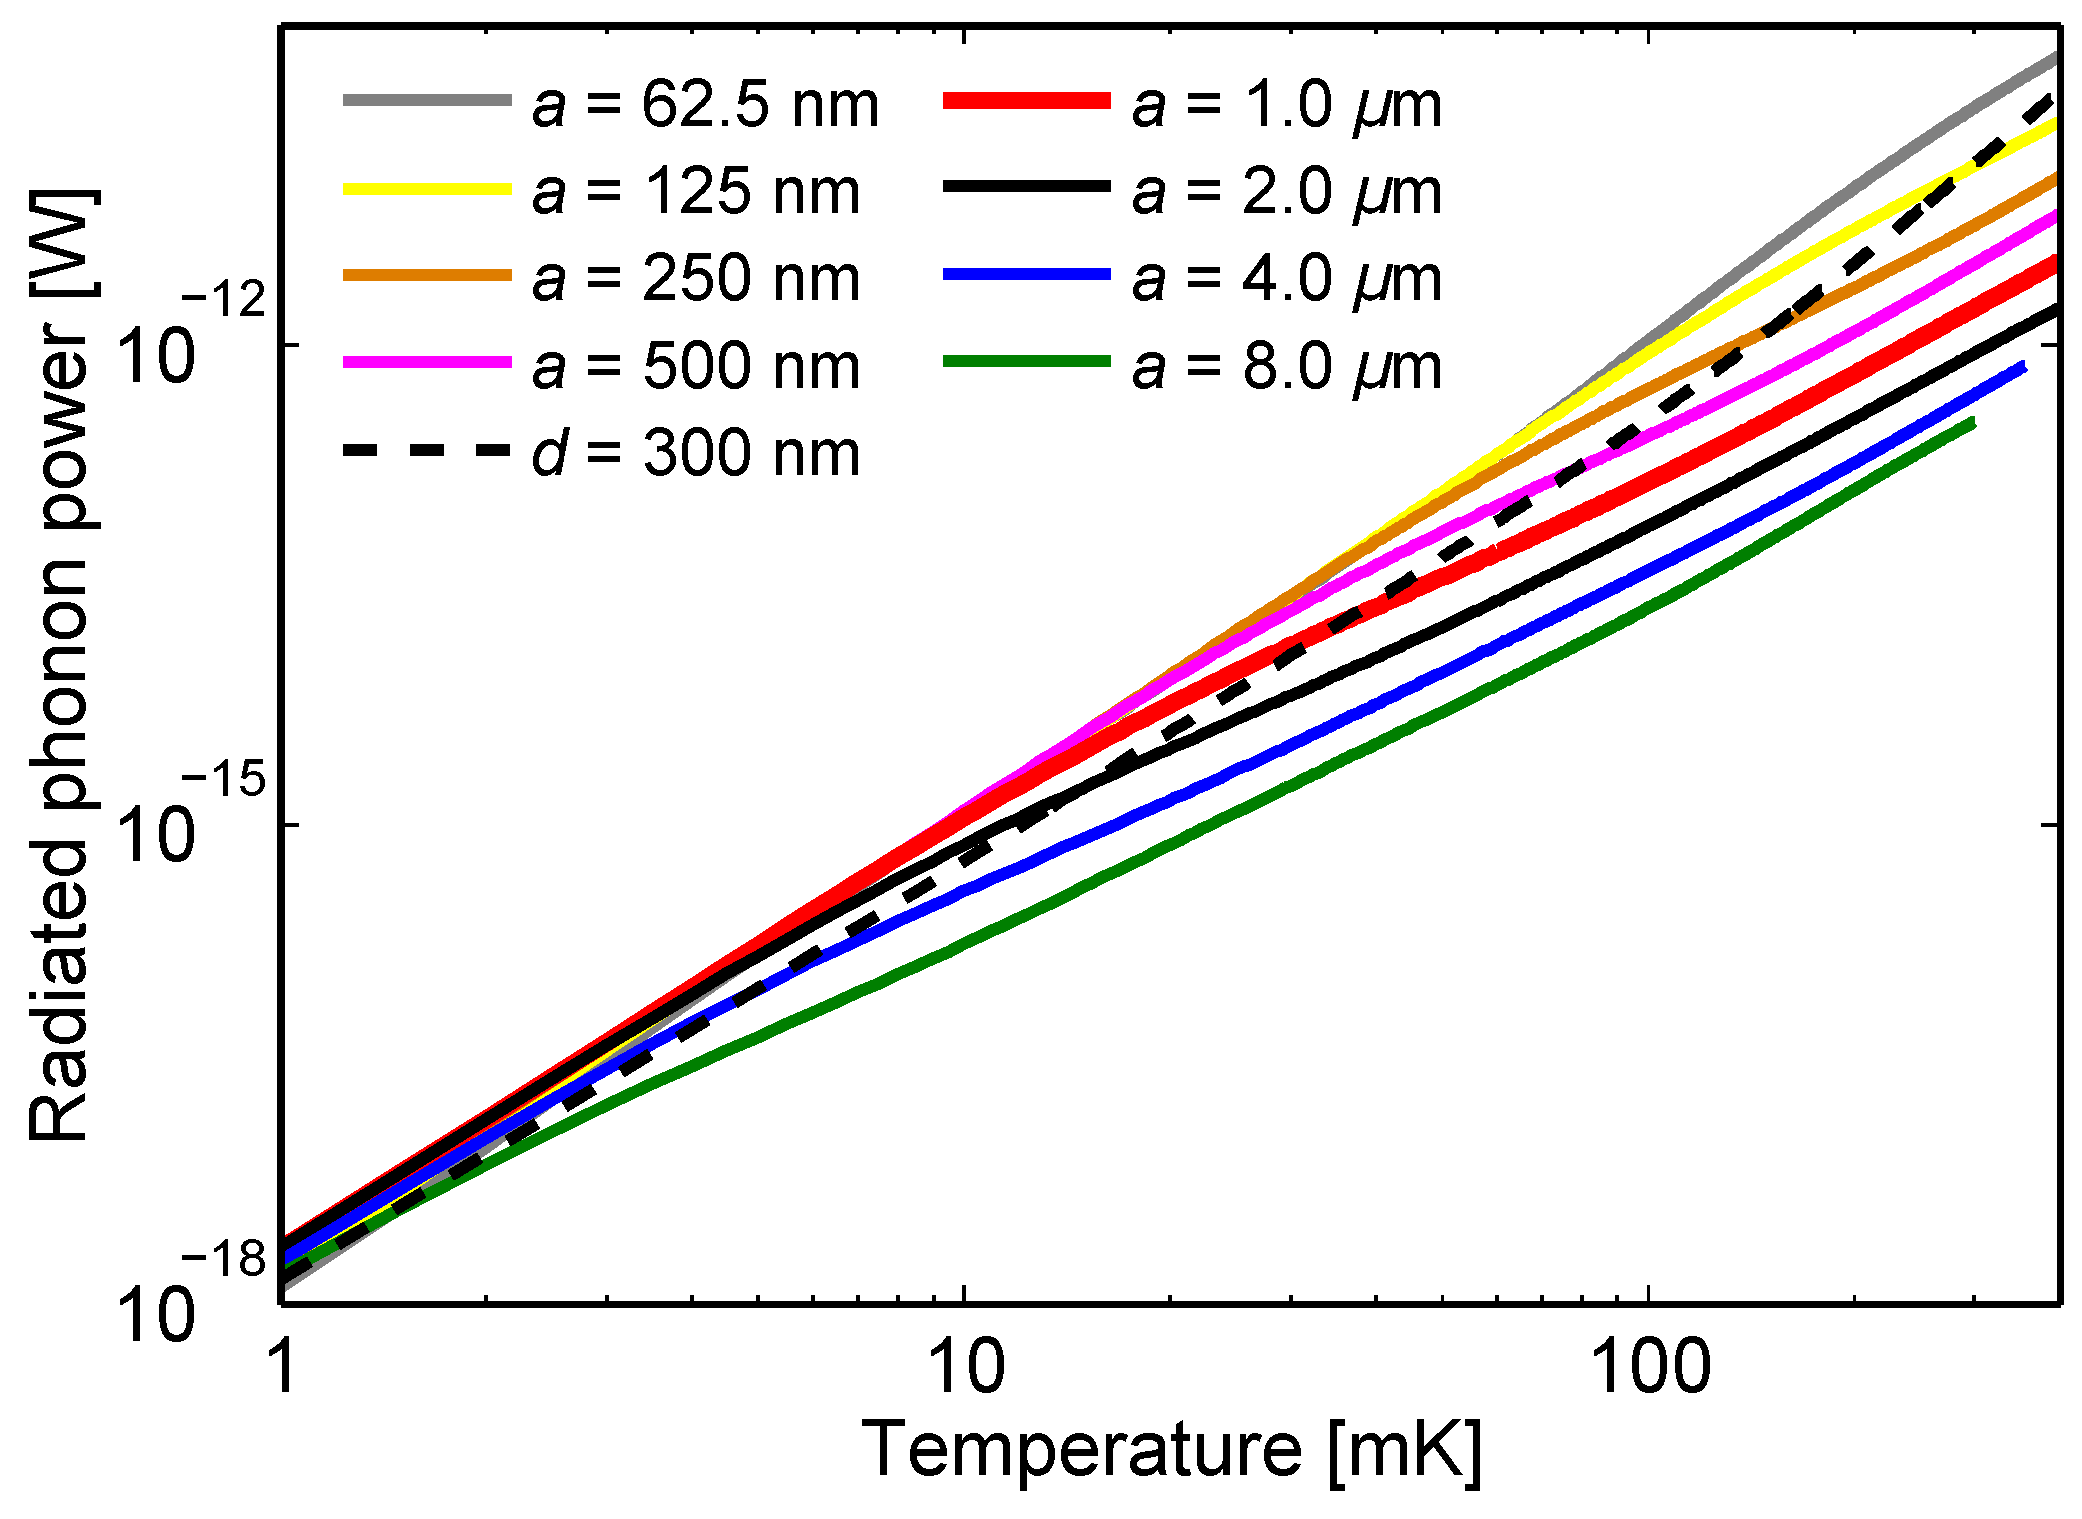
In
Figure 2, the radiated power is shown for a number of membranes on a wide range of lattice constants
nm to
μm, in the temperature range from
mK to
mK. The black dashed line shows the full (non-patterned) membrane results for comparison. At the low end of the temperature range we can see enhancement in radiated power for all patterned membranes compared to a full membrane, but when the heater temperature is increased, the radiated power drops strongly below the full membrane line for most of the samples.
In
Figure 3 we examine the power enhancement (reduction) factor
of PnC membranes with respect to a full membrane with the same thickness
d. With this definition
means enhancement and
reduction. There is a maximum enhancement of 3.2 for this set of PnCs at
mK, which occurs for the finest scale pattern. This is higher than what was predicted in Reference [
15], where an inaccurate formula was used for the calculation of the conductance. Maximum reduction instead occurs for the coarsest pattern at
mK, but the trend of the curves indicates that level of reduction can go even lower at higher temperatures. At
mK, the ratio between the radiated powers for the smallest (
nm) and the largest (
μm) period membranes
is
, about two orders of magnitude.
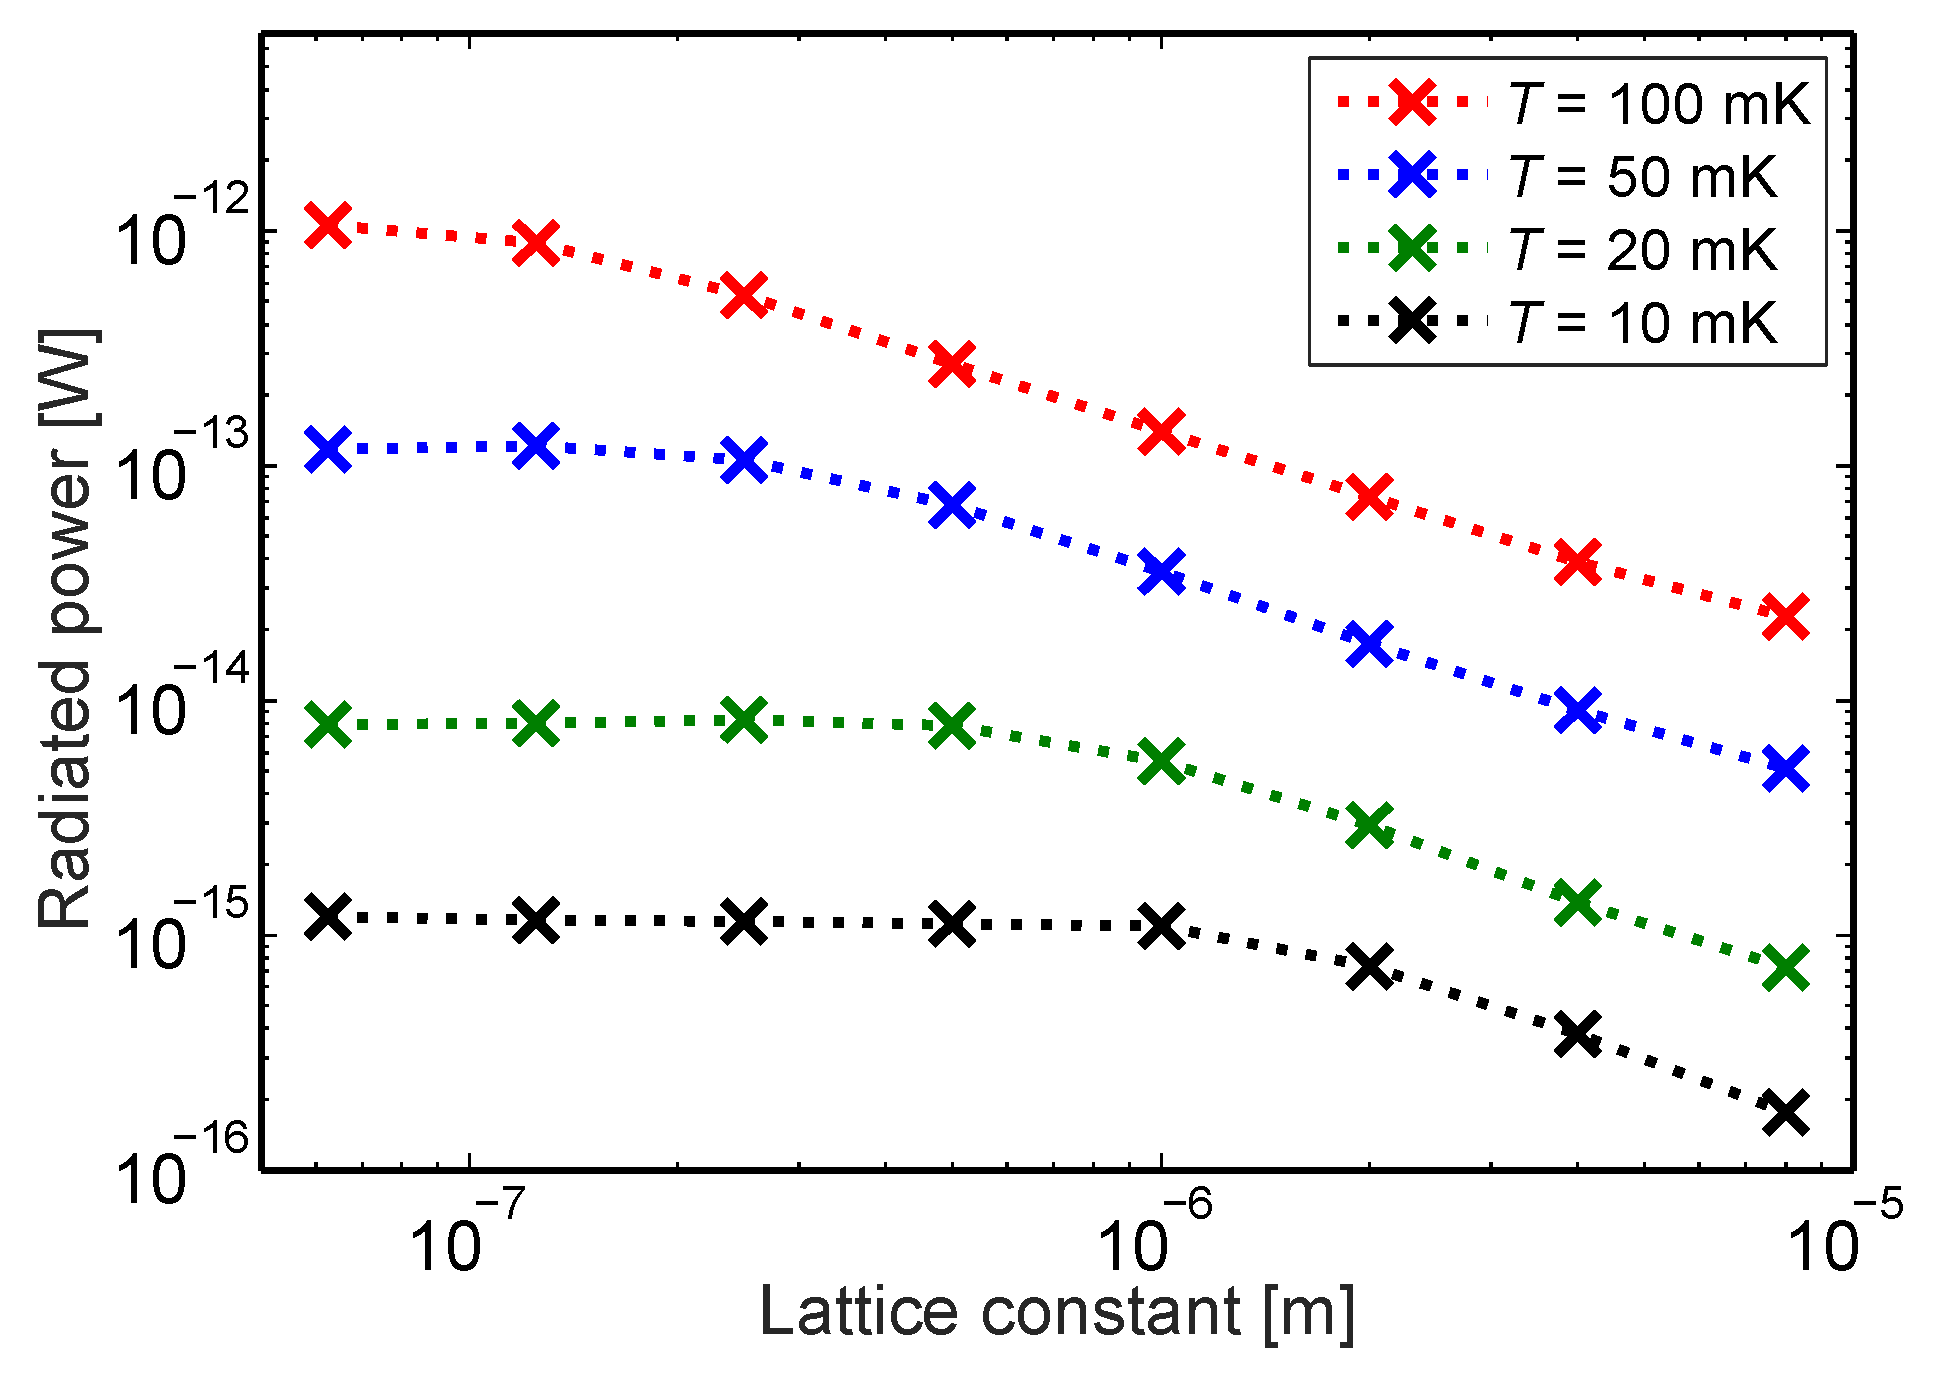
Another distinct feature of the curves in
Figure 2 is that they seem to converge to the same limiting curve as the lattice constant
a is decreased. Convergence rate depends on temperature so that at the low temperature end convergence is faster than at the high temperature end. We can visualize this by plotting the radiated power
vs. lattice constant
a, as shown in
Figure 4 for selected temperatures. In this lattice geometry, this convergence starts at
μm for
mK and at
nm for
mK.
Maybe the most interesting conclusion from this dataset is that the radiated power seems to decrease without a lower bound for increasing a. It opens up an interesting theoretical and practical question of how low the thermal conductance can decrease if the lattice constant is increased. Common sense would seem to dictate that if the lattice constant is increased enough, coherence is destroyed by some effects of irregularities and disorder. In the current model, such irregularities are not taken into account.
3. Phonon Density of States
To understand the reason why the radiated power curves have such a big dependence on the lattice constant, we examine the phonon density of states (DOS) for the studied PnC membranes. There are multiple ways to numerically calculate the density of states
from the discrete set of points
. We calculate the quasi-2D density of states
(per unit area) at angular frequency
ω as a line integral
over the intersection paths
of the dispersion branches and horizontal planes of constant angular frequency
ω. Because the dispersion relation is calculated over a discrete set of
-points, we only obtain an approximation to the true value of this integral. Integration is done piece-wise linearly over the paths
, which can be easily obtained by first triangulating the underlying Brillouin zone grid
and using this triangulation on the dispersion branches. The triangles intersecting the constant angular frequency plane
ω exhibit a set of finite line segments that approximate the paths
.
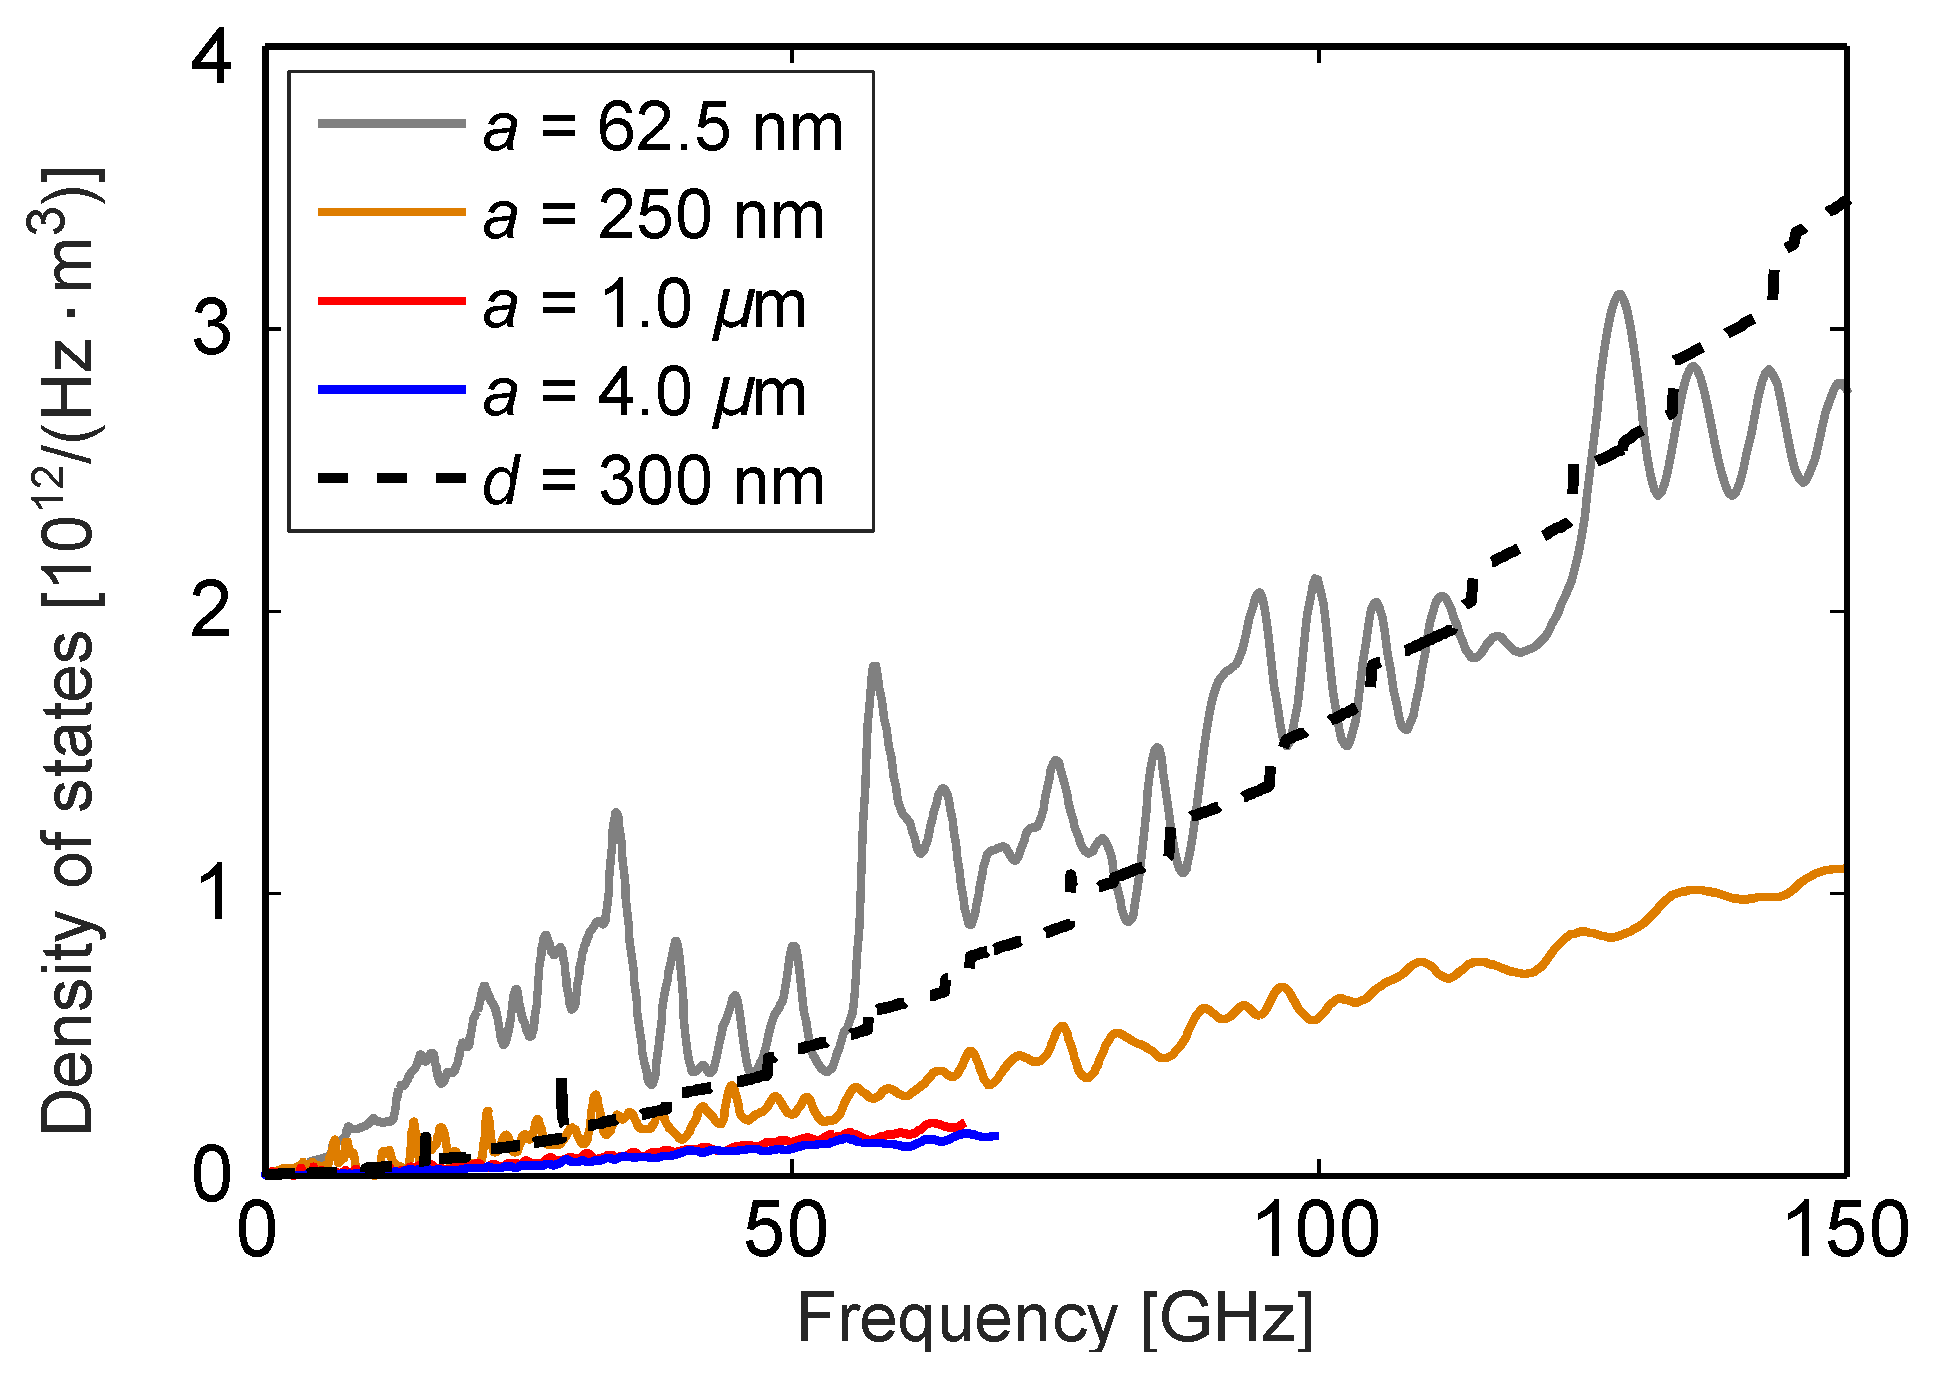
In
Figure 5 we show the calculated phonon densities of states for four different PnC membranes with varying lattice constants. We show here the results in units of 3D density of states (per unit volume) on the regular frequency scale (not angular). The 3D DOS is thus obtained by dividing
by the membrane thickness
d, hence the units H
. The DOS of a full membrane with the same thickness is included as a reference. We notice the similar behaviour here as in
Figure 1: at low frequencies, the small period PnC density of states mostly stays above the full membrane DOS, while going under it in the higher frequency regime. For larger periods, there is mostly only a reduction effect, which reaches approximately a factor of 5 when compared to the full membrane case. Therefore, we can conclude that a significant part of the reduction or enhancement of radiated power can be explained by the reduced or enhanced DOS. However, this does not fully account for the changes observed.
4. Average Phonon Group Velocity
To further justify the differences in the radiated power curves, we calculate the average group velocity
defined by
as a line integral average of the magnitude of the group velocity over the intersection lines of the dispersion branches and the horizontal plane
ω. Here
denotes the length of
. The numerical calculation of
is conducted similarly to the one for DOS, by triangulation of the Brillouin zone grid and the associated dispersion branches.
In
Figure 6 we plot the average group velocities of the same membranes as in
Figure 5. The black dashed line marks the average group velocity of a full membrane. In the high frequency limit, the full membrane dispersion branches (excluding the first two) are known to asymptotically approach the first shear mode branch, so the average group velocity slowly stabilizes to a constant [
17]. To our knowledge, it is not known how the average group velocity behaves asymptotically for generic PnC membranes. Here we can only observe that
for PnC's stabilize much slower, if at all. It approximately stays at ∼1/5 → 1/10 of the level of the corresponding full membrane
, which is of the correct order of magnitude to explain a large part of the reduction in radiated power of the analyzed PnC's.
5. Discussion and Conclusions
In this work, we have extended our previous numerical work of low-temperature ballistic phonon thermal conduction in hole-array phononic crystals to higher frequencies, and studied mainly the influence of the length scale of the lattice (lattice constant) on the thermal conduction. By changing the periodicity, the interference conditions for coherent phonons in the structure change, leading to strong changes in the eigenmode spectra, or dispersion relations. These will in turn affect the density of states and group velocities, leading to strong enhancement and suppression effects for thermal conductance.
For the case of reducing thermal conductance, we found a clear trend that the larger the period, the larger the reduction, which reached suppression factors ∼40. The reduction factors were also increasing with increasing temperature. Within our simulations, which were limited on the large array side by computational resources and focused in the ballistic limit, no theoretical limit was yet found. This does not, however, mean that such a limit does not exist, as at some length scale the finite mean free path with start to dominate [
18]. A clear conclusion from the analysis of the density of states and average group velocity was that the most significant effect for the larger periodicities is the reduction of the group velocities, by an order of magnitude. This reduction seems to result from the increase of the number of flattened branches at the Brillouin zone edge as the period increases and thus the Brillouin zone edge moves to smaller values of
K.
We also observe a counterintuitive low-temperature enhancement of the thermal conduction for the smaller period structures, up to a factor ∼3, in qualitative (but not quantitative) agreement with another study [
15]. This enhancement is caused by the increase of the density of states at low frequencies, which seems to be dominated by the softening of the quasishear mode. Unlike the reduction, which was already observed experimentally [
6], the enhancement has not been observed yet. On this side, there seems to be a maximum that can be achieved as a function of the lattice parameter, as a limiting curve for the power
vs. temperature was approached by reducing the period.


