Article

Influence of Nano-Sized SiC on the Laser Powder Bed Fusion of Molybdenum †

by
Nathan E. Ellsworth
1,*,
Ryan A. Kemnitz
2,
Cayla C. Eckley
2,
Brianna M. Sexton
2,
Cynthia T. Bowers
3,
Joshua R. Machacek
4 and
Larry W. Burggraf
1
1
Department of Engineering Physics, Air Force Institute of Technology, 2950 Hobson Way, Wright-Patterson AFB, OH 45433, USA
2
Department of Aeronautics and Astronautics, Air Force Institute of Technology, 2950 Hobson Way, Wright-Patterson AFB, OH 45433, USA
3
Materials and Manufacturing Directorate, Air Force Research Laboratory, 2950 Hobson Way, Wright-Patterson AFB, OH 45433, USA
4
Research School of Physics, Australian National University, Canberra 2601, Australia
*
Author to whom correspondence should be addressed.
The views expressed in this article are those of the authors and do not reflect the official policy or position of the United States Air Force, Department of Defense, or the US Government.
Crystals 2022, 12(9), 1276; https://doi.org/10.3390/cryst12091276
Submission received: 16 August 2022 / Revised: 1 September 2022 / Accepted: 4 September 2022 / Published: 8 September 2022

Abstract

:
Consolidation of pure molybdenum through laser powder bed fusion and other additive manufacturing techniques is complicated by a high melting temperature, thermal conductivity and ductile-to-brittle transition temperature. Nano-sized SiC particles (0.1 wt%) were homogeneously mixed with molybdenum powder and the printing characteristics, chemical composition, microstructure, mechanical properties were compared to pure molybdenum for scan speeds of 100, 200, 400, and 800 mm/s. The addition of SiC improved the optically determined density and flexural strength at 400 mm/s by 92% and 80%, respectively. The oxygen content was reduced by an average of 52% over the four scan speeds analyzed. Two mechanisms of oxygen reduction were identified as responsible for the improvements: oxidation of free carbon and the creation of secondary phase nanoparticles. This study illustrates the promising influence of nanoparticle additions to refractory metals in laser powder bed fusion.

1. Introduction

The production of molybdenum through additive manufacturing (AM) methods is disadvantaged because of its refractory properties. As a refractory metal, molybdenum has a high melting point, low thermal coefficient of expansion, excellent thermal and electrical conductivity, and good structural properties [1]. While molybdenum is used often as an alloying material for stainless steel or as an additive in solid lubricants, high entropy alloys, and molybdenum-silicon based cermets, there has been recent work detailing the use of pure molybdenum as a structural material for fuel elements in nuclear reactors and biomedical implants [2,3,4,5,6,7,8].
AM methods, such as laser powder bed fusion (LPBF), which produce components by a sequential process of depositing and melting metal powder layer-by-layer, have the advantages of reduced tooling, machining, and waste over traditional, subtractive manufacturing. Refractory metals, like molybdenum and tungsten, have high ductile-to-brittle transition temperatures (DBTT) and are hard to machine so the ability to develop complex, geometrical designs without extensive post-processing is appealing. While AM methods are projected to provide new opportunities for refractory metals and refractory metal-based cermets in the coming years, satisfactory production of pure molybdenum and molybdenum/ceramic mixtures by conventional AM methods remains difficult [9,10].
Two leading causes of crack formation and poor consolidation in LPBF refractory metals are thermal gradients and oxygen embrittlement of grain boundaries introduced during the build process. A periodic increase and decrease in temperature is inherent to the printing process as the laser rasters across each powder layer. A cyclical temperature profile and fast cooling rates, due to molybdenum’s high thermal conductivity, introduce thermal gradients which promote the development of residual stresses as the material cools. As the residual stresses exceed the fracture strength of molybdenum, cracks form and propagate through the consolidated material. Rapid solidification associated with the fast cooling rates increases porosity by entrapping gas bubbles evolved during the printing process [11]. Even though oxygen levels in the print chamber are held under 1000 ppm, at the elevated temperatures in AM processes molybdenum is susceptible to oxidation by the oxygen present on the surface of the powder particles [12]. Oxygen has a low solubility in molybdenum and the formed oxides reside at interfaces between the melted particles lowering the grain boundary cohesion and strength, allowing cracks to form and propagate [13,14].
Previous LPBF molybdenum studies have shown that sufficient laser power is necessary to produce pure molybdenum components with satisfactory relative density. Wang et al. [15] increased the relative density by almost 20% over Faidel et al. [10] by increasing the laser power from 200 W to 400 W and using a novel supporting structure. This approach increased the effective energy input into the powder system and reduced the cooling rates which suppressed crack formation. At higher temperatures, the viscosity and wettability of metals is increased which has been shown to improve the melting behavior and density. Traditional welding has taken advantage of a similar photothermal effect by including numerous additives to the powder feedstock which improve melting and sintering [16]. The addition of nanoparticles, in particular, could provide a means of improving the effective energy input in LPBF without resorting to complex printing techniques or increased laser power, which can cause separate printing issues [17]. Particle size plays an important role in the laser absorption of powders, with absorption increasing as the size of the particles decrease due to multiple reflections [18]. Jadhav et al. [19] produced this photothermal effect in copper powder by the addition of tin nanoparticles which improved the optical absorption, and thus the effective energy input, at the wavelength of the laser. Modifications of stainless steel with silicon carbide (SiC) showed a similar increase in laser absorption [20].
Studies by Kaserer et al. [21] and Braun et al. [22] produced dense and crack-free components, with improved bending strength and hardness, by alloying molybdenum with a dilute, 0.45 wt%, addition of pure carbon. The improvements in cracking and porosity from the addition of carbon were attributed to grain refinement. The increased grain boundary area reduces the weakening effect caused by oxygen segregation. Additional carbon content increased grain refinement, grain boundary area, and strength [23].
Carbide additions to LPBF molybdenum have not been reported, but efforts on the addition of tantalum and zirconium carbide to AM tungsten indicate a formation of secondary metal-oxide or carbide nanoparticles distributed throughout the metal matrix which result in suppression of crack formation, and increased grain refinement. The secondary phase nanoparticles provided dispersion strengthening to improve the strength and reduce cracking in AM tungsten as well as a means to scavenge oxygen and reduce grain boundary embrittlement [24,25].
To our knowledge, there have not been any reports on the addition of carbides to LPBF molybdenum. In the present study, we used LPBF to observe the influence of a dilute carbide addition, 0.1wt% SiC, on the consolidation characteristics, microstructural evolution, in-situ oxidation, and mechanical properties of pure molybdenum.

2. Materials and Methods

The pure molybdenum and Mo-0.1SiC specimens used in this study were produced using a GE Concept Laser Mlab Cusing 200R 3D metal printer (Boston, MA, USA) with a 200 W continuous wave Yb:YAG fiber laser. Nitrogen was used as a shield gas. Oxygen levels were maintained through the printing process at the lowest observable level (<1000 ppm) as monitored through system controls. Feedstocks were pure molybdenum powder (99.9% Mo) with an average particle size of approximately 30 μ m, provided by Tekna (Sherbrooke, QC, Canada) and silicon carbide with average particle sizes on the order of hundreds of nm, provided by the Air Force Research Laboratory (Wright-Patterson Air Force Base, OH, USA). Batches of 200 g powder (199.8 g Mo and 0.2 g SiC) were mixed in air using a FlakTec Inc. DAC 250.1 FVZ-K SpeedMixer (Landrum, SC, USA). The batches were mixed for a pair of one-minute periods with one minute of cooling between. As soon as the powders were mixed, an SEM tab with carbon tape was used to take a sample of the mixed powders. The powders were immediately imaged in the SEM to ensure uniform mixing. Figure 1a,b show the spherical molybdenum particles and non-spherical SiC particles, respectively. Homogeneous mixing of the powders was confirmed with images such as the one displayed in Figure 1c where the SiC particles are shown well distributed and adhered to the surface of the molybdenum particles.
Cuboid specimens with dimensions 12 mm × 4 mm × 2 mm were consolidated on a copper substrate using a fixed laser power of 200 W, hatch spacing of 50 μ m, and a layer thickness of 20 μ m at four different scan speeds: 100, 200, 400 and 800 mm/s. A meander laser scan strategy with a 90 rotation between layers was used. The line energy densities (LED) and volumetric energy densities (VED) for the process parameters described above are shown in Table 1.
Following the procedure used in Eckley et al. [26] and Kemnitz et al. [27], all parts were printed on the copper substrates with a 0.5 mm offset at a scan speed of 800 mm/s. This offset was removed when the parts were separated from the substrates using wire-cut electrical discharge machining.
The chemical composition of the powders and consolidated specimens was analyzed by Luvak Inc. (Boylston, MA, USA) following procedures outlined in ASTM 1019-18 [28]. Oxygen and nitrogen concentrations were determined through inert gas fusion, while carbon composition was determined through combustion infrared detection. The powder samples were only analyzed for oxygen content.
Print surfaces were examined using a MIRA-3 field emission scanning electron (FE-SEM) microscope (TESCAN, Brno, Czech Republic). The cuboid specimens were subjected to three-point bend strength testing with a displacement rate of 0.01 mm/s, and a load applied across the build direction using an MTS 810 load frame (MTS Systems Corporation, Eden Prairie, MN, USA). Measurements were taken on three samples from each scan speed and results were averaged. Following bend strength measurements, the fracture surfaces were examined with FE-SEM imaging and analyzed via energy-dispersive x-ray spectroscopy (EDS) using an EDAX TEAM Pegasus system (Ametek Materials Analysis Division, Mahwah, NJ, USA). The broken specimens were mounted in a conductive phenolic resin using a MetPress A automatic mounting press (Metlab, Nigara Falls, NY, USA) so that both the top (print) and side surfaces were available for inspection. The specimens were mechanically ground to 800 grit with SiC grinding paper using an EcoMet 300 grinding and polishing machine (Buehler, Lake Bluff, IL, USA). Vickers hardness measurements were conducted on the top surfaces using a QAtm QNess Q60 A+ Evo micro hardness tester (Verder Scientific, Newtown, PA, USA).
Select samples were etched using a 30% hydrogen peroxide and colloidal silica suspension. Samples were analyzed by both electron backscatter diffraction (EBSD) and EDS, using the EDAX TEAM Pegasus system. EBSD data was collected in both the top and side surfaces of select samples. Analysis of the data was performed using EDAX’s OIM software.
The top surfaces of select cuboid specimens were further polished to 1200 grit such that only the pores could be observed through optical microscopy and cracks and grain boundaries were unresolved. Optically determined density (ODD) measurements were conducted. Twenty independent images were taken of each sample, analyzed with imaging software, and average values were determined (Leica MeF4 and software, Wetzlar Germany).
The Mo-0.1SiC cuboid specimen printed at 400 mm/s was prepared for transmission electron microscopy (TEM) analysis by a LYRA3 GM focused ion beam (FIB) (TESCAN, Brno, Czech Republic). TEM and EDS analyses were carried out on a Talos F200X (Thermofisher Scientific, Waltham, MA, USA). The sample prepared for TEM analysis was oriented so that the viewing direction was through the build direction.

3. Results

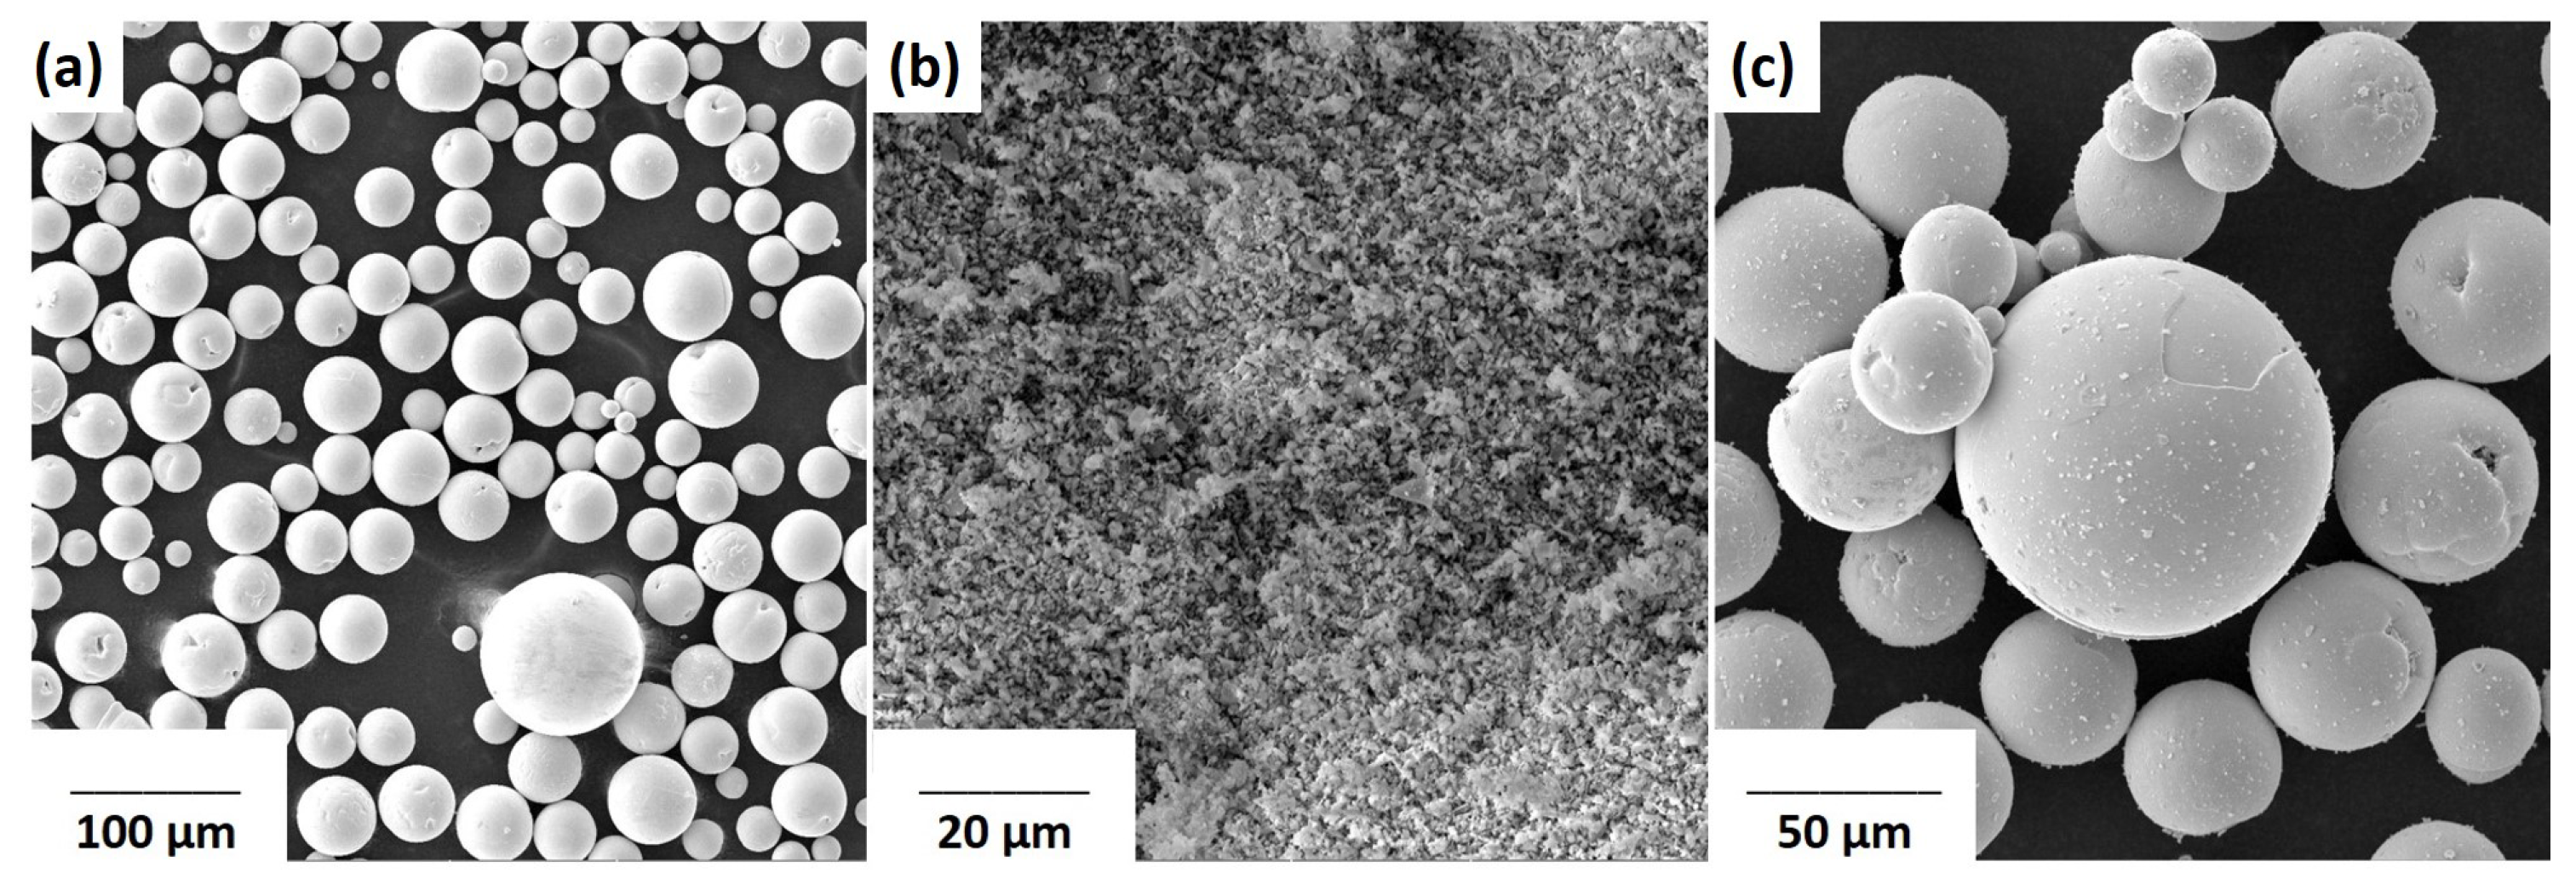
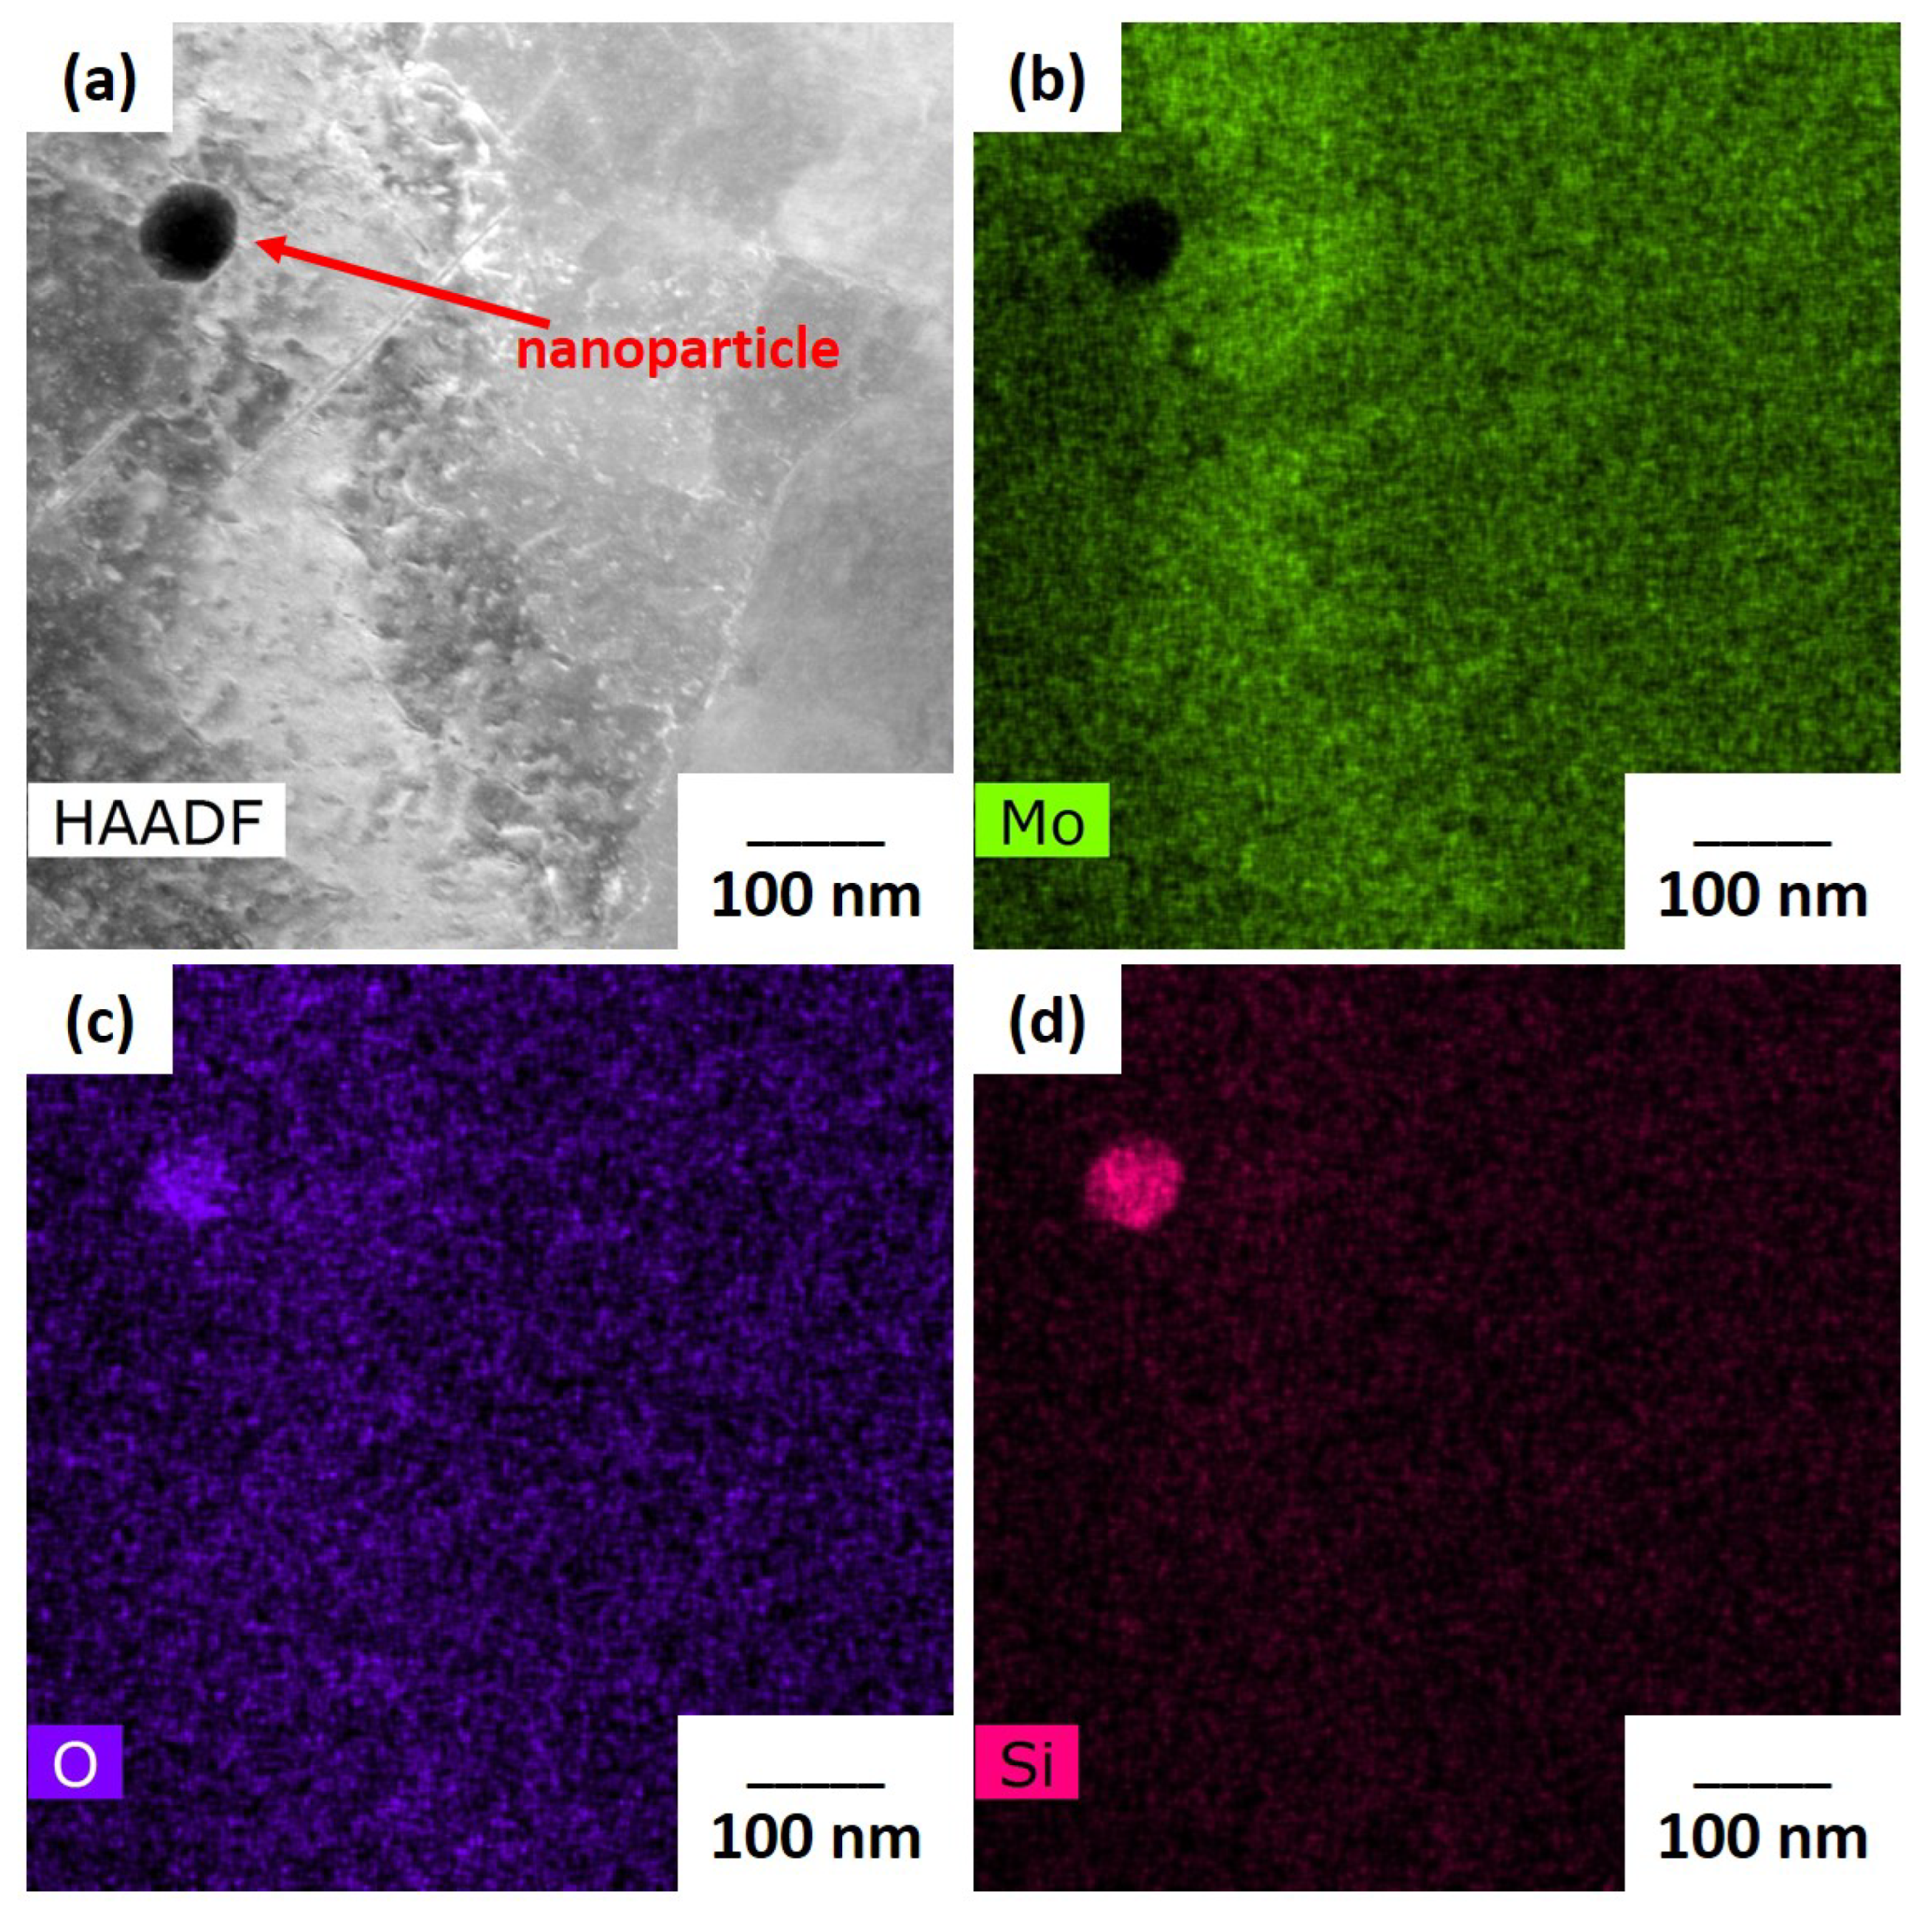
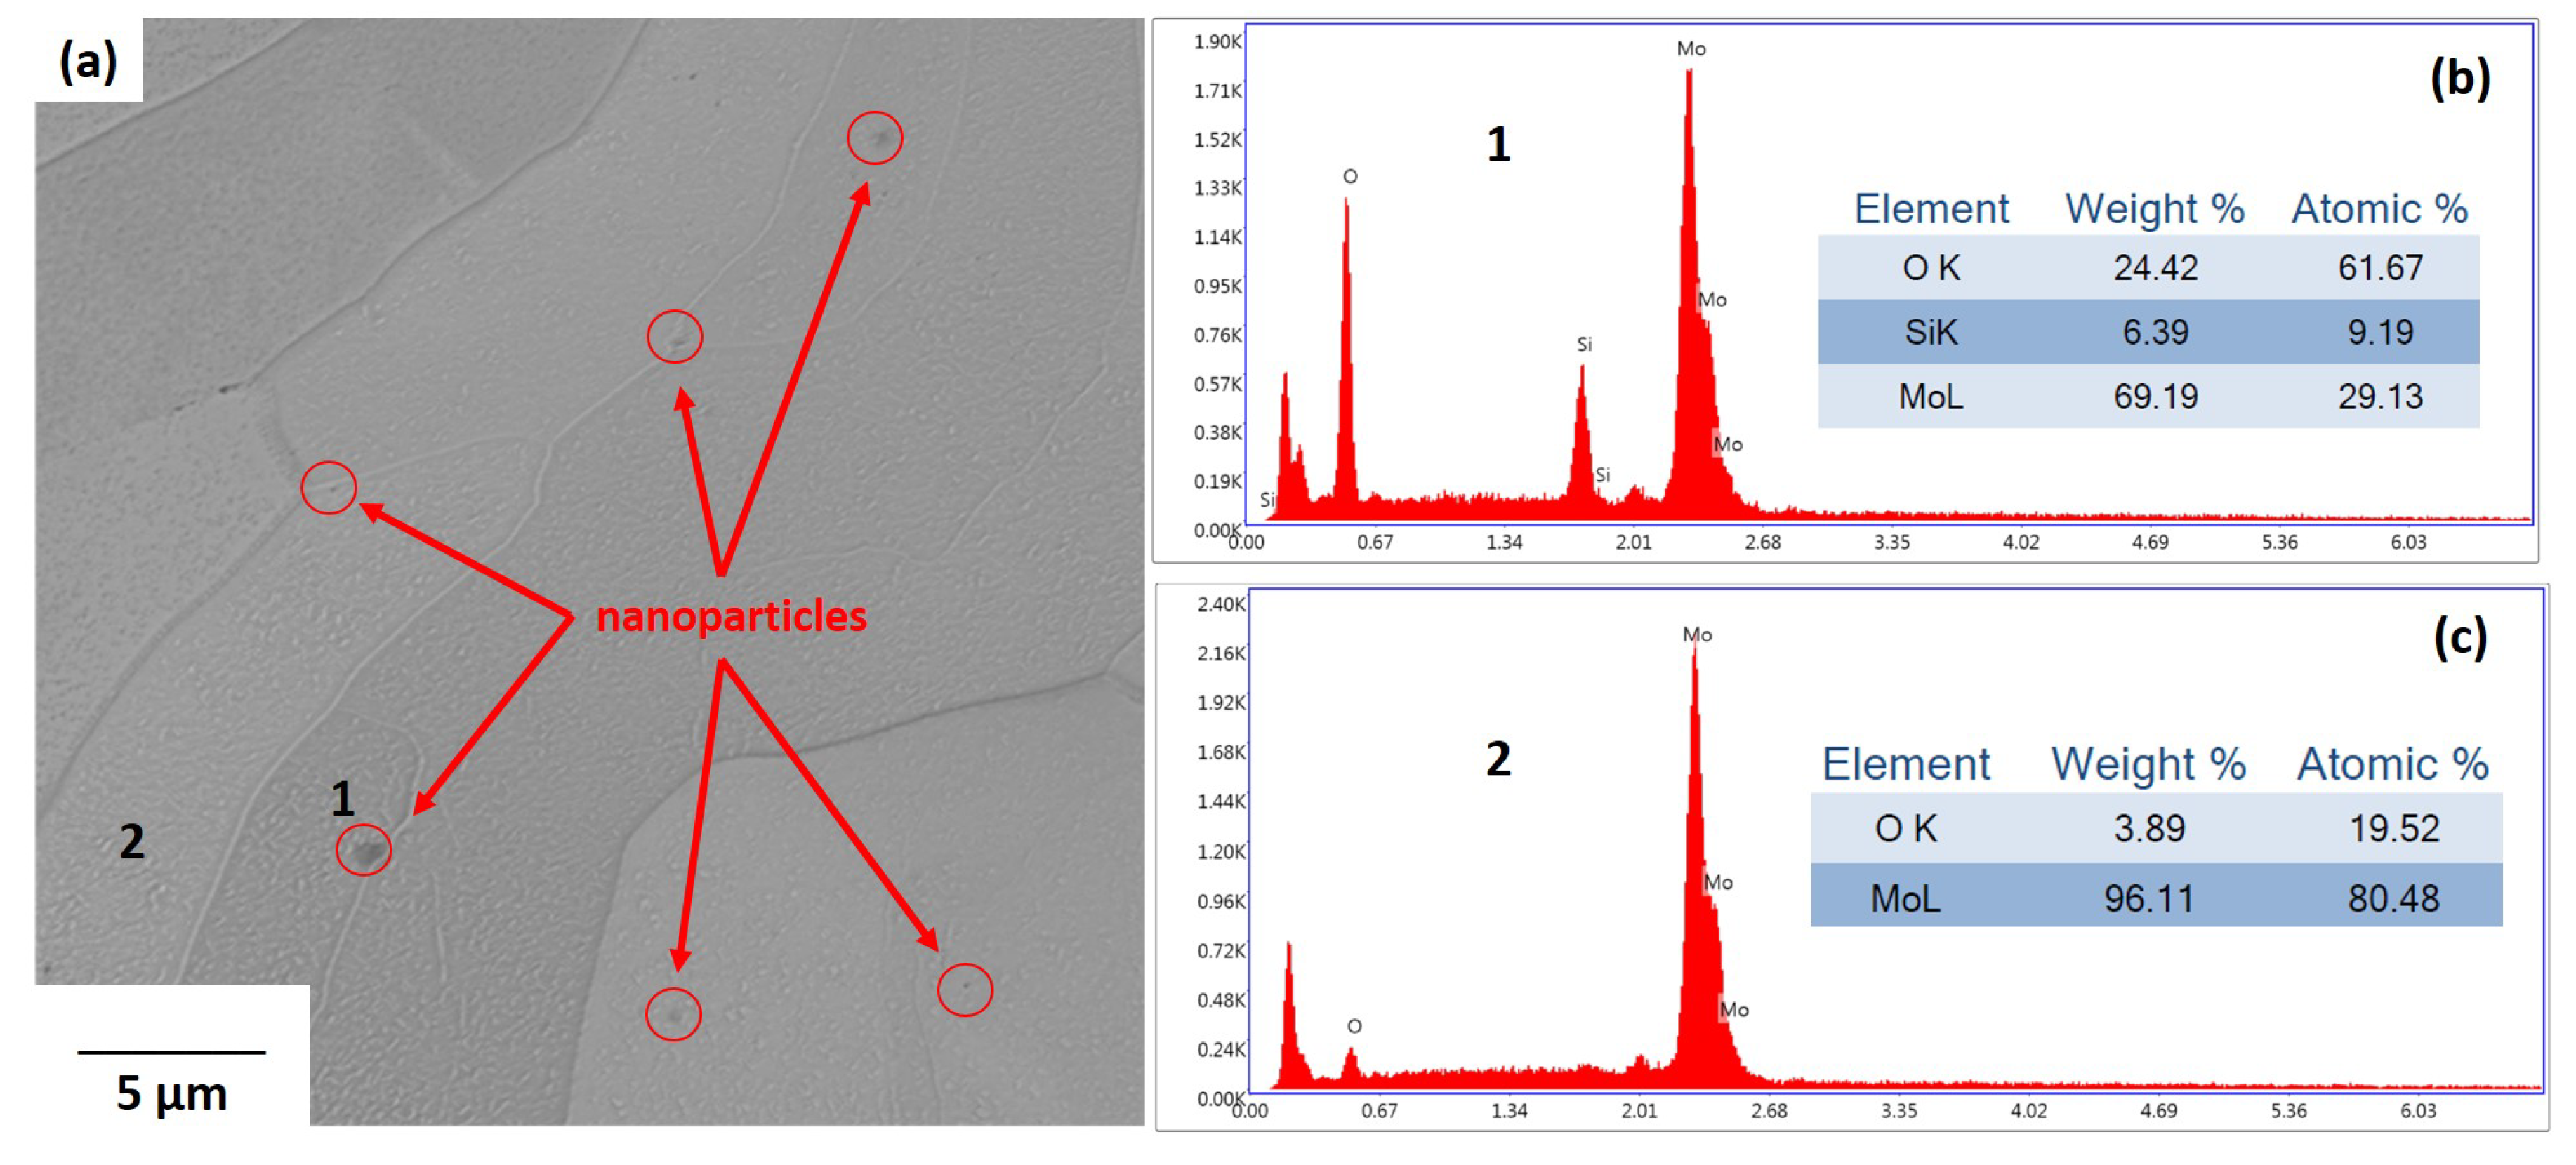
3.1. Chemical Analysis

The chemical composition of the starting feedstock powders and consolidated pure molybdenum and Mo-0.1SiC specimens are shown in Table 2. The nano-sized SiC powder had a much greater concentration of oxygen present and resulted in a slight increase of oxygen in the mixed powders over the pure molybdenum. The carbon present in both the pure molybdenum and Mo-0.1SiC specimens was affected by the experimental setup. No carbon should be present in the pure molybdenum samples and the limited increase in the Mo-0.1SiC samples indicates a significant amount of carbon was lost during the build process. Nitride formation due to the nitrogen build atmosphere was more prevalent in the Mo-0.1SiC samples but no significant pattern was observed. Oxygen concentration positively correlates with increasing scan speed (decreasing LED and VED), see Table 1. The pure molybdenum samples do not show a trend in oxygen concentration with scan speed.

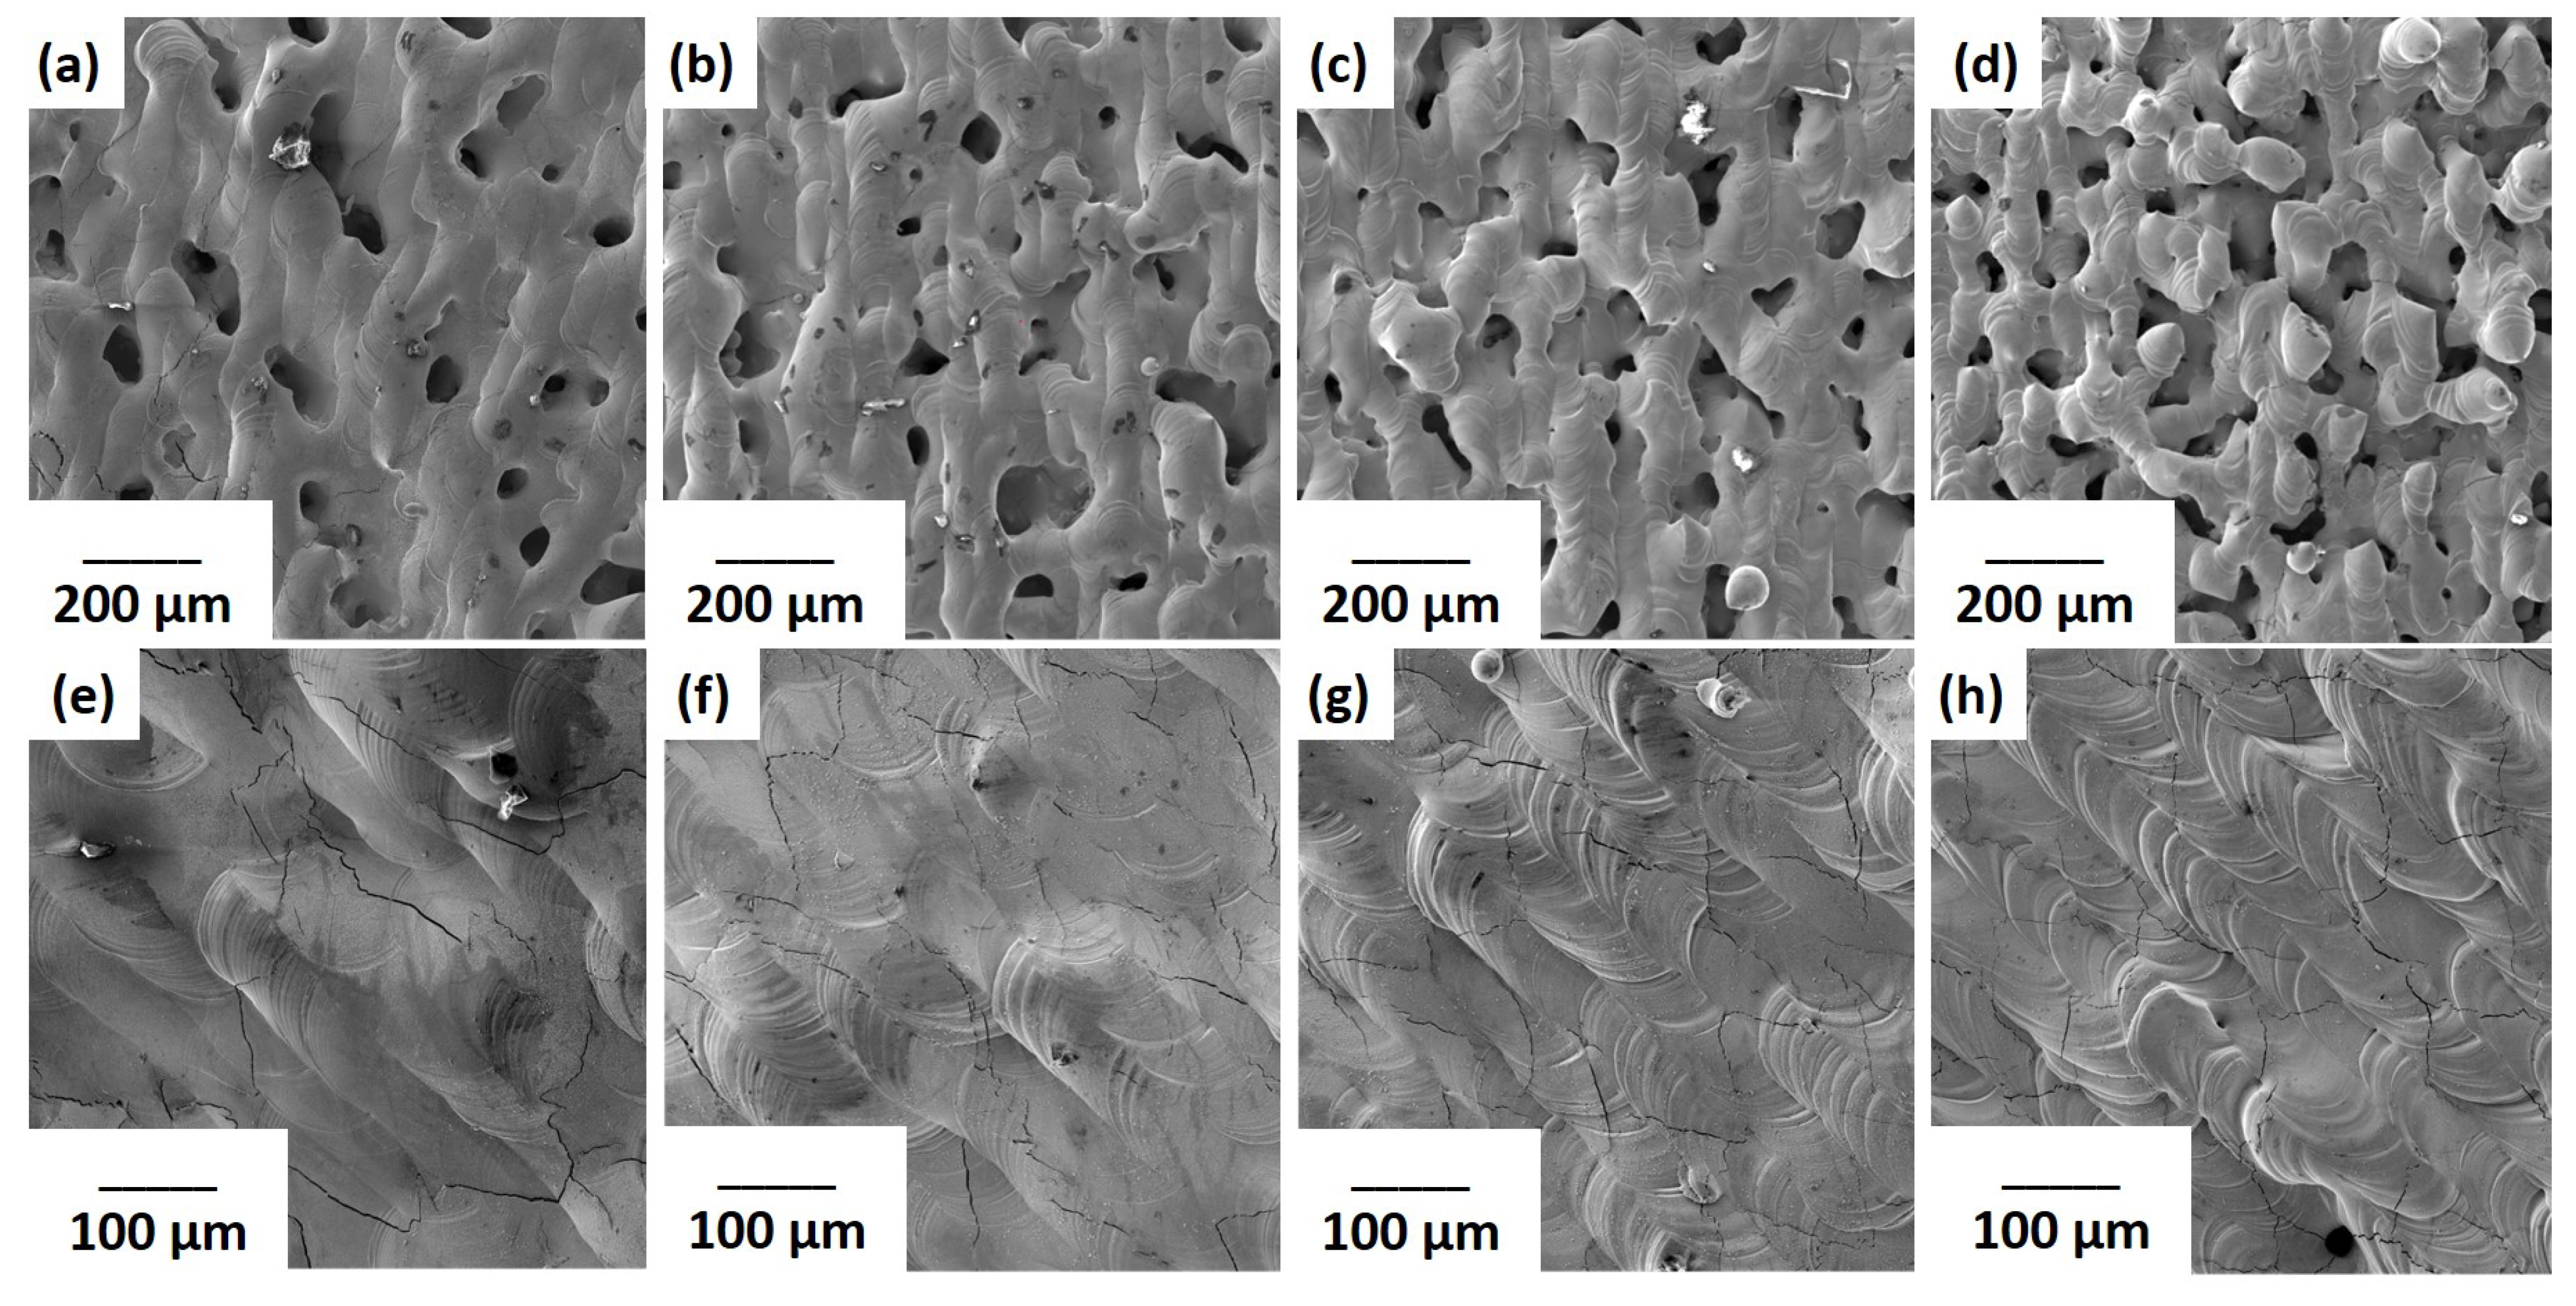
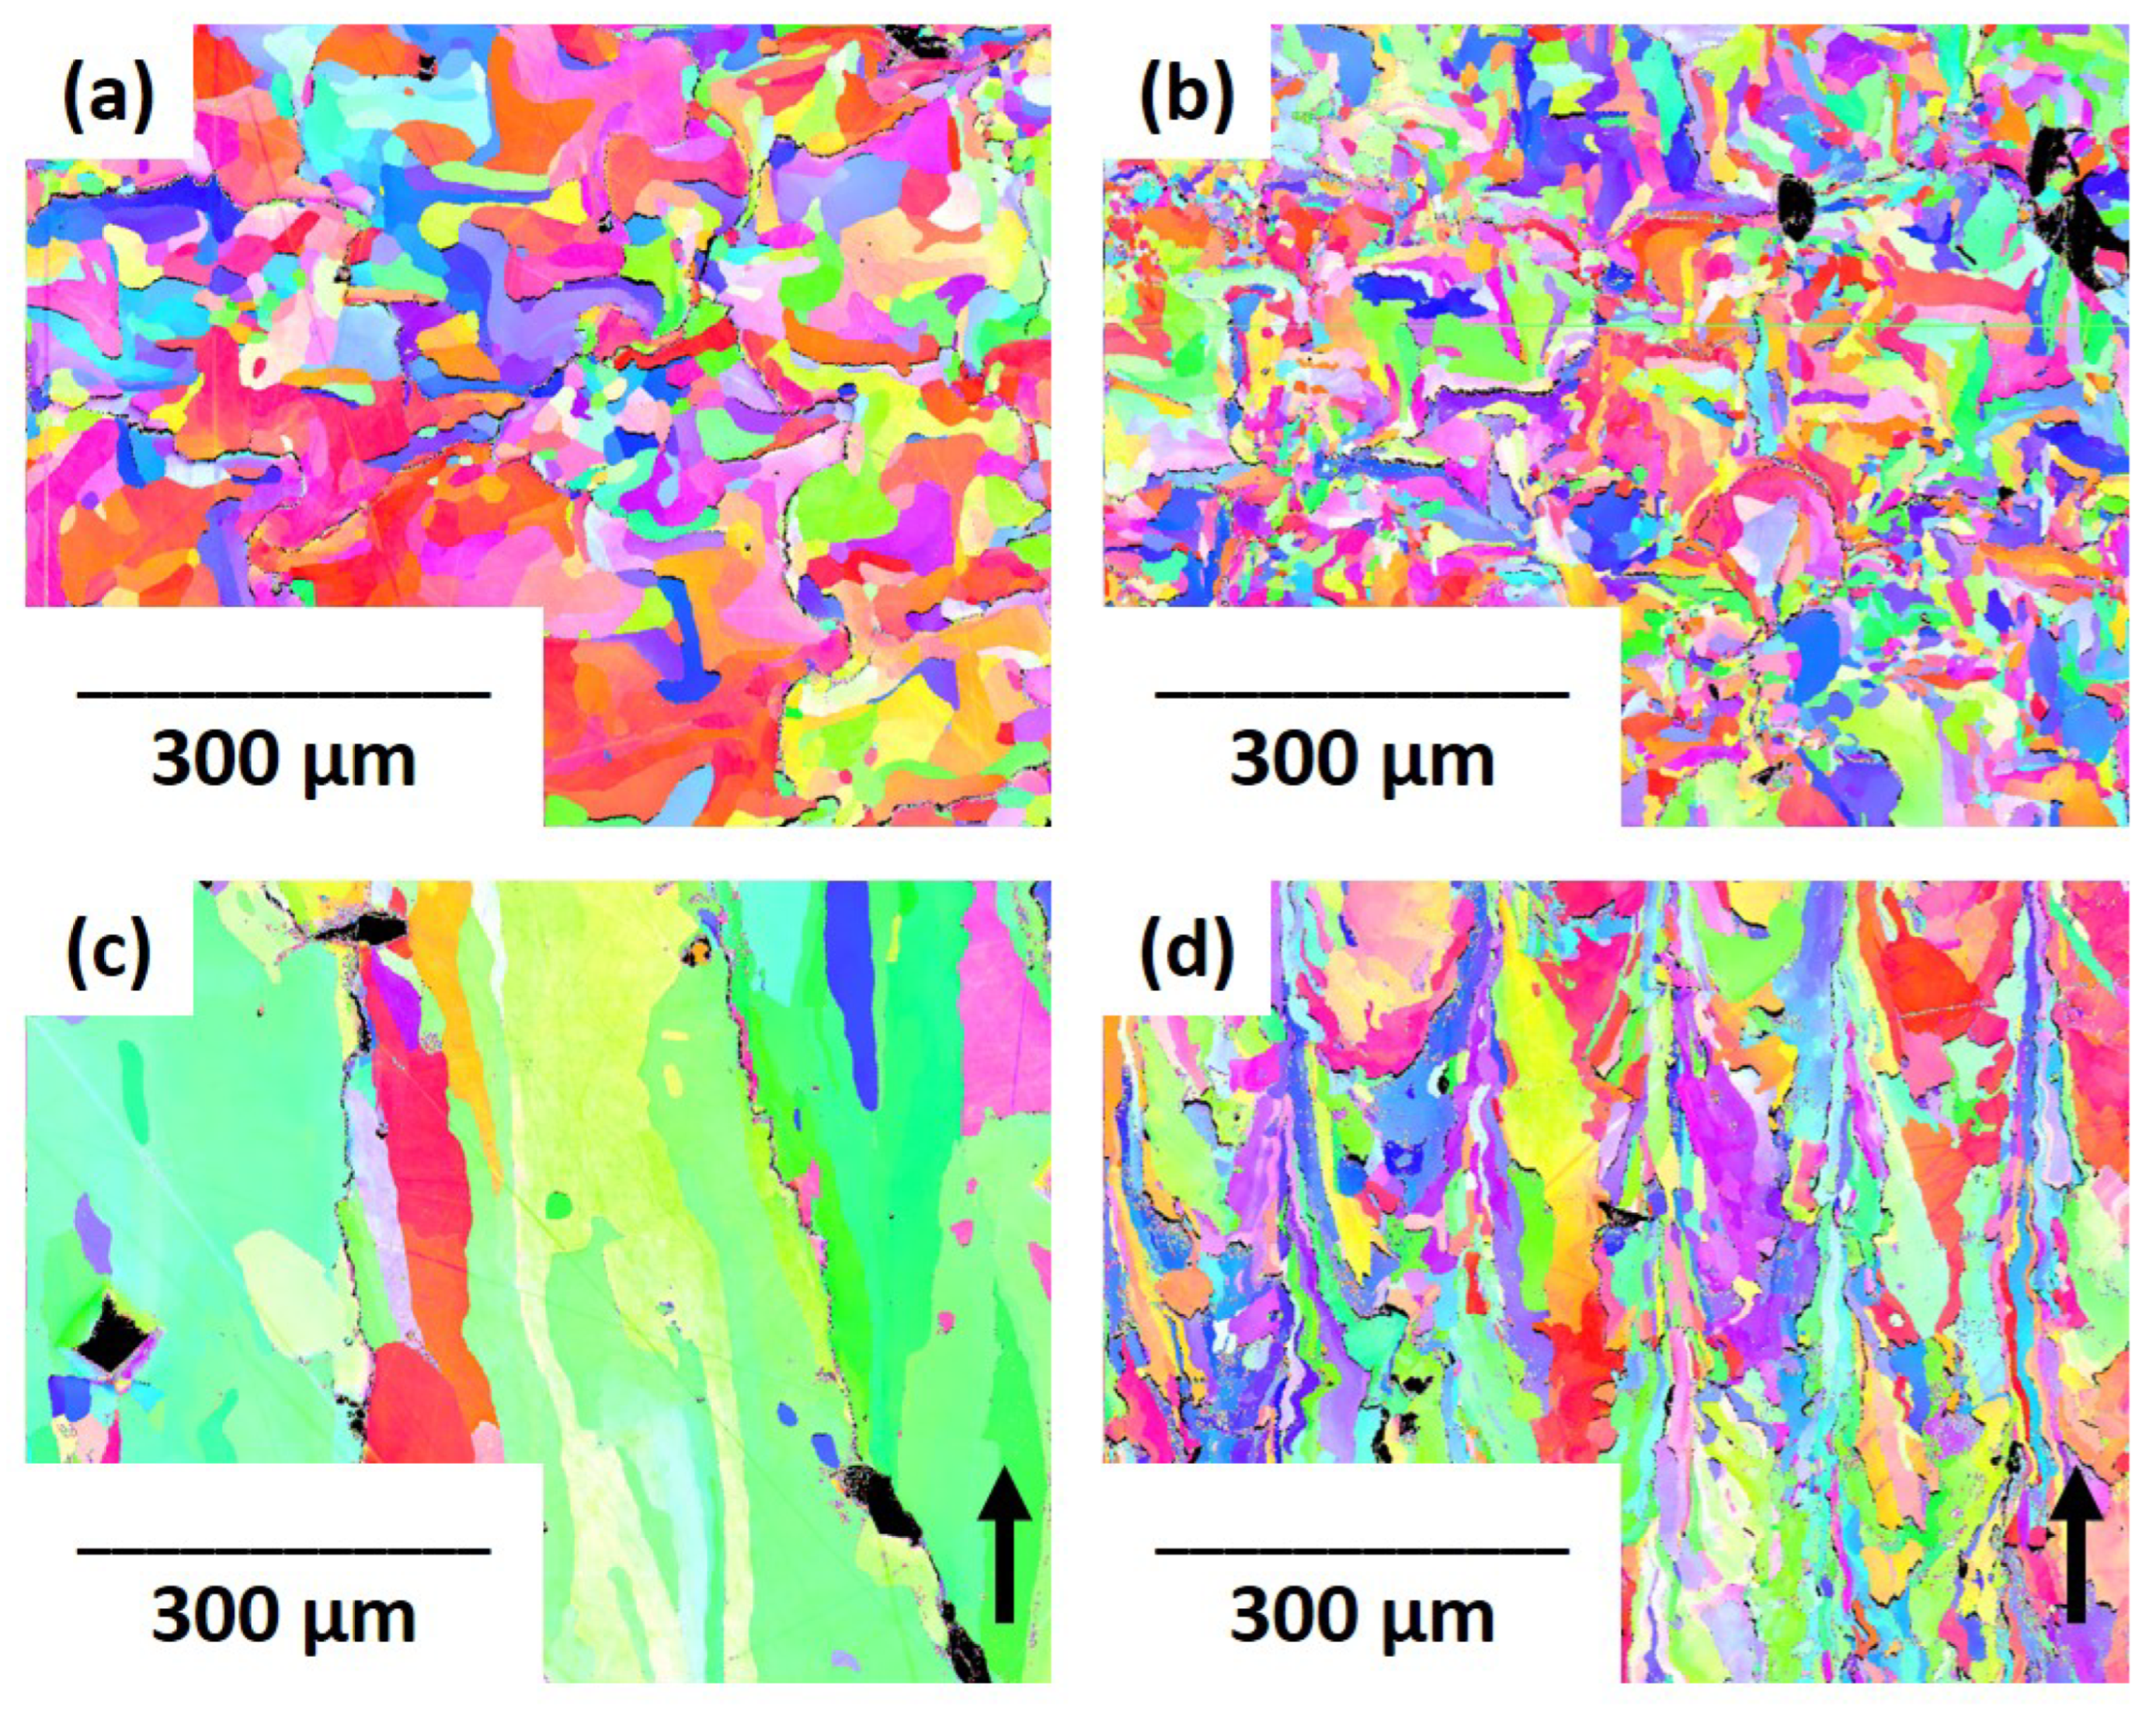
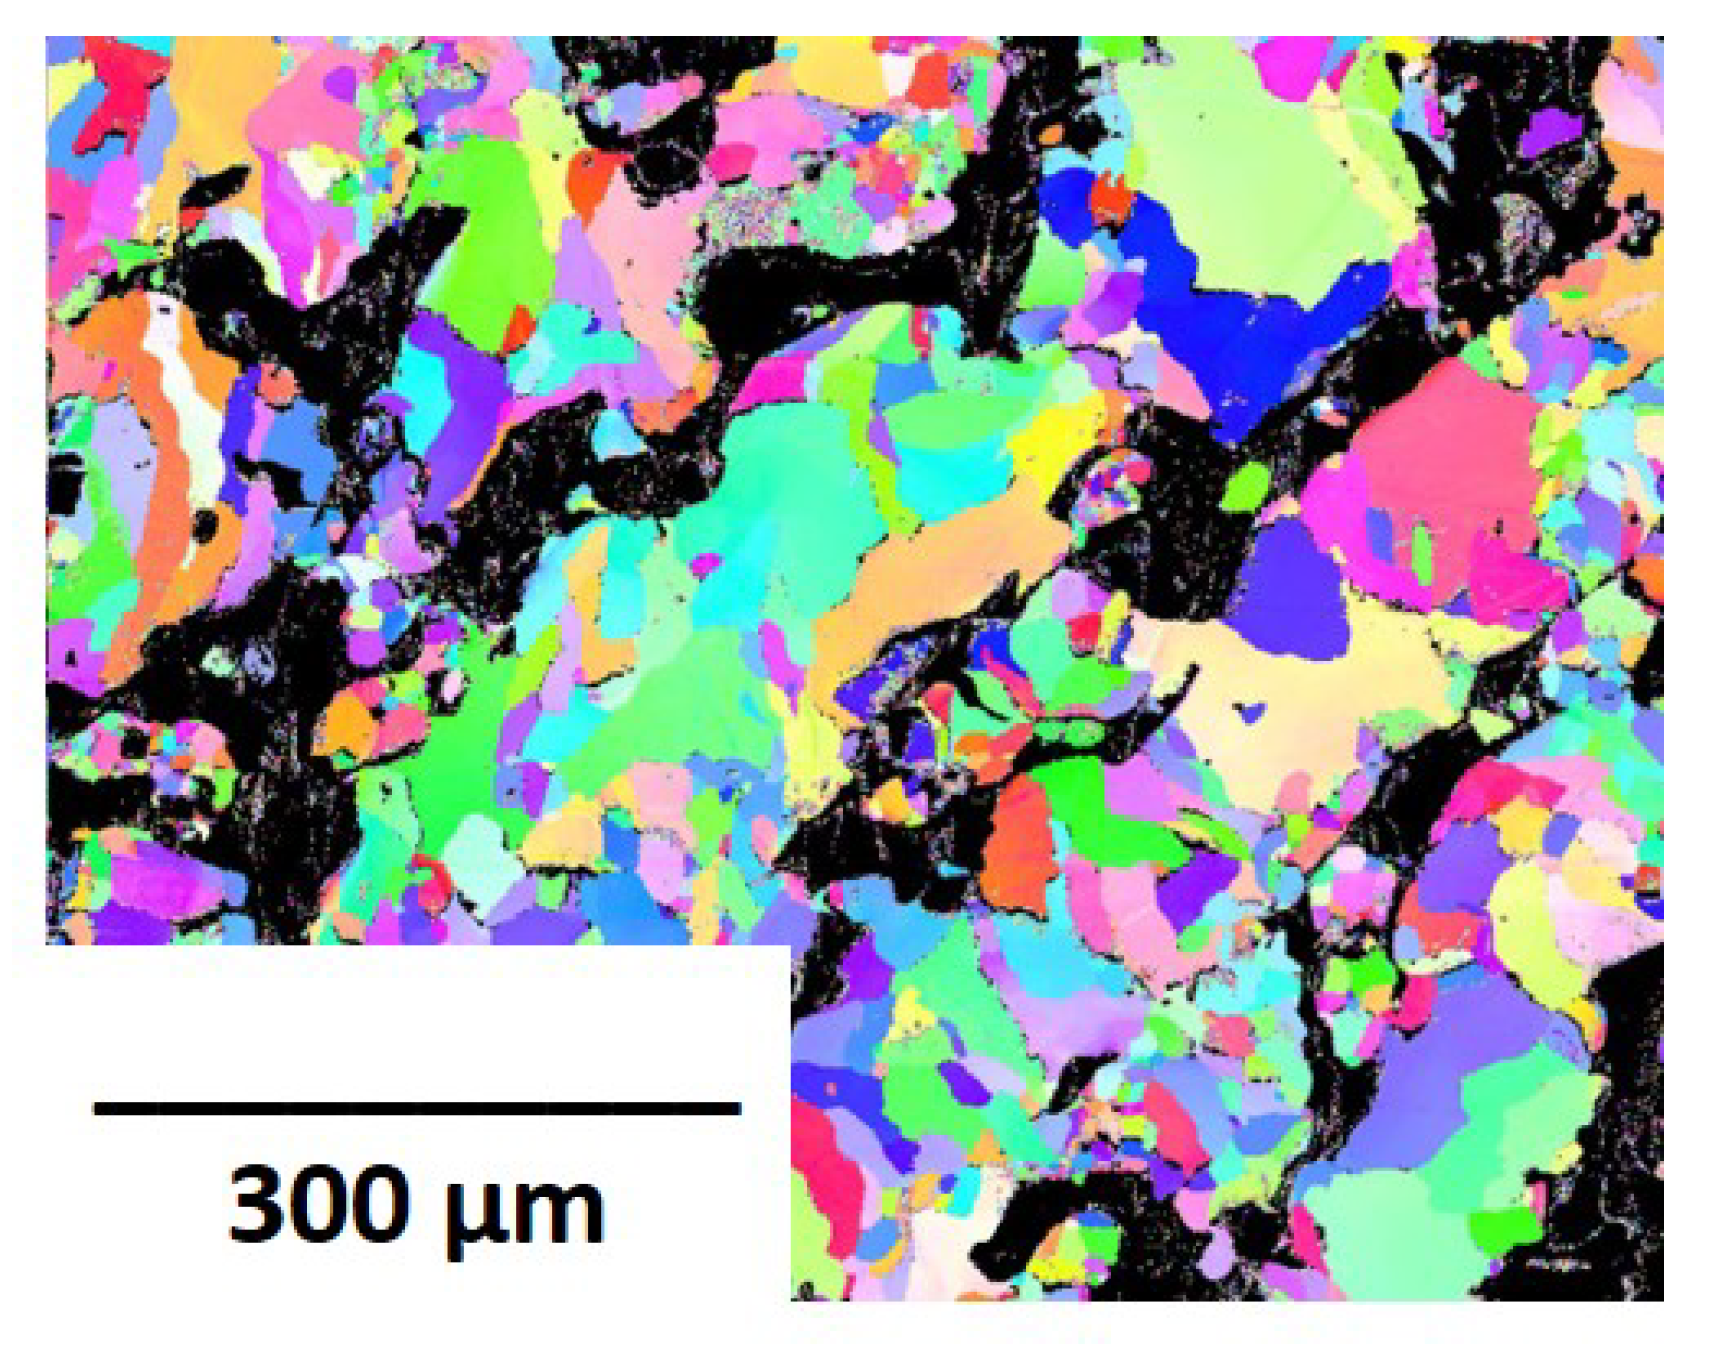
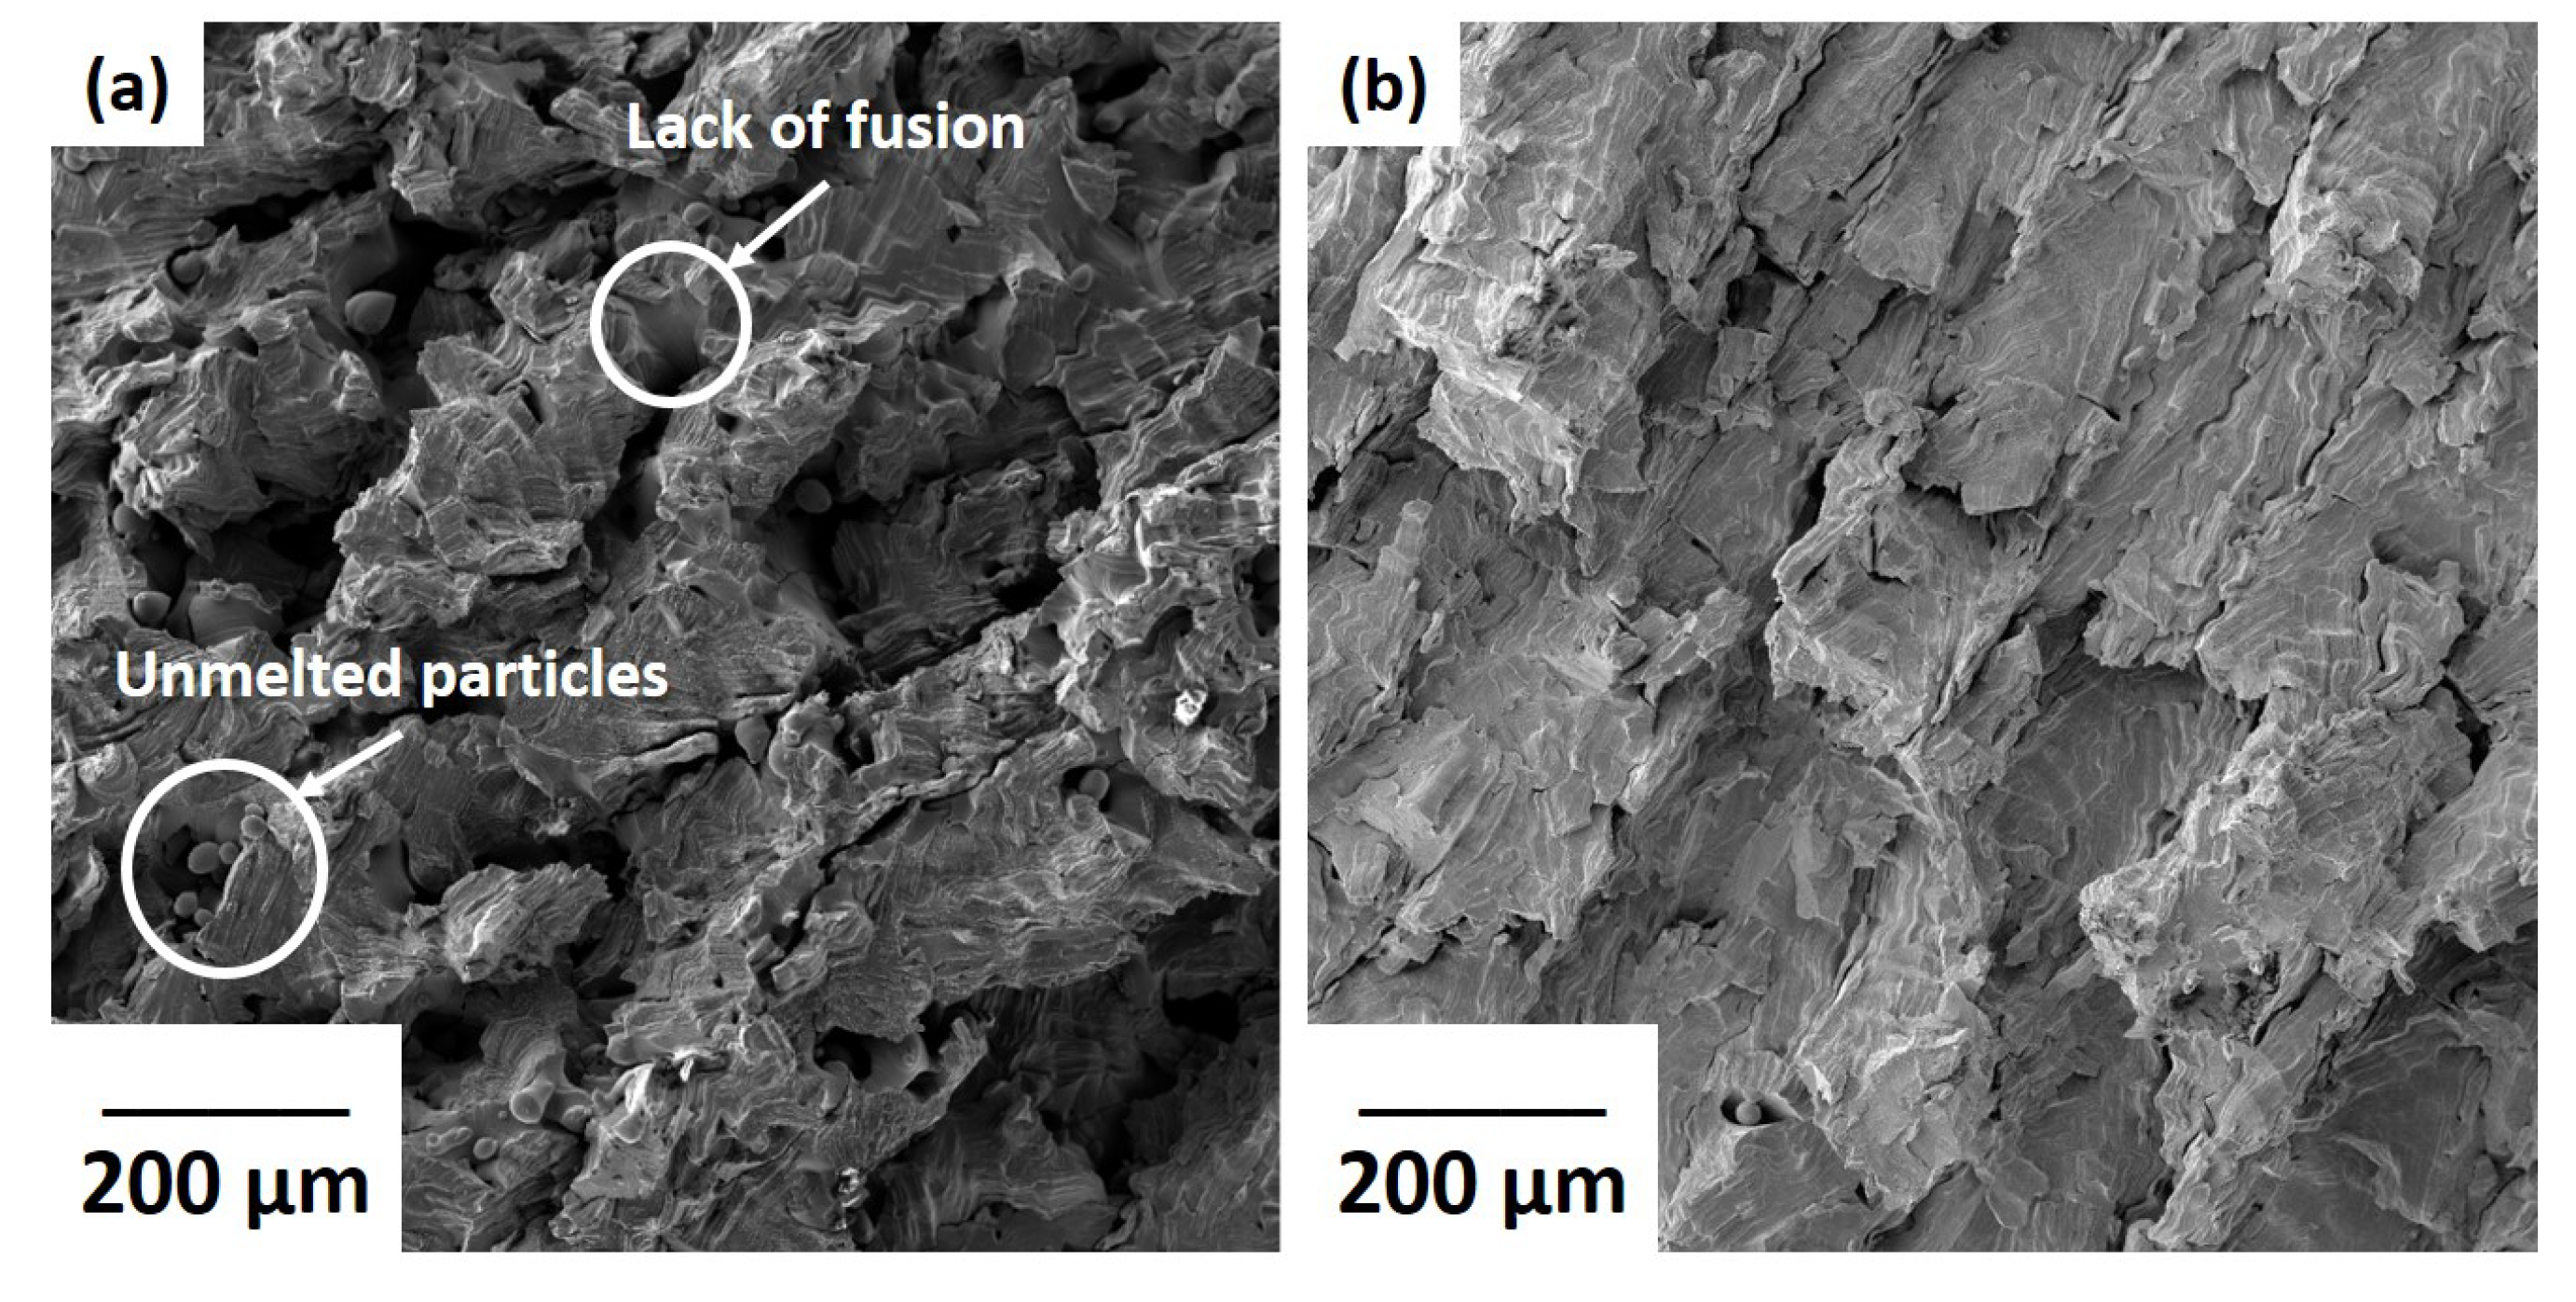
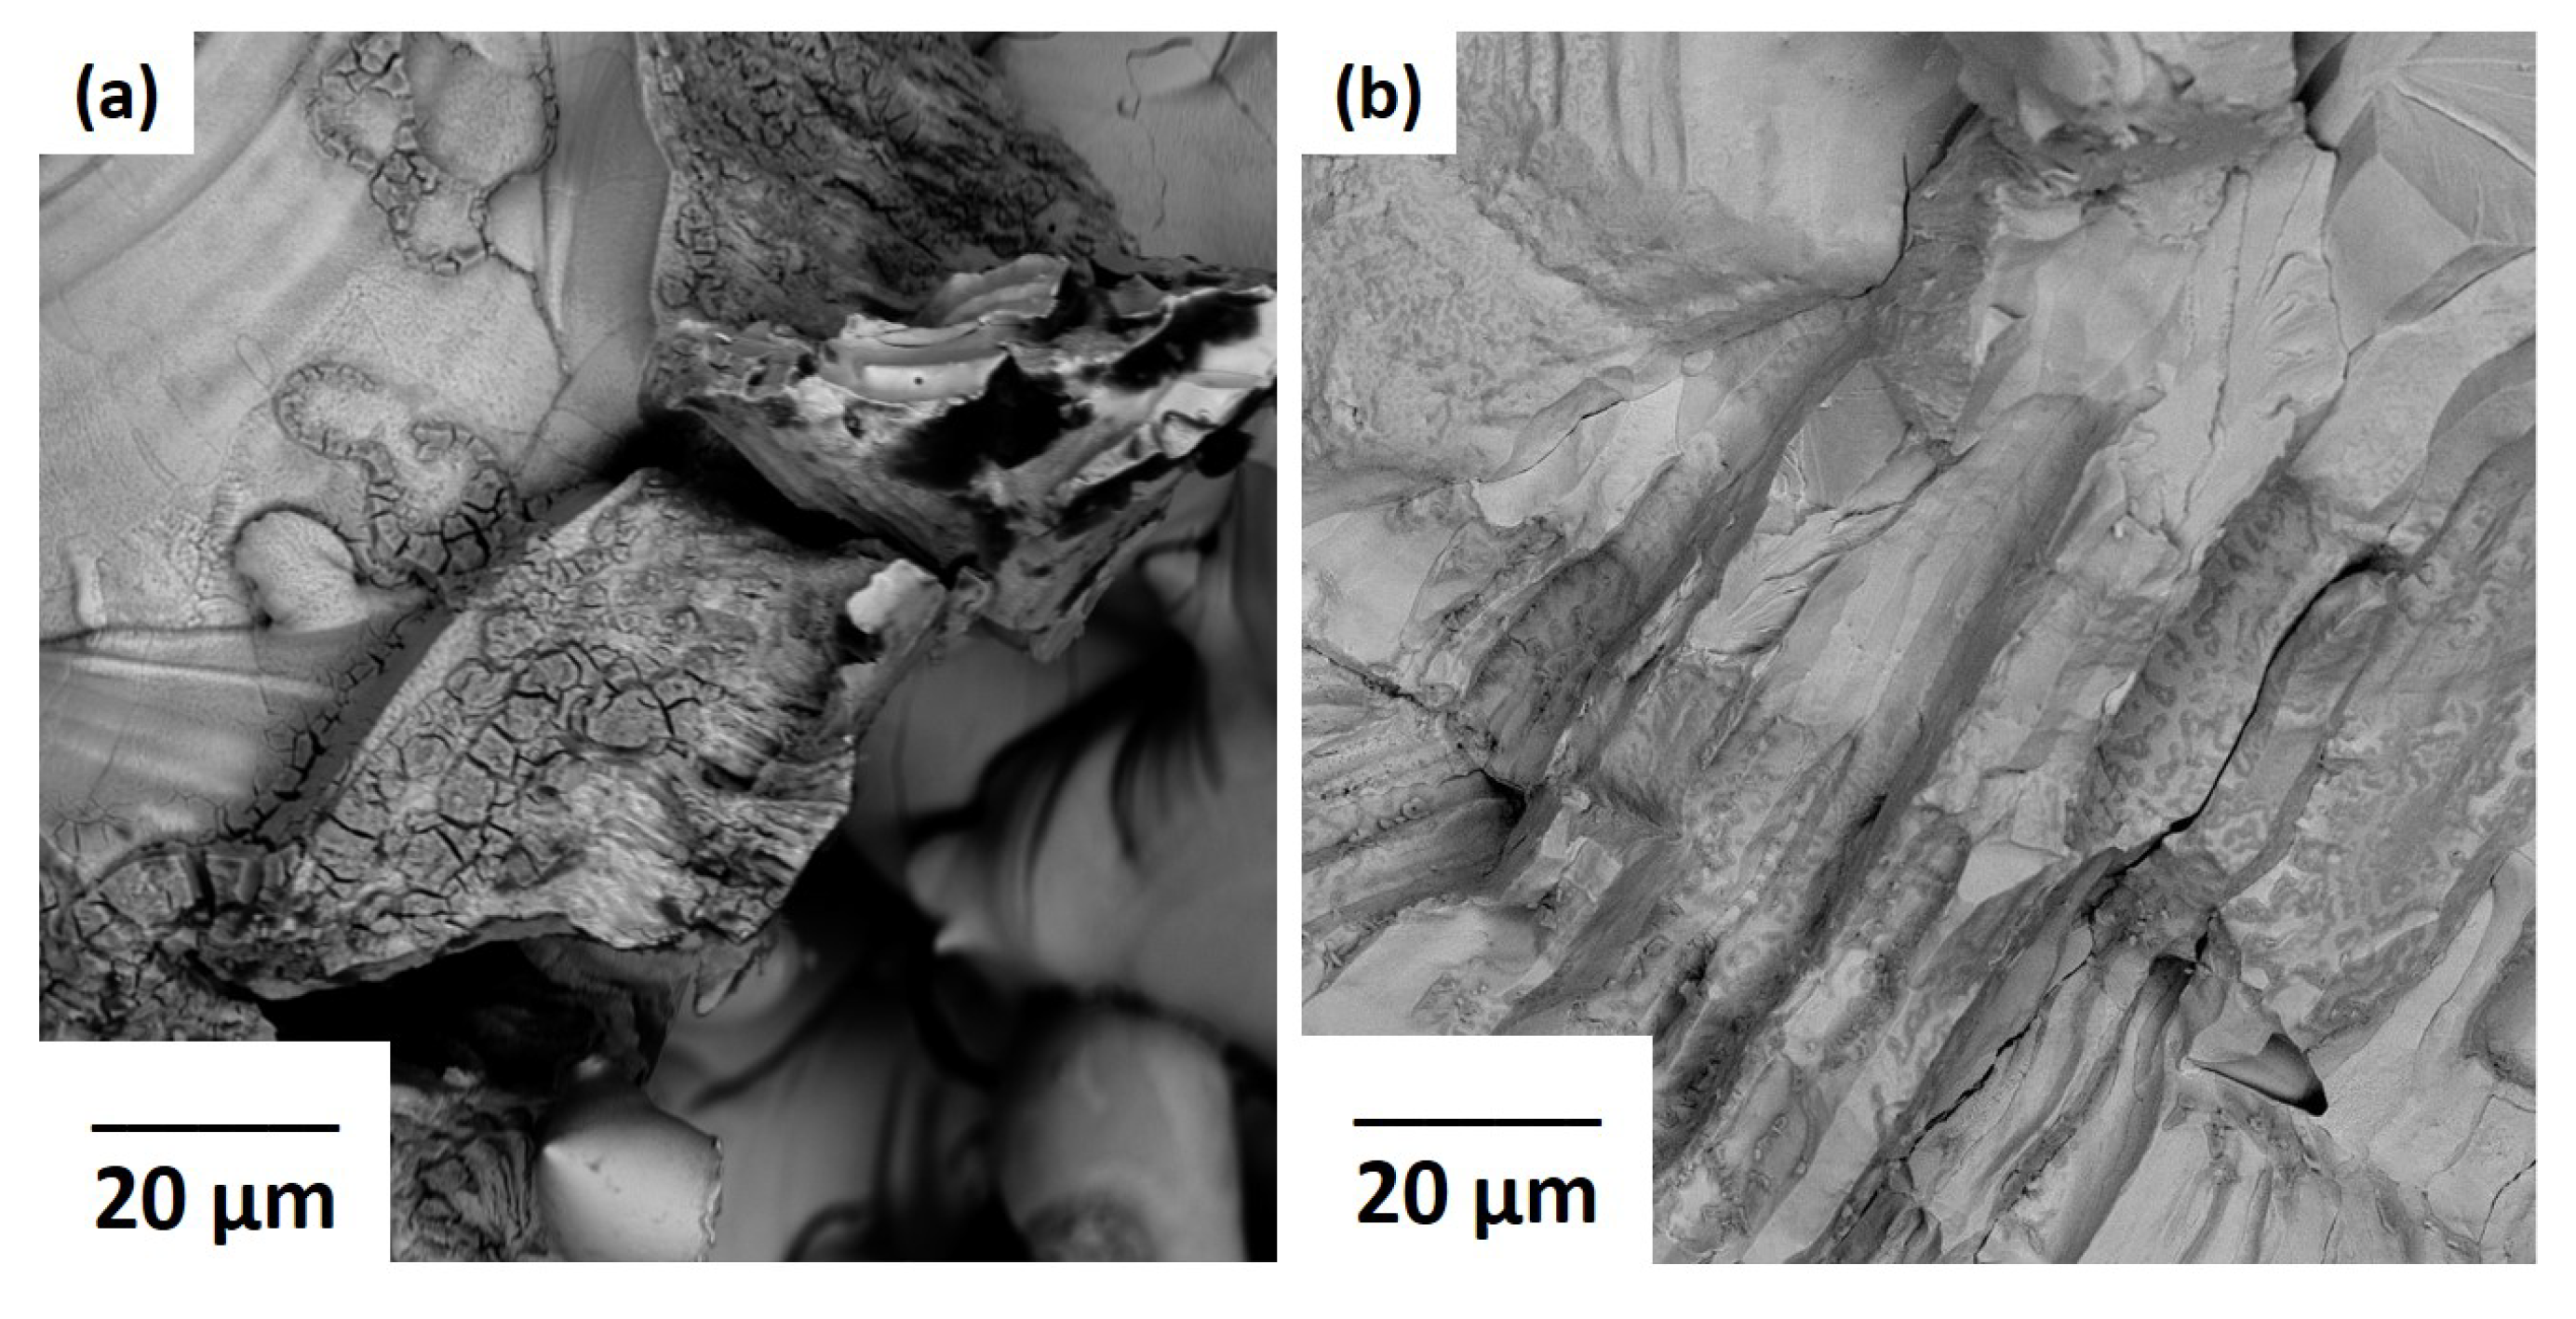
3.2. Microstructural Characterization

Figure 2 shows the top surfaces of pure molybdenum and Mo-0.1SiC specimens for the four different scan speeds. Cracking is noted on all samples although their presence in the pure molybdenum is obscured by the porosity. The addition of SiC did not prevent that cracking that appears along the weld tracks and 45 to the weld direction as is commonly seen in welding images of tungsten and molybdenum. As mentioned previously, this is commonly due to the high DBTT of refractory metals and the grain boundary embrittlement due to the LPBF process. Surface morphology was negatively affected by an increase in scan speed for both the pure molybdenum and Mo-0.1SiC. At lower scan speeds, the weld tracks are less noticeable than at higher scan speeds. Surface porosity was greatly reduced in the samples with SiC additions at all scan speeds.
The ground and polished surfaces of the sectioned samples provided a bulk surface for porosity analysis. A comparison of surfaces is shown in Figure 3.
The consolidation in the pure molybdenum samples was very poor and the porosity does not show any regularity. The Mo-0.1SiC specimens showed improved consolidation and the pores were present along the weld tracks. The porosity lost its structure in Mo-0.1SiC specimens printed at higher scan speeds, with the print at 400 mm/s showing the least porosity of all samples.
The averaged ODD values are given in Table 3. The values for Mo-0.1SiC are significantly reduced compared to those of molybdenum, with the prints at 400 mm/s showing the largest disparity.
Figure 4 shows the EBSD images of the Mo-0.1SiC specimens printed at 100 and 400 mm/s from the top of the specimens (a,b) and the side or build direction (c,d). The images illustrate the anisotropic nature of grain structure in LPBF molybdenum. The large columnar grains in the build direction are similar to those commonly found in LPBF molybdenum and other refractory metals [21]. The grain refinement with increasing scan speed is evident. Cracking propagated along the columnar grains on the side surface and along the grain boundaries on the top surface.
EBSD mapping of the pure molybdenum samples, despite extensive vibratory polishing and etching, proved difficult to obtain due to the porosity that is evident on the map. Mapping was only obtainable for the pure molybdenum specimen printed at 100 mm/s. Figure 5 shows one of the obtained maps. The grain structure of the pure molybdenum printed 100 mm/s is comparable to that of the Mo-0.1SiC printed at the same scan speed.
Figure 6 shows the TEM/EDS analysis maps that were generated for the Mo-0.1SiC specimen printed at 400 mm/s. EDS identifies the content of the secondary phase as almost entirely silicon and oxygen, devoid of any molybdenum. EDS analysis indicated that there was not any carbon present, above background, in or around the nanoparticles. The presence of multiple nanoparticles was first noticed in the TEM imaging which suggests a large number of occurrences throughout the entire material.
SEM imaging was conducted to verify the abundance of the nanoparticles. The SEM and point EDS results of the etched surface are shown in Figure 7. The point SEM/EDS analysis and TEM/EDS analysis are in agreement that the nanoparticles are primarily silicon and oxygen. Furthermore, the point EDS analysis shows that silicon was not present in the bulk but instead contained only in the nanoparticles present throughout.

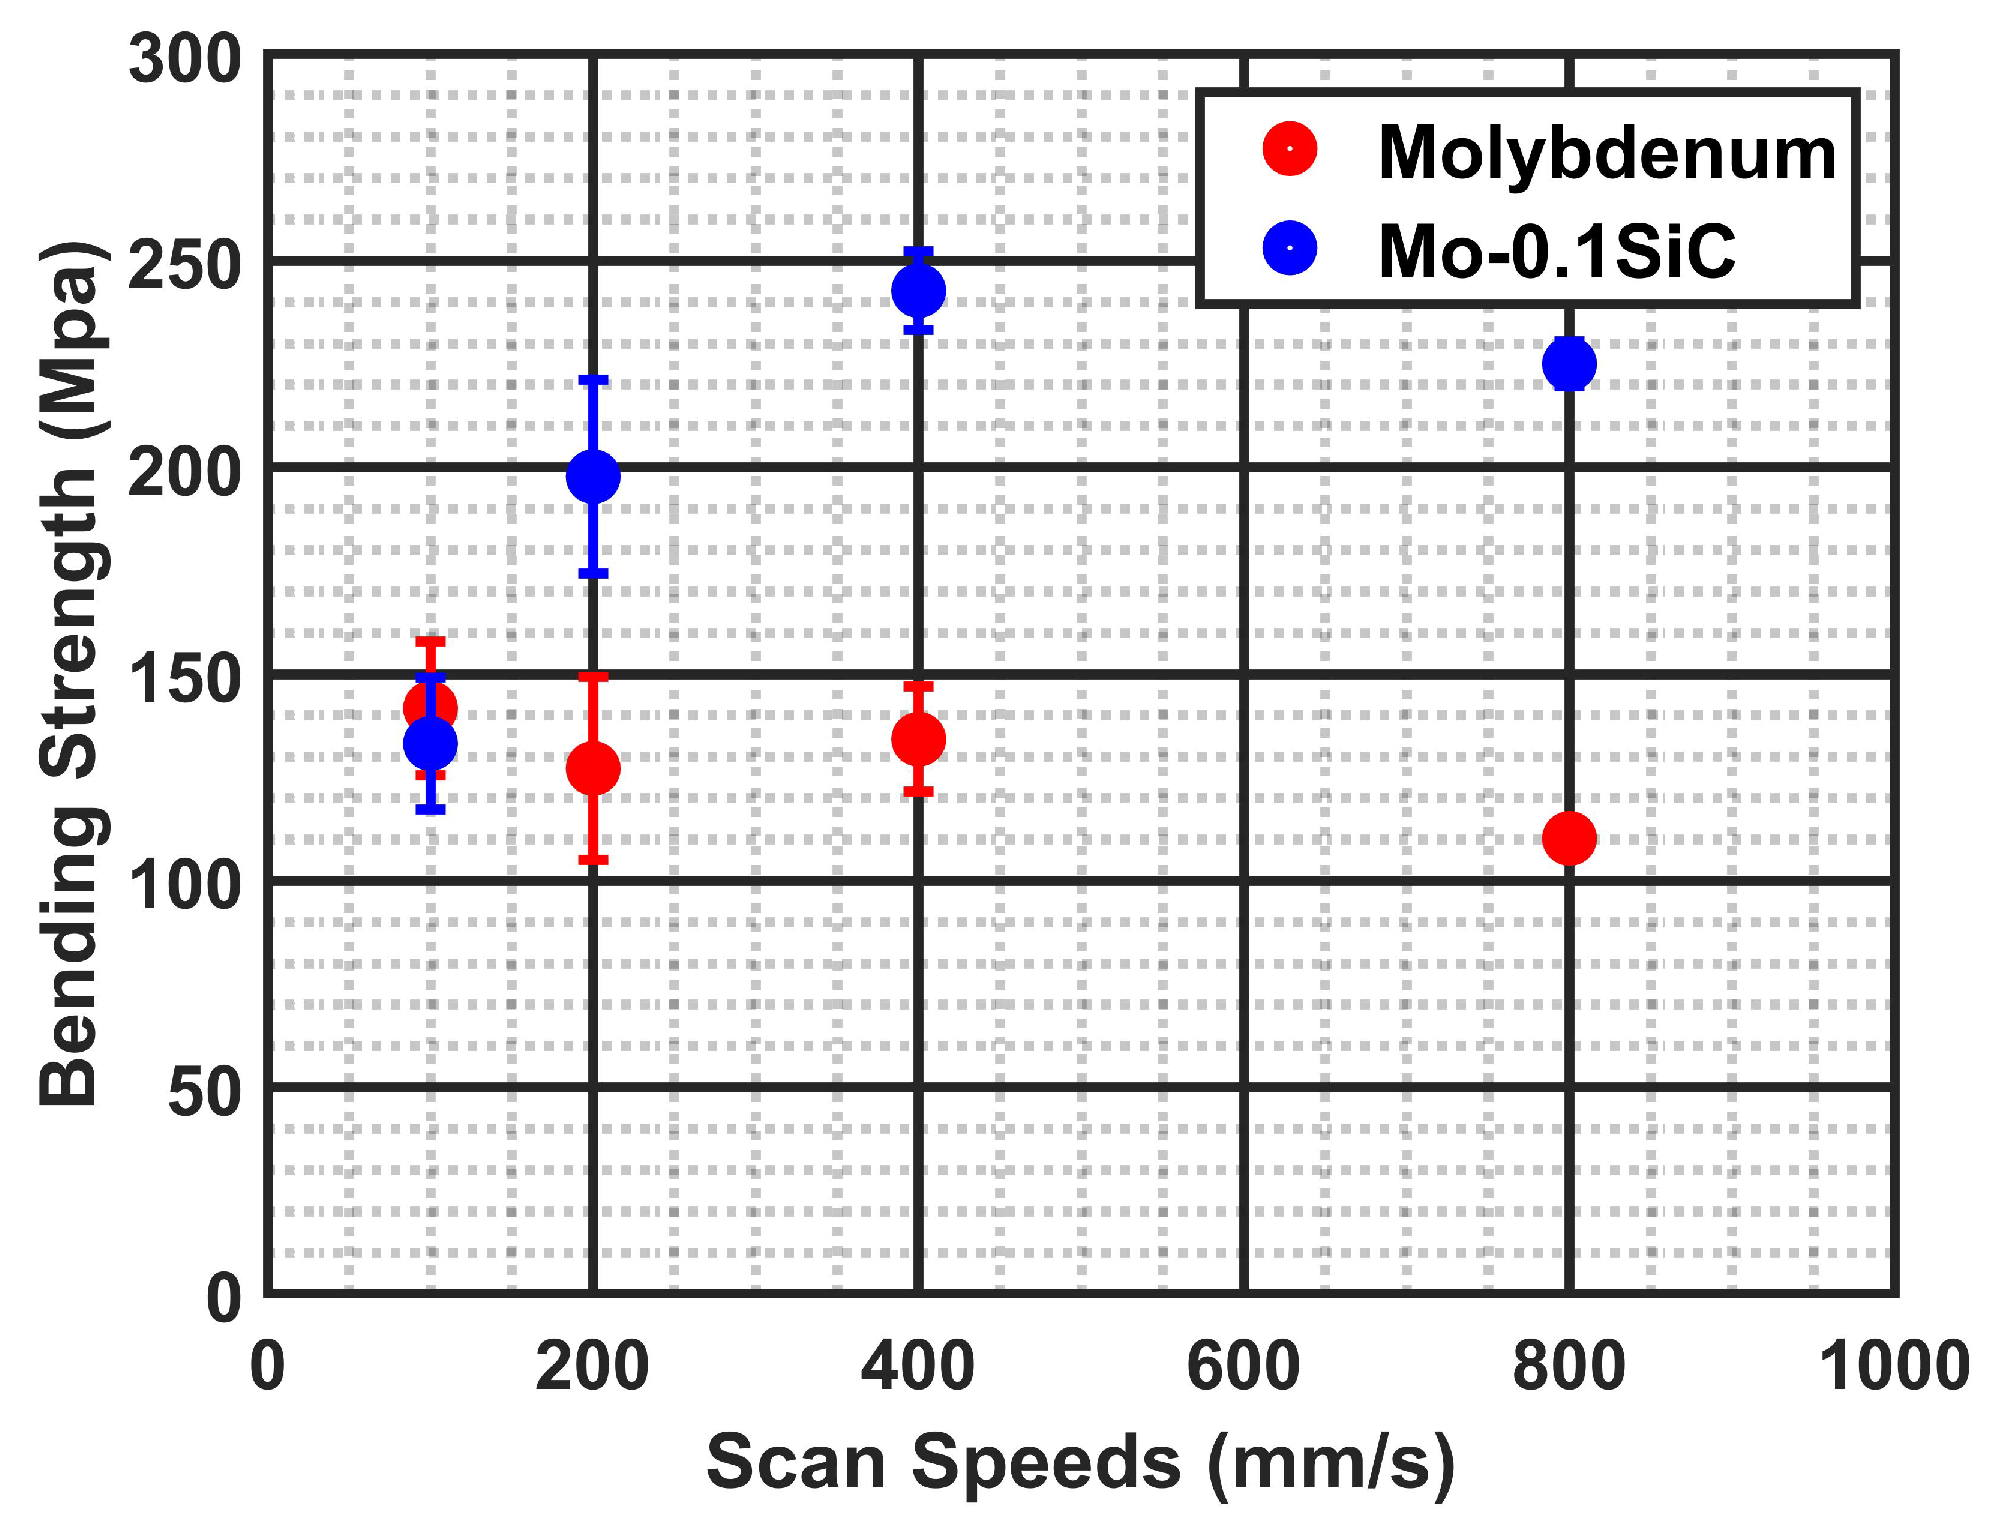
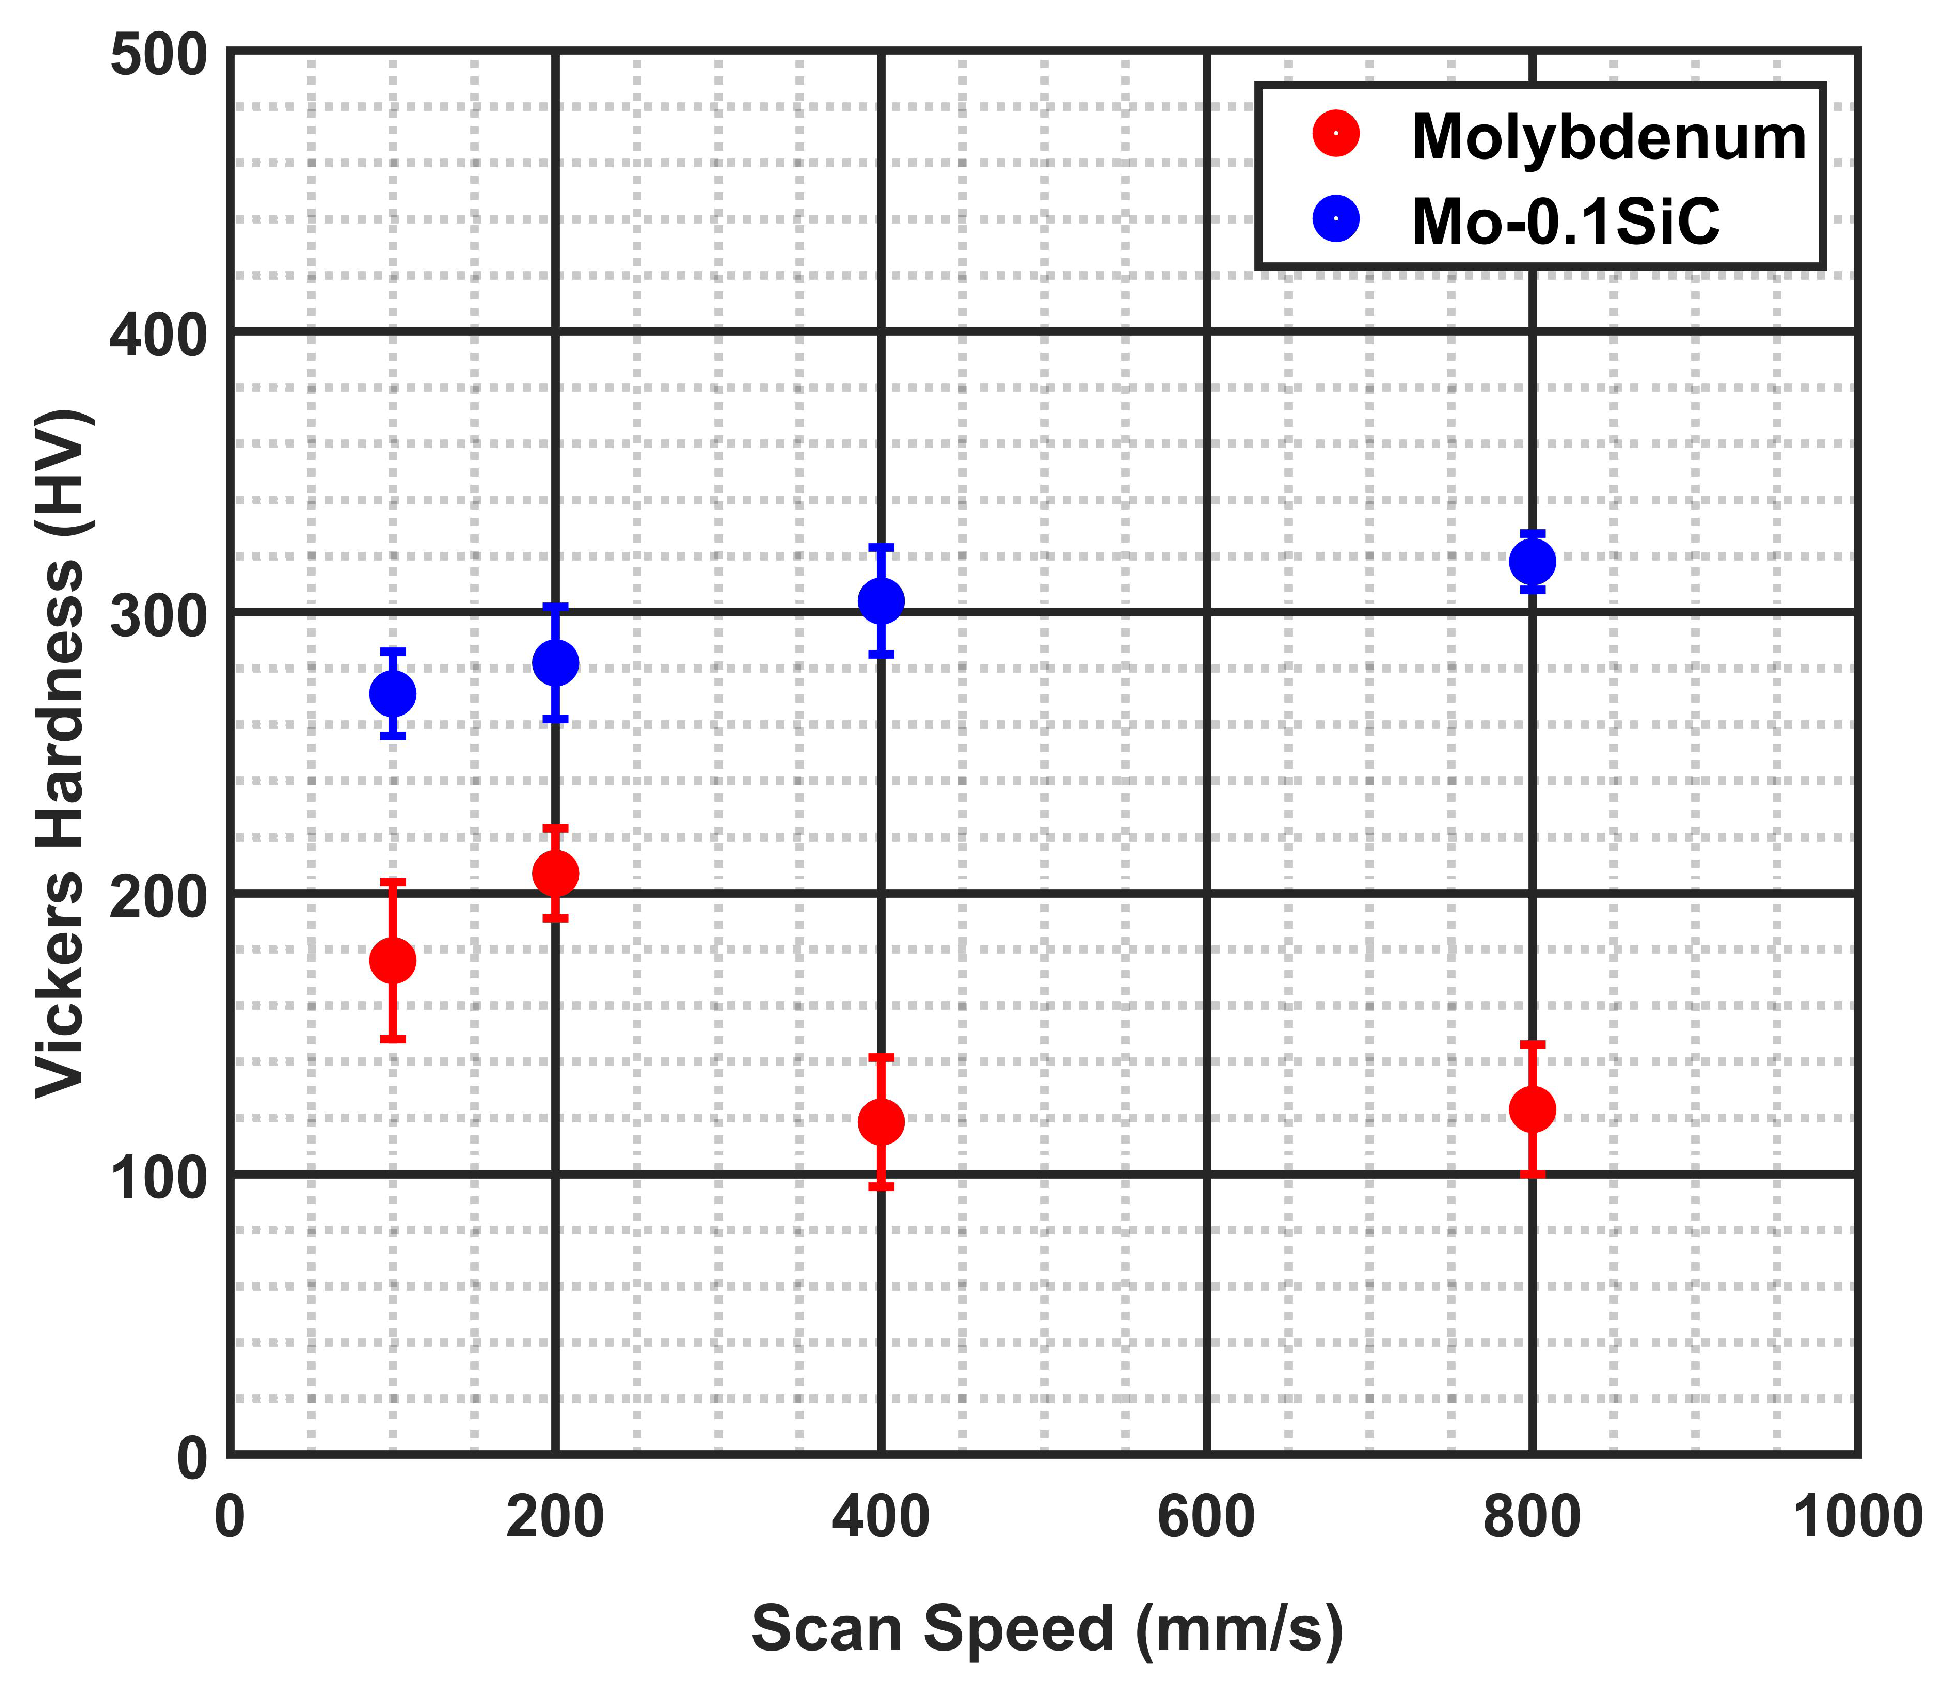
3.3. Mechanical Properties

Figure 8 shows the flexural strength of the pure molybdenum and Mo-0.1SiC specimens at the four scan speeds. The bars were tested in such a way that placed the load across the build direction so that cracks propagated along the columnar grains. Generally 3-pt bend strength measurements are conducted so that the load is placed perpendicular to the build direction, resulting in higher strength due to the anisotropic nature of these materials.
The strength of LPBF molybdenum was improved through the addition of nano-sized SiC. The flexural strength at a print speed of 400 mm/s was 242.8 ± 23.5 MPa for Mo-0.1SiC and 134.3 ± 12.7 MPa for pure molybdenum representing a roughly 80% increase. The strength varied with scan speed, increasing from 100 to 400 mm/s and decreasing again at 800 mm/s for the Mo-0.1SiC specimens. The pure molybdenum specimens did not show a consistent trend correlated with scan speed.
Figure 9 shows the fracture surfaces of the pure molybdenum and Mo-0.1SiC specimens. The load applied to the cuboid specimens in the flexural strength measurements resulted in the fracture surfaces showing the grain boundaries of the material. In both cases the fracture surfaces were nearly devoid of transgranular fracture, and instead only show intergranular fracture. The surfaces of the pure molybdenum specimen showed many open volume defects, caused by a lack of fusion, where there was poor consolidation as well as unmelted particles that were not present in the Mo-0.1SiC specimen.
Figure 10 shows magnified images of the fracture surfaces. Point EDS was performed on the secondary phase present on the surfaces and revealed only molybdenum and oxygen contained in the inclusions.
The secondary phase inclusions in Figure 10 were present on all the fracture surfaces of pure molybdenum and Mo-0.1SiC alike, indicating that a prevention of oxygen segregation to the grain boundaries was not fully achieved at 0.1 wt% SiC.
The hardness measurements yielded the Vickers hardness values for the pure molybdenum and Mo-0.1SiC specimens at all four scan speeds in Figure 11. The Mo-0.1SiC specimens had significantly higher hardness than the pure molybdenum specimens at higher scan speeds.

4. Discussion

When taken together, the experimental data outlined in the Results section indicate that the addition of nano-sized SiC at 0.1wt% improved the consolidation, mechanical properties, and in-situ oxidation of LPBF molybdenum.
The images of pure molybdenum in Figure 2 demonstrate the impact of laser scanning speed on melt-pool behavior. At increased scanning speeds the melt-pool temperature is decreased due to decreased energy input [29]. Insufficient energy input at lower VEDs resulted in the balling phenomenon seen in the pure molybdenum samples. Lowering the scanning speed increased energy input and caused improved wetting and spreading of the molybdenum melt-pool which suppressed the balling effect. The viscosity of liquid molybdenum decreases as temperature increases, improving the flow of the melt-pool, overlapping of melt-tracks, and overall consolidation. The addition of nano-sized SiC reduced the balling effect without an increase in energy input indicating better retention of input energy by the Mo-0.1SiC powder compared to the pure molybdenum. The effect of sub-optimal energy input was also observed in the Mo-0.1SiC specimens at higher scanning speeds. It is postulated that addition of nano-sized SiC improved the laser absorption of the molybdenum powder. Increased absorptivity subsequently increases temperature and longevity of the melt-pool which improves the rheological properties of the liquid and produces samples with better surface quality and less porosity. Gu et al. [30] showed that the addition of titanium diboride (TiB 2 ) and SiC to copper and AlSi10Mg powders increased the absorptivity at the 1064 nm wavelength of the laser used in that work which improved melting and consolidation. The melting temperature of copper and AlSi10Mg are significantly lower than that of molybdenum, but the results of the current study show that a dilute addition of nano-sized SiC can have a similar effect on consolidation during LBPF.
The ODD values in Table 3 and porosity images in Figure 3 also indicate improved melting due to the addition of SiC. It has been shown that variation in ODD is dependent on magnification and at higher porosity levels the variation increases [31]. For this reason, comparison to existing ODD reports can be difficult; however, the ODD values of the pure molybdenum specimens are roughly comparable to the measurements made by Faidel et al. [10] at similar VEDs. There is a significant reduction in porosity in the Mo-0.1SiC specimens. The porosity is lowest in the specimen printed at 400 mm/s and is generally lower at the higher scan speeds. Two mechanisms for pore formation in LPBF metals are evolution of gases from powder feedstock or trapping of build atmosphere gases. The likelihood of these mechanisms occurring increases with increasing VED. High VEDs also result in melt instability due to gas flow resulting in increased porosity. Porosity can be created at low VED due to incomplete melting of the powder [32], which is seen in the Mo-0.1SiC when printed at 800 mm/s. The fracture surface of pure molybdenum shown in Figure 9 illustrates the lack-of-fusion defects and bulk porosity resulting from insufficient energy input. Dilip et al [33] showed an analogous trend to the ODD values of Mo-0.1SiC presented here, in selective laser melted Ti-6Al-4V. An ideal scanning speed that finds a balance between insufficient and excessive energy input is likely around 400 mm/s for the print parameters chosen in this study.
While the evidence points towards increased melt-pool temperature with the addition of nano-sized SiC, the scanning speed appeared to have a much larger impact on the microstructural evolution. The average grain sizes on the top surface of the Mo-0.1SiC specimen printed at 100 mm/s is 47.33 ± 9.47 μ m compared to 40.64 ± 7.51 μ m for pure molybdenum at the same scanning speed. The average grain size of Mo-0.1SiC at 400 mm/s was much smaller at 25.52 ± 1.09 μ m. The reduction in grain sizes due to scanning speed was evident in the longitudinal direction of the Mo-0.1SiC as the average grain sizes for the 100 and 400 mm/s specimens were 211.51 ± 29.13 μ m and 58.40 ± 8.16 μ m, respectively. The larger grain sizes seen in Mo-0.1SiC at lower scanning speeds are expected due to increased melt-pool temperature and reduced cooling rates allowing more time for grain growth to occur. The thermal behavior of the melt-pool likely cannot be inferred from only the VED [34]; however, it is reasoned here, and elsewhere, that the increased effective energy input that is evidenced in the Mo-0.1SiC results in a smaller thermal gradient between the melt-pool and the surrounding solid, reducing the cooling rate [35]. Generally the presence of secondary-phase nanoparticles, like those shown in Figure 7, act to pin grain boundaries or nucleate new grains to limit grain growth; however, the average grain sizes between molybdenum and Mo-0.1SiC are comparable. It is possible that the increased melt-pool temperatures and reduced cooling rates induced an annealing effect that competed with the nanoparticle pinning mechanism to produce the comparable average grain sizes at the 100 mm/s scanning speed.
The presence of oxygen at the grain boundaries of laser printed refractory metals is detrimental to consolidation and mechanical properties. Controlling oxygen is of vital importance to reducing the crack propagation and increasing the mechanical performance of LBPF refractory metals. The addition of SiC provided two mechanisms for limiting the presence of oxygen during printing. The oxidation of SiC can progress by different mechanisms dictated by the presence of oxygen and temperature. Under a non-reactive (or vacuum) environment, like the nitrogen shield gas used in this analysis, oxidation occurs through the vaporization of silicon into a silicon-rich phase that precipitates carbon. In an oxidizing environment, SiC can undergo passive and active regimes of oxidation. At lower partial pressures of oxygen, silicon is oxidized to gaseous silicon monoxide (SiO) and more volatile carbon monoxide (CO). Under high partial pressures of oxygen, SiC is oxidized to solid silicon dioxide (SiO 2 ) and gaseous CO [36,37]. It is likely that under the high temperatures, low oxygen, and non-equilibrium conditions of LPBF some combination of mechanisms was taking place. In all three scenarios, free carbon is produced to react with the limited oxygen present in the system, thereby improving oxygen capture. The silicon and oxygen containing nanoparticles indicate that not all of the volatilized silicon escaped from the consolidated material. The formation of nanoparticles instead suggests that the silicon became mobile at the high temperatures and sequestered oxygen. The movement of the laser resulted in rapid cooling of the melt and the silicon oxides became trapped in the bulk of the material, limiting the ability of oxygen to embrittle the grain boundaries. While the formation of secondary phase nanoparticles indicate that oxygen was captured by the silicon, the fracture surfaces, in Figure 10, demonstrate that the 0.1 wt% SiC added was insufficient to prevent the formation of detrimental molybdenum oxides.
The flexural strength of Mo-0.1SiC was almost doubled in the specimens printed at 400 mm/s. The observed increase in strength can be attributed to the improved consolidation. Cracking was present in both the pure molybdenum and Mo-0.1SiC, but the fracture surfaces of the pure molybdenum specimens showed a lack of fusion, whereas the Mo-0.1SiC specimens did not. Reduction in the overall cracking would improve the strength by eliminating the type of stress concentration that allows crack propagation to occur easily. Grain size is not the only important factor in the strength of these materials. In the Mo-0.1SiC specimens, strength increased in the samples up to 400 mm/s after which it decreased in the specimen printed at 800 mm/s. The Hall-Petch relationship indicates that strength should increase as grain size decreases. At 800 mm/s, the powder system had been subjected to insufficient energy input, and poor consolidation became the governing factor behind flexural strength. The strength values provide another indicator of a prime scan speed around 400 mm/s that balances the impact of grain boundaries and lack of fusion on crack propagation and strength. The strength of the pure molybdenum samples was only governed by the lack of fusion and open porosity observed.
As expected, the hardness of Mo-0.1SiC was vastly increased over that of pure molybdenum due to the presence of the secondary-phase nanoparticles. The pure molybdenum printed at 200 mm/s had a comparable Vickers hardness of 207 ± 16 HV0.5 as reported elsewhere with LPBF molybdenum at similar energy inputs [21]. The maximum hardness found in the Mo-0.1SiC was 318 ± 10 HV0.5 in the specimen printed at 800 mm/s. Silicon oxide nanoparticles have been shown to increase hardness in other materials and improve wear resistance [38]. The increase in both strength and hardness are due to the nanoparticles blocking dislocation movement and preventing the propagation of cracks. The Hall-Petch relationship predicts an increase in hardness as grain size decreases. Given that the grain sizes in Mo-0.1SiC decrease with an increase in scan speed, the increase in measured hardness is explained. The absence of a similar trend in the molybdenum hardness was likely due to the extensive porosity.

5. Conclusions

The addition of 0.1 wt% SiC improved the consolidation, mechanical properties and in-situ oxidation of molybdenum through LPBF and the subsequent analysis has yielded the following conclusions:
  • The addition of SiC improved melting indicating increased laser energy absorption of the powder system.
  • Chemical analysis shows that in-situ oxidation of molybdenum powder was reduced in the powder system by 60 percent at the 200 mm/s scan speed by the addition of SiC.
  • Cross-sectional porosity in the Mo-0.1SiC was reduced by as much as 92 percent at the 400 mm/s scan speed as compared to pure molybdenum.
  • The formation of secondary-phase nanoparticles and oxidation of SiC provided two mechanisms for reducing the effect of oxygen on the consolidated molybdenum material.
  • The flexural strength and hardness of LPBF molybdenum increased by 80 and 60 percent, respectively due to the improved consolidation and reduced lack-of-fusion defects.

Author Contributions

Project administration, L.W.B., J.R.M. and R.A.K.; conceptualization, N.E.E. and R.A.K.; methodology, N.E.E. and R.A.K.; investigation, N.E.E., C.C.E., B.M.S. and C.T.B.; writing—original draft preparation, N.E.E.; writing—review and editing, N.E.E., R.A.K., L.W.B., J.R.M., C.C.E., B.M.S. and C.T.B.; supervision, L.W.B., J.R.M. and R.A.K. All authors have read and agreed to the published version of the manuscript.

Funding

This research received no external funding.

Institutional Review Board Statement

Not applicable.

Informed Consent Statement

Not applicable.

Data Availability Statement

The data presented in this study are available on request from the corresponding author.

Conflicts of Interest

The authors declare no conflict of interest.

Abbreviations

The following abbreviations are used in this manuscript:
AMAdditive Manufacturing
LPBFLaser Powder Bed Fusion
DBTTDuctile to Brittle Transition Temperature
PPMParts Per Million
LEDLinear Energy Density
VEDVolumetric Energy Density
FE-SEMField Emission Scanning Electron Microscope
EDSEnergy Dispersive X-ray Spectroscopy
EBSDElectron Backscatter Diffraction
ODDOptically Determined Density
TEMTransmission Electron Microscopy

References

  1. Oehlerking, F.; Stawovy, M.T.; Ohm, S.; Imandoust, A. Microstructural characterization and mechanical properties of additively manufactured molybdenum and molybdenum alloys. Int. J. Refract. Met. Hard Mater. 2022, 109, 105971. [Google Scholar] [CrossRef]
  2. Ha, H.-Y.; Lee, T.-H.; Bae, J.-H.; Chun, D.W. Molybdenum Effects on Pitting Corrosion Resistance of FeCrMnMoNC Austentic Stainless Steels. Metals 2018, 8, 653. [Google Scholar] [CrossRef]
  3. Samin, A.J. A physics-based machine learning study of the behavior of interstitial helium in single crystal W-Mo binary alloys. J. Appl. Phys. 2020, 127, 175904. [Google Scholar] [CrossRef]
  4. Vazirisereshk, M.R.; Martini, A.; Strubbe, D.; Baykara, M. Solid Lubrication with MoS2: A Review. Lubricants 2019, 7, 57. [Google Scholar] [CrossRef]
  5. Dai, C.; Zhao, T.; Du, C.; Liu, Z.; Zhang, D. Effect of molybdenum content on the microstructure and corrosion behavior or FeCoCrNiMox high-entropy alloys. J. Mater. Sci. Technol. 2020, 46, 64–73. [Google Scholar] [CrossRef]
  6. Wu, Z.; Feng, K.; Sha, J.; Zhou, C. Oxidation behavior of Si-rich Mo-Si-B coating doped with La by spark plasma sintering. Corros. Sci. 2021, 192, 109672. [Google Scholar] [CrossRef]
  7. Shmelev, A.N.; Kozhahmet, B.K. Use of molybdenum as a structural material of fuel elements for improving the safety of nuclear reactors. J. Phys. Conf. Ser. 2017, 781, 012022. [Google Scholar] [CrossRef]
  8. Redlich, C.; Quadbeck, P.; Thieme, M.; Kieback, B. Molybdenum—A biodegradable implant material for structural applications? Acta Biomater. 2020, 1104, 241–251. [Google Scholar] [CrossRef]
  9. Hagihara, K.; Nakano, T.; Suzuki, M.; Ishimoto, T.; Suyalatu, S.; Sun, H. Successful additive manufacturing of MoSi2 including crystallographic texture and shape control. J. Alloys Compd. 2017, 696, 67–72. [Google Scholar] [CrossRef]
  10. Faidel, D.; Jonas, D.; Natour, G.; Behr, W. Investigation of the selective laser melting process with molybdenum powder. Addit. Manuf. 2015, 8, 88–94. [Google Scholar] [CrossRef]
  11. Ren, C.; Enneti, R.K. Latest developments in manufacturing and recycling of refractory materials. JOM 2021, 73, 3401–3402. [Google Scholar] [CrossRef]
  12. Gomez-Rodriguez, C.; Garcia-Quinonez, L.V.; Verdeja, L.F.; Castillo-Rodriguez, G.A.; Aquilar-Martinez, J.A.; Marino-Gamez, A.E.; Fernandez-Gonzalez, D. Selective laser sintering of alumina-molybdenum nanocomposites. Ceram. Int. 2022, 48, 29540–29545. [Google Scholar] [CrossRef]
  13. Bryant, R.T. The solubility of oxygen in transition metal alloys. J. Less-Common Met. 1962, 4, 62–68. [Google Scholar] [CrossRef]
  14. Jakob, S.; Hohenwarter, A.; Lorich, A.; Knabl, W.; Pippan, R.; Clemens, H.; Maier-Kiener, V. Assessment of grain boundary cohesion of technically pure and boron micro-doped molybdenum via meso-scale three-point-bending experiments. Mater. Des. 2021, 207, 109848. [Google Scholar] [CrossRef]
  15. Wang, D.; Yu, C.; Ma, J.; Wei, L.; Shen, Z. Densification and crack suppression in selective laser melting of pure molybdenum. Mater. Des. 2017, 129, 44–52. [Google Scholar] [CrossRef]
  16. Leung, C.L.A.; Elizarova, I.; Isaacs, M.; Marathe, S.; Saiz, E.; Lee, P.D. Enhanced near-infrared absorption for laser powder bed fusion using reduced graphene oxide. Appl. Mater. Today 2021, 23, 101009. [Google Scholar] [CrossRef]
  17. Pant, P.; Salvemini, F.; Proper, S.; Luzin, V.; Simonsson, K.; Sjostrom, S.; Hosseini, S.; Peng, R.L.; Moverare, J. A study of the influence of novel scan strategies on residual stress and microstructure of L-shaped LPBF IN718 samples. Mater. Des. 2022, 214, 110386. [Google Scholar] [CrossRef]
  18. Boley, C.D.; Khairallah, S.A.; Rubenchik, A.M. Calculation of laser absorption by metal powders in additive manufacturing. Appl. Opt. 2015, 54, 2477–2482. [Google Scholar] [CrossRef]
  19. Jadhav, S.D.; Fu, D.; Deprez, M.; Ramharter, K.; Willems, D.; Van Hooreweder, B.; Vanmeensel, K. Highly conductive and strong CuSn0.3 alloy processed via laser powder bed fusion starting from a tin-coated copper powder. Addit. Manuf. 2020, 36, 101607. [Google Scholar] [CrossRef]
  20. Pannitz, O.; Grobwendt, F.; Luddecke, A.; Kwade, A.; Rottger, A.; Torsten Sehrt, J. Improved Process Efficiency in Laser-Based Powder Bed Fusion of Nanoparticle Coated Maraging Tool Steel Powder. Materials 2021, 14, 3465. [Google Scholar] [CrossRef]
  21. Kaserer, L.; Braun, J.; Stajkovic, J.; Leitz, K.-H.; Tabernig, B.; Singer, P.; Letofsky, I.; Kestler, H.; Leichtfried, G. Fully dense and crack free molybdenum manufactured by selective laser melting through alloying with carbon. Int. J. Refract. Met. Hard Mater. 2019, 84, 88–94. [Google Scholar] [CrossRef]
  22. Braun, J.; Kaserer, L.; Letofsky-Papst, I.; Leitz, K.-H.; Kestler, H.; Leichtfried, G. On the role of carbon in molybdenum manufactured by laser powder bed fusion. Int. J. Refract. Met. Hard Mater. 2020, 92, 105283. [Google Scholar] [CrossRef]
  23. Braun, J.; Kaserer, L.; Stajkovic, J.; Kestler, H.; Leichtfried, G. Grain refinement mechanisms of alloying mechanisms of alloying molybdenum with carbon manufactured by laser powder bed fusion. Mater. Des. 2022, 215, 110507. [Google Scholar] [CrossRef]
  24. Li, N.; Huang, S.; Zhang, G.; Qin, R.; Liu, W.; Xiong, H.; Shi, G.; Blackburn, J. Progress in additive manufacturing on new materials: A review. J. Mater. Sci. Technol. 2019, 35, 242–269. [Google Scholar] [CrossRef]
  25. Chen, S.; Li, W.-B.; Wang, X.; Yao, W. Explosion/impact response of pure molybdenum at ultra-high strain rate and large strains. Int. J. Refract. Hard Met. 2022, 104, 105801. [Google Scholar] [CrossRef]
  26. Eckley, C.C.; Kemnitz, R.A.; Fassio, C.P.; Hartsfield, C.R.; Leonhardt, T.A. Selective laser melting of tungsten-rhenium alloys. JOM 2021, 73, 3439–3450. [Google Scholar] [CrossRef]
  27. Kemnitz, R.A.; Eckley, C.C.; Sexton, B.M.; LeSieur, A.R. Strengthening of additively manufactured tungsten by use of hydrogen in argon shielding gas. Int. J. Refract. Hard Met. 2022, 105970. [Google Scholar] [CrossRef]
  28. ASTM E1019-18; Standard Testing Methods for Determination of Carbon, Sulfur, Nitrogen, and Oxygen in Steel, Iron, Nickel, and Cobalt Alloys by Various Combustion and Inert Gas Fusion Techniques. American Society for Testing and Materials: West Conshohocken, PA, USA, 2018.
  29. Ansari, M.J.; Nguyen, D.-S.; Park, H.S. Investigation of SLM process in terms of temperature distribution and melting pool size: Modelyin and experimental approaches. Materials 2019, 12, 1272. [Google Scholar] [CrossRef]
  30. Gu, D.; Yang, Y.; Xi, L.; Yang, J.; Xia, M. Laser absorption behavior of randomly packed powder-bed during selective laser melting of SiC and TiB2 reinforced Al matrix composites. Opt. Laser Technol. 2019, 119, 105600. [Google Scholar] [CrossRef]
  31. Spierings, A.B.; Schneider, M.; Eggenberger, R. Comparison of density measurement techniques for additive manufactured metallic parts. Rapid Prototyp. J. 2011, 17, 380–386. [Google Scholar] [CrossRef]
  32. Guo, M.; Gu, D.; Xi, L.; Zhang, H.; Zhang, J.; Yang, J.; Wang, R. Selective laser melting additive manufacturing of pure tungsten: Role of volumetric energy density on densification, microstructure, and mechanical properties. Int. J. Refract. Met. Hard Mater. 2019, 84, 105025. [Google Scholar] [CrossRef]
  33. Dilip, J.J.S.; Zhang, S.; Teng, C.; Zeng, K.; Robinson, C.; Pal, D.; Stucker, B. Influence of processing parameters on the evolution of melt pool, porosity, and microstructures in Ti-6Al-4V alloy parts fabricated by selective laser melting. Prog. Addit. Manuf. 2017, 2, 157–167. [Google Scholar] [CrossRef]
  34. Pauly, S.; Wang, P.; Kühn, U.; Kosiba, K. Experimental determination of cooling rates in selectively laser-melted eutectic Al-33Cu. Addit. Manuf. 2018, 22, 753–757. [Google Scholar] [CrossRef]
  35. Dai, D.; Gu, D.; Poprawe, R.; Xia, M. Influence of additive multilayer feature on thermodynamics, stress, and microstructure development during laser 3D printing of aluminum-based material. Sci. Bull. 2017, 62, 779–787. [Google Scholar] [CrossRef]
  36. Biscay, N.; Henry, L.; Adschiri, T.; Yoshimura, M.; Aymonier, C. Behavior of silicon carbide materials under dry to hydrothermal conditions. Nanomaterials 2021, 11, 1351. [Google Scholar] [CrossRef]
  37. Chatillon, C.; Teyssandier, F. Thermodynamic assessment of the different steps observed during SiC oxidation. J. Eur. Ceram. Soc. 2022, 42, 1175–1196. [Google Scholar] [CrossRef]
  38. Islam, M.; Azhar, M.R.; Fredj, N.; Burleigh, T.D.; Oloyede, O.R.; Almajid, A.A.; Shah, S.I. Influence of SiO2 nanoparticles on hardness and corrosion resistance of electroless Ni-P coatings. Surf. Coat. Technol. 2015, 261, 141–148. [Google Scholar] [CrossRef]
Figure 1. (a) Spherical pure molybdenum powder. (b) Nanosized silicon carbide. (c) Mixed Mo-0.1SiC powder.
Crystals 12 01276 g001
Figure 2. SEM images of the top surfaces of both materials at all four scan speeds: (ad) Pure molybdenum printed at 100, 200, 400, and 800 mm/s, respectively; (eh) Mo-0.1SiC printed at 100, 200, 400, and 800 mm/s, respectively.
Crystals 12 01276 g002
Figure 3. Optical images of bulk surfaces showing the porosity of both materials at all four scan speeds: (ad) Pure molybdenum printed at 100, 200, 400, and 800 mm/s, respectively; (eh) Mo-0.1SiC printed at 100, 200, 400, and 800 mm/s, respectively.
Crystals 12 01276 g003
Figure 4. EBSD map of Mo-0.1SiC: (a) Top surface of 100 mm/s specimen. (b) Top surface of 400 mm/s specimen; (c) Side surface of 100 mm/s specimen; (d) Side surface of 400 mm/s specimen.
Crystals 12 01276 g004
Figure 5. EBSD map of the top surface of the pure molybdenum specimen printed at 100 mm/s.
Crystals 12 01276 g005
Figure 6. EDS analysis of the nanoparticles conducted via TEM. (a) High-angle annular dark field (HAADF) image. (b) EDS map with molybdenum highlighted. (c) EDS map with oxygen highlighted. (d) EDS map with silicon highlighted.
Crystals 12 01276 g006
Figure 7. (a) Mo-0.1SiC with nanoparticle inclusions; (b) Nanoparticle EDS analysis result (c) Bulk material EDS analysis result.
Crystals 12 01276 g007
Figure 8. Flexural strength of the prepared pure molybdenum and Mo-0.1SiC specimens at the four different scan speeds. The error bars represent the standard deviation of the three measurements taken for each scan speed.
Crystals 12 01276 g008
Figure 9. SEM images of fracture surfaces for (a) pure molybdenum and (b) Mo-0.1SiC printed at 400 mm/s.
Crystals 12 01276 g009
Figure 10. Magnified backscattered electron SEM images of fracture surfaces for (a) pure molybdenum and (b) Mo-0.1SiC printed at 200 and 800 mm/s, respectively.
Crystals 12 01276 g010
Figure 11. Nanoindentation hardness values for pure molybdenum and Mo-0.1SiC at the four different scan speeds. The error bars represent the standard deviation of the forty individual indentations made on each specimen.
Crystals 12 01276 g011
Table 1. Scan speeds with associated line and volumetric energy densities used to print pure molybdenum and Mo-0.1SiC.
Scan Speed (mm/s)LED (J/mm)VED (J/mm 3 )
1002.002000
2001.001000
4000.50500
8000.25250
Table 2. Chemical composition of powders and LPBF specimens.
SampleO (ppm)N (ppm)C (ppm)
Mo Powder252N/AN/A
SiC Powder9623N/AN/A
Mo-0.1SiC Powder337N/AN/A
Mo (100 mm/s)173042080
Mo (200 mm/s)2120430100
Mo (400 mm/s)2190290130
Mo (800 mm/s)1970230110
Mo-0.1SiC (100 mm/s)828650120
Mo-0.1SiC (200 mm/s)85249017
Mo-0.1SiC (400 mm/s)1138610140
Mo-0.1SiC (800 mm/s)1325370210
Table 3. Optically determined density values for all prepared specimens.
Material100 mm/s200 mm/s400 mm/s800 mm/s
Molybdenum16.6 ± 2.2%29.3 ± 2.6%34.1 ± 1.2%25.3 ± 5.5%
Mo-0.1SiC7.2 ± 1.9%7.9 ± 3.0%2.6 ± 0.7%5.2 ± 0.5%
Publisher’s Note: MDPI stays neutral with regard to jurisdictional claims in published maps and institutional affiliations.

