
Removal of Toluidine Blue and Safranin O from Single and Binary Solutions Using Zeolite


1
School of Environmental and Municipal Engineering, North China University of Water Resources and Electric Power, Zhengzhou 450046, China
2
Collaborative Innovation Center for Efficient Utilization of Water Resources, Zhengzhou 450046, China
3
Department of Chemistry, University of Wisconsin—Parkside, 900 Wood Road, Kenosha, WI 53144, USA
4
Department of Geosciences, University of Wisconsin—Parkside, 900 Wood Road, Kenosha, WI 53144, USA
*
Authors to whom correspondence should be addressed.
Crystals 2021, 11(10), 1181; https://doi.org/10.3390/cryst11101181
Submission received: 9 September 2021
/
Revised: 24 September 2021
/
Accepted: 25 September 2021
/
Published: 28 September 2021
(This article belongs to the Special Issue Surfaces and Interfaces of Clay Minerals)
Abstract
:The studies on dye removal from solutions attracted great attention due to the increased use of color dyes in different fields. However, most of the studies were focused on dye removal from a single solution. In reality, wastewater from the fabric industry could contain mixed dyes. As such, evaluating different dye removal from mixed solutions may have more practical importance. In terms of sorbents evaluated for dye removal, most of them were an organic type generated from agricultural wastes. Clay minerals and zeolites were also studied extensively, because of the vast reserves, inexpensive material cost, larger specific surface area (SSA) and high cation exchange capacity (CEC). However, evaluating the factors controlling the dye removal from mixed dye solutions was limited. In this study, the removal of cationic dyes safranin O (SO) and toluidine blue (TB) by clinoptilolite zeolite (ZEO) was evaluated under single and binary systems. The results showed that removal of TB was preferred over SO by approximately a 2:1 ratio. The counterion Cl− sorption from mixed dye solution helped the formation of mixed dye aggregates on mineral surfaces. Molecular dynamic simulation confirmed the multilayer mixed dye formation on ZEO under high loading levels.
1. Introduction
The extensive use of color dyes in modern society creates extraordinary stress on their removal and disposal. Quantity-wise, as many as 10,000 dyes of different chemical structures are commercially available and extensively used [1], more than 7 × 10⁵ tons of dyes are used in textile industry alone, and approximately 10–15% of these dyes are discharged into water systems without treatment [2]. As environmental awareness and concerns become an urgent issue, more research is devoted to dye removal in recent studies.
Commonly used methods for dye removal from water are physical, chemical, and biological [3]. The advantage of degrading removal (both chemically and biologically) is its partial or complete breakdown of the dye compounds to decrease their toxicity. However, the disadvantage is its slow degradation rate and expensive catalyst costs. In contrast, the advantage of sorptive removal (physical) is its fast rate of removal and low material cost. On the contrary, the dispensing of the spent sorbents is a critical issue in dye remediation. As such, sorbents of a high removal capacity and low material costs are always extensively researched and explored. We evaluated the ability of five low-cost sorbents (bark, rice husk, cotton waste, hair, and coal) to sorb two basic dyes: safranin O (SO) and methylene blue (MB) from the solution, with monolayer saturation capacities of 1119, 838, 875, 190, and 120 mg/g for SO, and 914, 312, 277, 158, and 250 mg/g for MB, respectively [4].
However, most of the evaluations were conducted for a single dye removal at a time, not on a mixed dye, particularly for opposite charges. The same MB removal under the same initial MB concentration of up to 100 mg/L, and the same contact time was achieved from a single solution and a triple dye solution made of MB, methyl orange (MO), and Congo Red (CR), as the initial concentration of MO and CR was kept at 5 mg/L [5]. This may be due to significant difference between the concentrations of MB and the other two dyes. In contrast, the sorption capacities were 42 and 26 mg/g from single dye and triple dye solutions, but the data were not provided and the concentration changes of the other two dyes were not monitored [5]. Halloysite was successfully tested for the adsorptive removal of the cationic dye, Rhodamine 6G, and the anionic dye, Chrome azurol S. Halloysite, and exhibited a higher removal capacity towards both dyes [6]. A cationic dye, methyl violet 2B, and an anionic dye, azocarmine G2, were simultaneously removed from an aqueous solution using a composite made of CrFeO3 with multi-walled fullerene carbon nanotubes [7].
Metal–organic frameworks (MOFs), a class of crystalline material with a high porosity composed of metal clusters and organic linkers, were tested for the removal of the single dyes, MO and MB, and the mixed dyes, which were cationic and anionic in nature (MO + MB) [8]. However, due to the ionic nature, the mixed dye removal was only tested with a fixed initial concentration (10 mg/L) under different initial pH conditions, and a significant removal enhancement (50–100%) was observed in the presence of the second dye in comparison to the dye removal from single dye solutions [8]. The sorption of MB and reactive orange 16 (RO16), an anionic dye, by ethylenediamine tetra-acetic acid modified rice husk (ERH) showed an MB sorption capacity increase from 46 to 50 mg/g, from single and binary systems, and an RO16 sorption increase from 8 to 17 mg/g, from single and binary systems, but the mechanism of this increase was not discussed [9].
Kenaf core fiber (KCF) was chemically modified by the quaternized agent (3-chloro-2-hydroxypropyl) trimethylammonium chloride to improve the removal of the anionic dyes, Reactive Red-RB (RR-RB) and Reactive Black-5 (RB-5), from a binary aqueous solution with removal capacities of 116 and 143 mg/g, respectively, obtained in contrast to the capacities of 170 and 270 mg/g from single solution, respectively [10]. However, the sum of the removal capacity for the two dyes was about the same as that for RB-5 and the mechanism was attributed to chemisorption and internal diffusion, while the actual mechanism should have been electrostatic interactions as the surface was positively charged after trimethylammonium modification [10].
An organic–inorganic hybrid material, polyaniline–zirconium phosphoborate (PANI–ZrPB) nanocomposite, was tested for the removal each dye from the binary mixtures of MB-neutral red (NR), MB-crystal violet (CV), and CV-NR and a slight reduction in each dye removal, from 94.5–92.73 to 90–82%, was observed in the MB-NR binary system and a reduction from 95 to 89.5% was observed for the MB-CV binary system, which was attributed to competitive sorption [11]. Although the calculated sorption capacities for MB, CV, and NR were 71, 90, and 56 mg/g, respectively, the study was not conducted with different concentrations [11].
Dyes can be organophilic and hydrophilic. For dyeing fabrics, the dyes are often hydrophilic and can be further classified into cationic, anionic, and zwitterionic based on their net charges in aqueous solution. To remove hydrophilic dyes from water, sorbents of opposite charges are often selected and used. For the removal of cationic dyes, common clay minerals of a high specific surface area (SSA) and cation exchange capacity (CEC) were evaluated due to their net negative charges on the surface and inexpensive material cost. For example, montmorillonite was tested for the removal of the cationic dyes acridine orange (AO) [12], rhodamine B (RB) [13], and MB [14]. However, conflicting results were found in recent studies. For example, the sorption of TB on bentonite was only 18.4 mg/g [2]. In contrast, the sorption of TB on a Na-montmorillonite (MMT) was up to 1773 mg/g [15]. The drastic difference between the sorption capacities of TB increased by up to two orders of magnitude. In comparison, SO sorption on MMT was 380 mg/g [16]. The sorption of CR and malachite green (MG), a cationic dye, by bentonite, whose CEC was 1.35 meq/g, was tested from single and binary solutions with sorption capacities of about 200 and 170 mmol/g for CR and MG [17]. In the mixed dye, the molar ratio of CR/MG was 0.52, with the capacities about 90 and 100 mmol/g for CR and MG sorption [17]. The cation exchange was interpreted as the mechanism for MG sorption, but no explanation was provided for the fact that the dye sorption was more than 100 times the CEC value [17].
A study was conducted for the removal of a cationic dye, Basic Violet 16 (BV16), and an anionic dye, Reactive Red 195 (RR195), from single and binary solutions by bentonites and the results suggested an enhanced removal of one dye in the presence of the other dye at an initial concentration of 20 mg/L [18]. However, the concentrations of the dyes were determined using UV-Vis at the wavelengths of 548 and 540 cm−1 for BV16 and RR195 [18], which definitely affected each other in the absorbance reading.
In comparison to phyllosilicates, tectosilicates, such as zeolites (ZEO), also have high CEC and SSA values [19], making them one of the most environmentally friendly types of sorbents for the removal of contaminants, mostly cationic, from water. The TB sorption on Turkish ZEO was 55 mg/g or 170 mmol/kg [20]. A similar contradiction was also found on ZEO. The SO sorption on ZEO resulted in a capacity of 0.08 mg/g in one study [21] and 43 mg/g in another study [22]. Clinoptilolite zeolite was studied for the sorptive removal of Reactive Blue 21 (RB21) and Reactive Red 195 (RR195), both anionic dyes, under single and binary dye systems, with sorption capacities of 9.7 and 3.2 mg/g for RB21 and RR195 in single solution system, respectively [23]. However, the mechanism of dye removal was not discussed in their study.
As a phenothiazine basic dye, toluidine blue (TB) is commonly used in biotechnology to stain tissues rich in DNA and RNA due to its high affinity for tissue components that are acidic [24]. Safranin O (SO), mostly used as food dye in the flavoring and coloring of candies and cookies [25], is also commonly used for biological laboratory purposes [26]. Often, the biotechnological waste may contain mixed dyes. As such, their removal and disposal are critical in waste management.
The previously motioned methods, including physicochemical, biological, and chemical were commonly used for the removal of TB from water [27]. Similarly, these methods could also apply to the removal of SO, as it was also a cationic dye. Among them, the sorptive removal using natural materials was mostly effective in terms of costs and efficiency [28].
As such, it is critical to systematically study the interactions between color dyes and earth materials under different physical and chemical conditions, as single dyes or as mixed dyes. In this study, we investigated the sorption of TB and SO on a clinoptilolite ZEO under single dye and binary dye conditions. Our goal was to see whether differences were present for the uptake of different dyes on ZEO. If so, what is the mechanism that contributes to the differences? Answering this question could help future optimizations to be made to reach the best dye removal efficiency from single and mixed solutions.
2. Materials and Methods
2.1. Materials
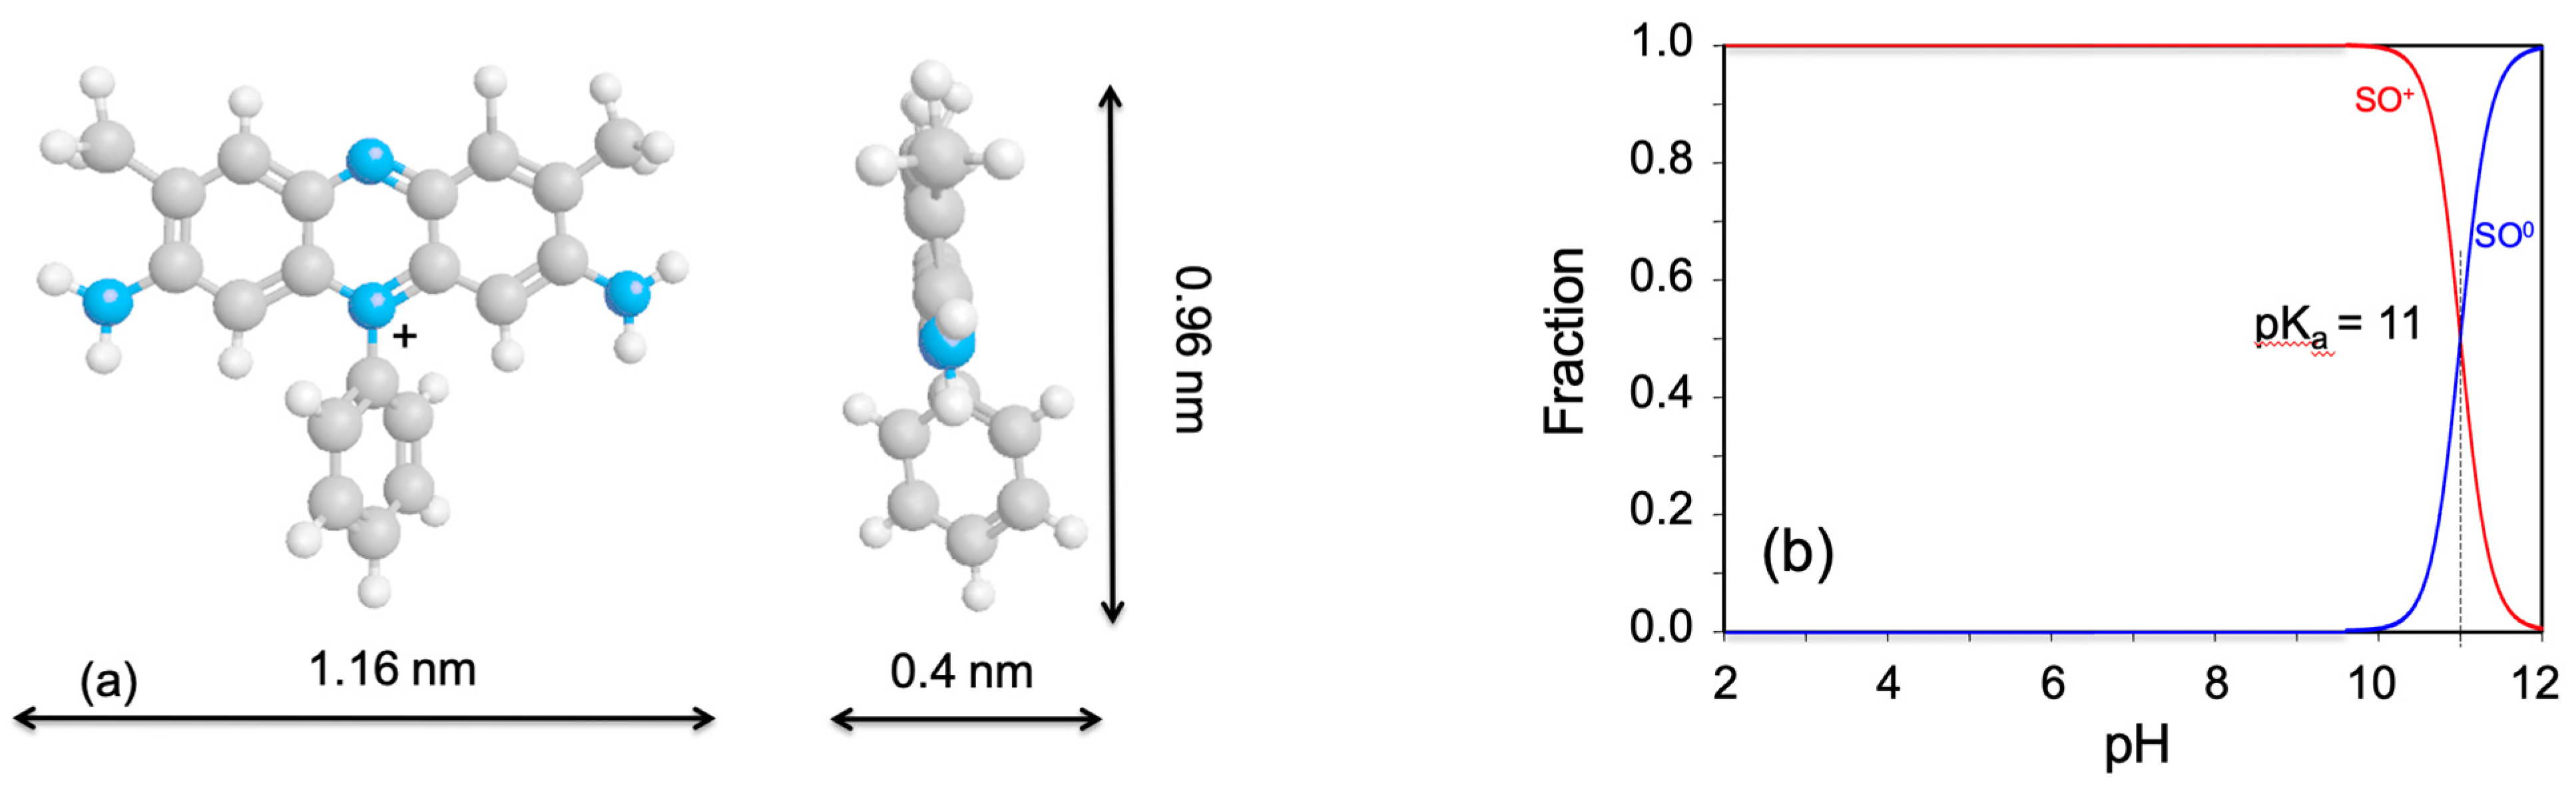
The TB (also called basic blue) has a CAS number of 92-31-9. It is in the chloride form with a molecular weight of 305.82 g/mol and a solubility of 30 g/L (Acros). The reported pKa values are 2.4 and 11.6 [29]. It is in a planner form with a length of 1.07 nm and a width of 0.40 nm (Figure 1). The SO used is also in the chloride form with a CAS number of 477-73-6, a molecular weight of 350.84 g/mol, a solubility of 50 g/L [30], and a pKa value of 11 [31]. In terms of molecular size, it is 1.16 nm long by 0.96 nm wide by 0.4 nm thick, due to the twisting of the benzene ring (Figure 2).
The ZEO used is clinoptilolite obtained from St. Cloud mine in Winston, NM and was used as received with a particle size of less than 200 mesh (0.074 mm). It has an SSA value of 15.7 m2/g with the external CEC (ECEC) value of 90 meq/kg [32]. A recent BET measurement showed a very large mesopore size of 18 nm.
2.2. Dye Sorption Experiment
For all experiments, 0.25 g of ZEO and 10 mL single or binary solution were used. They were each mixed in 50-mL centrifuge tube, for a varying amount of time for the kinetic study and 24 h for all other studies, in a reciprocal shaker at room temperature (23 °C) and at a rotational speed of 150 rpm. Mixtures were centrifuged at 3500 rpm for 10 min and the supernatant was passed through 0.45 μm syringe filters, before being analyzed for equilibrium TB or SO concentrations using a UV-Vis method. The amount of TB or SO sorbed was calculated by the difference between the initial and equilibrium TB or SO concentrations.
For the sorption isotherm study, the initial concentrations varied from 0.3 to 2 mM with equal concentrations for both dyes in the binary system and 0.6 to 4 mM for the single dye system. For all other experiments, the initial concentrations were 1.2 mM each for the binary system and 2.4 mM for the single dye system. For the pH study, the pH of the mixtures was periodically adjusted to reach the final pH values between 3 and 11 with an interval close to 1. For the ionic strength study, the solution ionic strength was adjusted to 0.001, 0.01, 0.1, and 1.0 M of NaCl using 5.0 mL of 0.002, 0.02, 0.2, and 2.0 M NaCl solution with TB and SO stock solution, respectively. For the kinetic study, mixtures were shaken for 0.1 to 24 h, while the temperatures were 23, 33, 43, and 53 °C.
2.3. Instrumental Analyses
The equilibrium TB and SO concentrations were determined using a UV-Vis spectrophotometer at a wavelength of 625 nm for TB [33], and 516 nm for SO [34,35]. A maximum absorption wavelength of 633 nm was also used in another study for TB [20] and an absorption wavelength of 554 nm was also reported for SO [26]. An ion chromatography (IC) with a PRP-100 anion exchange column was used to analyze the equilibrium Cl− concentration.
A Shimadzu 8100 spectrometer equipped with a quartz ATR was used to acquire the FTIR spectra of the ZEO after equilibrating with different amounts of dyes, and the samples were scanned from 400 to 4000 cm−1 with a resolution of 4 cm−1. A Shimadzu 6100 X-Ray Diffractometer with a Ni filtered CuKα radiation at 30 kV and 40 mA was used to obtain the X-ray diffraction (XRD) patterns of the samples. Samples were scanned from 5–40° (2θ) with a scanning speed of 2°/min.
2.4. Molecular Dynamic Simulation
Materials Studio 6.0 software with ‘FORCITE” module was used for molecular dynamic simulation to investigate the interactions between the single dye or mixed dyes with the ZEO to reveal configurations of sorbed dye molecules on the mineral surfaces. The supercells were built based on 2a × 2b, 2a × 4c, or 2b × 4c, while the unit cell parameters for ZEO were: a = 17.688 Å, b = 17.902 Å, c = 7.409 Å, β = 116.5°, Z = 4. The number of dye molecules used for the simulation was calculated from the SSA of the minerals and the sorption capacity for each dye from the isotherm study. The simulation was performed at 298 K and the constructed model was optimized geometrically.
3. Results and Discussion
3.1. Subsection
Isotherms of Dye Sorption from Single and Binary Solution
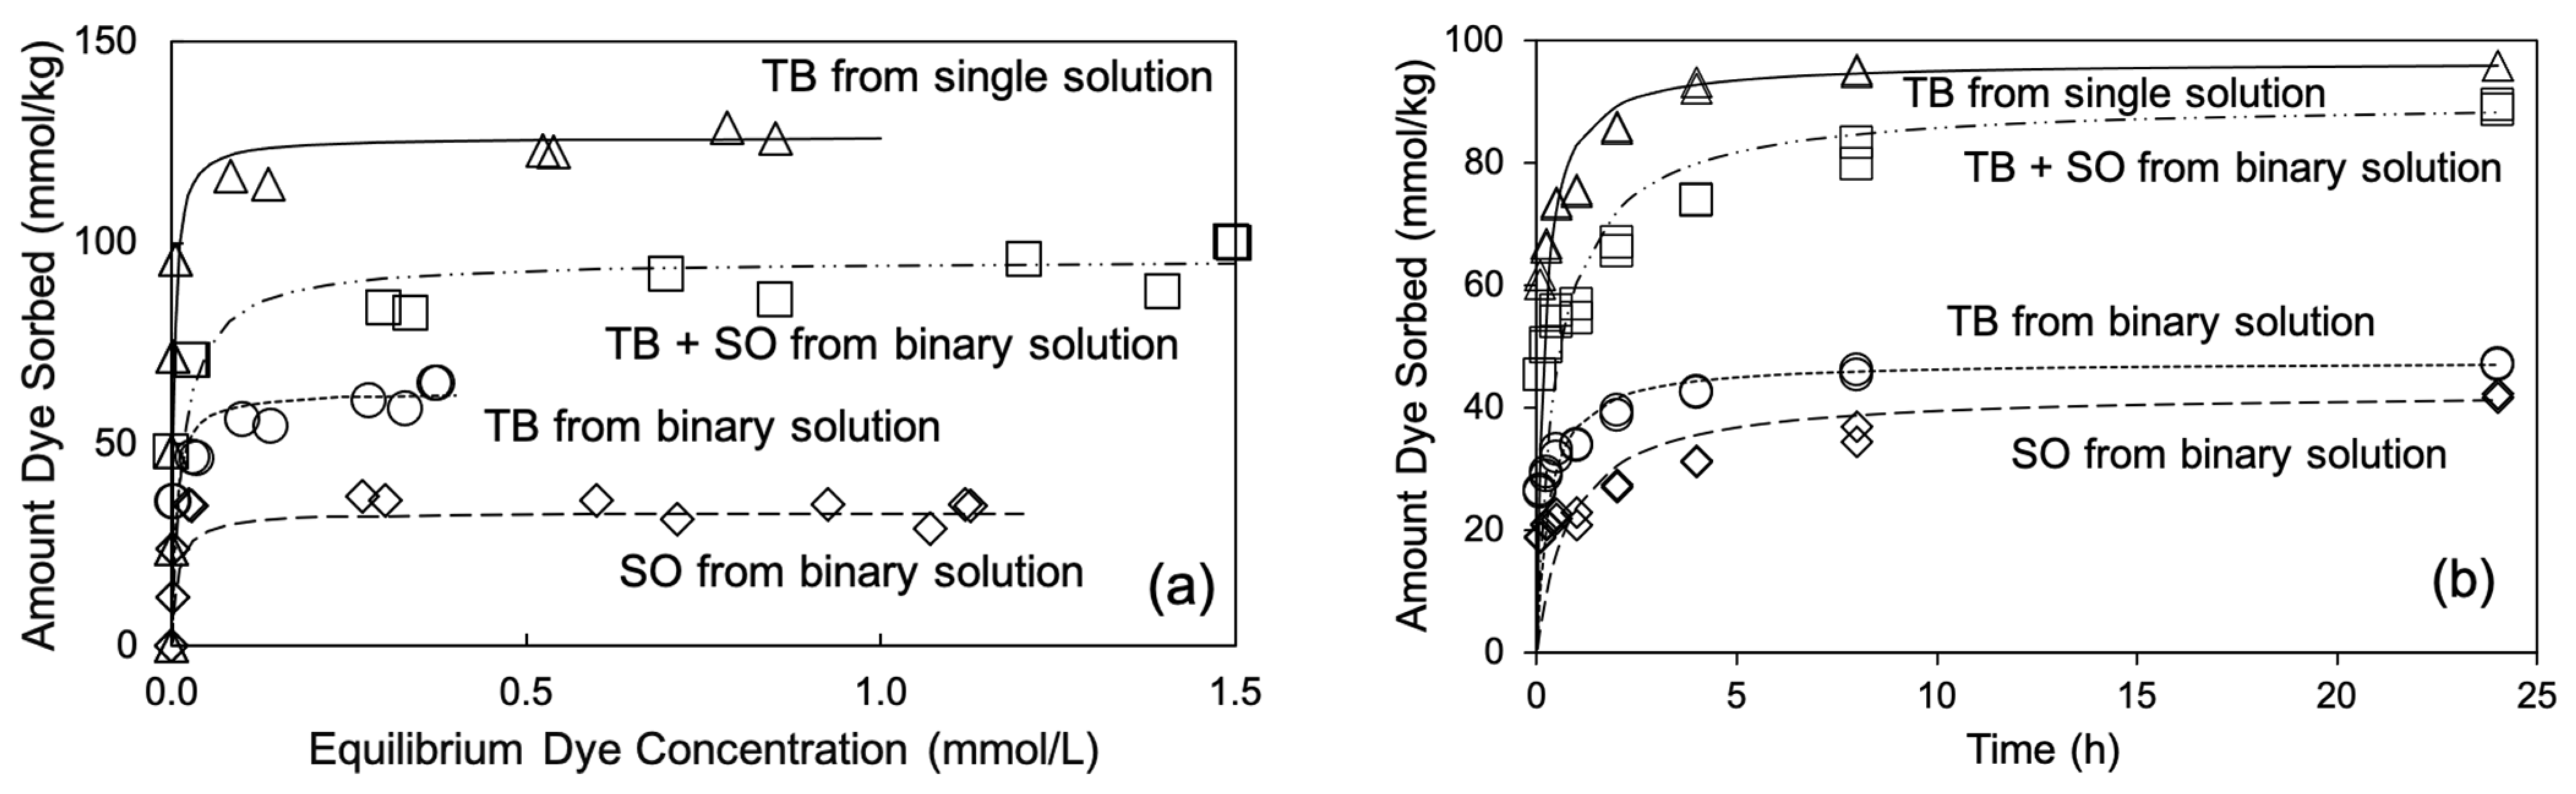
The sorption of both dyes was fitted to different isotherm models and the Langmuir isotherm model fitted the experimental data best (Figure 3a). It has the form of:
where CL and CS are the dye concentrations in the solution (mmol/L) and the amount of dye sorbed (mmol/kg) in the solid at equilibrium; the Sm (mmol/kg) and KL (L/mmol) are the Langmuir parameters reflecting the capacity of the dye sorption on, and the affinity of, the dye for the ZEO.
The Langmuir equation can be re-arranged into a linear form so that Sm and KL can be determined by a linear regression:
The fitted results are Sm = 63 and 33 mmol/kg and KL = 170 and 122 L/mmol for the TB and SO sorption from a binary solution of equal initial concentrations on ZEO, respectively. In contract, the SO sorption on ZEO from a single solution resulted in an Sm of 79 mmol/kg and a KL of 1808 L/mmol [36]. In this study, the sorption of TB from a single solution resulted in an Sm of 126 mmol/kg and KL of 333 L/mmol (Table 1). As such, TB had a much better affinity for ZEO in comparison to SO in the cationic form. A similar trend was found for TB sorption from a single solution on the fibrous clay minerals palygorskite and sepiolite [37]. The ECEC value of the ZEO was 90 meq/kg [32]. The Sm values for TB and SO sorption from both single and binary solutions were close to the ECEC value, strongly suggesting that cation exchange played a dominant role in the uptake of TB and SO; both are cationic dyes from either single or binary solutions.
In comparison, the sorption capacities of anionic dyes, RB21 and RR195, on clinoptilolite from a single solution system were 9.7 and 3.2 mg/g for, respectively [23]. Additionally, the sorption of basic red 18 (BR18) and basic blue 41 (BB41), both cationic dyes, on a feldspar resulted in the capacities of 11.1 and 10.6 mg/g for BB41, and 10.8 and 7.2 mg/g for BR18 from single and binary systems [38]. From a single solution, the TB sorption reached a capacity of 28 mg/g, equivalent to 92 mmol/kg on gypsum [33], Moreover, the TB sorption on bentonite was reported as low as 9.4 mg/g, or 30 mmol/kg [2], and as high as 5.8 mmol/g on MMT [5], and both were attributed to chemisorption. The SO sorption on palygorskite reached a capacity of 200 mg/g, or 570 mmol/kg [39].
3.2. Kinetics of Dye Sorption from Single and Binary Solution
The dye removal from single and binary solutions was relatively fast (Figure 3b). Pseudo-second-order kinetics were used to fit the experimental data of RB21 and RR195 sorption on the clinoptilolite from single and binary solutions, with rates of 0.03–0.3 and 0.003–0.05 g/mg min for the RB21 sorption from single and binary solutions, and 0.08–0.2 and 0.01–0.03 g/mg min for the RR195 sorption from single and binary solutions [23]. In this study, the experimental data were fitted to several kinetic models with the pseudo-second-order kinetics fitting the data best. It had the form of:
This could be converted into a linear form:
so that the parameters can be determined by linear fitting. In these equations, k (kg/mmol-h) and (mmol/kg-h) are the rate constants and initial rates of dye sorption on ZEO, qt and qe (mmol/kg) are the amounts of dye sorbed at time t and at equilibrium. The fitted qe values were 48 and 43 mmol/kg for TB and SO sorption from a binary solution of equal concentrations, with the coefficient of determination r2 greater than 0.995. The initial rates and the rate constants for TB and SO sorption on ZEO were 164 and 54 mmol/kg h, and 0.07 and 0.03 kg/mmol-h, respectively. In comparison, the qe values were 96 and 76 mmol/kg; the k values were 0.1 and 0.04 kg/mmol-h; and the values were 595 and 213 mmol/kg h for TB and SO sorption from a single solution (Table 1). The high-rate constant and larger qe value for TB sorption was again confirmed by the isotherm study and suggested a better affinity of TB for ZEO surfaces in comparison to SO. Previous results showed that the k and qe values were about 200 g/mol-s and 90 mmol/kg for TB sorption on a clinoptilolite zeolite [20] and the k and qe values were 0.56 g/mg min and 24.9 mg/g for TB sorption on bentonite [2].
3.3. Influence of Solution pH, Ionic Strength, and Temperature on Dye Sorption
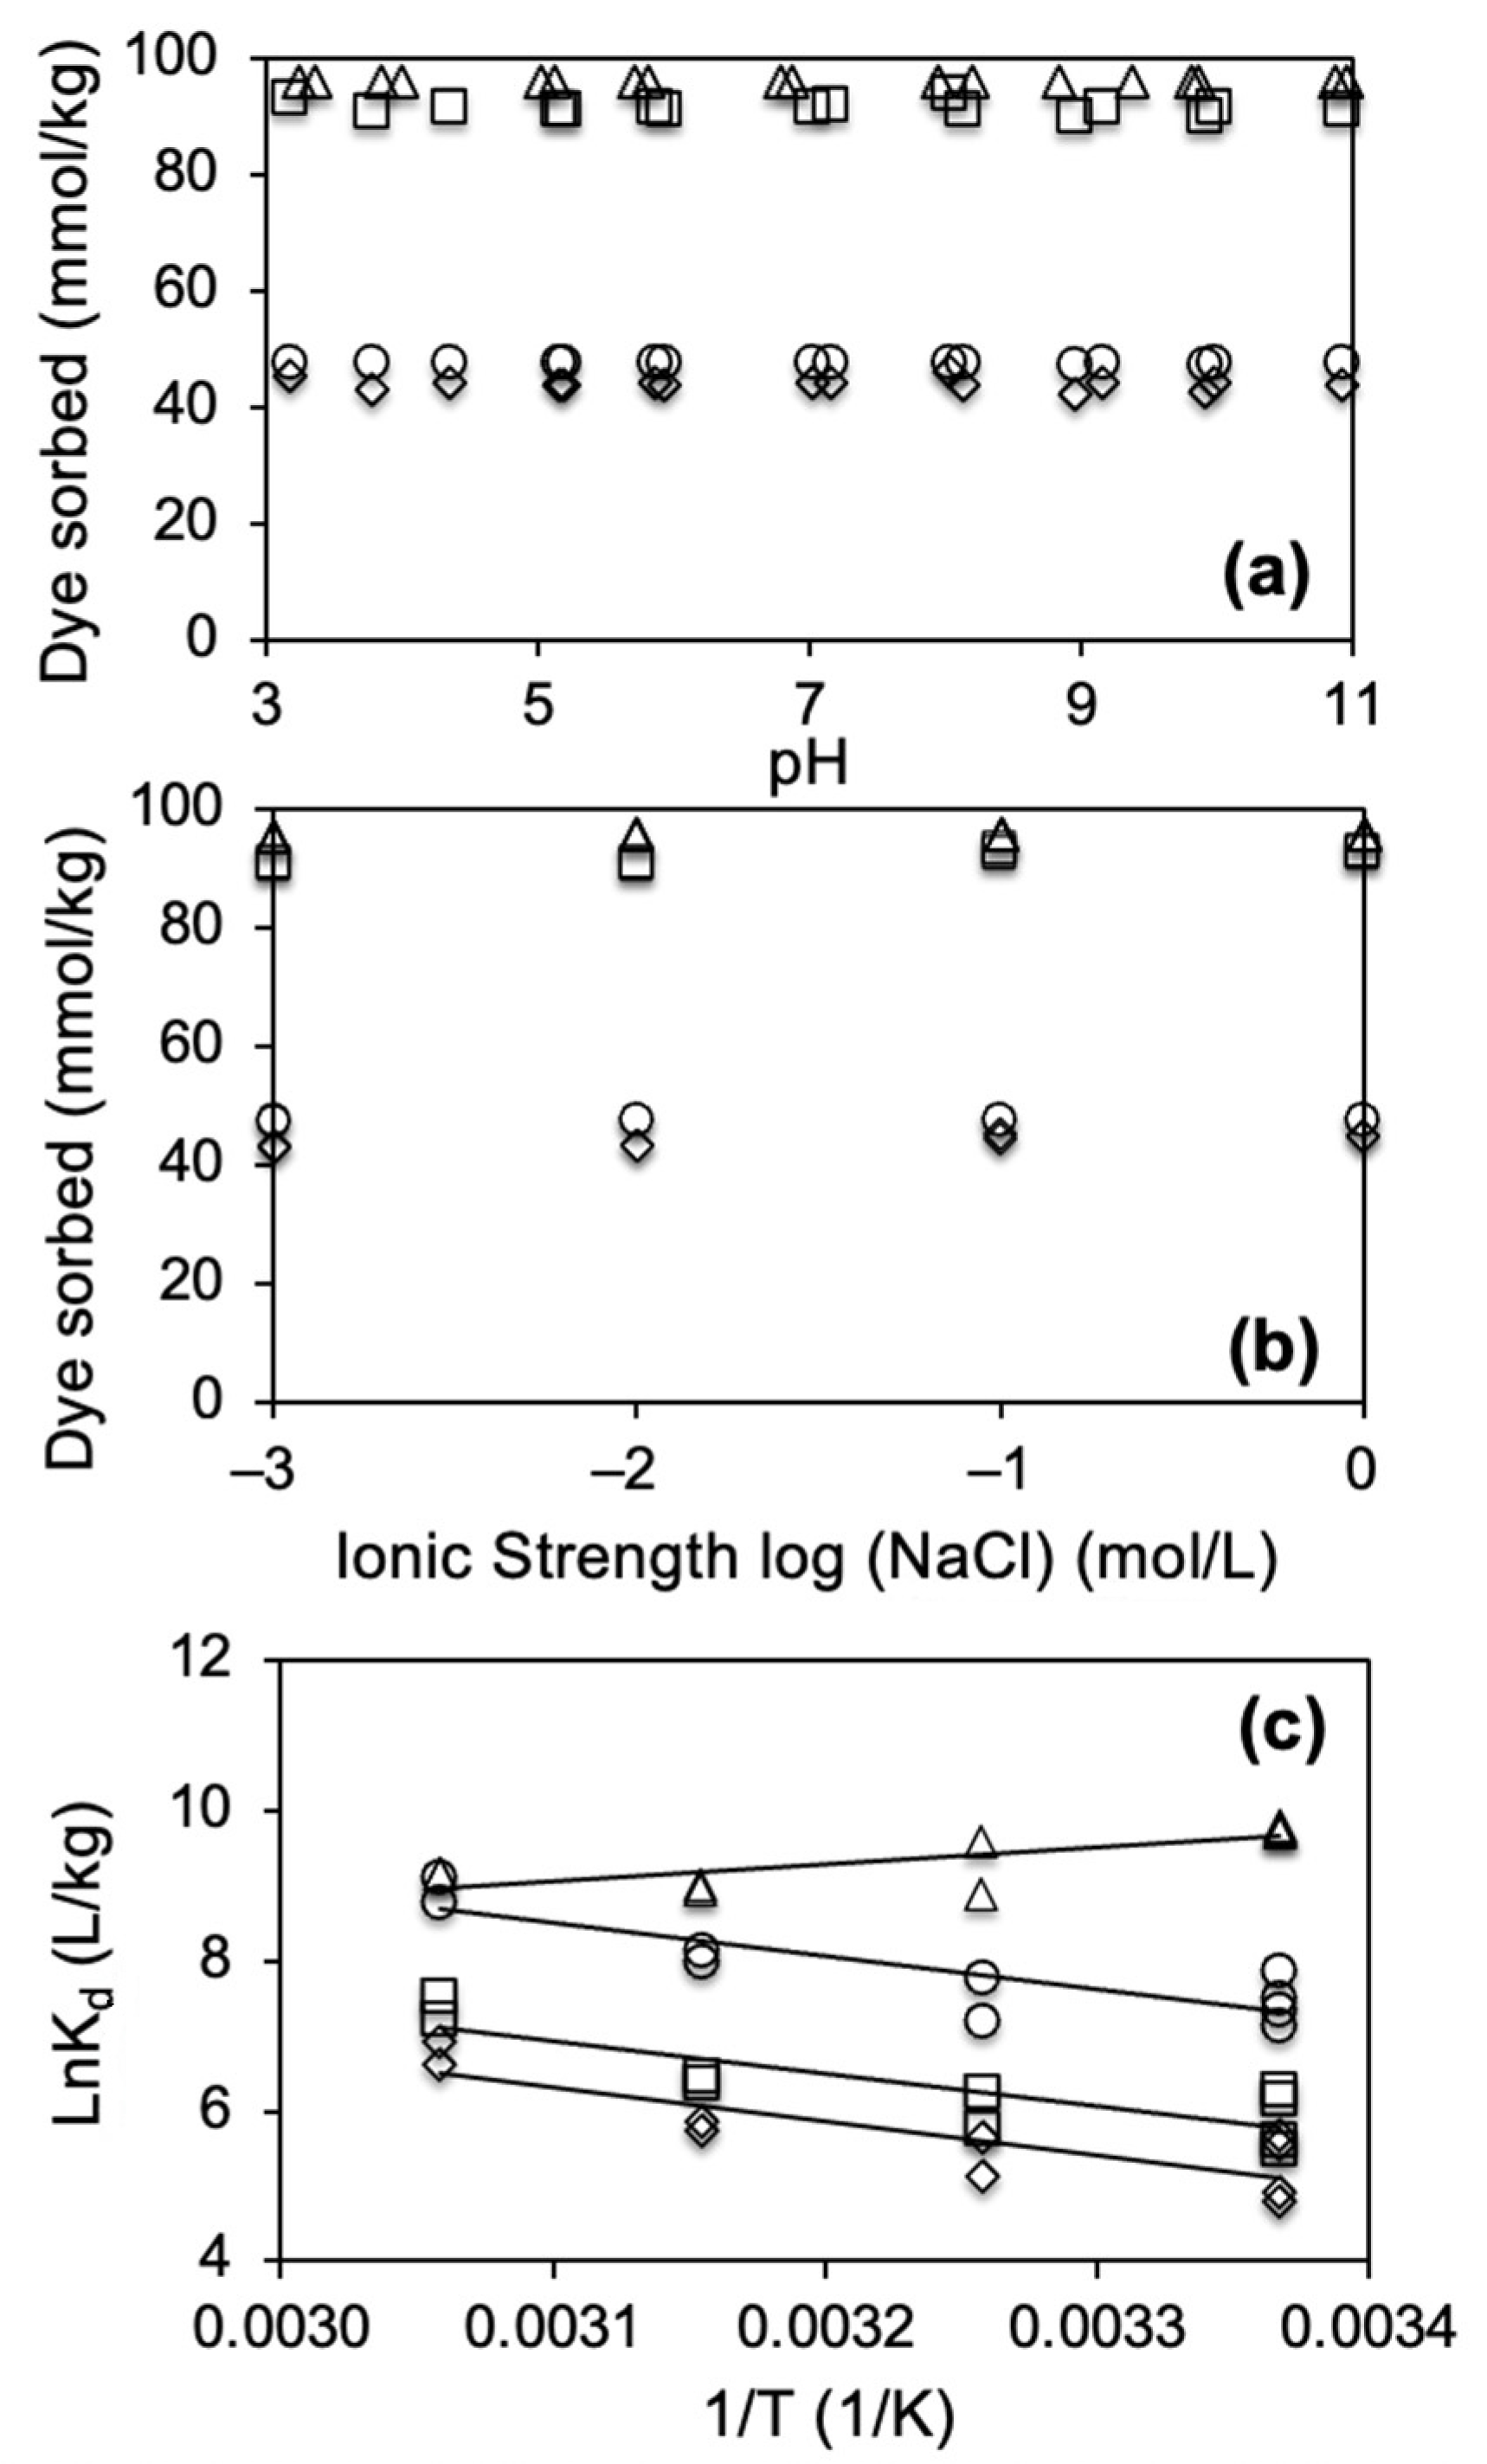
Statistically speaking, the influence of the equilibrium solution pH (3–11) on the sorption of TB (96 mmol/kg) from a single solution as well as TB (47 mmol/kg), SO (44 mmol/kg), and TB + SO (90–93 mmol/kg) from s binary solution, was minimal (Figure 4a). Additionally, the total amounts of dye sorption from single or binary solutions were approximately the same as the ECEC value of the mineral. In contrast, TB sorption on gypsum increased slightly in pH, from 3.5–6.5, but decreased significantly when the pH further increased to 9 [33]. Additionally, as the initial solution pH increased from 2 to 12, TB sorption on MMT increased from 30% to about 100% [15]. On the other hand, TB sorption on Neem leaf powder decreased from 0.2 mg/g to 0.05 mg/g as the pH increased from 1 to 11 [40].
Similarly, the influence of solution ionic strengths in terms of NaCl concentration also had a minimal effect on the dye uptake on ZEO and the values were about the same as those under different pH conditions, varying from 47 to 48, and from 43 to 45 mmol/kg for TB and SO sorption from a binary solution, from 91 to 93 mmol/kg for TB + SO sorption from a binary solution, and about 96 mmol/kg for TB sorption from single solution (Figure 4b). Previous results showed that added salts, such as NaCl, CaCl2, Na2SO4, and NH4Cl in the range of 0–10% (w/v), had a minimal influence on the SO sorption on modified zeolite [19]. For a cation exchange reaction, increasing the ionic strength would reduce the amount of target cations sorbed due to the competition for sorption sites on solid. The minimal influence of ionic strength on dye sorption suggests that the cationic dyes, TB and SO, are more competitive in the sorption sites in comparison to the inorganic cation Na+, or perhaps, that the counterion Cl− might enhance the TB or SO sorption due to promoting the sorption of the dimers of both dyes.
Under a different temperature, TB sorption from a single solution on ZEO was in the narrow range of 95.5 to 95.8 mmol/kg. In contrast, from a binary solution TB, SO, and TB + SO sorption were in the ranges of 46.6–47.8, 36–46, and 83–94 mmol/kg, respectively (Figure 4c). Overall, for the binary solution, the dye sorption increased as the equilibrium temperature increased from 23 to 53 °C. The solute distribution coefficient Kd was defined as the ratio of the amount of solute sorbed to the equilibrium solute concentration, and could be related to the thermodynamic parameters of solute sorption by:
where the ΔH and ΔS are the changes in enthalpy and entropy after dye sorption, and R and T are the gas constants and the equilibrium temperatures in K. The changes in the free energy of sorption ΔG are related to ΔH and ΔS by:
The calculated thermodynamic parameters are listed in Table 2. Overall, the statisitcal errors are somehow relatively large due to the fact that R2 values of the linear regrations in Figure 4c are relatively small (in the range of 0.7–0.8). Yet, overall, the ∆G° values were more negative for TB sorption in comparison to SO and more negative for dye sorption from a single solution in comparison to a binary solution, although the difference may not be statistically significant. Moreover, the ∆G° values were in the range of −12.5 to −24.4 kJ/mol, suggesting the net attractive interactions such as physical sorption or electrostatic interactions between the dye molecules and the mineral surfaces. The ∆H° values were negative for dye sorption from a single solution and positive from a binary solution. As for the ∆S°, the values are relatively small. In comparison, the ∆G° value was positive (80–90 kJ/mol) for MB on a zeolite from ECC International [41]. The ∆G° values for TB sorption on a bentonite were in the ranges of −1780 to −4950 kJ/mol, ∆H° of −53,720 kJ/mol [2]; the extreme large negative values may be due to the incorrect use of units associated with their values. On the other hand, TB sorption on Neem leaf powder resulted in ∆G°, ∆H°, and ∆S° values of −2 to −5 kg/mol, −53 kg/mol, and −14 kg/mol [40], which might be measured in kJ/mol, instead of kg/mol. The sorption of SO on MSep resulted in a ∆G° value of about −15 kJ/mol, suggesting physi-sorption [42].
3.4. XRD Analyses
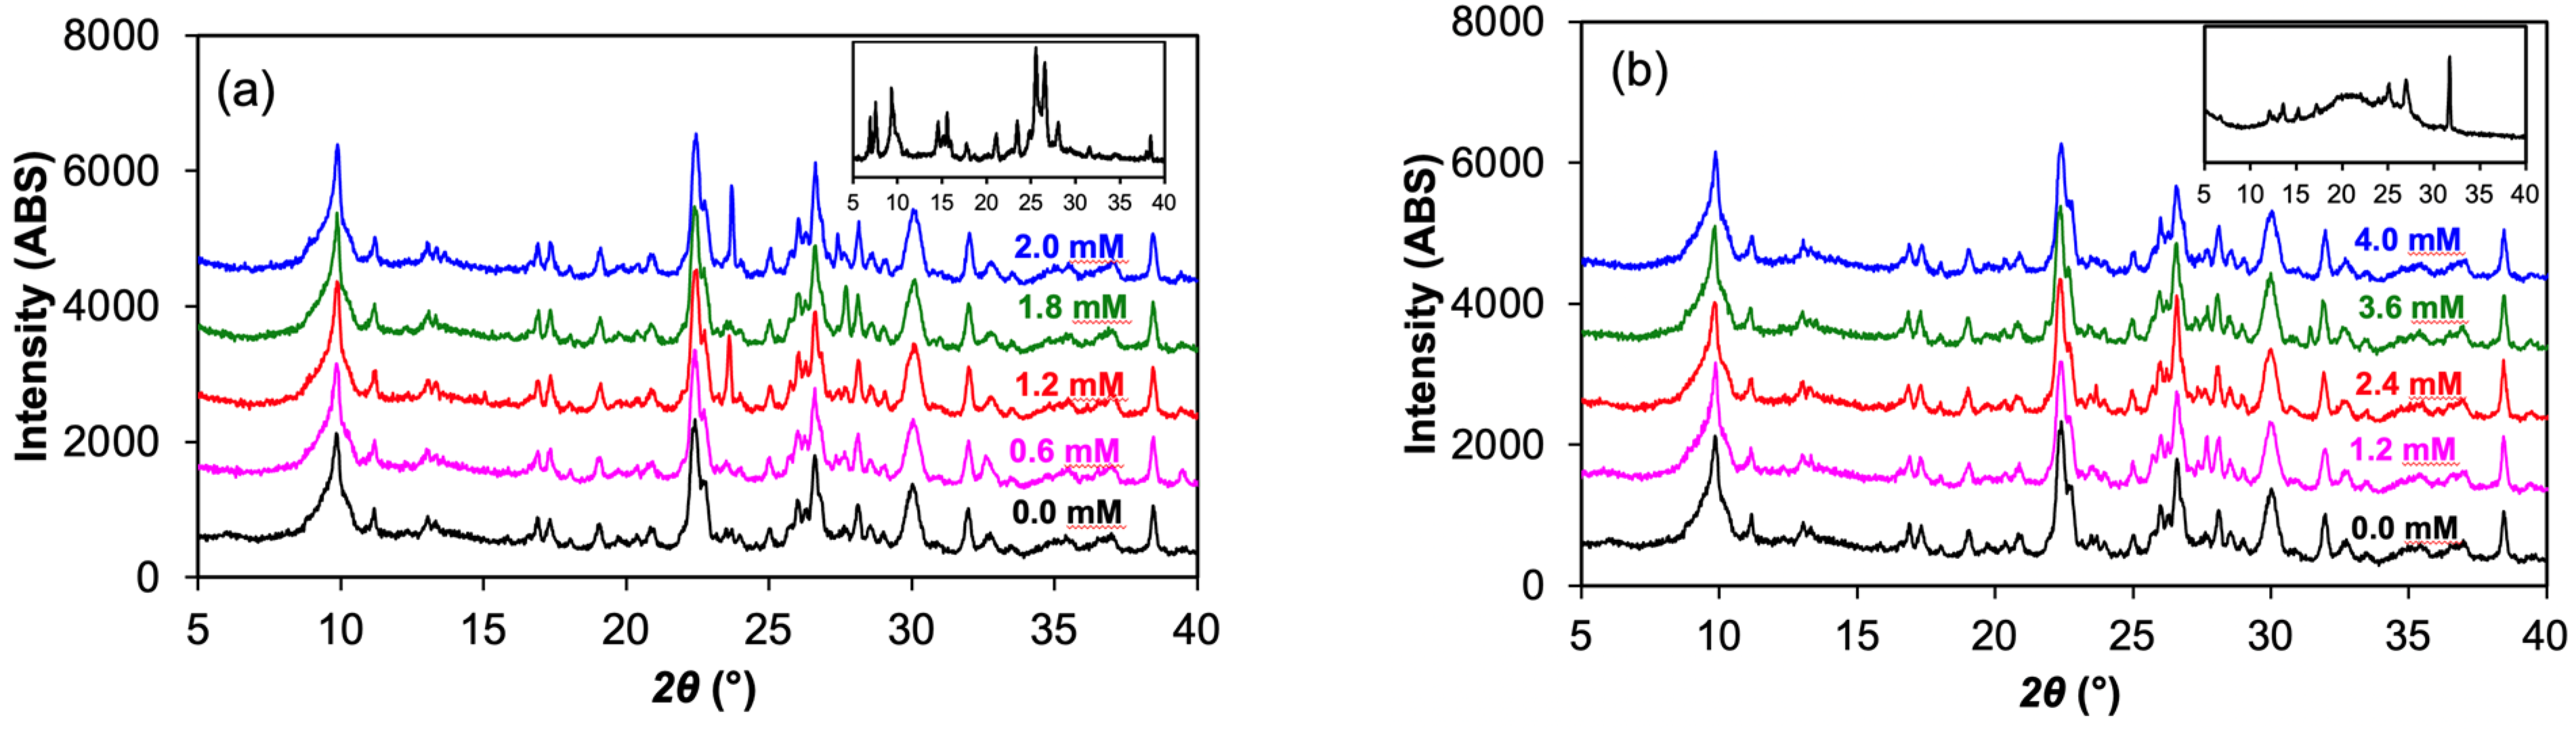
The XRD patterns of ZEO after equilibration with different initial concentrations from single and binary solutions are plotted in Figure 5. The results showed that neither the peak locations, nor the peak intensity or width, changed after dye sorption from single and binary solutions, suggesting that the sorption sites for the organic dyes were limited to the external surfaces only, although the ZEO is clinoptilolite with channel structures that are available for the sorption and exchange of inorganic cations. In comparison, at the TB sorption level of 0.2 g/g, the d001-spacing changed from 1.52 to 1.40 nm, indicating that the TB intercalated into the interlayer of MMT [16].
3.5. FTIR Analyses
The FTIR spectra of ZEO after the equilibration with single TB and binary TB and SO solutions of different initial concentrations are displayed in Figure 6. For solid TB, the bands were located at 1597, 1474, 1418, 1387, 1319, 1290, 1225, 1121, and 885 cm−1 (Figure 6). The band at 1597 cm−1 was assigned to the aromatic ring [43] and it shifted to 1607 cm−1 after being sorbed on ZEO (Figure 6c,d). The band at 1319 cm−1 was attributed to C=N stretching in SO [44]. Additionally, the band at 1325 cm−1 was assigned to N-(CH3)2 [45]. It was also a major band for TB and it shifted to 1333 cm−1 after TB sorption on ZEO from single and binary solutions (Figure 6c,d). The shift from 1319 to 1335 cm−1 or from 1325 to 1335 cm−1 suggested strong interactions between the C=N functional group of TB and the ZEO surfaces or electrostatic interactions between N+-(CH3)2 and the negatively charged mineral surfaces. A similar observation was found for TB sorption on the fibrous clay minerals, palygorskite and sepiolite [37].
For SO, strong bands were located at 1639, 1609, 1485, 1323, and 1188 cm−1 (Figure 6c). The only band after SO sorption from binary solution was the one at 1485 cm−1 and its location remained the same before and after SO sorption.
The results from FTIR study showed that TB played a more important role in the dye uptake from single and binary solutions.
3.6. Counterion Cl− Uptake Accompanying Dye Sorption
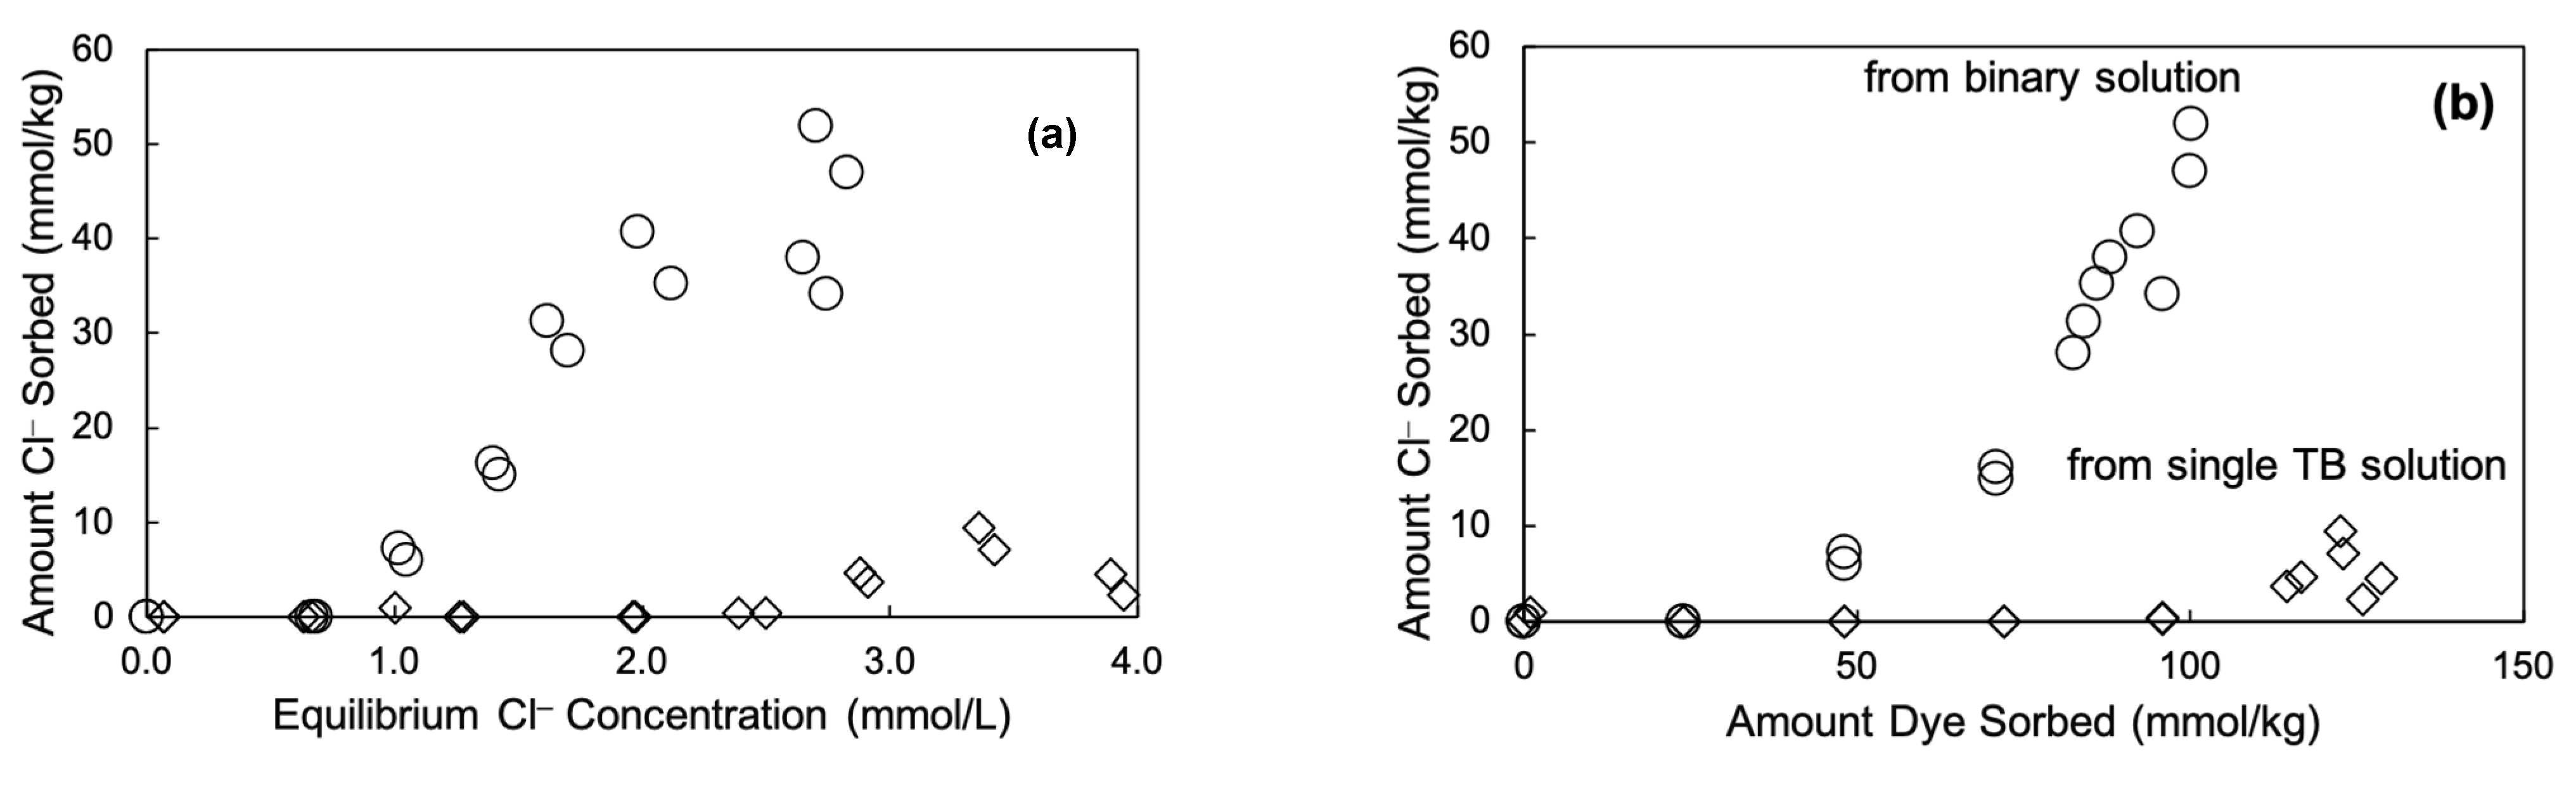
The analyses of the counterion Cl− in solution could reveal its function in dye uptake. For TB sorption from a single solution, the amount of Cl− sorbed at a high TB loading was about 10 mmol/kg, corresponding to about 10% of the TB sorbed. For SO sorption from a single solution, no counter Cl− sorption was observed from the initial concentrations up to 2.5 mM. In contrast, the Cl− sorption was about 50 mmol/kg from a binary solution, about 50% of the total dye sorbed, suggesting a more dimeric formation of the same dye or the bridging of different dyes by Cl− (Figure 7).
3.7. Molecular Dynamic Simulation
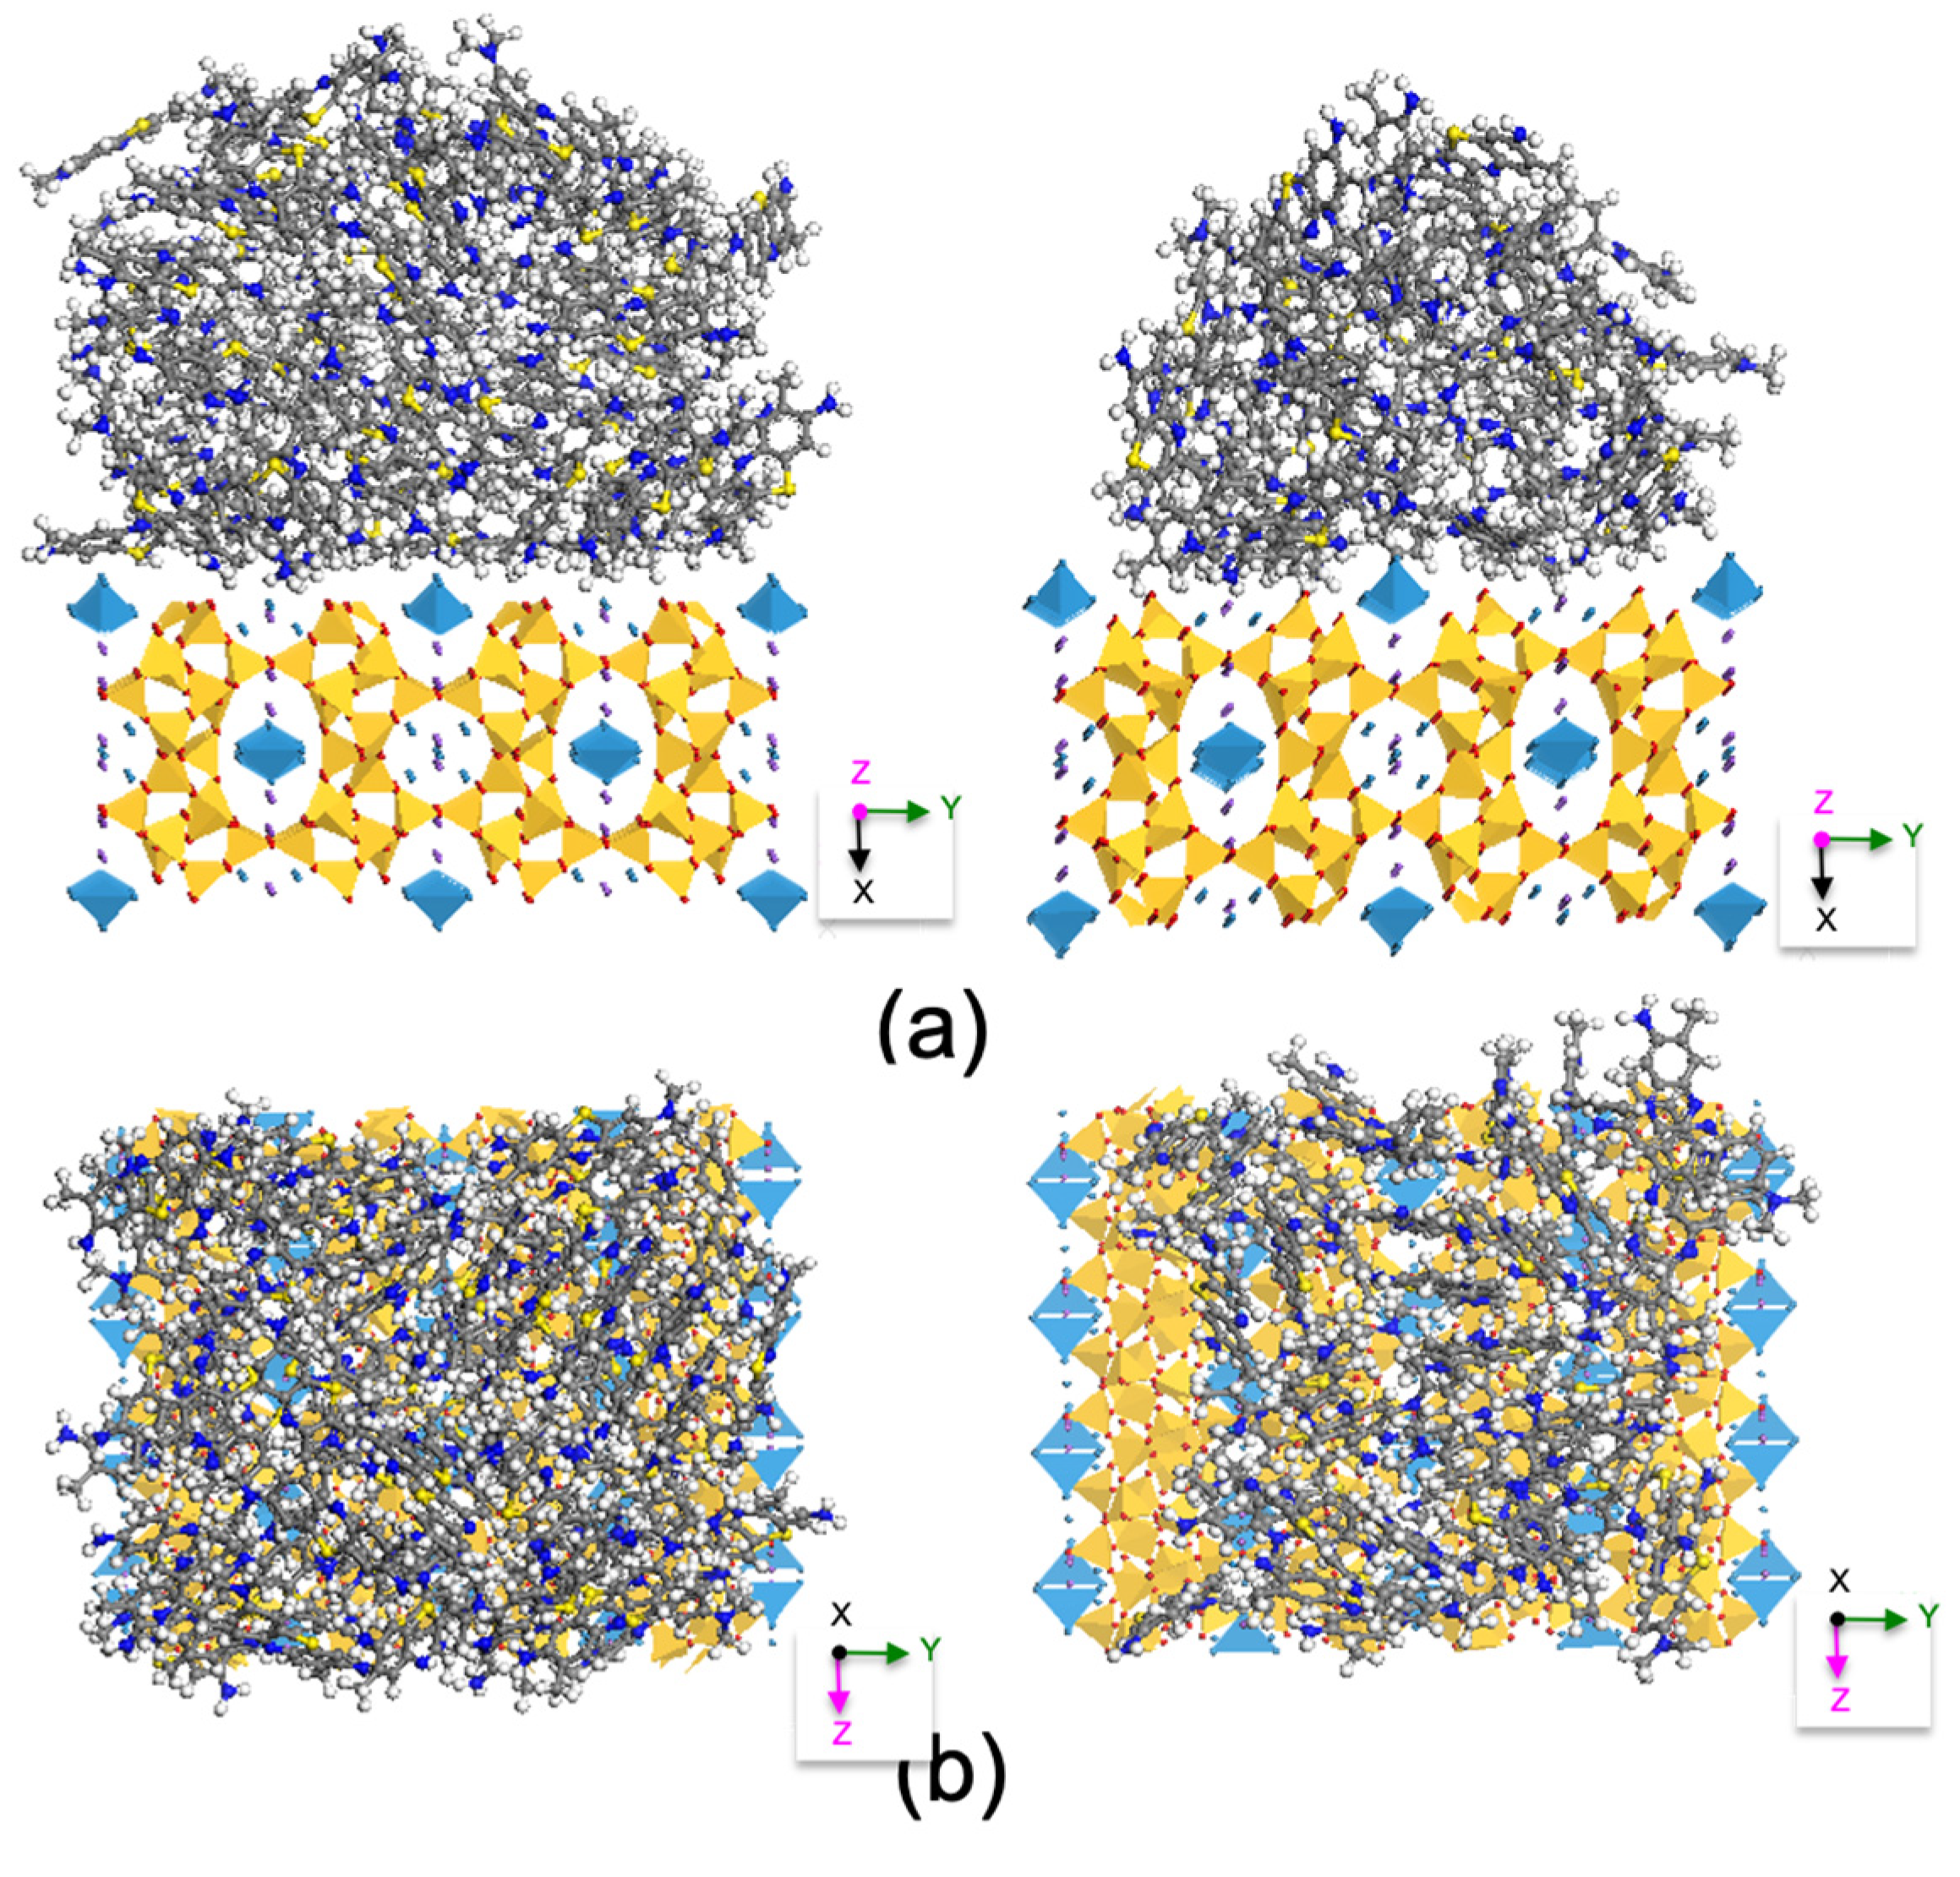
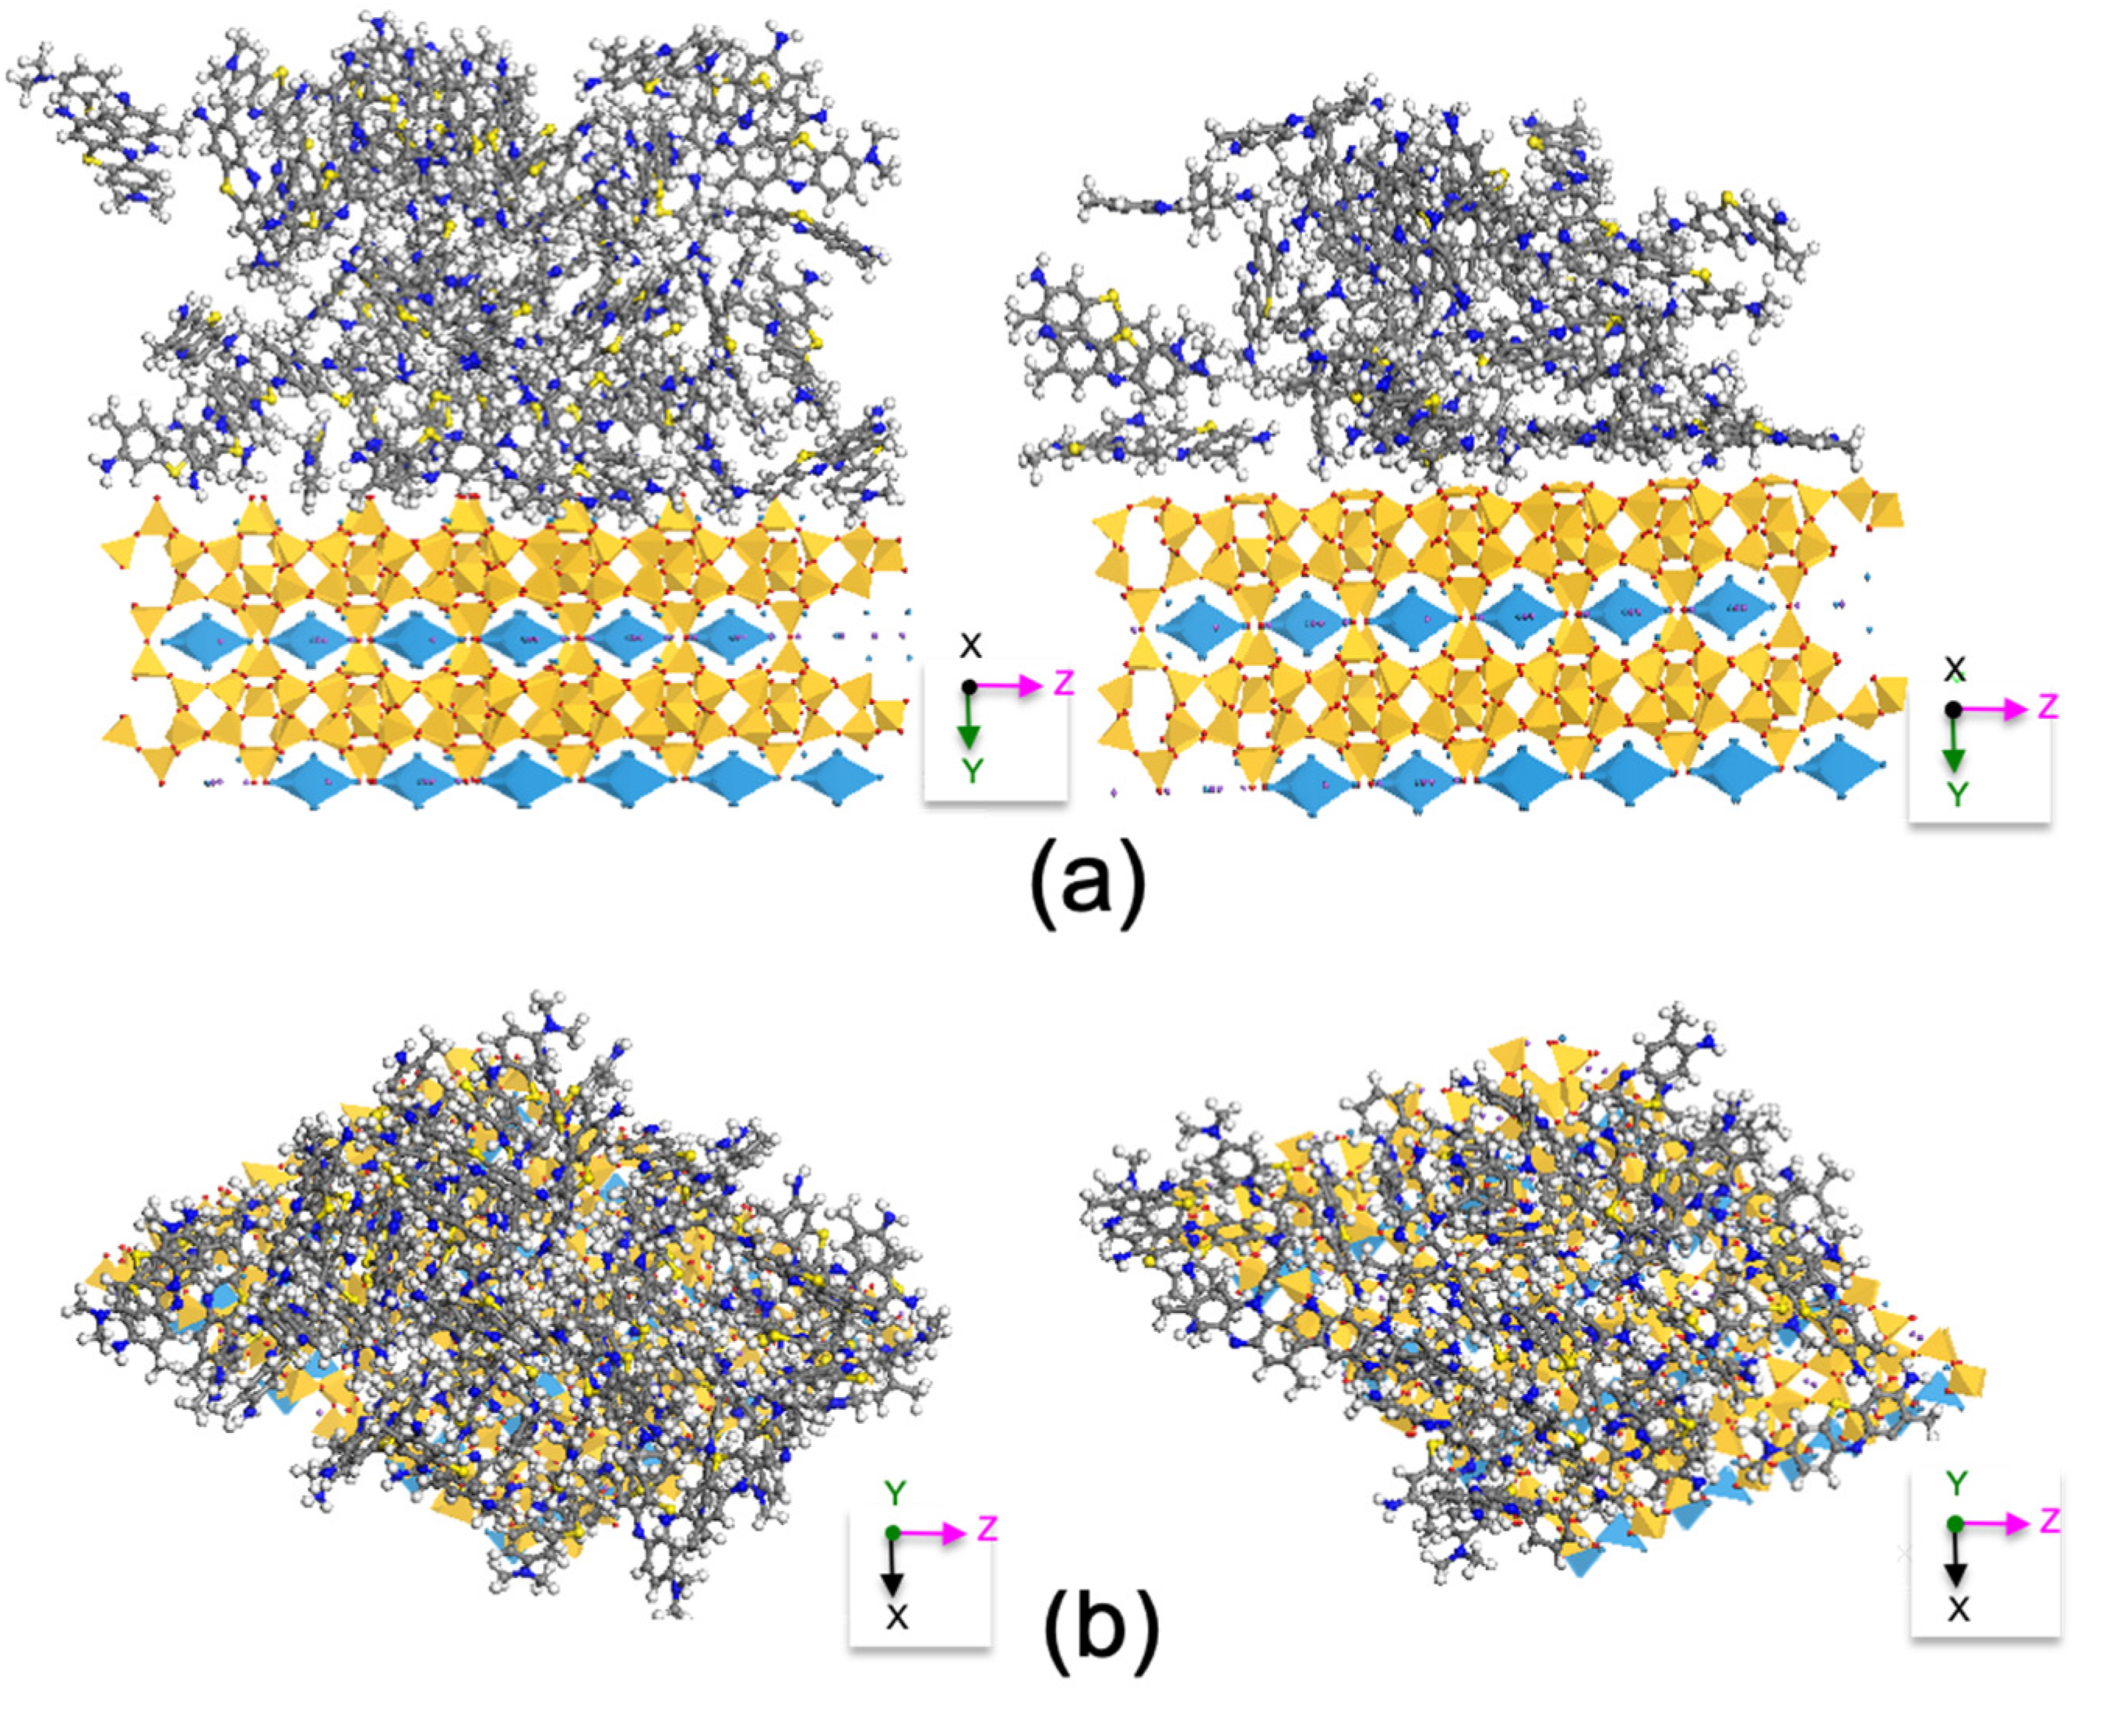
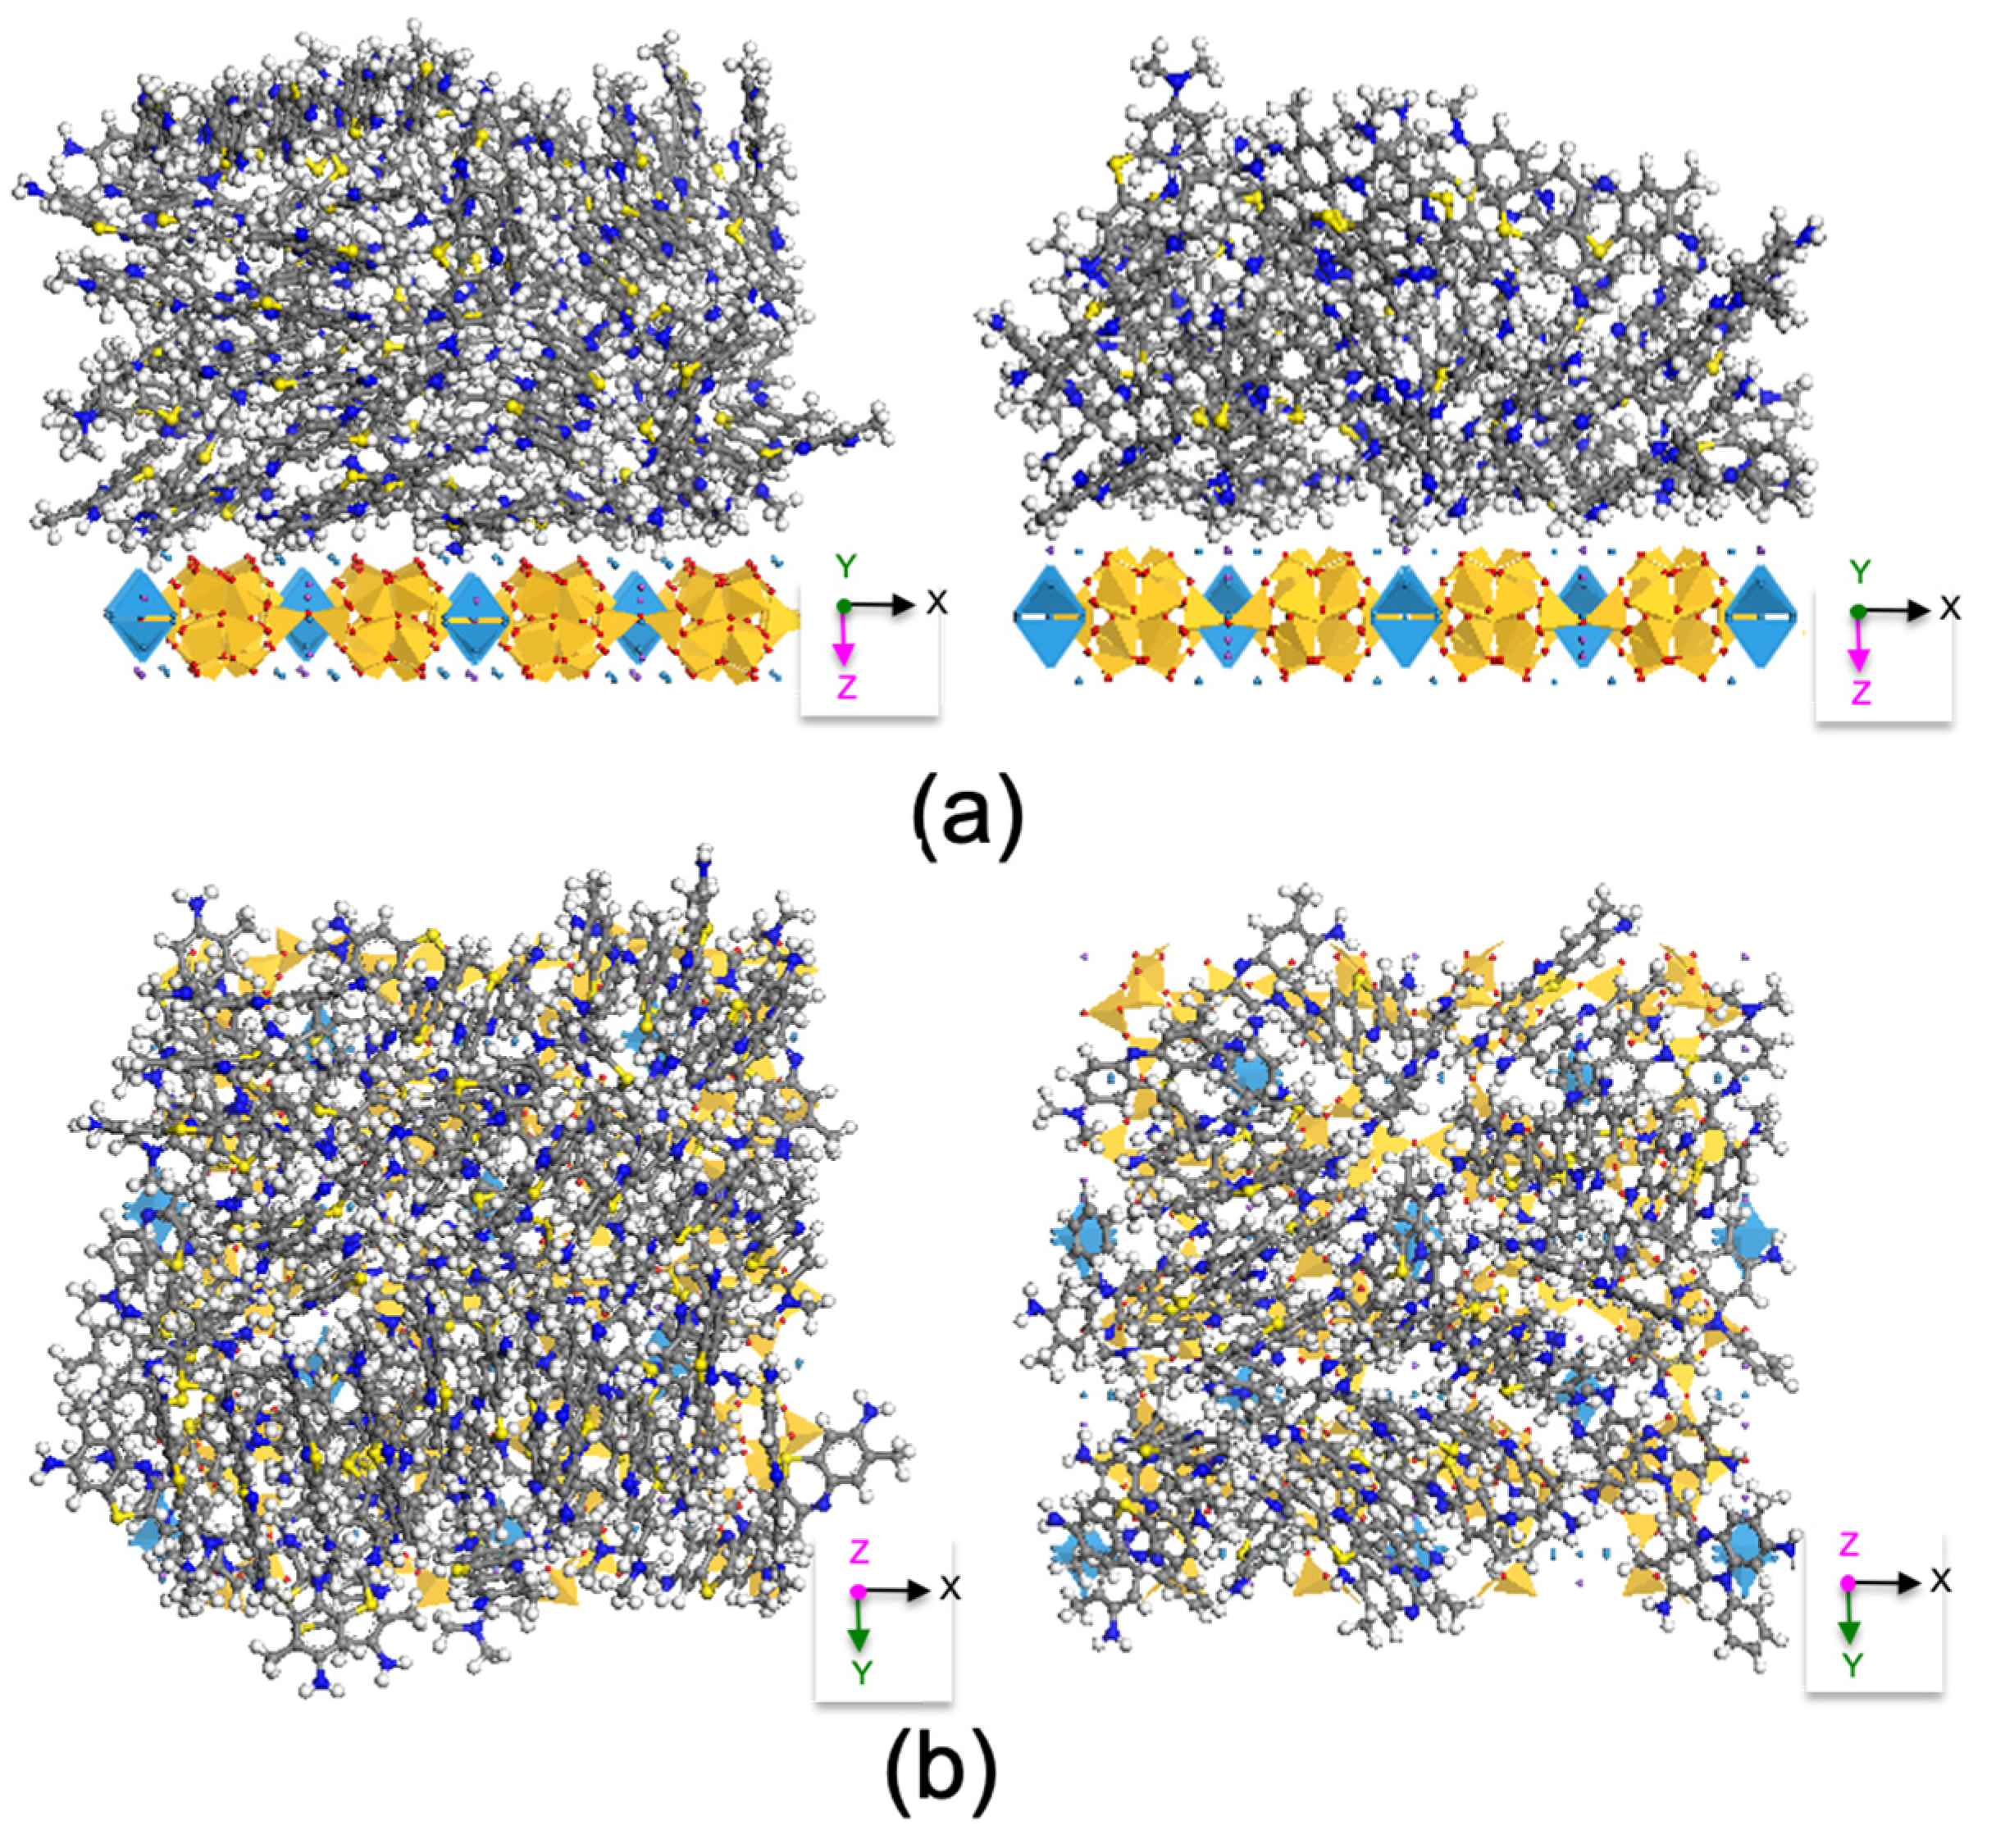
The results from the molecular dynamic simulation showed the extensive TB molecules aggregation on the surfaces of ZEO at the TB sorption capacity of 126 mmol/kg along different crystallographic directions or different crystal faces (Figure 8, Figure 9 and Figure 10). Similarly, at the TB + SO sorption capacity of 96 mmol/kg, both TB and SO molecules formed aggregates on ZEO surfaces (Figure 8, Figure 9 and Figure 10), confirming the simultaneous uptake of Cl− at high SO loading levels, revealed by the IC study. The clips of the simulation dynamics can be found in the supporting documents. These results suggested that the admicelles of dye are the final dye surface configuration are caused by the large ECEC value and limited external SSA value of ZEO.
3.8. Discussions
Limited studies were conducted to investigate the uptake and removal of dyes from mixed solutions. Previous studies showed that cation exchange and chemisorption were the driving forces for SO uptake on a Yeman ZEO with a capacity of 120 mmol/kg [22]. The sorption of MB on zeolites prepared from three Egyptian kaolins resulted in a capacity of 34–68 mmol/kg [43] and a TB sorption on Turkish ZEO had a capacity of 170 mmol/kg [20]. The sorption of SO on the same ZEO was 79 mmol/kg [36]. In this study, the TB sorption from a single solution was 126 mmol/kg and both TB and SO sorption was 96 mmol/kg, in agreement with the ECEC value of 110 meq/kg for the ZEO. Thus, the removal of cationic dyes from single and binary solutions should be attributed to the cation exchange.
The TB molecule is 1.2 nm long by 0.52 nm wide by 0.17 nm thick with a planer structure (Figure 1). The positive charge is localized on the dimethylamino group [46]. Similarly, the SO molecule is 1.16 nm long by 0.96 nm wide by 0.4 nm thick (Figure 1). The extra width is due to a benzene ring attached to the N in the phenazinium with the positive charges located on that N. (Figure 2). The differences in the locations of positively charged N, should determine the interactions between the dye molecules and the negatively charged mineral surfaces. As such, the interactions between TB+ and ZEO may have much less stereo hindering in comparison to SO+ and ZEO, which can be attributed to the elevated TB sorption on ZEO in comparison to SO.
Many organic dye molecules associate themselves into aggremers in a solution where their concentrations are high. The simplest aggremers are dimers, in which two dye monomers associate. The dimerization constant KD is defined as:
where the [M] and [D] are the dye monomer and dimer concentrations, respectively. For TB, its KD value in water is 10,300 M−1 [45]. For MB, which has a similar structure to TB, the KD value in water is 4700 M−1 [47]. In other studies, the reported KD value in water was 10,500 [48] and 3311 [49]. Similarly, the reported logKD value of MB in water was 3.6 and that of SO was 4.3, corresponding to about 4000 and 20,000 [50]. By using the KD value of 10,300 M−1 at the highest input concentration of 4 mM for TB sorption from a single solution, the initial monomer and dimer concentrations would be 0.4 and 1.8 mM. On the contrary, if the KD values of 10,300 and 20,000 were used at the highest input concentration of 2 mM for TB and SO sorption from a binary solution, the initial monomer and dimer concentrations would be 0.3 and 0.86 mM and 0.21 and 0.89 mM for TB and SO. Thus, significant amounts of the sorbed TB or SO might result in a dimeric formation, as revealed by a molecular dynamic simulation with the preferred dimeric aggregation of TB in the antiparallel fashion in a form of the H type [51]. The lower equilibrium Cl− concentration, particularly when mixed dyes were present in solution also confirmed uptake of counterion Cl− accompanying mixed dye sorption. This also strongly suggests the formation of dimers or bilayers of mixed dyes on ZEO surfaces.
4. Conclusions
In this study, the sorption of TB and SO from single and binary solutions on tectosilicate clinoptilolite zeolite was investigated under different experimental conditions. The results showed that the TB sorption capacities from a single solution and the TB + SO sorption from a binary solution matched well with the external cation exchange capacity of the zeolite, and strongly suggested the cation exchange mechanism for the uptake of cationic dyes TB and SO. The solution pH and ionic strength had a minimal influence on the dye sorption from single and binary solutions, suggesting a higher affinity of cationic dyes in comparison to inorganic cations. From a binary solution, TB sorption almost doubled the SO sorption with equal input concentrations. The XRD results suggested that the sorbed dye molecules were limited to the external surfaces of zeolite. The stereo effect of SO may contribute to its reduced sorption. Due to the low specific surface area, sorbed dye molecules aggregate into aggremers or admicelles on zeolite surfaces at higher initial concentrations. The FTIR results suggested the participation of N+-(CH3)2 with zeolite surfaces for TB sorption in comparison to N+ in the benzene ring for SO sorption. The molecular simulation results confirmed dense TB or TB + SO aggregations on zeolite surfaces. The results showed that zeolite was a good candidate for the sorptive removal of cationic dyes from a solution and further column tests may be needed.
Author Contributions
Conceptualization, Z.L. and Y.S.; methodology, Z.L.; software, X.W. (Xisen Wang); validation, Z.L., Y.S. and X.W. (Xin Wang); formal analysis, K.C. and X.W. (Xin Wang); investigation, X.W. (Xin Wang); resources, Z.L.; data curation, Z.L., K.C. and X.W. (Xin Wang); writing—original draft preparation, Z.L.; writing—review and editing, Y.S.; visualization, Z.L. and X.W. (Xisen Wang); supervision, Z.L.; project administration, Z.L.; funding acquisition, Z.L. and Y.S. All authors have read and agreed to the published version of the manuscript.
Funding
The research was partially supported by Training Plan for Young Backbone Teachers in Colleges and Universities in Henan Province (2019GGJS098, and 2020GGJS098) and by a SPARK grant provided from Wisys.
Institutional Review Board Statement
Not applicable.
Informed Consent Statement
Not applicable.
Data Availability Statement
Upon request.
Conflicts of Interest
The authors declare no conflict of interest.
References
- Leif, R.; Rezma, S.; Hafiane, A. Removal of toluidine blue from aqueous solution using orange peel waste (OPW). Desalin. Water Treat. 2015, 56, 2754–2765. [Google Scholar]
- Fosso-Kankeu, E.; Potgieter, J.; Waanders, F.B. Removal of malachite green and toluidine blue dyes from aqueous solution using a clay-biochar composite of bentonite and sweet sorghum bagasse. Inter. J. Appl. Engineer. Res. 2019, 14, 1324–1333. [Google Scholar]
- Katheresan, V.; Kansedo, J.; Lau, S.Y. Efficiency of various recent wastewater dye removal methods: A review. J. Environ. Chem. Engineer. 2018, 6, 4676–4697. [Google Scholar] [CrossRef]
- McKay, G.; Porter, J.F.; Prasad, G.R. The removal of dye colours from aqueous solutions by adsorption on low-cost materials. Water Air Soil Pollut. 1999, 114, 423–438. [Google Scholar] [CrossRef]
- Olajire, A.A.; Giwa, A.A.; Bello, I.A. Competitive adsorption of dye species from aqueous solution onto melon husk in single and ternary dye systems. Inter. J. Environ. Sci. Technol. 2015, 12, 939–950. [Google Scholar] [CrossRef] [Green Version]
- Cavallaro, G.; Lazzara, G.; Rozhina, E.; Konnova, S.; Kryuchkova, M.; Khaertdinov, N.; Fakhrullin, R. Organic-nanoclay composite materials as removal agents for environmental decontamination. RSC Adv. 2019, 9, 40553–40564. [Google Scholar] [CrossRef] [Green Version]
- Adam, A.M.A.; Saad, H.A.; Atta, A.A.; Alsawat, M.; Hegab, M.S.; Refat, M.S.; Altalhi, T.A.; Alosaimi, E.H.; Younes, A.A. Preparation and characterization of new CrFeO3-carbon composite using environmentally friendly methods to remove organic dye pollutants from aqueous solutions. Crystals 2021, 11, 960. [Google Scholar] [CrossRef]
- Su, X.; Liu, L.; Zhang, Y.; Liao, Q.; Yu, Q.; Meng, R.; Yao, J. Efficient Removal of Cationic and Anionic Dyes from Aqueous Solution Using Cellulose-gp (AA-co-AM) Bio-Adsorbent. Bioresources 2017, 12, 3413–3424. [Google Scholar] [CrossRef] [Green Version]
- Ong, S.T.; Lee, W.N.; Keng, P.S.; Hung, Y.T.; Ha, S.T. Equilibrium studies and kinetics mechanism for the removal of basic and reactive dyes in both single and binary systems using EDTA modified rice husk. Inter. J. Phys. Sci. 2010, 5, 582–595. [Google Scholar]
- Idan, I.J.; Jamil, S.N.A.B.M.; Abdullah, L.C.; Choong, T.S.Y. Removal of reactive anionic dyes from binary solutions by adsorption onto quaternized kenaf core fiber. Inter. J. Chem. Engineer. 2017, 2017, 9792657. [Google Scholar] [CrossRef]
- Kaushal, S.; Badru, R.; Kumar, S.; Kaur, H.; Singh, P. Efficient removal of cationic and anionic dyes from their binary mixtures by organic–inorganic hybrid material. J. Inorg. Organomet. Polym. Mater. 2018, 28, 968–977. [Google Scholar] [CrossRef]
- Cohen, R.; Yariv, S. Metachromasy in clay minerals. Sorption of acridine orange by montmorillonite. J. Chem. Soc. Faraday Trans. 1 1984, 80, 1705–1715. [Google Scholar] [CrossRef]
- Grauer, Z.; Malter, A.B.; Yariv, S.; Avnir, D. Sorption of rhodamine B by montmorillonite and laponite. Colloid. Surf. 1987, 25, 41–65. [Google Scholar] [CrossRef]
- Cenens, J.; Schoonheydt, R.A. Visible spectroscopy of methylene blue on hectorite, laponite B, and barasym in aqueous suspension. Clays Clay Miner. 1988, 36, 214–224. [Google Scholar] [CrossRef]
- El Haouti, R.; Ouachtak, H.; El Guerdaoui, A.; Amedlous, A.; Amaterz, E.; Haounati, R.; Addi, A.A.; Akbal, F.; El Alem, N.; Taha, M.L. Cationic dyes adsorption by Na-Montmorillonite Nano Clay: Experimental study combined with a theoretical investigation using DFT-based descriptors and molecular dynamics simulations. J. Mol. Liq. 2019, 290, 111139. [Google Scholar] [CrossRef]
- Peinemann, N.; Helmy, A.K. Cation exchange capacities of safranin, toluidine and alizarin complexes with montmorillonite. Soil Sci. 1999, 164, 650–654. [Google Scholar] [CrossRef]
- Özdemir, A.; Keskin, C.S. Removal of a binary dye mixture of congo red and malachite green from aqueous solutions using a bentonite adsorbent. Clays Clay Miner. 2009, 57, 695–705. [Google Scholar] [CrossRef]
- Shirazi, E.K.; Metzger, J.W.; Fischer, K.; Hassani, A.H. Removal of textile dyes from single and binary component systems by Persian bentonite and a mixed adsorbent of bentonite/charred dolomite. Colloids Surf. A Physicochem. Eng. Aspects. 2020, 598, 124807. [Google Scholar] [CrossRef]
- Rohani, T.; Seyedghasemi, M.S. Application of surfactant-coated magnetic zeolite NAA as a new sorbent to remove Safranin O dye from aqueous solutions. Bulg. Chem. Commun. 2017, 323–328. [Google Scholar]
- Alpat, S.K.; Özbayrak, Ö.; Alpat, Ş.; Akçay, H. The adsorption kinetics and removal of cationic dye, Toluidine Blue O, from aqueous solution with Turkish zeolite. J. Hazard. Mater 2008, 151, 213–220. [Google Scholar] [CrossRef]
- Qiu, M.; Qian, C.; Xu, J.; Wu, J.; Wang, G. Studies on the adsorption of dyes into clinoptilolite. Desalination 2009, 243, 286–292. [Google Scholar] [CrossRef]
- Abukhadra, M.R.; Mohamed, A.S. Adsorption removal of safranin dye contaminants from water using various types of natural zeolite. Silicon. 2019, 11, 1635–1647. [Google Scholar] [CrossRef]
- Sismanoglu, T.; Kismir, Y.; Karakus, S. Single and binary adsorption of reactive dyes from aqueous solutions onto clinoptilolite. J. Hazard. Mater. 2010, 184, 164–169. [Google Scholar] [CrossRef] [PubMed]
- Sridharan, G.; Shankar, A.A. Toluidine blue: A review of its chemistry and clinical utility. J. Oral Maxillofac. Pathol. 2012, 16, 251–255. [Google Scholar] [CrossRef] [Green Version]
- Kaur, S.; Rani, S.; Mahajan, R.K.; Asif, M.; Gupta, V.K. Synthesis and adsorption properties of mesoporous material for the removal of dye safranin: Kinetics, equilibrium, and thermodynamics. J. Ind. Engineer. Chem. 2015, 22, 19–27. [Google Scholar] [CrossRef]
- Thabet, M.S.; Ismaiel, A.M. Saudi Arabia Natural Clay: Characterization, Equilibrium, Kinetics and Thermodynamics Models for Elimination of Textile Dyes. Int. J. Environ. Monit. Protect. 2018, 5, 31–39. [Google Scholar]
- Gomez, V.; Larrechi, M.S.; Callao, M.P. Kinetic and adsorption study of acid dye removal using activated carbon. Chemosphere 2007, 69, 1151–1158. [Google Scholar] [CrossRef]
- Amin, N.K. Removal of reactive dye from aqueous solutions by adsorption onto activated carbons prepared from sugarcane bagasse pith. Desalination 2008, 223, 152–161. [Google Scholar] [CrossRef]
- Salim, H.A.M.; Salih, S.A.M. Photodegradation study of Toluidine Blue dye in aqueous solution using magnesium oxide as a photocatalyst. Int. J. Chem. 2015, 7, 143. [Google Scholar] [CrossRef] [Green Version]
- Bekkouche, S.; Merouani, S.; Hamdaoui, O.; Bouhelassa, M. Efficient photocatalytic degradation of Safranin O by integrating solar-UV/TiO2/persulfate treatment: Implication of sulfate radical in the oxidation process and effect of various water matrix components. J. Photochem. Photobiol. A Chem. 2017, 345, 80–91. [Google Scholar] [CrossRef]
- Harris, R.G.; Wells, J.D.; Johnson, B.B. Selective adsorption of dyes and other organic molecules to kaolinite and oxide surfaces. Colloids Surf. A Physicochem. Eng. Aspects. 2001, 180, 131–140. [Google Scholar] [CrossRef]
- Li, Z.; Bowman, R.S. Counterion effects on the sorption of cationic surfactant and chromate on natural clinoptilolite. Environ. Sci. Technol. 1997, 31, 2407–2412. [Google Scholar] [CrossRef]
- Rauf, M.A.; Qadri, S.M.; Ashraf, S.; Al-Mansoori, K.M. Adsorption studies of Toluidine Blue from aqueous solutions onto gypsum. Chem. Engineer. J. 2009, 150, 90–95. [Google Scholar] [CrossRef]
- Manna, S.; Das, P.; Roy, D. Dye-Containing Wastewater Treatment Using Treated Jute. In Waste Management and Resource Efficiency; Springer: Singapore, 2019; pp. 1263–1270. [Google Scholar]
- Zhao, F.; Sillanpää, M. Cross-linked chitosan and β-cyclodextrin as functional adsorbents in water treatment. In Advanced Water Treatment; Elsevier: Amsterdam, The Netherlands, 2020; pp. 161–264. [Google Scholar]
- Sieren, B.; Baker, J.; Wang, X.; Rozzoni, S.J.; Carlson, K.; McBain, A.; Kerstan, D.; Allen, L.; Liao, L.; Li, Z. Sorptive Removal of Color Dye Safranin O by Fibrous Clay Minerals and Zeolites. Adv. Mater. Sci. Engineer. 2020, 8845366. [Google Scholar]
- Wu, Q.; Carlson, K.; Cheng, Q.; Wang, X.; Li, Z. Interactions between Cationic Dye Toluidine Blue and Fibrous Clay Minerals. Crystals 2021, 11, 708. [Google Scholar] [CrossRef]
- Yazdani, M.; Mohammad Mahmoodi, N.; Arami, M.; Bahrami, H. Isotherm, kinetic, and thermodynamic of cationic dye removal from binary system by Feldspar. Separat. Sci. Technol. 2012, 47, 1660–1672. [Google Scholar] [CrossRef]
- Taha, D.N.; Samaka, I.A.S.; Mohammed, L.A. Adsorptive removal of dye from industrial effluents using natural Iraqi palygorskite clay as low-cost adsorbent. J. Asian Sci. Res. 2013, 3, 945–955. [Google Scholar]
- Patel, H.; Vashi, R.T. A study on removal of Toluidine blue dye from aqueous solution by adsorption onto Neem leaf powder. World Acad. Sci. Engineer. Technol. 2010, 70, 831–836. [Google Scholar]
- Rida, K.; Bouraoui, S.; Hadnine, S. Adsorption of methylene blue from aqueous solution by kaolin and zeolite. Appl. Clay Sci. 2013, 83, 99–105. [Google Scholar] [CrossRef]
- Fayazi, M.; Afzali, D.; Taher, M.A.; Mostafavi, A.; Gupta, V.K. Removal of Safranin dye from aqueous solution using magnetic mesoporous clay: Optimization study. J. Mol. Liq. 2015, 212, 675–685. [Google Scholar] [CrossRef]
- Liu, M.; Shi, G.; Zhang, L.; Zhao, G.; Jin, L. Electrode modified with toluidine blue-doped silica nanoparticles, and its use for enhanced amperometric sensing of hemoglobin. Anal. Bioanal. Chem. 2008, 391, 1951–1959. [Google Scholar] [CrossRef] [PubMed]
- Van Damme, H.; Crespan, M.; Cruz, M.I.; Fripiat, J.J. Adsorption of safranine by Na+, Ni2+ and Fe3+ montmorillonites. Clays Clay Miner. 1997, 25, 19–25. [Google Scholar] [CrossRef]
- Nasher, M.A.; Youssif, M.I.; El-Ghamaz, N.A.; Zeyada, H.M. Linear and nonlinear optical properties of irradiated Toluidine Blue thin films. Optik 2019, 178, 532–543. [Google Scholar] [CrossRef]
- D'Ilario, L.; Martinelli, A. Toluidine blue: Aggregation properties and structural aspects. Model. Simul. Mater. Sci. Engineer. 2006, 14, 581–589. [Google Scholar] [CrossRef]
- Usacheva, M.N.; Teichert, M.C.; Biel, M.A. The role of the methylene blue and toluidine blue monomers and dimers in the photoinactivation of bacteria. J. Photochem. Photobiol. B Biol. 2003, 71, 87–98. [Google Scholar] [CrossRef]
- EL-Mekkawi, D.M.; Ibrahim, F.A.; Selim, M.M. Removal of methylene blue from water using zeolites prepared from Egyptian kaolins collected from different sources. J. Environ. Chem. Engineer. 2016, 4, 1417–1422. [Google Scholar] [CrossRef]
- Gilani, A.G.; Dezhampanah, H.; Poormohammadi-Ahandani, Z. A comparative spectroscopic study of thiourea effect on the photophysical and molecular association behavior of various phenothiazine dyes. Spectrochim. Acta Part A Mol. Biomol. Spectrosc. 2017, 179, 132–143. [Google Scholar] [CrossRef]
- Antonov, L.; Gergov, G.; Petrov, V.; Kubista, M.; Nygren, J. UV–Vis spectroscopic and chemometric study on the aggregation of ionic dyes in water. Talanta 1999, 49, 99–106. [Google Scholar] [CrossRef]
- Matassa, R.; Sadun, C.; D'Ilario, L.; Martinelli, A.; Caminiti, R. Supramolecular organization of toluidine blue dye in solid amorphous phases. J. Phys. Chem. B 2007, 111, 1994–1999. [Google Scholar] [CrossRef]
Figure 1.
Molecular structure of TB (a) and its pH-speciation (b).

Figure 2.
Molecular structure of SO viewed from different directions (a) and its pH-speciation (b).

Figure 3.
Isotherm (a) and kinetic study of TB and SO sorption form single and binary solutions on ZEO. The lines are Langmuir (a) and pseudo-second order (b) fit to the experimental data.
Figure 3.
Isotherm (a) and kinetic study of TB and SO sorption form single and binary solutions on ZEO. The lines are Langmuir (a) and pseudo-second order (b) fit to the experimental data.

Figure 4.
Influence of equilibrium solution pH (a), ionic strength (b), and temperature (c) on dye sorption. See Figure 3 for symbol legends.
Figure 4.
Influence of equilibrium solution pH (a), ionic strength (b), and temperature (c) on dye sorption. See Figure 3 for symbol legends.

Figure 5.
XRD patterns of ZEO after sorption from binary (a) and single TB (b) solution of different initial concentrations. The insets are the XRD patterns of solid SO (a) and TB (b).
Figure 5.
XRD patterns of ZEO after sorption from binary (a) and single TB (b) solution of different initial concentrations. The insets are the XRD patterns of solid SO (a) and TB (b).

Figure 6.
FTIR spectra of ZEO after dye sorption from binary (a) and single TB (b) solutions of different initial concentrations and their enlargement (c,d) in the wave numbers of 700–1700 cm−1.
Figure 6.
FTIR spectra of ZEO after dye sorption from binary (a) and single TB (b) solutions of different initial concentrations and their enlargement (c,d) in the wave numbers of 700–1700 cm−1.

Figure 7.
Sorption of counterion Cl− from single and mixed dye solutions: (a), and amount of Cl− sorbed vs. dye sorbed (b).
Figure 7.
Sorption of counterion Cl− from single and mixed dye solutions: (a), and amount of Cl− sorbed vs. dye sorbed (b).

Figure 8.
Molecular dynamic simulation showing TB uptake (left) and TB + SO (right) on the {100} surface projected along crystallographic c (a) and a (b) directions of ZEO.
Figure 8.
Molecular dynamic simulation showing TB uptake (left) and TB + SO (right) on the {100} surface projected along crystallographic c (a) and a (b) directions of ZEO.

Figure 9.
Molecular dynamic simulation showing TB uptake (left) and TB + SO (right) on the {010} surface projected along crystallographic a (a) and a (b) directions of ZEO.
Figure 9.
Molecular dynamic simulation showing TB uptake (left) and TB + SO (right) on the {010} surface projected along crystallographic a (a) and a (b) directions of ZEO.

Figure 10.
Molecular dynamic simulation showing TB uptake (left) and TB + SO (right) on the {001} surface projected along crystallographic b (a) and c (b) directions of ZEO.
Figure 10.
Molecular dynamic simulation showing TB uptake (left) and TB + SO (right) on the {001} surface projected along crystallographic b (a) and c (b) directions of ZEO.


Table 1.
Parameters of Langmuir and kinetic fits of TB and SO sorption on ZEO from single and binary solutions.
Table 1.
Parameters of Langmuir and kinetic fits of TB and SO sorption on ZEO from single and binary solutions.
| Systems | TB from Binary Solution | SO from Binary Solution | Sum of TB + SO from Binary Solution | TB from Single Solution | SO from Single Solution ¶ |
|---|---|---|---|---|---|
| Sm (mmol/kg) | 63 ± 2 | 33 ± 2 | 96 ± 3 | 126 ± 2 | 79 ± 2 |
| KL (L/mmol) | 170 ± 4 | 122 ± 6 | 66 ± 2 | 333 ± 8 | 1808 ± 120 |
| qe (mmol/kg) | 48 ± 1 | 43 ± 1 | 90 ± 1 | 96 ± 1 | 76 ± 2 |
| kqe 2 (mmol/kg-h) | 164 ± 30 | 54 ± 14 | 181 ± 40 | 595 ± 80 | 213 ± 30 |
| k (kg/mmol-h) | 0.07 ± 0.01 | 0.03 ± 0.01 | 0.02 ± 0.005 | 0.1 ± 0.001 | 0.04 ± 0.01 |
¶ from [36].
Table 2.
Thermodynamic parameters of TB and SO sorption on ZEO from single and binary solutions.
| Minerals | ∆G° (kJ/mol) | ∆H° | ∆S° | |||
|---|---|---|---|---|---|---|
| 296 K | 306 K | 316 K | 326 K | (kJ/mol) | (kJ/mol-K) | |
| TB | −18 ± 15 | −20 ± 15 | −22 ± 15 | −24 ± 15 | 37 ± 7 | 0.19 ± 0.03 |
| SO | −12 ± 17 | −14 ± 17 | −16 ± 17 | −18 ± 17 | 37 ± 8 | 0.17 ± 0.04 |
| TB + SO | −14 ± 16 | −16 ± 16 | −18 ± 16 | −19 ± 16 | 36 ± 9 | 0.17 ± 0.03 |
| TB single | −24 ± 11 | −24 ± 11 | −24 ± 11 | −24 ± 11 | −19 ± 5 | 0.02 ± 0.02 |
| SO single ¶ | −15.7 ± 0.1 | −15.5 ± 0.1 | −15.3 ± 0.1 | −15.0 ± 0.2 | −22 ± 4 | −0.02 ± 0.01 |
¶ from [36].
Publisher’s Note: MDPI stays neutral with regard to jurisdictional claims in published maps and institutional affiliations. |
© 2021 by the authors. Licensee MDPI, Basel, Switzerland. This article is an open access article distributed under the terms and conditions of the Creative Commons Attribution (CC BY) license (https://creativecommons.org/licenses/by/4.0/).
Share and Cite
MDPI and ACS Style
Shi, Y.; Wang, X.; Wang, X.; Carlson, K.; Li, Z. Removal of Toluidine Blue and Safranin O from Single and Binary Solutions Using Zeolite. Crystals 2021, 11, 1181. https://doi.org/10.3390/cryst11101181
AMA Style
Shi Y, Wang X, Wang X, Carlson K, Li Z. Removal of Toluidine Blue and Safranin O from Single and Binary Solutions Using Zeolite. Crystals. 2021; 11(10):1181. https://doi.org/10.3390/cryst11101181
Chicago/Turabian StyleShi, Yan, Xisen Wang, Xin Wang, Kristen Carlson, and Zhaohui Li. 2021. "Removal of Toluidine Blue and Safranin O from Single and Binary Solutions Using Zeolite" Crystals 11, no. 10: 1181. https://doi.org/10.3390/cryst11101181
Note that from the first issue of 2016, this journal uses article numbers instead of page numbers. See further details here.