

On the Feasibility of Real-Time HRV Estimation Using Overly Noisy PPG Signals

1
Laboratory of Instrumentation, Biomedical Engineering and Radiation Physics (LIBPHYS), NOVA School of Science and Technology, NOVA University Lisbon, 2829-516 Caparica, Portugal
2
NMT, S.A., Parque Tecnológico de Cantanhede, Núcleo 04, Lote 3, 3060-197 Cantanhede, Portugal
3
UNINOVA CTS, NOVA School of Science and Technology, NOVA University Lisbon, 2829-516 Caparica, Portugal
*
Author to whom correspondence should be addressed.
Computers 2022, 11(12), 177; https://doi.org/10.3390/computers11120177
Submission received: 21 October 2022
/
Revised: 20 November 2022
/
Accepted: 2 December 2022
/
Published: 6 December 2022
(This article belongs to the Special Issue Computing, Electrical and Industrial Systems 2022)
Abstract
:Heart Rate Variability (HRV) is a biomarker that can be obtained non-invasively from the electrocardiogram (ECG) or the photoplethysmogram (PPG) fiducial points. However, the accuracy of HRV can be compromised by the presence of artifacts. In the herein presented work, a Simulink® model with a deep learning component was studied for overly noisy PPG signals. A subset with these noisy signals was selected for this study, with the purpose of testing a real-time machine learning based HRV estimation system in substandard artifact-ridden signals. Home-based and wearable HRV systems are prone to dealing with higher contaminated signals, given the less controlled environment where the acquisitions take place, namely daily activity movements. This was the motivation behind this work. The results for overly noisy signals show that the real-time PPG-based HRV estimation system produced RMSE and Pearson correlation coefficient mean and standard deviation of 0.178 ± 0.138 s and 0.401 ± 0.255, respectively. This RMSE value is roughly one order of magnitude above the closest comparative results for which the real-time system was also used.
1. Introduction
Cardiovascular diseases (CVD) are known as a leading cause of death worldwide and are a major public health issue [1]. Therefore, it is essential to adopt preventive strategies for the early detection of CVD. Heart Rate Variability (HRV) is a non-invasive CVD biomarker that evaluates the autonomic balance and has been used in the prediction of cardiovascular outcomes [2].
The HRV represents the time interval between successive heartbeats, which can be typically extracted from biomedical signals such as the electrocardiogram (ECG) or the photoplethysmogram (PPG) [3]. Time, frequency, and non-linear features can be obtained from the HRV, such as the Standard Deviation of Normal-Normal intervals (SDNN) and spectral properties. Reduced SDNN-derived HRV values have been linked to poor cardiac outcomes and are a mortality predictor, including for cardiovascular conditions [4,5]. The ECG is considered the gold standard regarding HRV extraction, although multiple studies show that the HRV can also be accurately determined from the PPG signal [6,7,8].
ECG R peaks or PPG systolic points can be used as the input for the computation of the HRV. The peak detection accuracy is thus a critical first step for HRV estimation. Erroneously detected or unaccounted peaks lead to errors in the inter-beat time intervals, which affects the features’ accuracy [9].
The HRV can be obtained in both clinical and laboratory settings from multi-lead ECG systems, which can be expensive and have limited practicality in terms of a possible home-based application [10]. For home-based and wearable systems, where simplicity and ease of use are general criteria, single-lead ECG or PPG signals have been pointed out as adequate solutions for HRV estimation [10]. There seems to be a lack of studies regarding HRV real-time systems performance for exceedingly noisy signals. It was herein considered that the closest comparative environment would be the ECG and PPG acquisition setups in wearable and home-based devices. In these conditions, acquisitions are typically performed during the subject’s normal life activities, which may include appreciable movement activity. The herein presented work explores the reliability of real-time systems in such conditions using a selected subset of noisy data.
These wearable devices can record biomedical signals and present some advantages over the typical clinical ECG acquisition setting, such as user mobility and fewer sensors [11,12]. The ECG chest strap and smartwatches with PPG sensors are examples of wearable devices that are widely available. Some studies have evaluated the accuracy of the wearable sensor regarding the HRV. Hinde et al. [10] evaluated twelve wearable devices to determine the reliability of HRV features in the military population. In this study, the Polar H10, an ECG-based system, was considered the most accurate device where a mean bias of 0.23 ± 26.8 milliseconds was obtained for R-R intervals compared to the three-lead ECG. It was also noted that most of the evaluated devices presented considerable signal artifacts and were only reliable during rest or low-intensity exercises [10]. Hernández-Vicente et al. [13] evaluated the Polar H7 sensor in rest and exercise settings against ECG signals. Data from sixty-seven subjects showed that, at rest, the two methods were similar with a concordance correlation coefficient above 0.90. However, during high-intensity exercise, the high-frequency band power measurements did not reach the concordance correlation coefficient of 0.90 for most of the subjects. Georgiou et al. [11] conducted a review of eighteen studies to determine if wearable devices could accurately measure HRV. It was concluded that, during rest, the correlation between gold standard ECG and wearable device data was excellent. However, the correlation decreased gradually as the exercise level increased. Despite the wearable systems’ advantages, such as being low-cost and user-friendly, motion artifacts are considered its main limitation [10].
The key to overcome this constraint may be through the application of deep learning networks in biomedical signal processing [14,15]. Kazemi et al. [16] present a neural network for PPG peak detection using a population of thirty-six subjects. Noisy PPG were implemented by adding synthetic noise, with random amplitudes, to real signals. An overall precision, recall, and F1-score of 82%, 80%, and 81% were obtained, respectively. Goh et al. [17] developed a convolutional neural network to detect motion artifacts. A testing accuracy of 94.9% was achieved.
Some studies have also evaluated different methodologies to reduce motion artifacts in the PPG. Wang et al. [18] proposed a method to reduce the motion artifacts on a commercial wristband signal (PPG), which was compared with an ECG. Different HRV parameters were evaluated based on data from nine subjects. The lowest and highest coefficient correlation values were 0.30 and 0.99, for the Low-Frequency/High-Frequency and mean RR, respectively. Firoozabadi et al. [19] developed an algorithm to estimate the HRV from a single-channel PPG signal, using the ECG as the gold standard. The lowest and highest mean difference values between HRV parameters from the ECG and PPG signals were −0.23 and 2.58 milliseconds for the standard deviation of the inter-beat intervals (SDNN) and standard deviation of the successive differences (SDSD), respectively. Salehizadeh et al. [20] investigated a technique to reconstruct motion-corrupted PPG signals to obtain a heart rate estimation. The PPG and accelerometer data were used, and the algorithm performance was evaluated using the mean absolute error. An overall error of 1.86 beats/min was obtained.
In this work, a machine learning based real-time system was tested in the Simulink® platform for exceedingly noisy PPG data. This noisy subset was selected amongst the original PPG dataset. These artifacts are mainly due to subject movements. Despite the machine learning system having been trained using a dataset that includes normal and noisy data, the question arises of how the system performs for conspicuous noisy data, as this may be the case in wearable and home-based systems.
2. Materials and Methods
2.1. Data acquisition and Pre-Processing
PPG and ECG data were simultaneously recorded by the MP35 BIOPAC® system, Goleta, CA, USA. The ECG signals were acquired using a three-electrode lead set (SS2L) attached to the right wrist (‘Positive’), right ankle (‘Ground’), and left ankle (‘Negative’). The PPG data was recorded from the index finger with a BIOPAC® photoplethysmography sensor model SS4LA. The signals’ sampling frequency was 2000 Hz. All volunteers signed an informed consent, and the working database was anonymized. A total of 47 volunteers participated in this study. The acquisition interval was 5 min, minimum. This research was approved by the Hospital da Senhora de Oliveira Ethics Commission with Reference Number 86/2019.
Data pre-processing steps included bandpass filtering, trimming, and detrending. The ECG and the PPG bandpass filters were set to 0.5 to 35 Hz [21,22] and 0.4 to 4 Hz, respectively [23,24,25,26,27]. Twenty subjects were selected within the original dataset. The signals for these subjects were found to have high levels of artifacts. A duration of twenty seconds was analyzed. The Hilbert Double Envelope Method (HDEM) was used for R peak detection, as this technique produced superior results compared to the classical R peak finders [6].
2.2. Deep Learning Model
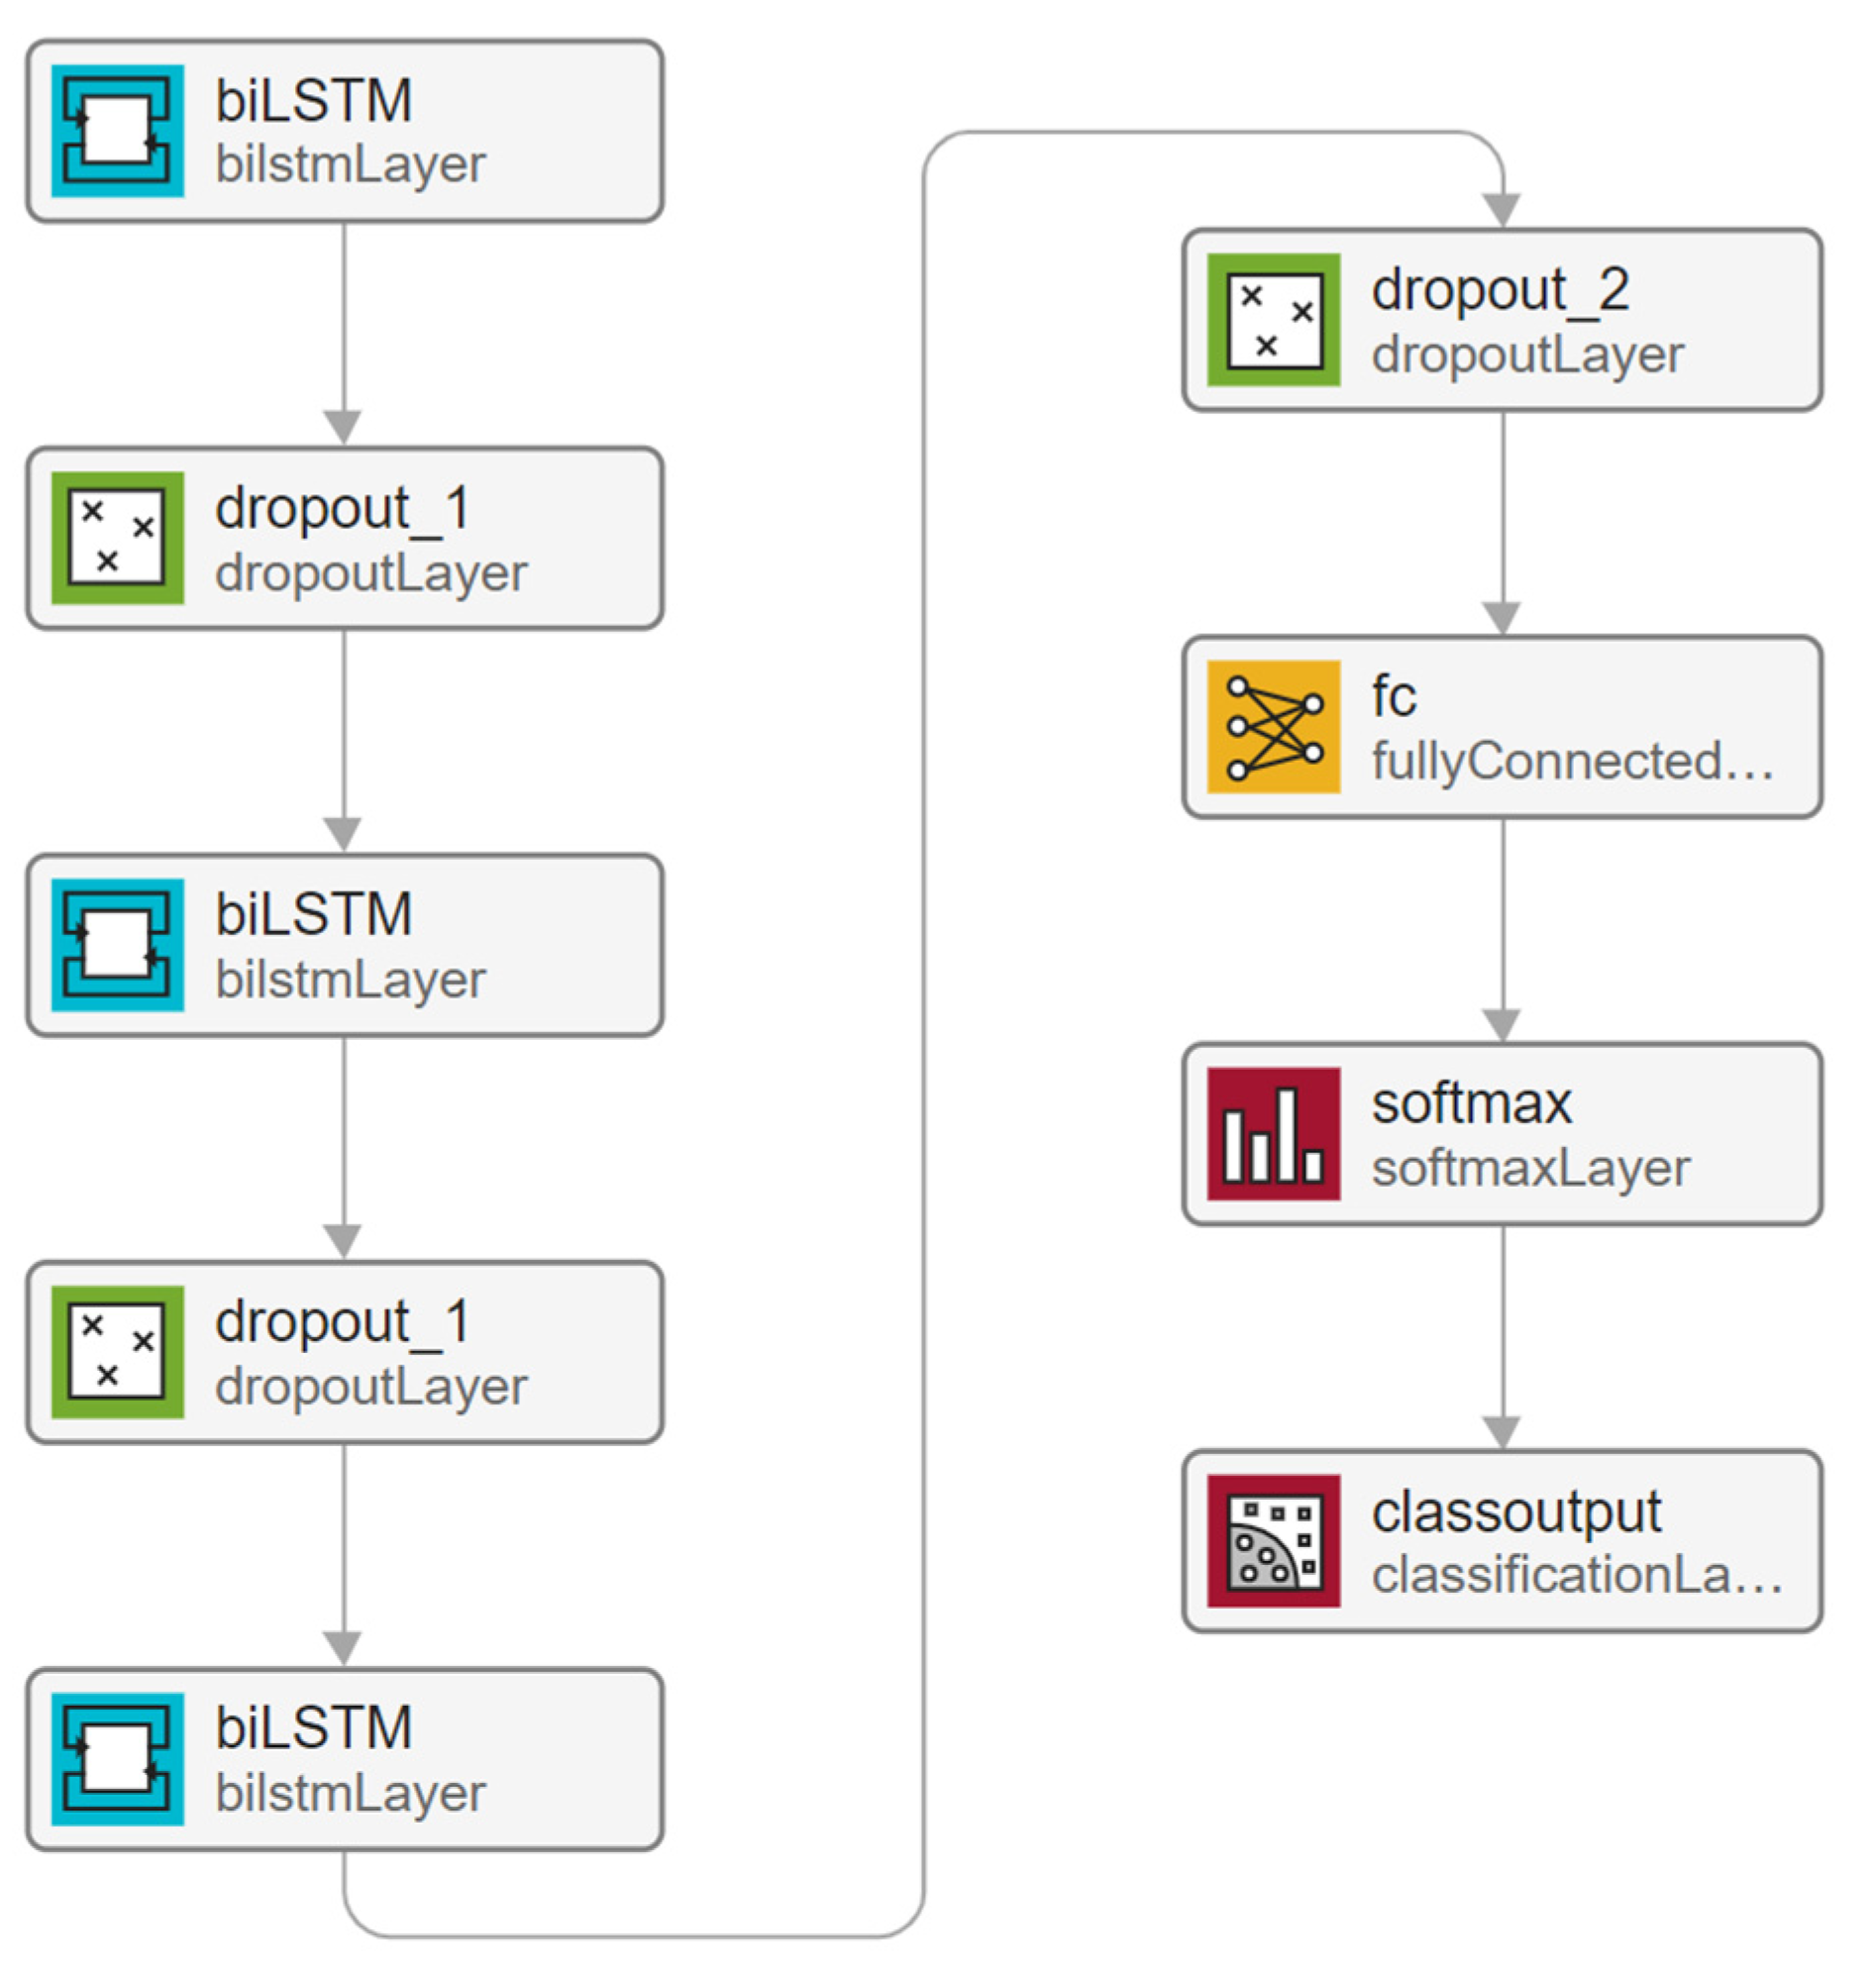
A previously developed deep learning model [24] was implemented in the Simulink® system. The best-performing model with a PPG signal input was selected. For this system, the accuracy, precision, and recall are 0.745, 0.757, and 0.965, respectively [24]. The model, represented in Figure 1, has three Bidirectional Long Short-Time Memory (BiLSTM) layers, each with 64, 128, and 64 neurons, respectively. Each BiLSTM layer was followed by a dropout layer with a 0.4 rate. The selected activation function was the tanh [24]. The goal of the developed network was to classify each PPG data point into two categories: noise or signal.
2.3. Simulink® System
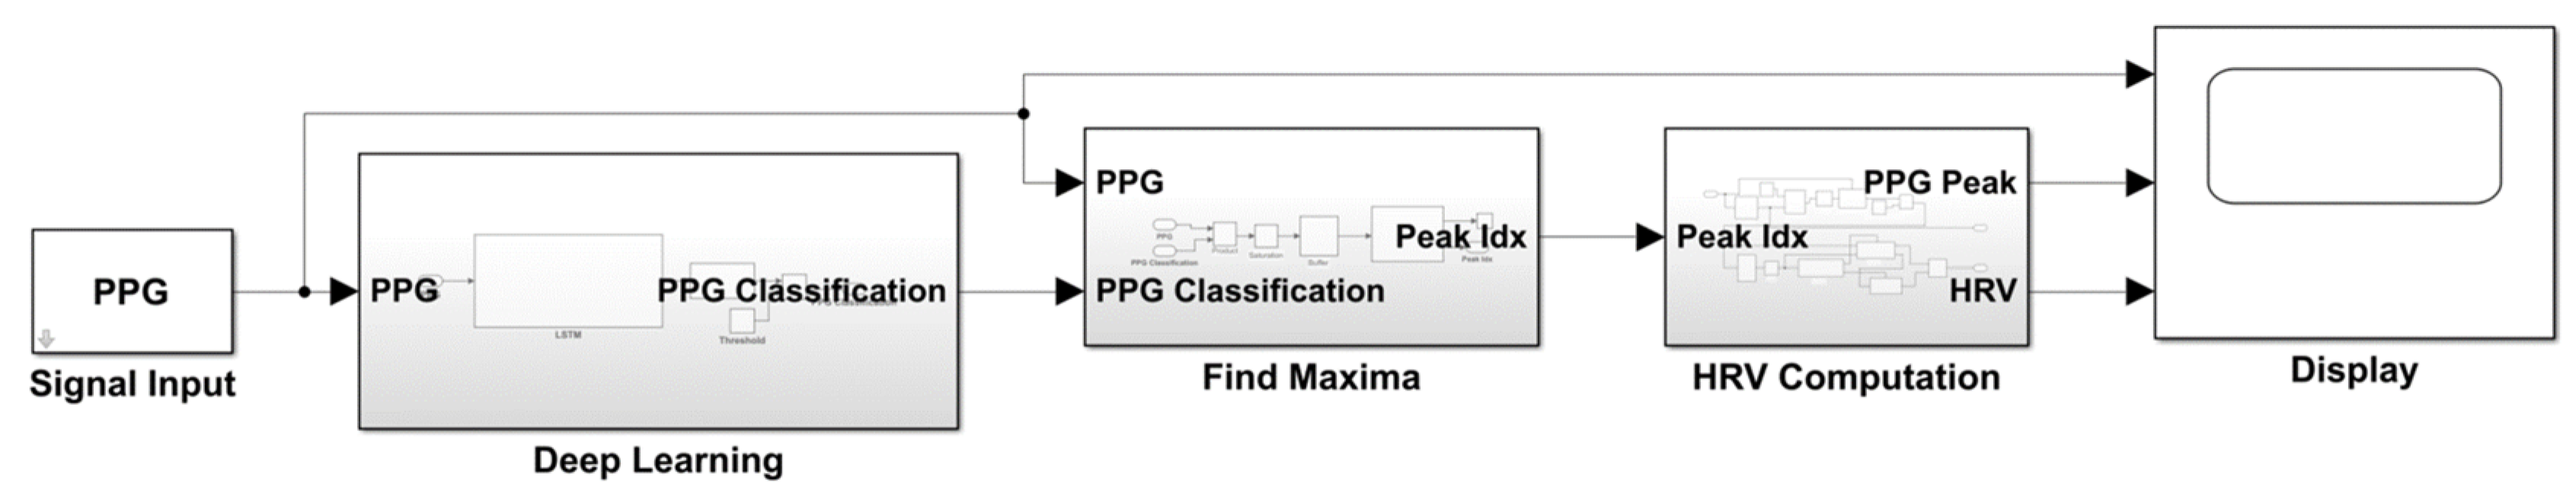
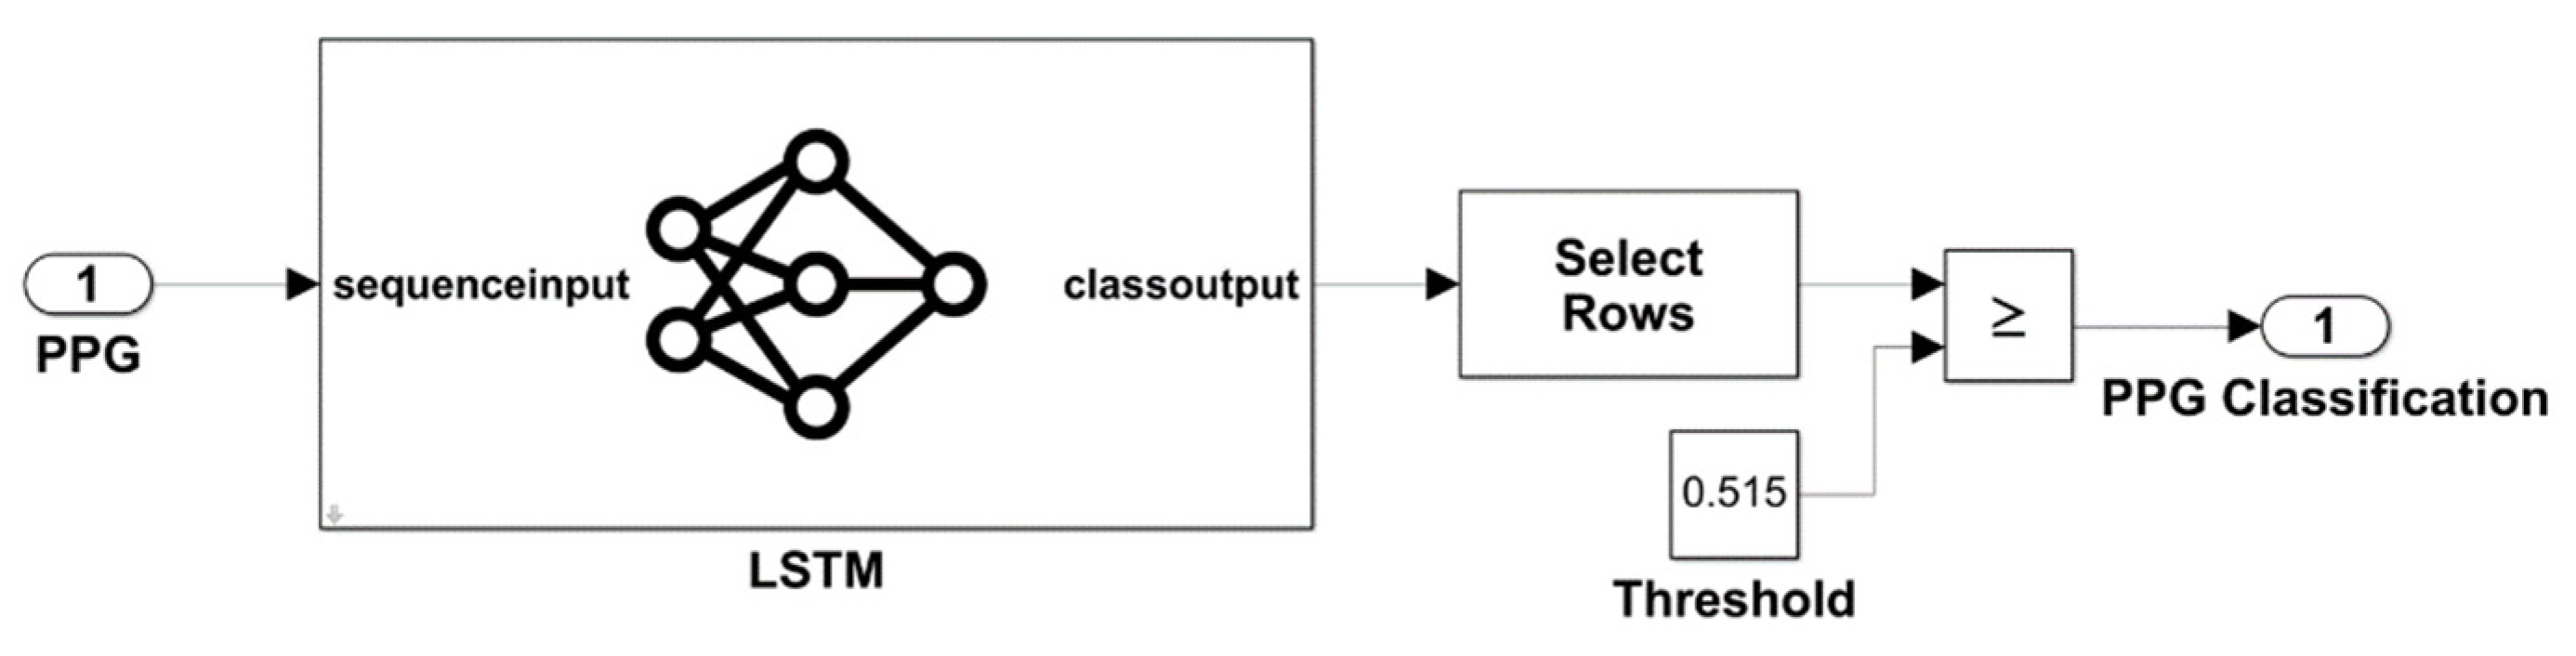
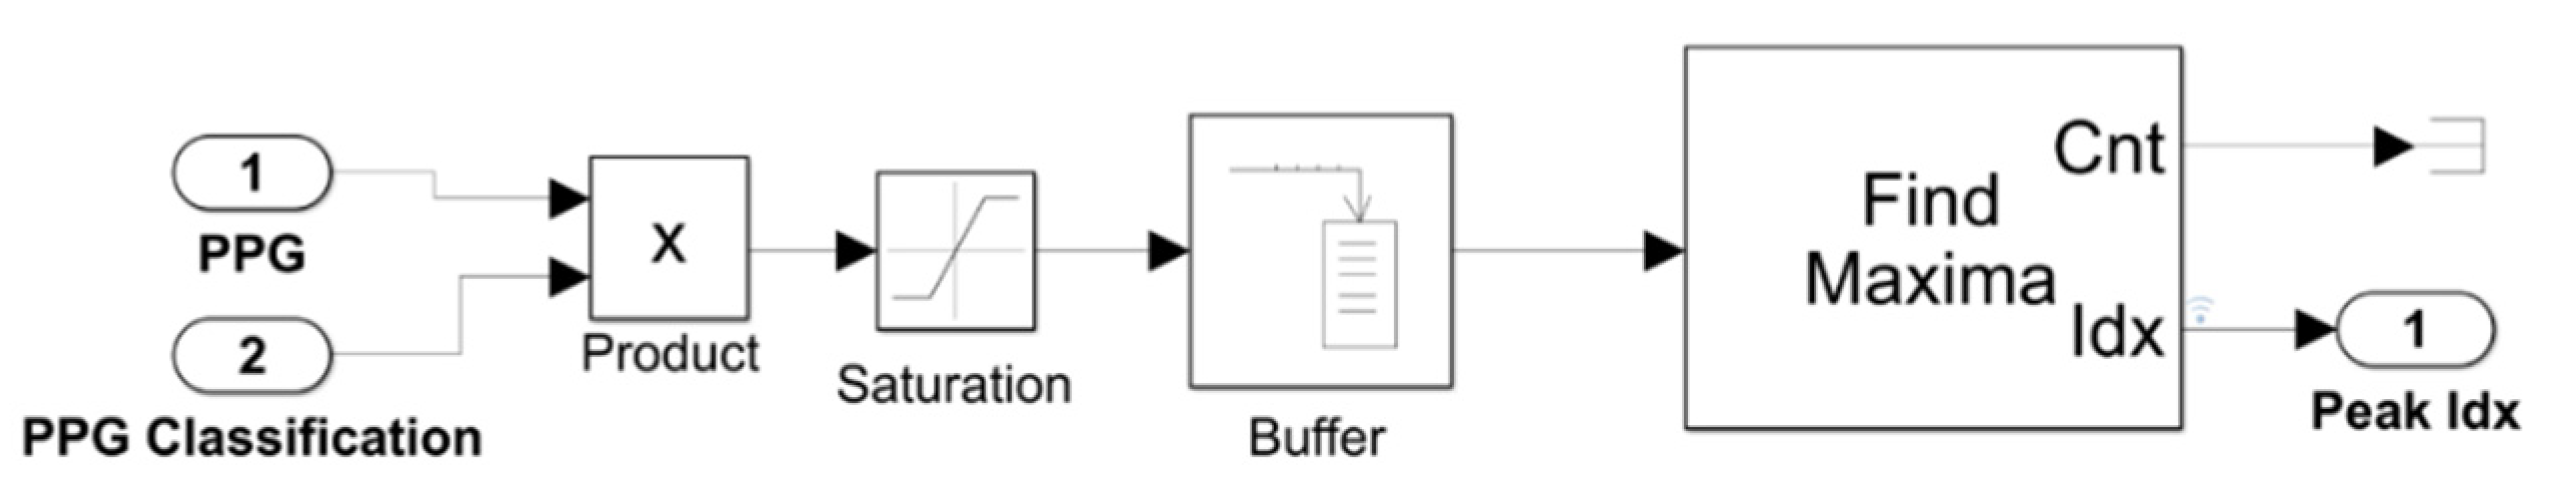
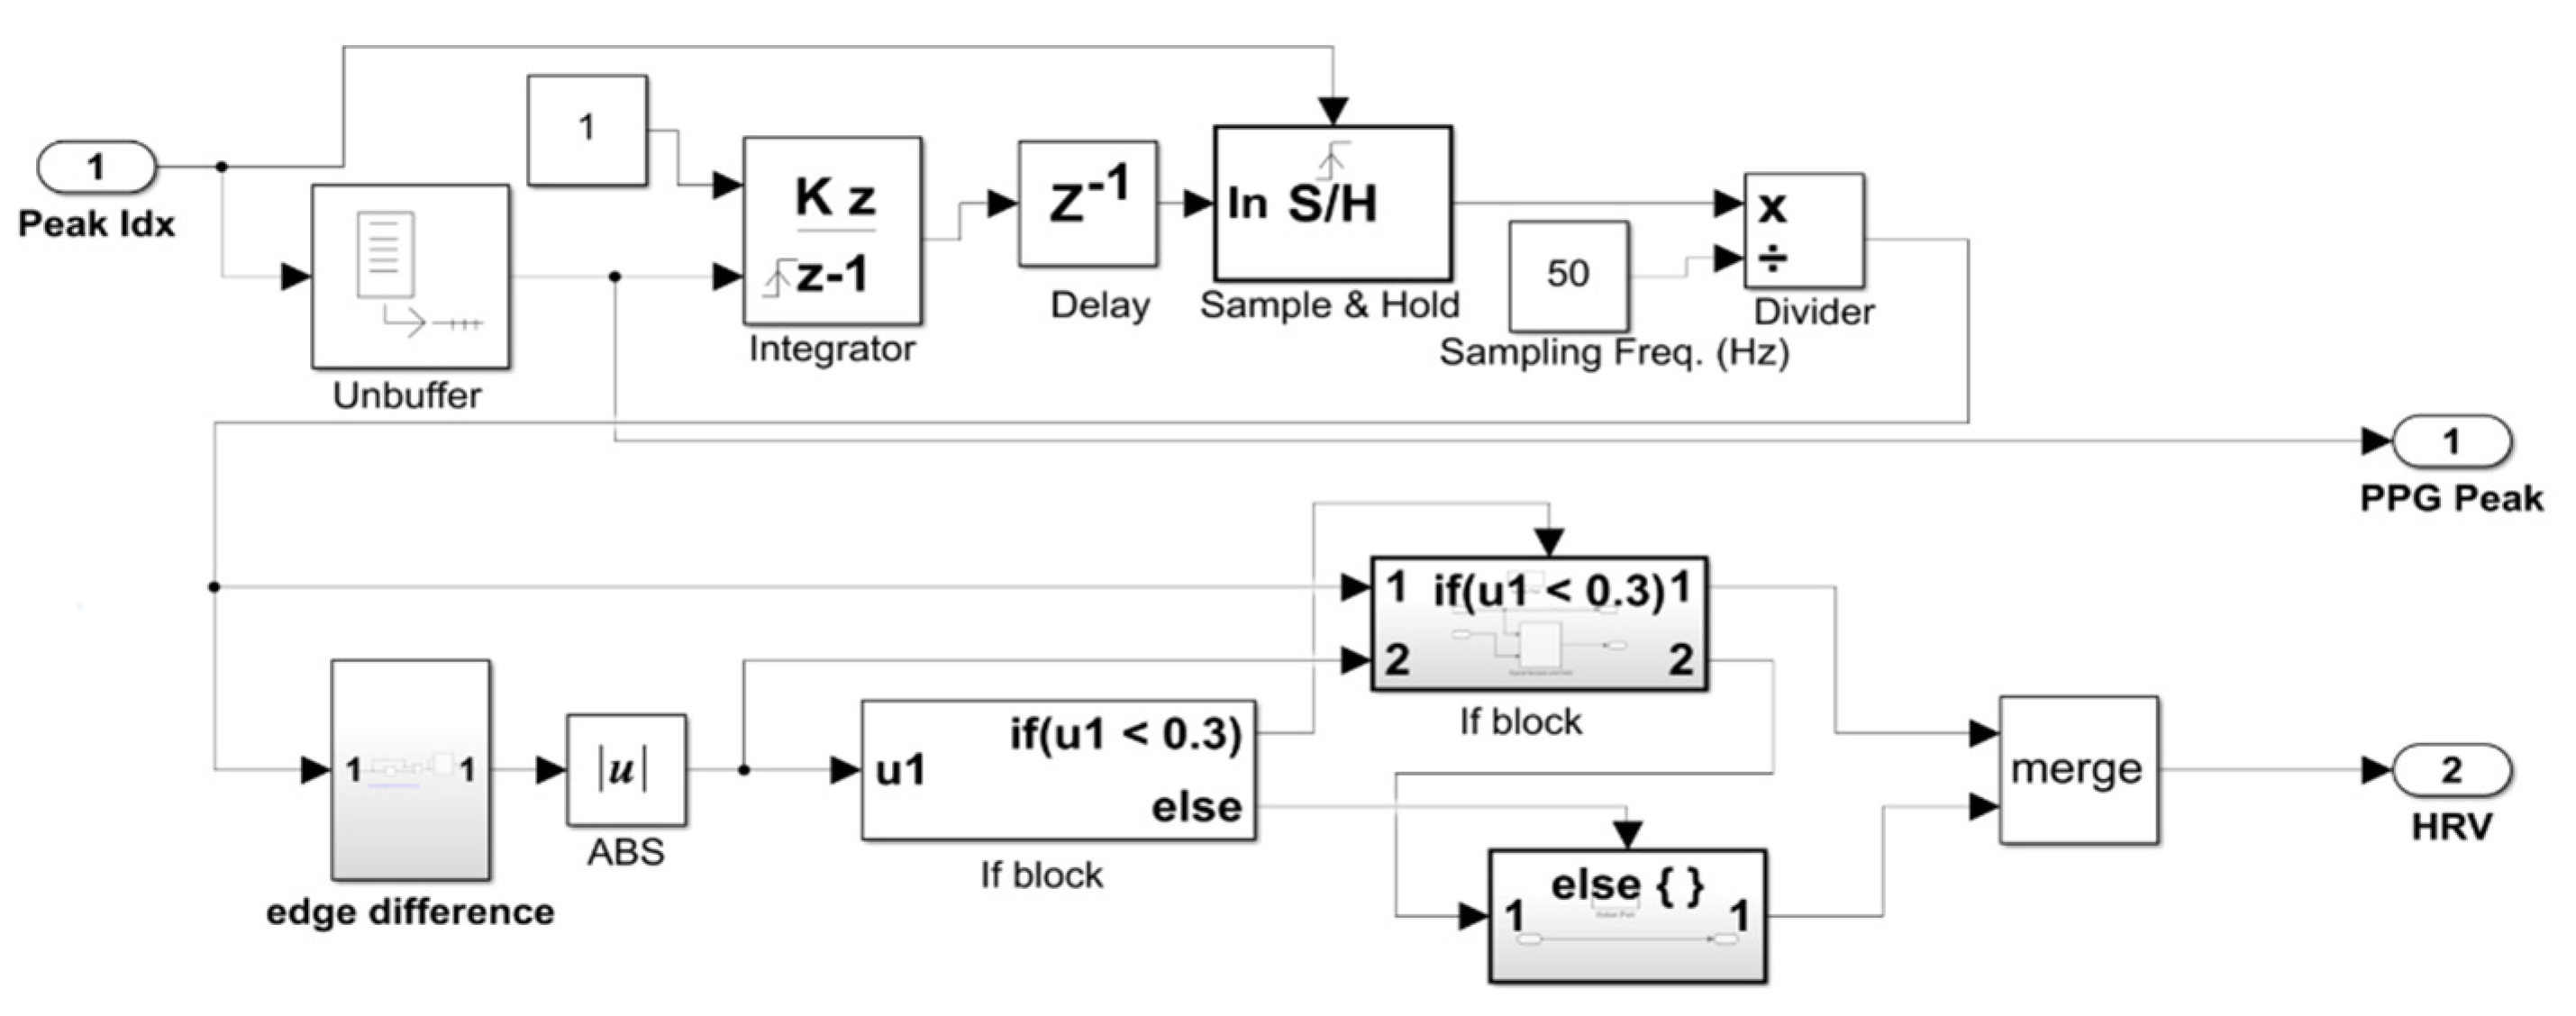
A real-time peak detection and HRV estimation system was developed in Simulink® [28]. PPG signals down sampled to a frequency of 50 Hz were used as the system input. Figure 2 represents an overview of the developed Simulink® model, which is comprised of three main blocks, being the first one the Deep Learning model to which the PPG signal is applied. The above-mentioned Deep Learning model was implemented and tested in the authors’ previous work [24], where the system is detailed and explained. An overview of the model development and implementation was previously mentioned in Section 2.2 and is represented in Figure 3. Figure 4 represents the find maxima operation aimed at pinpointing the peaks of the PPG classified as a signal. The inputs are the PPG and its classification points, according to the deep learning process. Figure 5 depicts the Simulink® implementation of the HRV calculation. It comprehends two main steps, being the first one the frontend HRV determination blocks that include an integrator followed by a time-delay and a sample-and-hold [29]. The second step is a discriminant criterium that works as an outlier removal to correct situations where the PPG interval is beyond normal values [24,28].
2.4. HRV Evaluation
To evaluate the robustness of the Simulink® system relatively to noisy inputs, a comparison of HRV vectors was performed. Due to the noise present in the PPG, the simultaneously recorded ECG signal was used to establish the HRV ground truth. The ECG peak detection was performed with the HDEM algorithm [6]. The detected R-peaks were subsequently expert validated through visual inspection and the ground truth HRV vector was thus obtained. This HRV ground truth was then compared to the HRV extracted from the Simulink® model, using the PPG signals with noise as the system input. To compare the performance of the system, the Root Mean Square Error (RMSE) and Pearson Correlation Coefficient were used as evaluation metrics.
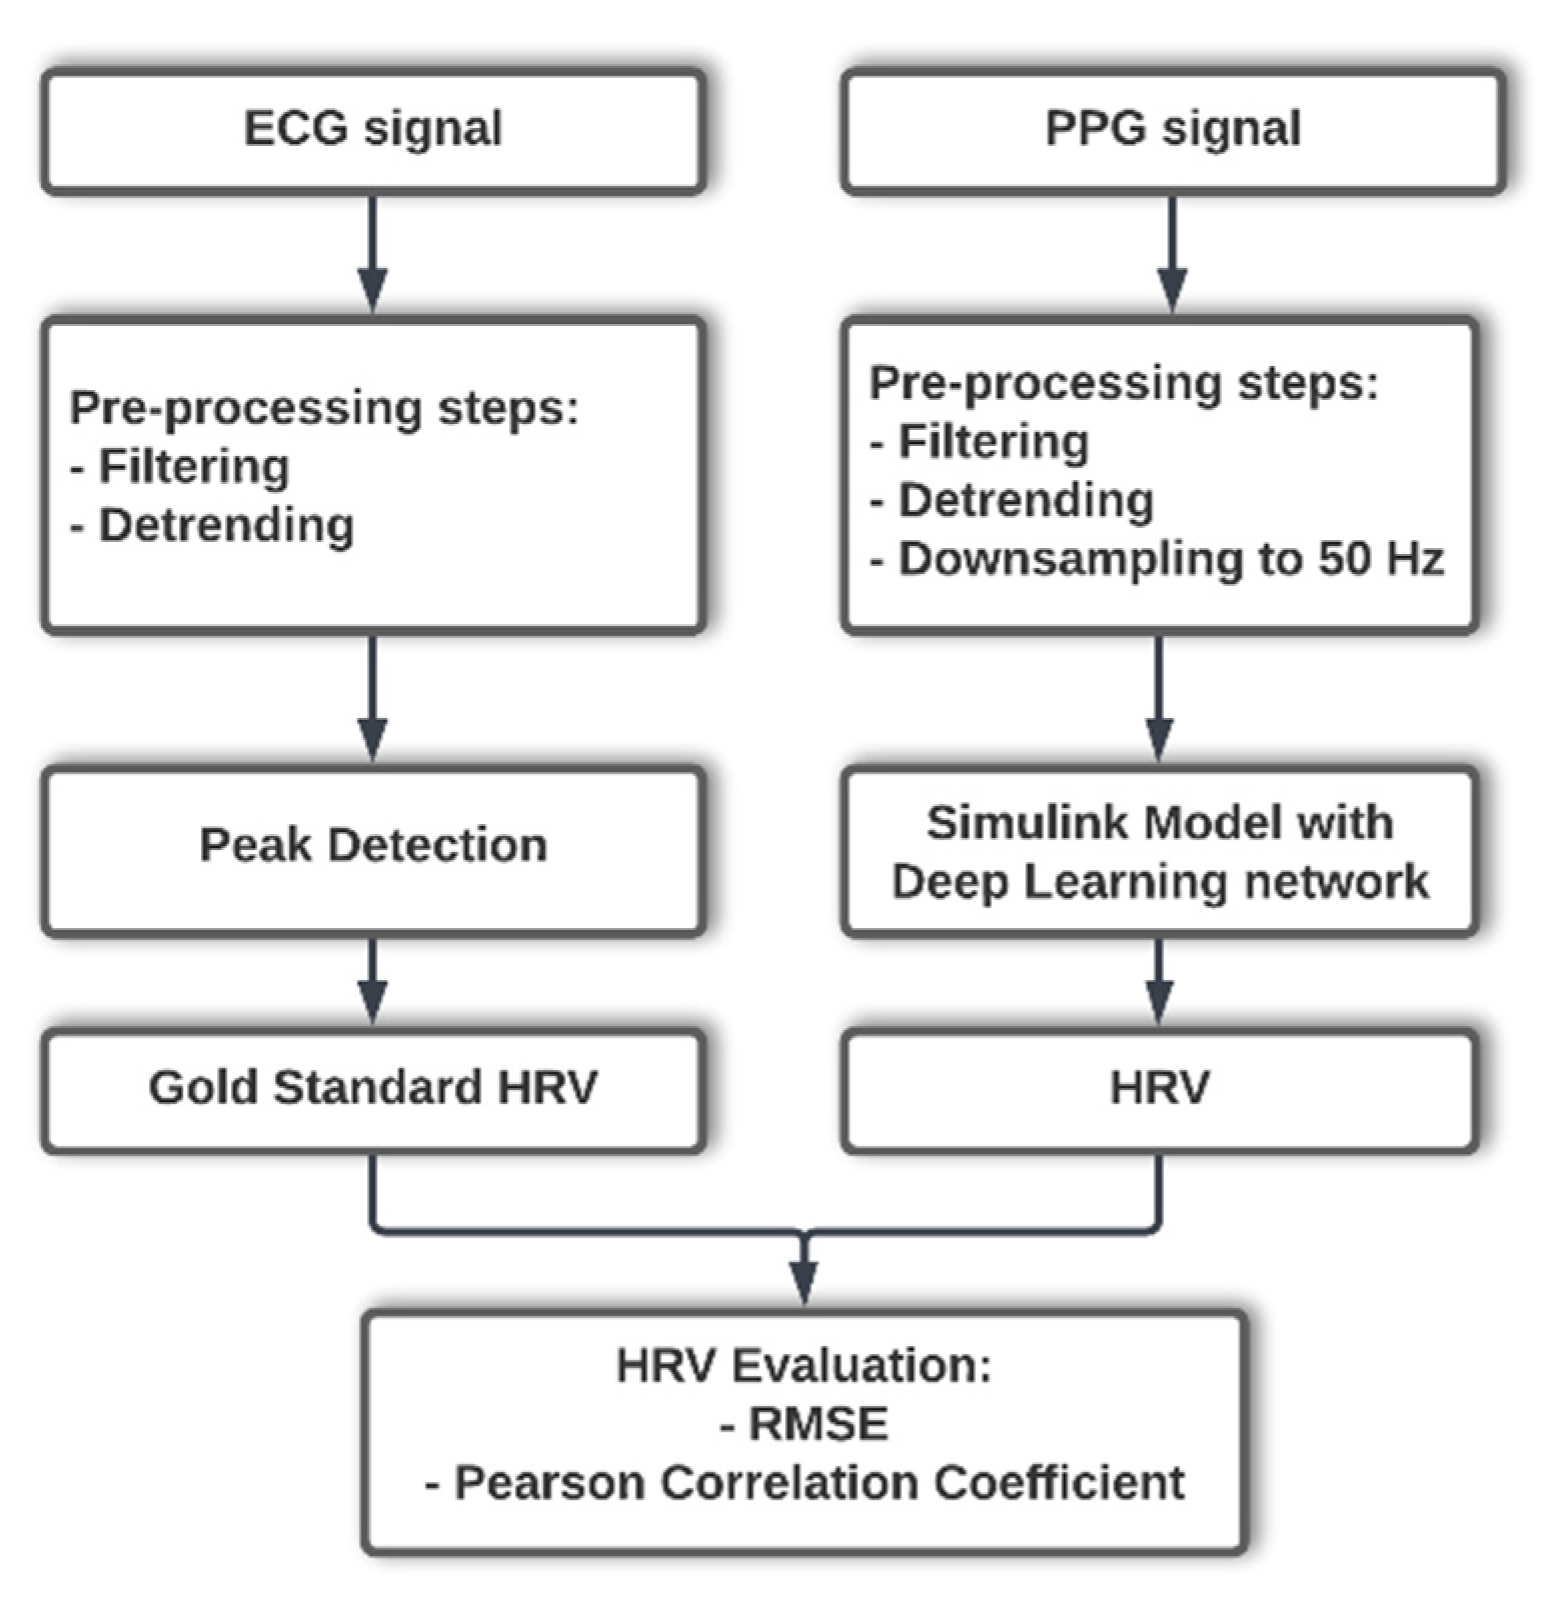
Figure 6 represents a summary of the implemented methodology. All data were analyzed with MATLAB® 2022a version, MathWorks, Inc., Natick, MA, USA.
3. Results
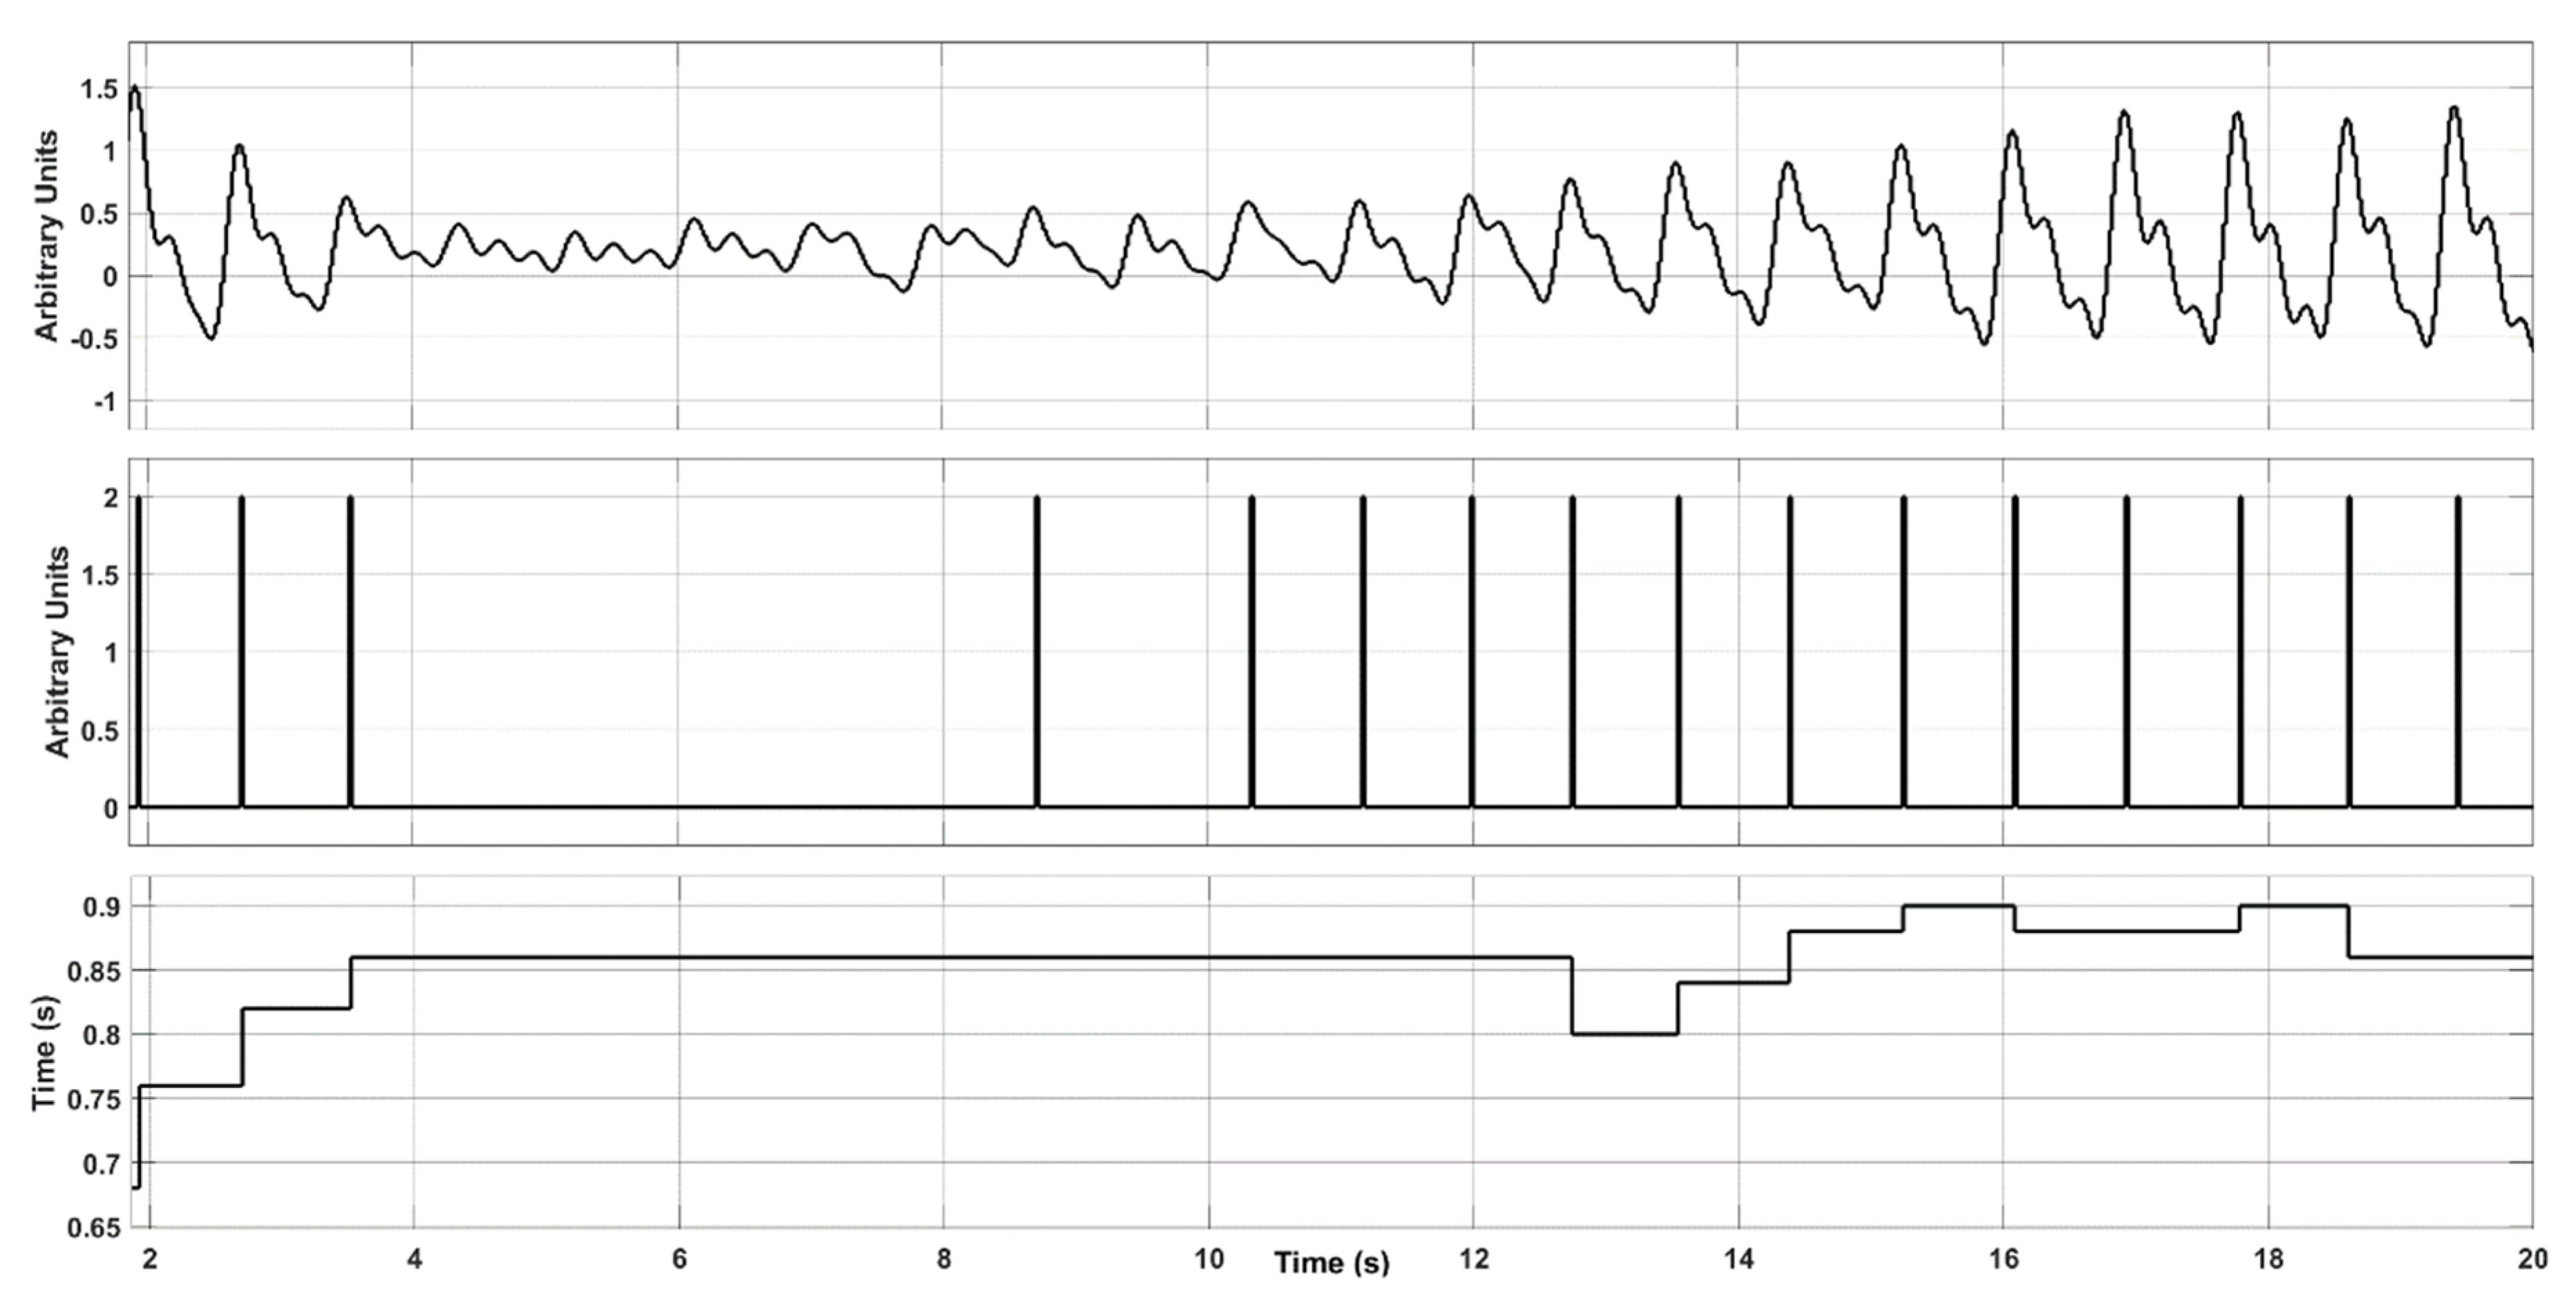
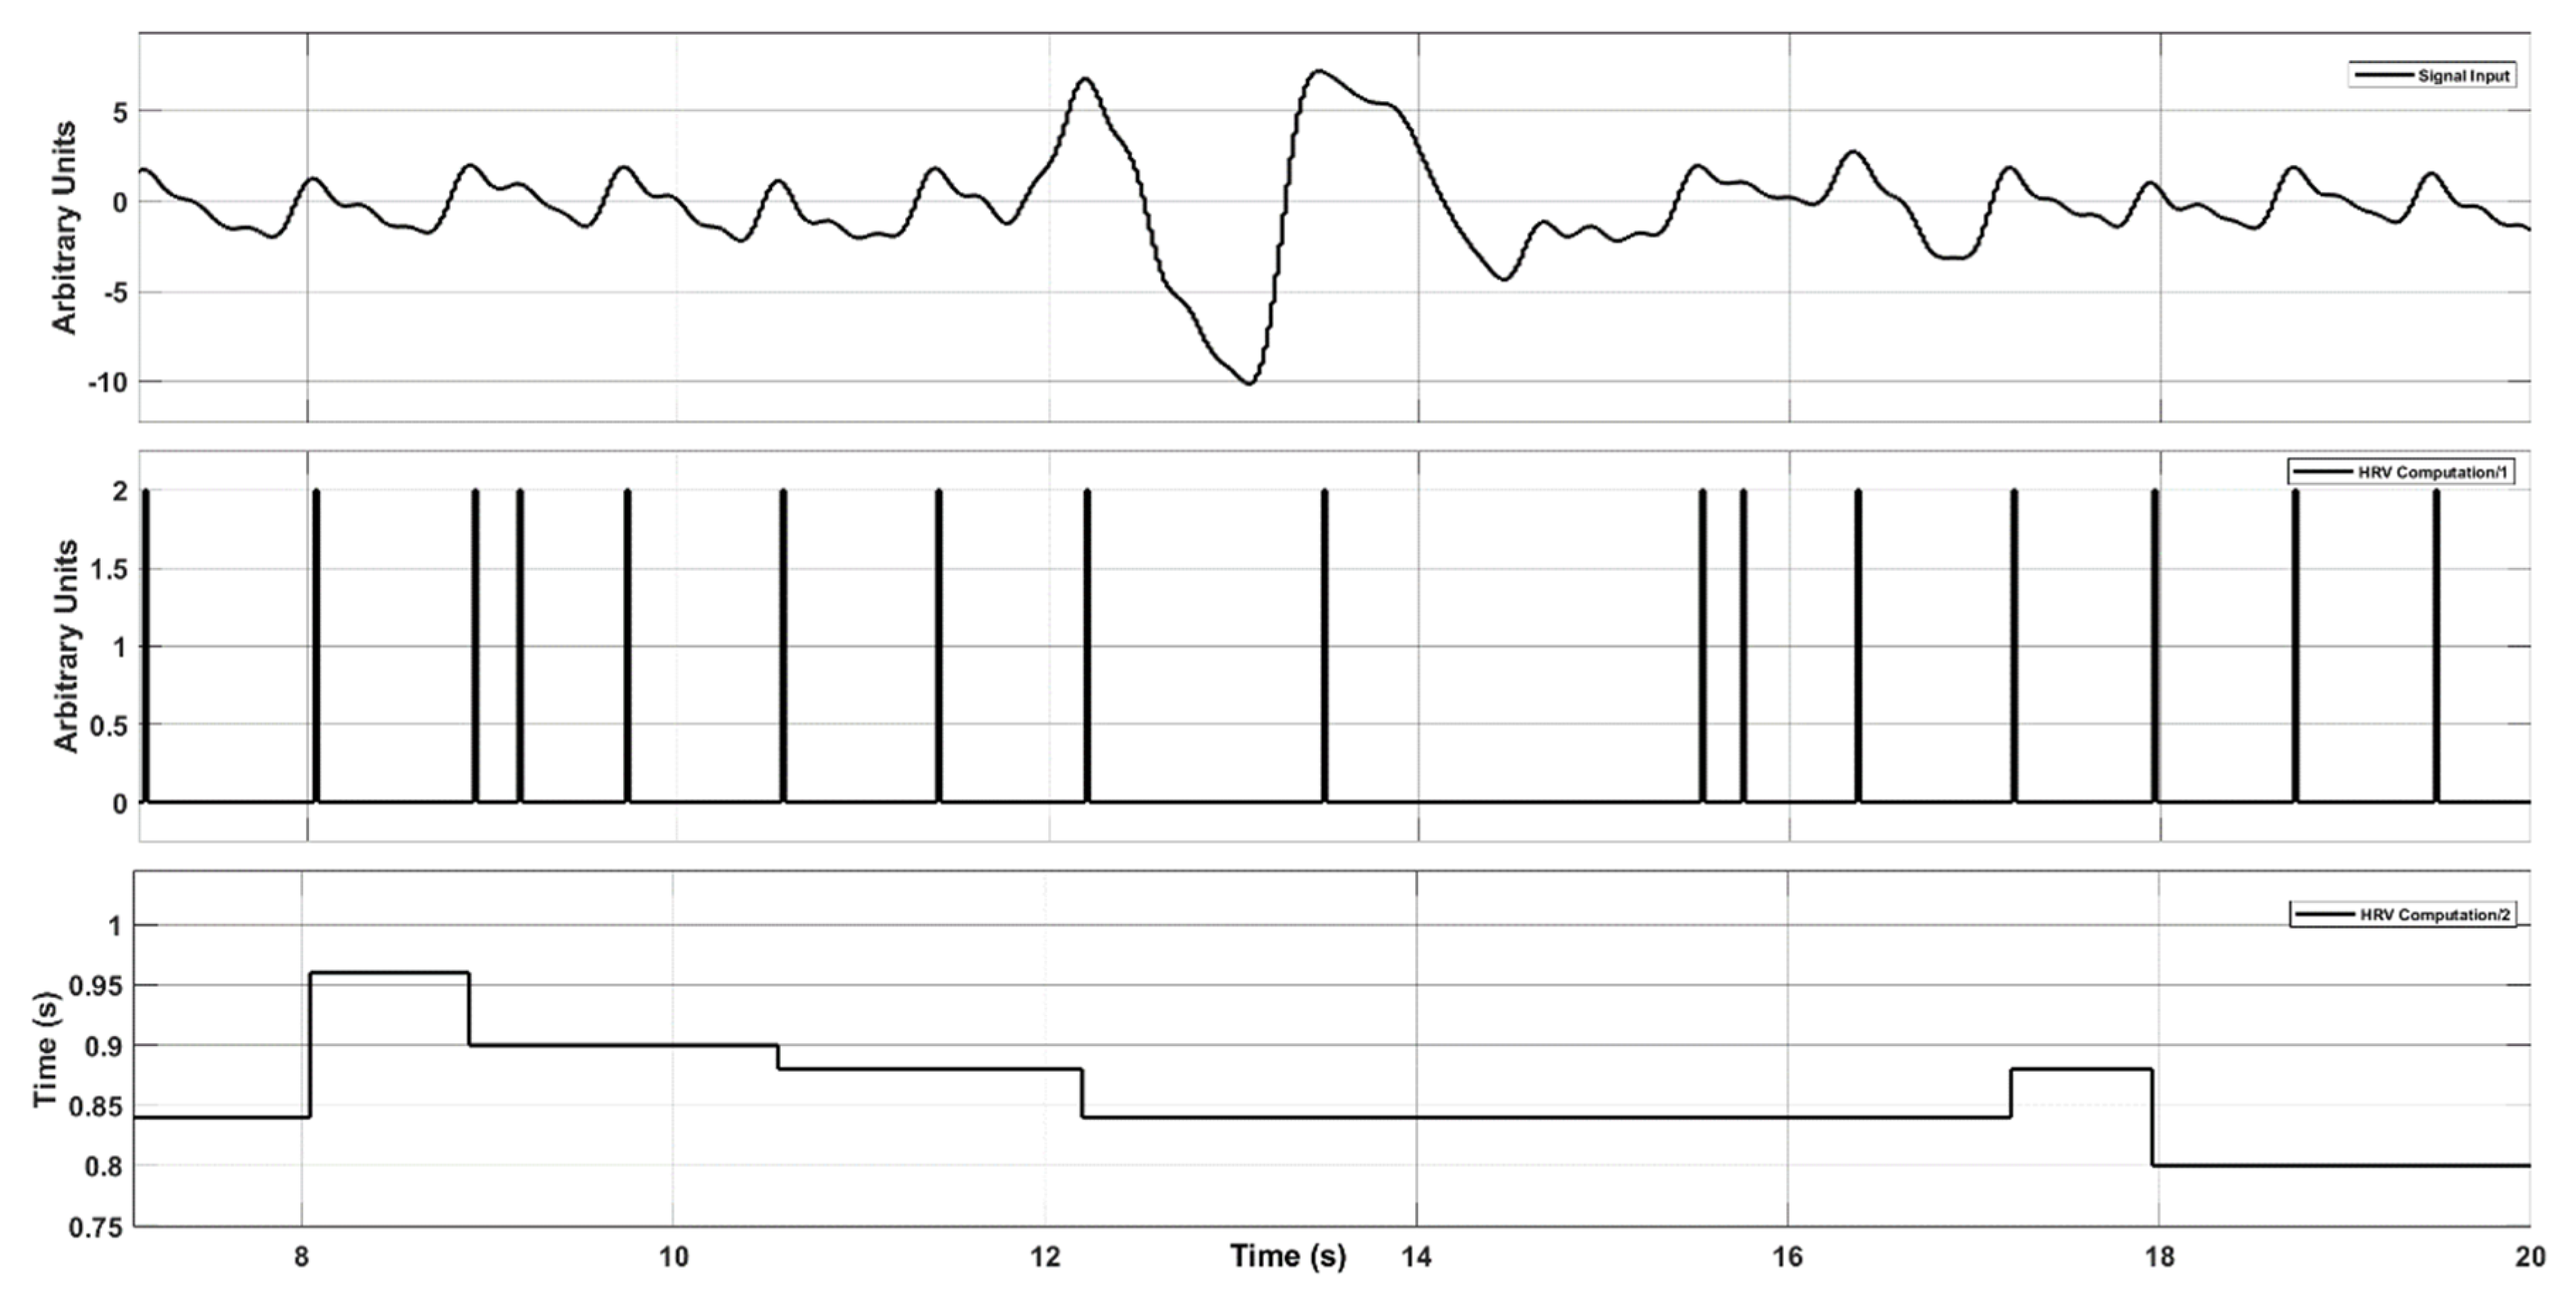
Figure 7 and Figure 8 show the output of the developed system for a 20-s PPG input with significant noise artifacts. In both figures, the second plot shows the PPG peak location determined by the implemented system. The third plot presents the real-time HRV estimation, obtained from the time interval between successive peaks.
In both cases, it is patent that HRV estimation is substantially negatively affected by the noise level of the PPG signals. This situation is purposely present in the selected PPG recordings. The third plot of each figure outlines the implemented system replacing the HRV outliers, resulting from the misplacement of the PPG peaks by values compatible with the normal HRV range, using the methodology represented in Figure 5 regarding the outlier removal procedure.
Table 1 shows the RMSE and Pearson Correlation Coefficient results of the comparison between ground truth HRV and its real-time estimation. The RMSE and correlation coefficient mean (and standard deviation) are 0.178 ± 0.138 and 0.401 ± 0.255, respectively.
4. Discussion and Conclusions
In this work, an evaluation of a real-time HRV computation system based on Simulink® was performed using noisy PPG signals. The ground truth was obtained via the simultaneously acquired ECG signals. For the ECG, the R peaks were obtained using the HDEM algorithm that has been proven to outperform the popular detectors. From these R peaks, the ground truth HRV was obtained. Studies of this nature are important, bearing in mind that there is an increasing demand for wearable and home-based systems for cardiac function evaluation. These systems are prone to produce PPG signals with higher levels of noise given the lenient acquisition protocols outside of the clinical and laboratory environments, mainly home-based.
Table 1 shows the obtained results. The mean and standard deviation are 0.178 ± 0.138 and 0.401 ± 0.255 for the RMSE and correlation coefficient, respectively. These values represent the comparison between the ground truth HRV and the PPG.
A direct comparison with the results mentioned in the literature survey is only possible regarding the work of Wang et al. [18], since the used metrics include the correlation between the ECG and PPG obtained HRV parameters, and noisy signals are used. However, in the work of Wang et al., the data was offline processed using the RR intervals. Additionally, unlike in the herein presented work where the ECG and the real-time PPG HRVs were directly compared, in the Wang et al. work, the comparison was focused on certain derived parameters. Despite the potential bias, Wang et al. generic results depict a correlation factor ranging from 0.30 to 0.99, depending on the studied parameter. It should, however, be emphasized that the validation of this comparative attempt can be heavily compromised, given that the relative PPG noise levels of both studies are not known.
It has been herein demonstrated that the developed real-time machine learning based HRV estimation system, based on the PPG, can handle exceedingly noisy systems with moderate results. The system seems to be able to stand minimally in overly noisy situations which typically represent limited subsets of all cases. To the best of the authors’ knowledge, the only real-time comparative work [28] where PPG signals have lower noise contamination reports a RMSE mean of 0.043 ± 0.017 s, which is roughly one order of magnitude lower than the corresponding presented results.
Nowadays, wearable devices with incorporated PPG sensors are widely available. Smartwatches are an example of these devices which can be used to record biomedical signals, increasing the need for robust real-time algorithms that can compute different features. It is expected that real-time deep learning implementations will be further investigated as systems with the potential to have increased robustness and accuracy in wearable and home-based devices.
Author Contributions
Conceptualization, F.E., V.V., A.B. and M.O.; methodology, F.E., V.V., A.B. and M.O.; software, F.E. and A.B.; validation, F.E., V.V., A.B. and M.O.; formal analysis, F.E., V.V., A.B. and M.O.; investigation, F.E., V.V., A.B. and M.O.; resources, V.V., A.B.; data curation, F.E. and A.B.; writing—original draft preparation, F.E., V.V., A.B. and M.O.; writing—review and editing, F.E., V.V., A.B. and M.O.; visualization, F.E., V.V., A.B. and M.O.; supervision, V.V. and A.B.; project administration, V.V. and A.B.; funding acquisition, V.V. and A.B. All authors have read and agreed to the published version of the manuscript.
Funding
This work was funded by the Fundação para a Ciência e Tecnologia (FCT, Portugal) and NMT, S.A in the scope of the PhD grant PD/BDE/150312/2019 and by FCT within the scope of the CTS Research Unit—Center of Technology and Systems—UNINOVA, under the project UIDB/00066/2020 (FCT).
Informed Consent Statement
Informed consent was obtained from all subjects involved in the study.
Data Availability Statement
Data is contained within the article.
Conflicts of Interest
The authors declare no conflict of interest.
References
- Ahmad, F.B.; Anderson, R.N. The Leading Causes of Death in the US for 2020. JAMA 2021, 325, 1829. [Google Scholar] [CrossRef]
- Singh, N.; Moneghetti, K.J.; Christle, J.W.; Hadley, D.; Plews, D.; Froelicher, V. Heart Rate Variability: An Old Metric with New Meaning in the Era of using mHealth Technologies for Health and Exercise Training Guidance. Part One: Physiology and Methods. Arrhythmia Electrophysiol. Rev. 2018, 7, 193. [Google Scholar] [CrossRef] [PubMed] [Green Version]
- Malik, M.; Camm, A.J.; Bigger, J.T.; Breithardt, G.; Cerutti, S.; Cohen, R.J.; Coumel, P.; Fallen, E.L.; Kennedy, H.L.; Kleiger, R.E.; et al. Heart rate variability Standards of measurement, physiological interpretation, and clinical use. Eur. Heart J. 1996, 17, 354–381. [Google Scholar] [CrossRef] [Green Version]
- Buccelletti, E.; Gilardi, E.; Scaini, E.; Galiuto, L.; Persiani, R.; Biondi, A.; Basile, F.; Silveri, N.G. Heart rate variability and myocardial infarction: Systematic literature review and metanalysis. Eur. Rev. Med. Pharmacol. Sci. 2009, 13, 299–307. [Google Scholar] [PubMed]
- Kleiger, R.E.; Miller, J.P.; Bigger, J.T.; Moss, A.J. Decreased heart rate variability and its association with increased mortality after acute myocardial infarction. Am. J. Cardiol. 1987, 59, 256–262. [Google Scholar] [CrossRef] [PubMed]
- Esgalhado, F.; Batista, A.; Vassilenko, V.; Russo, S.; Ortigueira, M. Peak Detection and HRV Feature Evaluation on ECG and PPG Signals. Symmetry 2022, 14, 1139. [Google Scholar] [CrossRef]
- Selvaraj, N.; Jaryal, A.; Santhosh, J.; Deepak, K.K.; Anand, S. Assessment of heart rate variability derived from finger-tip photoplethysmography as compared to electrocardiography. J. Med. Eng. Technol. 2008, 32, 479–484. [Google Scholar] [CrossRef]
- Lu, S.; Zhao, H.; Ju, K.; Shin, K.; Lee, M.; Shelley, K.; Chon, K.H. Can Photoplethysmography Variability Serve as an Alternative Approach to Obtain Heart Rate Variability Information? J. Clin. Monit. Comput. 2008, 22, 23–29. [Google Scholar] [CrossRef]
- Sheridan, D.C.; Dehart, R.; Lin, A.; Sabbaj, M.; Baker, S.D. Heart Rate Variability Analysis: How Much Artifact Can We Remove? Psychiatry Investig. 2020, 17, 960–965. [Google Scholar] [CrossRef]
- Hinde, K.; White, G.; Armstrong, N. Wearable Devices Suitable for Monitoring Twenty Four Hour Heart Rate Variability in Military Populations. Sensors 2021, 21, 1061. [Google Scholar] [CrossRef]
- Georgiou, K.; Larentzakis, A.V.; Khamis, N.N.; Alsuhaibani, G.I.; Alaska, Y.A.; Giallafos, E.J. Can Wearable Devices Accurately Measure Heart Rate Variability? A Systematic Review. Folia Med. 2018, 60, 7–20. [Google Scholar] [CrossRef] [Green Version]
- Jaafar, R.; Xian, O.C. Computational Science and Technology; Alfred, R., Iida, H., Haviluddin, H., Anthony, P., Eds.; Lecture Notes in Electrical Engineering; Springer: Singapore, 2021; Volume 724, ISBN 978-981-33-4068-8. [Google Scholar]
- Hernández-Vicente, A.; Hernando, D.; Marín-Puyalto, J.; Vicente-Rodríguez, G.; Garatachea, N.; Pueyo, E.; Bailón, R. Validity of the Polar H7 Heart Rate Sensor for Heart Rate Variability Analysis during Exercise in Different Age, Body Composition and Fitness Level Groups. Sensors 2021, 21, 902. [Google Scholar] [CrossRef] [PubMed]
- Jiang, W.; Liu, S.; Zhang, H.; Sun, X.; Wang, S.-H.; Zhao, J.; Yan, J. CNNG: A Convolutional Neural Networks With Gated Recurrent Units for Autism Spectrum Disorder Classification. Front. Aging Neurosci. 2022, 14, 948704. [Google Scholar] [CrossRef] [PubMed]
- Liu, S.; Zhao, L.; Zhao, J.; Li, B.; Wang, S.-H. Attention deficit/hyperactivity disorder Classification based on deep spatio-temporal features of functional Magnetic Resonance Imaging. Biomed. Signal Process. Control 2022, 71, 103239. [Google Scholar] [CrossRef]
- Kazemi, K.; Laitala, J.; Azimi, I.; Liljeberg, P.; Rahmani, A.M. Robust PPG Peak Detection Using Dilated Convolutional Neural Networks. Sensors 2022, 22, 6054. [Google Scholar] [CrossRef] [PubMed]
- Goh, C.-H.; Tan, L.K.; Lovell, N.H.; Ng, S.-C.; Tan, M.P.; Lim, E. Robust PPG motion artifact detection using a 1-D convolution neural network. Comput. Methods Programs Biomed. 2020, 196, 105596. [Google Scholar] [CrossRef] [PubMed]
- Wang, H.; Jimison, H.; Pavel, M. Reducing Motion Artifacts of Pulse Intervals from Photoplethysmogram of a Commercial Wristband for Heart Rate Variability Analysis. In Proceedings of the 2021 43rd Annual International Conference of the IEEE Engineering in Medicine & Biology Society (EMBC), Guadalajara, Mexico, 26–30 July 2021; IEEE: Piscataway, NJ, USA, 2021; pp. 47–51. [Google Scholar]
- Firoozabadi, R.; Helfenbein, E.D.; Babaeizadeh, S. Efficient noise-tolerant estimation of heart rate variability using single-channel photoplethysmography. J. Electrocardiol. 2017, 50, 841–846. [Google Scholar] [CrossRef]
- Salehizadeh, S.; Dao, D.; Bolkhovsky, J.; Cho, C.; Mendelson, Y.; Chon, K. A Novel Time-Varying Spectral Filtering Algorithm for Reconstruction of Motion Artifact Corrupted Heart Rate Signals During Intense Physical Activities Using a Wearable Photoplethysmogram Sensor. Sensors 2015, 16, 10. [Google Scholar] [CrossRef] [Green Version]
- Yap, J.H.; Jeong, D.U. Design and Implementation of Ubiquitous ECG Monitoring System by Using Android Tablet. In Ubiquitous Information Technologies and Applications; Springer: Berlin/Heidelberg, Germany, 2013; pp. 269–277. [Google Scholar]
- Kim, B.-H.; Noh, Y.-H.; Jeong, D.-U. A Wearable ECG Monitoring System Using Adaptive EMD Filter Based on Activity Status. In Proceedings of the 2015 IEEE 29th International Conference on Advanced Information Networking and Applications Workshops, Gwangiu, Korea, 24–27 March 2015; IEEE: Piscataway, NJ, USA, 2015; pp. 11–16. [Google Scholar]
- Allen, J.; Murray, A. Effects of filtering on multi-site photoplethysmography pulse waveform characteristics. In Proceedings of the Computers in Cardiology, Chicago, IL, USA, 19–22 September 2004; IEEE: Piscataway, NJ, USA, 2004; pp. 485–488. [Google Scholar]
- Esgalhado, F.; Fernandes, B.; Vassilenko, V.; Batista, A.; Russo, S. The Application of Deep Learning Algorithms for PPG Signal Processing and Classification. Computers 2021, 10, 158. [Google Scholar] [CrossRef]
- Castaneda, D.; Esparza, A.; Ghamari, M.; Soltanpur, C.; Nazeran, H. A review on wearable photoplethysmography sensors and their potential future applications in health care. Int. J. Biosens. Bioelectron. 2018, 4, 195–202. [Google Scholar] [CrossRef]
- Peng, F.; Zhang, Z.; Gou, X.; Liu, H.; Wang, W. Motion artifact removal from photoplethysmographic signals by combining temporally constrained independent component analysis and adaptive filter. Biomed. Eng. Online 2014, 13, 50. [Google Scholar] [CrossRef] [PubMed] [Green Version]
- Casadei, B.C.; Gumiero, A.; Tantillo, G.; Della Torre, L.; Olmo, G. Systolic Blood Pressure Estimation from PPG Signal Using ANN. Electron. 2022, 11, 2909. [Google Scholar] [CrossRef]
- Esgalhado, F.; Batista, A.; Vassilenko, V.; Ortigueira, M. Real-Time PPG-Based HRV Implementation Using Deep Learning and Simulink. In IFIP Advances in Information and Communication Technology; Springer: Berlin/Heidelberg, Germany, 2022; pp. 103–111. [Google Scholar]
- Lukáč, T.; Ondráček, O. Using Simulink and Matlab for Real-Time ECG Signal Processing. Conf. MATLAB 2012. [Google Scholar]
Figure 1.
Deep learning network implemented in the Simulink® system.

Figure 2.
Real-time HRV estimation system developed in Simulink®. This system is comprised of three main blocks: Deep Learning, Find Peaks, and HRV Computation [28].
Figure 2.
Real-time HRV estimation system developed in Simulink®. This system is comprised of three main blocks: Deep Learning, Find Peaks, and HRV Computation [28].

Figure 3.
Deep Learning block, with a PPG input, LSTM model, and PPG classification [28].
Figure 3.
Deep Learning block, with a PPG input, LSTM model, and PPG classification [28].

Figure 4.
Find Peaks block with two inputs: the PPG signal and its deep learning classification. This block output is the peak index location [28].
Figure 4.
Find Peaks block with two inputs: the PPG signal and its deep learning classification. This block output is the peak index location [28].

Figure 5.
HRV Computation block. From the peak index input, a sample interval between peaks is determined from which the HRV can be obtained [28].
Figure 5.
HRV Computation block. From the peak index input, a sample interval between peaks is determined from which the HRV can be obtained [28].

Figure 6.
Flowchart of the applied methodology.

Figure 7.
Display output of the Simulink® system of a PPG signal with a noise artifact. The PPG input signal, peak detection, and HRV estimation are represented in the first, second, and third plot, respectively.
Figure 7.
Display output of the Simulink® system of a PPG signal with a noise artifact. The PPG input signal, peak detection, and HRV estimation are represented in the first, second, and third plot, respectively.

Figure 8.
Display output of the Simulink® system of a PPG signal with a noise artifact. The PPG input signal, peak detection, and HRV estimation are represented in the first, second, and third plot, respectively.
Figure 8.
Display output of the Simulink® system of a PPG signal with a noise artifact. The PPG input signal, peak detection, and HRV estimation are represented in the first, second, and third plot, respectively.


Table 1.
RMSE and Pearson Correlation Coefficient results from the comparison of the HRV vector of gold standard vs. Simulink®.
Table 1.
RMSE and Pearson Correlation Coefficient results from the comparison of the HRV vector of gold standard vs. Simulink®.
| Noisy PPG Signal | RMSE (Seconds) | Correlation Coefficient |
|---|---|---|
| 1 | 0.069 | 0.578 |
| 2 | 0.103 | 0.579 |
| 3 | 0.135 | 0.293 |
| 4 | 0.055 | 0.031 |
| 5 | 0.309 | 0.372 |
| 6 | 0.056 | 0.521 |
| 7 | 0.304 | 0.691 |
| 8 | 0.299 | 0.849 |
| 9 | 0.128 | 0.238 |
| 10 | 0.157 | 0.023 |
| 11 | 0.268 | 0.674 |
| 12 | 0.177 | 0.098 |
| 13 | 0.348 | 0.464 |
| 14 | 0.068 | 0.053 |
| 15 | 0.066 | 0.600 |
| 16 | 0.603 | 0.729 |
| 17 | 0.101 | 0.165 |
| 18 | 0.124 | 0.198 |
| 19 | 0.099 | 0.511 |
| 20 | 0.099 | 0.341 |
Publisher’s Note: MDPI stays neutral with regard to jurisdictional claims in published maps and institutional affiliations. |
© 2022 by the authors. Licensee MDPI, Basel, Switzerland. This article is an open access article distributed under the terms and conditions of the Creative Commons Attribution (CC BY) license (https://creativecommons.org/licenses/by/4.0/).
Share and Cite
MDPI and ACS Style
Esgalhado, F.; Vassilenko, V.; Batista, A.; Ortigueira, M. On the Feasibility of Real-Time HRV Estimation Using Overly Noisy PPG Signals. Computers 2022, 11, 177. https://doi.org/10.3390/computers11120177
AMA Style
Esgalhado F, Vassilenko V, Batista A, Ortigueira M. On the Feasibility of Real-Time HRV Estimation Using Overly Noisy PPG Signals. Computers. 2022; 11(12):177. https://doi.org/10.3390/computers11120177
Chicago/Turabian StyleEsgalhado, Filipa, Valentina Vassilenko, Arnaldo Batista, and Manuel Ortigueira. 2022. "On the Feasibility of Real-Time HRV Estimation Using Overly Noisy PPG Signals" Computers 11, no. 12: 177. https://doi.org/10.3390/computers11120177
Note that from the first issue of 2016, this journal uses article numbers instead of page numbers. See further details here.