Article

Hygroexpansion and Surface Roughness Cause Defects and Increase the Electrical Resistivity of Physical Vapor Deposited Aluminum Coatings on Paper

by
Martina Lindner
1,2,*,
Julia Heider
1,2,
Matthias Reinelt
2 and
Horst-Christian Langowski
1,2
1
Chair for Food Packaging Technology, TUM School of Life Sciences, Technical University of Munich, Weihenstephaner Steig 22, 85354 Freising, Germany
2
Fraunhofer Institute for Process Engineering and Packaging IVV, Giggenhauser Strasse 35, 85354 Freising, Germany
*
Author to whom correspondence should be addressed.
Coatings 2019, 9(1), 33; https://doi.org/10.3390/coatings9010033
Submission received: 21 November 2018 / Revised: 17 December 2018 / Accepted: 20 December 2018 / Published: 8 January 2019
(This article belongs to the Special Issue Advances in Flexible Films and Coatings)

Abstract

:
Aluminum coatings, which are applied by physical vapor deposition (PVD), have to be virtually defect-free in barrier applications for the packaging industry. When aluminum is applied to paper, hygroexpansion and substrate roughness can impair the aluminum coating. Neither effect is easy to detect by microscopy, but both can manifest as an increase in electrical resistance. Here, we quantified the effect of substrate paper hygroexpansion and surface roughness on the effective resistivity ρEFF of aluminum coatings. The sheet resistance of aluminum coated onto four different rough paper surfaces was measured via eddy currents at different relative humidity (0%–95%). The mass of aluminum per unit area was determined by inductively-coupled plasma mass spectrometry (ICP–MS). We calculated ρEFF based on the measured resistance and aluminum mass per unit area, combined with a value for aluminum density from the literature. The substrate roughness was proportional to ρEFF. Relative humidity correlated with the moisture content of the paper substrate according to the Guggenheim, Anderson, and De Boer (GAB) equation, whereas the moisture content showed a linear correlation with hygroexpansion. At relative humidity of up to 50%, hygroexpansion was linearly correlated with the increase in ρEFF, which is related to the mechanical straining and deformation of aluminum. At higher humidity, aluminum started to crack first on rough substrates and later on smooth substrates. The increase in ρEFF was larger on rough substrates. The findings highlight the need for information about substrate roughness, humidity, and hygroexpansion when eddy current measurement results are compared, and will help to ensure that aluminum coatings, applied by PVD, are defect-free.

1. Introduction

Aluminum coatings are widely used for applications such as packaging, paper electronics, and wafer technology, and are usually applied by physical vapor deposition (PVD). Effective coatings must be virtually defect-free, and one challenge to be addressed is the surface roughness of the substrate. Often, such inorganic coatings are applied onto very smooth, partially biaxially oriented, stretched polymeric films, which have roughness scales in the nanometer range. However, this is not the case for paper substrates, because the surface roughness of paper is in the micrometer range. Roughness can lead to defects in the inorganic coating, as illustrated in Figure 1.
A further challenge associated with the PVD coating of paper is hygroexpansion, which is the moisture-induced dimensional change of a material. The cellulose fibers in paper are hygroscopic and swell following the absorption of moisture from the surrounding atmosphere. However, the transverse expansion of the fibers is about 10 times greater than the longitudinal expansion, and because the fibers are aligned in machine direction (MD), most of the expansion in paper sheets occurs in cross direction (CD) [1,2]. When a closed aluminum coating is required, hygroexpansion is a challenge during PVD because the metallization of paper takes place under a high vacuum (~10−6 mbar) so the water evaporates and the paper shrinks. After metallization, the paper is transferred to humid air and subsequently expands as water enters from the uncoated side. Consequently, the aluminum coating is strained and eventually cracks [3].
Both hygroexpansion and defects formed due to substrate roughness therefore impair the aluminum coating. However, neither can be detected by light microscopy or scanning electron microscopy because the cracks are too small and too numerous, and therefore not clearly observed in the light transmittance or light reflectance modes. However, both effects manifest as an increase in electrical resistance [3,4,5,6,7,8,9,10,11]. Sheet resistance is commonly used to determine the thickness of nanometer-scale thin coatings, for example in film capacitors, holographic coatings, energy-saving windows, solar cells, absorbers, flexible circuits, thin film batteries, stretchable electronics, and packaging applications [12,13].
The effect of substrate expansion on sheet resistance has been reported for polymeric substrates. Resistance increase factors (ΔR/R0) of up to 2.2 were reported at a strain of 20% for copper coatings [14,15,16,17], with equivalent values of 3% at 20% strain for silver coatings [18] and 15,000 at 20% strain for aluminum coatings, depending on strain speed and aluminum thickness [19]. Moreover, this behavior was time dependent [19] and was influenced by the adhesion between the polymeric substrate and coating [14]. The fracture characteristics of such ductile materials must be carefully distinguished from those of brittle coatings such as silicon oxide or indium oxide [20]. To the best of our knowledge, the impact of hygroexpansion and roughness on the appearance of defects in aluminum coatings on paper substrates has not been investigated in detail, and it is unclear whether this can be monitored by measuring electrical resistance [21]. In this study, we therefore addressed the following questions:
  • How does surface roughness correlate with the sheet resistance and effective resistivity of an aluminum coating?
  • How does relative humidity (RH) affect the hygroexpansion of paper and how does it correlate with the sheet resistance and effective resistivity of the aluminum coating?
  • Is there interdependency between substrate roughness and the sensitivity of aluminum coatings toward hygroexpansion?
The approach chosen to address these questions is summarized in Figure 2. For two papers, the roughness RZ, the sorption isotherm and the hygroexpansion were determined. Then, the respective four different paper surfaces (coated and non-coated sides of the two different papers) were PVD-coated with aluminum. The amount of aluminum (dNOMINAL) was determined by inductively coupled plasma-mass spectrometry (ICP-MS) in combination with a value for aluminum density from the literature, and the resistance (R) of the coating was measured at different RH values. From dNOMINAL and R, the effective resistivity ρEFF was derived. The increase of ρEFF was determined according to the RH.
Finally, the resistivity was then correlated with the surface roughness and the hygroexpansion of paper.

2. Materials and Methods

2.1. Abbreviations

All non-generalized abbreviations used here are as follows: AC, aluminum coating, metallization; CC, side of the paper that is clay coated; CD, cross direction; COS, crack onset strain; MD, machine direction; mc, moisture content; PVD, physical vapor deposition; RH, relative humidity; without CC, side of the paper that is not clay coated.

2.2. PVD Coating of Aluminum on Paper

The paper substrates were Metalkote with a grammage of 65 g/m2 (Ahlstrom-Munksjö Oyj, Stockholm, Sweden) and Nikla Select with a grammage of 70 g/m2 (Brigl & Bergmeister, Niklasdorf, Austria). Paper samples were cut to a size of 105 × 148 mm2. The samples were taped along all four edges onto a Metalkote paper carrier roll using thermally stable adhesive tape (Kapton, DuPont, Wilmington, DE, USA).
In order to achieve a high vacuum during PVD, it was necessary to reduce the moisture content (mc) of the paper substrate. Therefore, the carrier roll containing all the samples was dried at 70 °C for nine days in a Heratherm oven (Thermo Fisher Scientific, Waltham, MA, USA) prior to metallization.
The metallization was applied by PVD using the electron beam heating method. The coating process was performed in a L560UV 0.5 × 1.0 m2 box coater (Leybold Vacuum, Cologne, Germany) at Fraunhofer IVV. This coater was adapted for the roll-to-roll coating of polymer webs by the introduction of deposition roll, un-winding and re-winding equipment (Lenze, Hameln, Germany). The equipment was controlled using VAC Cluster Tool Controller L560 (AIS Automation, Dresden, Germany). The box coater was equipped with a 160-m3/h, E2M175 rotary vacuum pump and a 505-m3/h EH500 roots pump (both from Edwards, UK), and a 850–1150-L/s TMP 1000 turbomolecular pump (Leybold Vacuum) to create a vacuum down to ~10−6 mbar. Remaining moisture in the chamber was extracted using a Meissner cold trap (nitrogen-cooled copper pipe) and the deposition roll was water cooled. The pressure was determined using a PPT 100 Pirani gauge and a HPT100 hot-cathode Bayard–Alpert–Pirani wide-range gauge (both from Pfeiffer, Aßlar, Germany). The EV M-10 electron beam source with a 270° configuration was combined with a 10-kW Genius Carrera high voltage supply (both from Ferrotec, Unterensingen, Germany). The aluminum we used had a purity of 99.98%. The coating thickness was varied by changing the web speed from 0.5 to 3.5 m/min at steps of 0.5 m/min and an evaporation rate of 2–3.5 nm/s. During the evaporation process, the pressure in the chamber ranged from 10−4 to 10−5 mbar, resulting in an approximate mean free path of 0.9–9 m [12].
After removing the rolls from the box coater, they were transferred to a 60-L HM-HDPE drum (Mauser-Werke, Brühl, Germany) containing 1 kg Perlform silica gel (orange, 2–5 mm, with indicator; Carl Roth, Karlsruhe, Germany) to reduce the RH to 0%. As such, the water uptake and hygroexpansion of the paper was kept to a minimum. The drum was then stored at 23 °C.

2.3. Determination of Sheet Resistance via Eddy Currents at Different RH Values

Prior to re-humidification of the aluminum-coated samples, rigid frames were produced onto which the samples were later loosely attached to avoid curling. This frame consisted of four Purell HP570M plastic strips (Lyondell Basell, Rotterdam, The Netherlands) fixed together using Shamrock adhesive tape (Scientific Specialty Systems, Waltham, MA, USA). Furthermore, paper towels were stapled to form pouches of 75 × 95 mm2 and filled with 30 g silica gel. They were stored, together with the paper carrier roll, in the HDPE drum with silica gel.
In the next step, we placed the plastic frames, the silica pouches, a dish containing 500 g silica gel, a pair of scissors, pressure lock bags, adhesive tape (Scotch Magic), a testostor 175 hygrometer (Testo, Lenzkirch, Germany), and Fibox oxygen concentration measuring points (PreSens Precision Sensing, Regensburg, Germany) into a glove box (Mecaplex Metall, Grenchen, Switzerland). Finally, the roll with the aluminum-coated samples was placed into the glove box, which was immediately closed and flushed with pure nitrogen to remove moisture. Flushing was assumed to be complete when a constant, minimal RH value of < 3% (determined via the hygrometer) was reached. The paper samples were then removed from the carrier roll and attached to the frames with adhesive tape. The samples, together with the silica pouches, were transferred into the pressure log bags. After transferring all samples into these bags, the glove box was opened and the pressure log bags were placed in the plastic drum with fresh silica gel.
The samples were then taken one by one from the drum and the sheet resistance was measured at five predetermined points on each sample. The sheet resistance (R) was measured using the eddy current method (EddyCus TF lab 4040, Suragus, Dresden, Germany). The skin depth with the applied set up was > 8 µm, which ensures the full penetration of the aluminum layer by the magnetic field. The area captured by the measurement was approximately 5 × 5 mm2. The sheet resistance R of a resistor with thickness d and resistivity ρ is defined as
R = ρ d
The effective resistivity ρEFF was then calculated from the thickness determined by ICP-MS (dNOMINAL) and the measured sheet resistance (R):
ρ EFF = d N O M I N A L · R
After measurement, the samples were immediately transferred to a KBF720-230V climate chamber (Binder, Tuttlingen, Germany) set to 23 °C with RH values of 35%, 50%, 70%, 85%, and 95%. The samples were stored in each climate for 24 h prior to measurement of the sheet resistance. After each measurement, the samples were placed back into the climate chamber. Excessive air convection in the chamber was avoided by using additional plastic curtains placed inside the chamber. The relative effective resistivity increase (γ) was calculated based on the effective resistivity at a RH of 0% and at a given RH of x%.
γ = ρ EFF R H = x % ρ EFF R H = 0 % 1

2.4. Inductively-Coupled Plasma—Mass Spectrometry (ICP-MS)

The sample surface, volume, and dilution factors were adapted depending on the expected aluminum concentration. From each sample with a surface (A) of 10 cm2 or 15 cm2, the aluminum was stripped off using 50, 30, 20, 10, or 5 mL 1.0 M of sodium hydroxide solution (Chemsolute 1.0 mol/L, Th. Geyer GmbH, Renningen, Germany). The volume of 1.0 M sodium hydroxide used was taken as the sample volume (V). After 1 h, the samples were mixed within the tubes and the liquid aluminous sample was diluted with double-distilled water. The dilution factor (f) was 1:10 or 2:10. The amount of aluminum in these diluted samples was determined using an Agilent 770x ICP-MS (Agilent Technologies, Santa Clara, CA, USA). We used an aluminum standard solution for calibration (ICP-multi-element standard solution IV 1.11355.0100; Merck, Darmstadt, Germany). The aluminum concentration of the standard solution was 1000 mg/L. For calibration, this standard solution was diluted with double-distilled water to concentrations of 0.10, 0.20, 0.25, 0.30, 0.50, 0.75, 1.00, 1.50, 2.00, 3.00, and 3.50 mg/L aluminum. The calibration delivered the correlation for the given concentration with signal intensity. This correlation allowed us to calculate the concentration (c) [mg/L] of aluminum in each sample from the signal intensity.
Based on the stripped-off sample area A, the nominal thickness of the aluminum layer dNOMINAL was calculated using the determined concentration of aluminum c and a bulk value for density (δlit) of 2.7 g/cm3 taken from the literature [22], as shown in Equation (4). The coating weight (cwNOMINAL) [g/m2] was calculated according to Equation (5) [23].
d NOMINAL = c · f · V A · δ l i t
c w NOMINAL = d NOMINAL · δ lit

2.5. Sorption Isotherm

Sorption isotherms of the paper substrates were recorded at 0%, 35%, 50%, 70%, 85%, and 95% RH (Sorptionsprüfsystem SPSx-1μ, ProUmid GmbH & Co. KG, Ulm, Germany). The temperature was set to 23 °C. For each humidity increase, the weight was measured until equilibrium was reached. The minimum time for each RH increase was set to 2 h, and the maximum to 48 h. The sorption isotherms between 35% and 95% RH were described using the Guggenheim, Anderson, and De Boer (GAB) equation, which is shown in Equation (6) [24]. In this model it is postulated that the state of sorbate molecules in the second layer is equal to those in superior layers, but different from those of the monolayer. Here, mc is the moisture content [–], M0 [g/100 g fiber] the monolayer moisture content, RH the relative humidity, and h and c are constants. c is a measure of the strength of binding of water to the primary binding sites, whereas h is a correction factor, which corrects the properties of the multilayer molecules relative to the bulk liquid [25,26]. The equation was fitted to the data using OriginPro 2016 (OriginLab Corporation, Wellesley Hills, MA, USA) and the Levenberg–Marquardt algorithm.
m c = M 0   · c · h · RH . ( 1 h · RH ) · ( 1 h · RH + c · h · RH )

2.6. Hygroexpansion

The hygroexpansion measurement was carried out on three samples (288 × 200 mm2) from each paper. The samples were dried for 20 days in silica gel at 23 °C. Then, each was stored in the KBF720-230V climate chamber at 23 °C for 24 h, with sequentially increasing RH values of 35%, 50%, 70%, 85%, and 95%. The samples were taken one by one from the drum/climate chamber and scanned at a resolution of 1200 dpi (CanonScan LiDE 700F, Canon, Krefeld, Germany). Images were saved as a jpg file. Subsequently, the distance between certain measuring points (l0,CD, l0,MD) was measured using LAS v4.0 software (Leica Microsystems GmbH, Wetzlar, Germany). On each sample, we took three CD and three MD measurements. From these data, the percentage length increase ε at increasing RH values was calculated by setting l0,CD and l0,MD in relation to the increased lengths lCD and lMD, as shown in Equation (7).
ε CD = l CD l 0 , CD l 0 , CD

2.7. Surface Roughness

Roughness was determined using the mechanical profile method (Hommel Etamic W55, Jenoptik, Jena, Germany). Here, we use the roughness term Rz. In this method, the traversing length ln is divided into five equal-sized subsections lr, chosen according to DIN EN ISO 4288:1998 [27] and DIN EN ISO 3274:1998 [28] (in this case, 0.8 and 2.5 mm, respectively). In the single subsections, the single roughness Zn was determined. The single roughness is the difference between the highest and lowest points in one subsection lr [29]. From Zn, RZ is determined as the arithmethic average.

2.8. Scanning Electron Microscopy (SEM)

Images were acquired using a JSM-7200F scanning electron microscope (Jeol, Peabody, MA, USA) at 4 kV. The working distance was maintained at 8.7–9.6 mm. Given that the samples were coated with aluminum, no additional gold sputtering was necessary.

2.9. Statistical Methods

Data points represent median values for resistances and average values for roughness. Statistical tests were carried out using OriginPro 2016 and Visual-XSel v12.0 (CRGRAPH, Starnberg, Germany). Statistically significant differences were determined using the Wilcoxon, Mann, and Whitney U-test (α = 0.05).

3. Results

3.1. Surface Characterization via SEM and EDX

When considering substrate roughness, roughness parameters such as RZ are only used to describe certain features of a much more complex surface structure. To obtain a better visual impression, surface images were obtained by SEM (Figure 3).
Additional images obtained by energy dispersive X-ray spectroscopy did not reveal aluminum clusters or voids. This indicates that the sizes of the clusters and voids are in the nanometer range rather than the micrometer range.

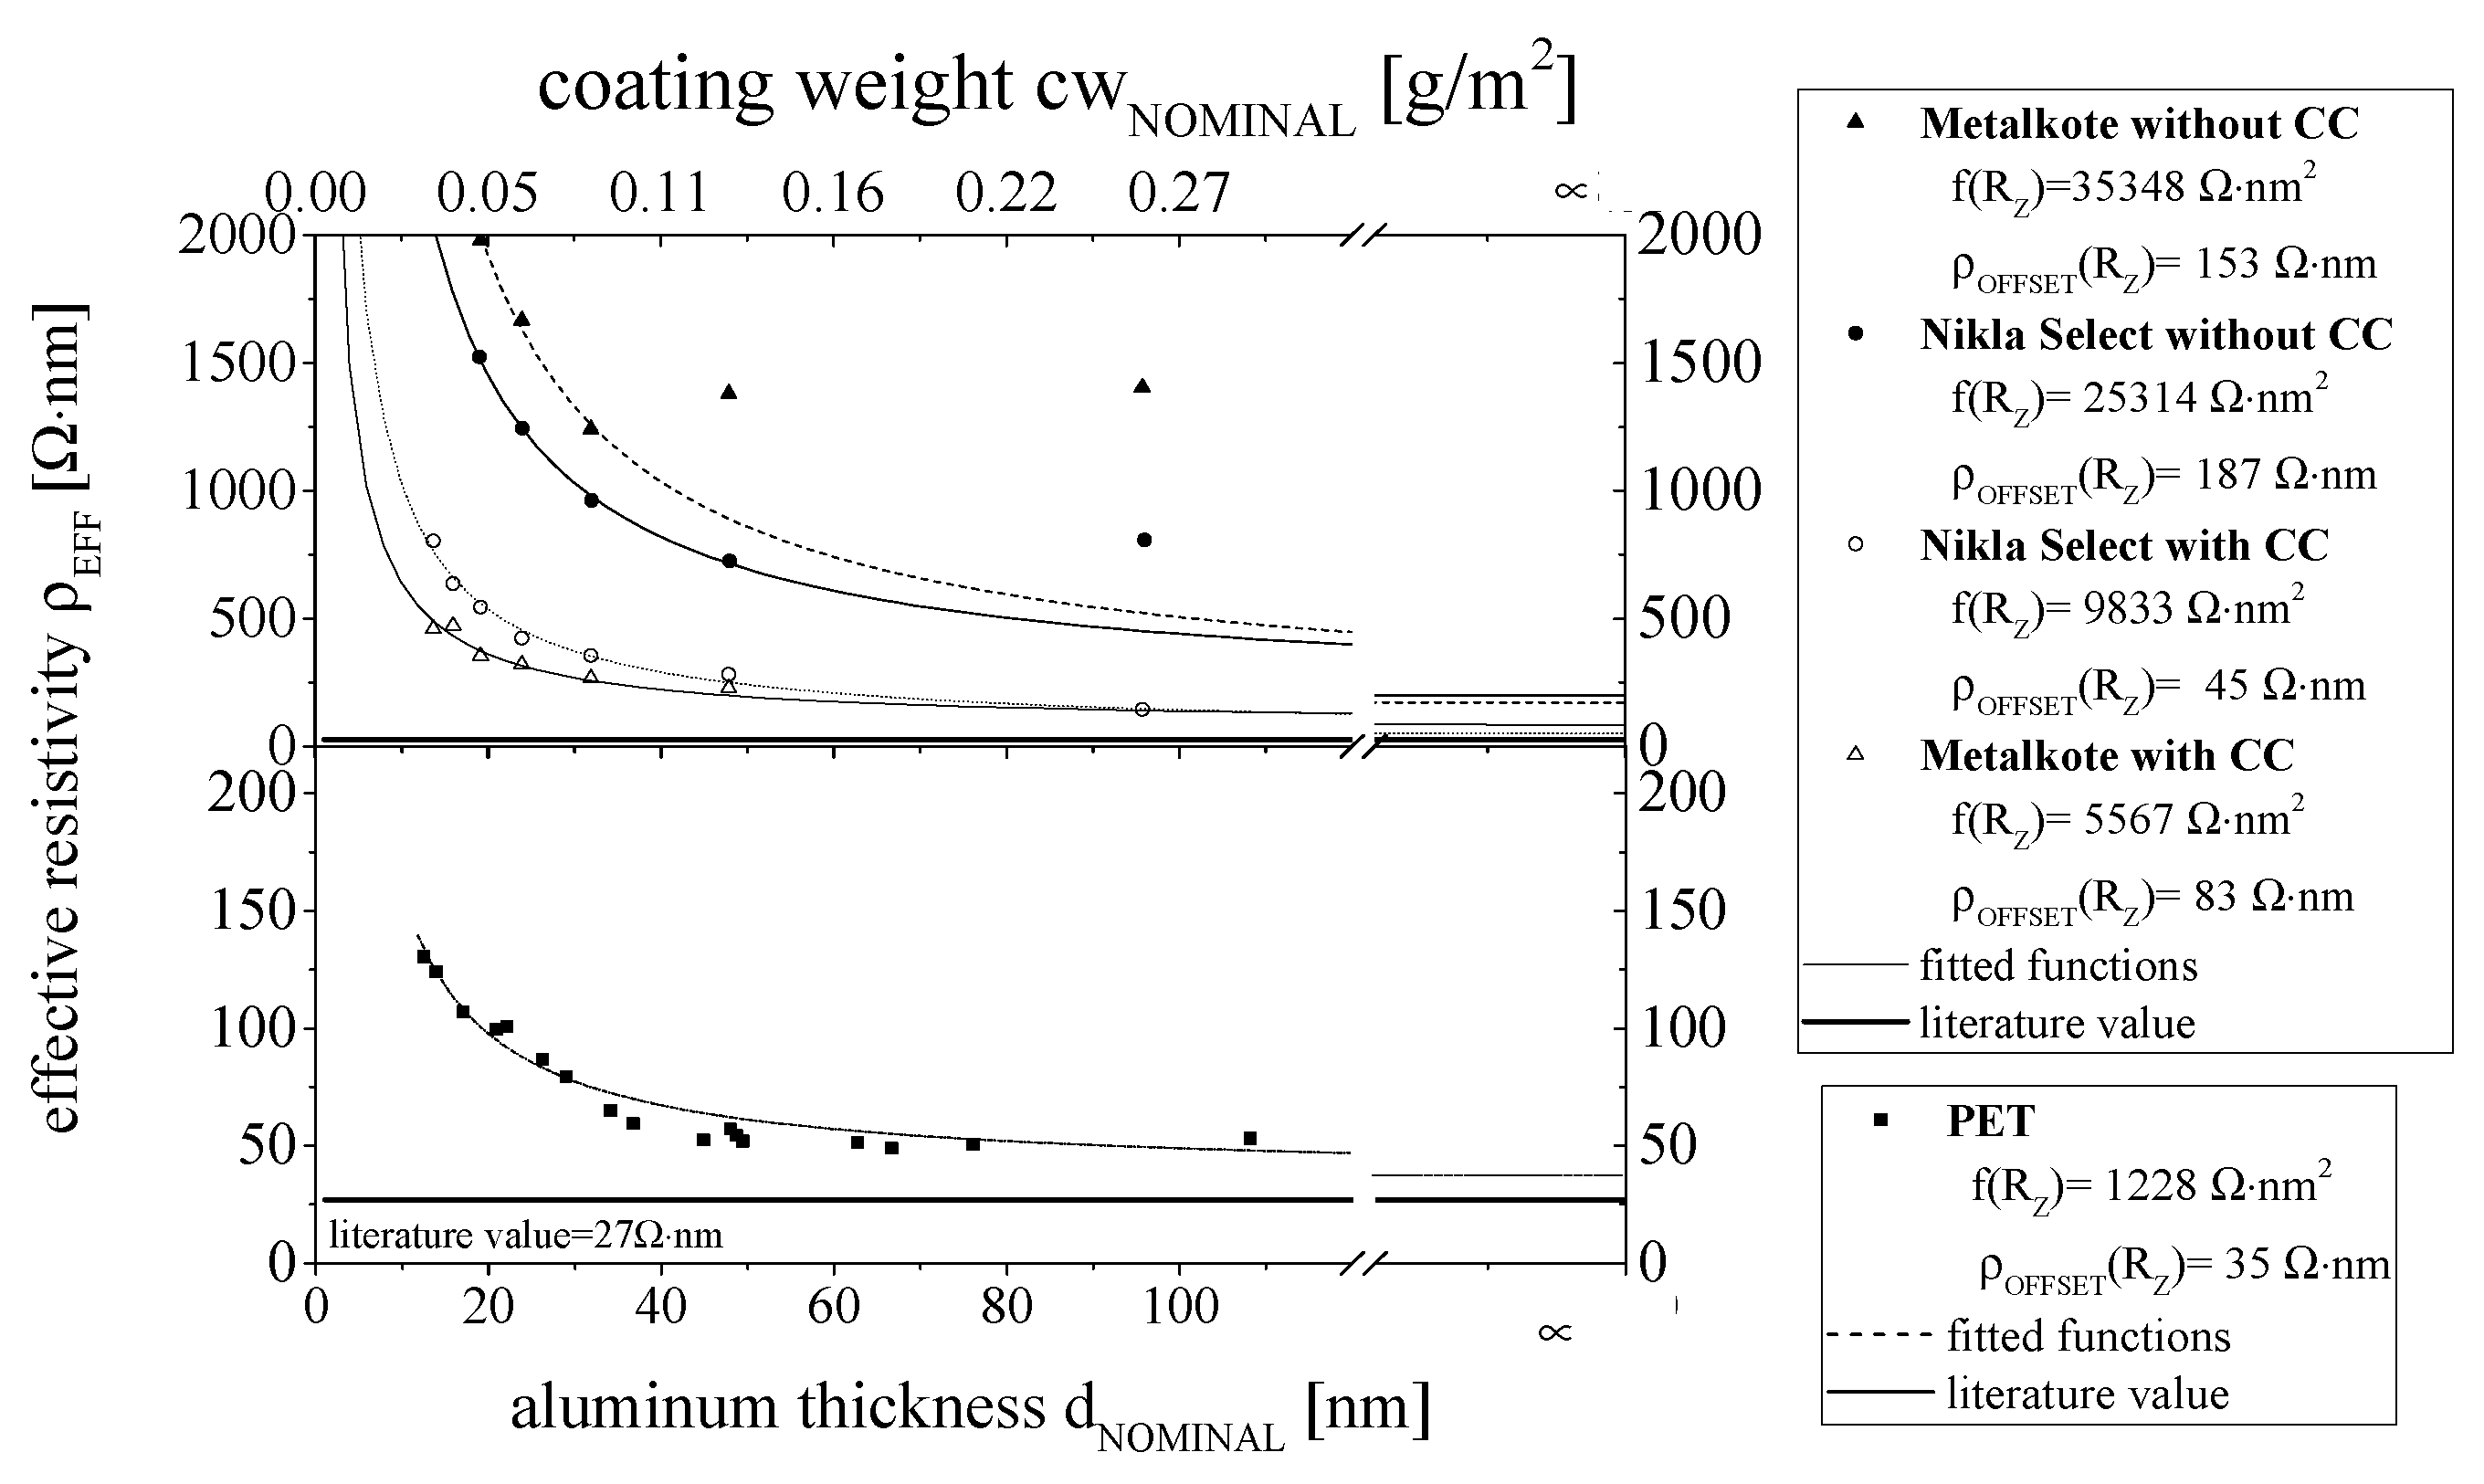
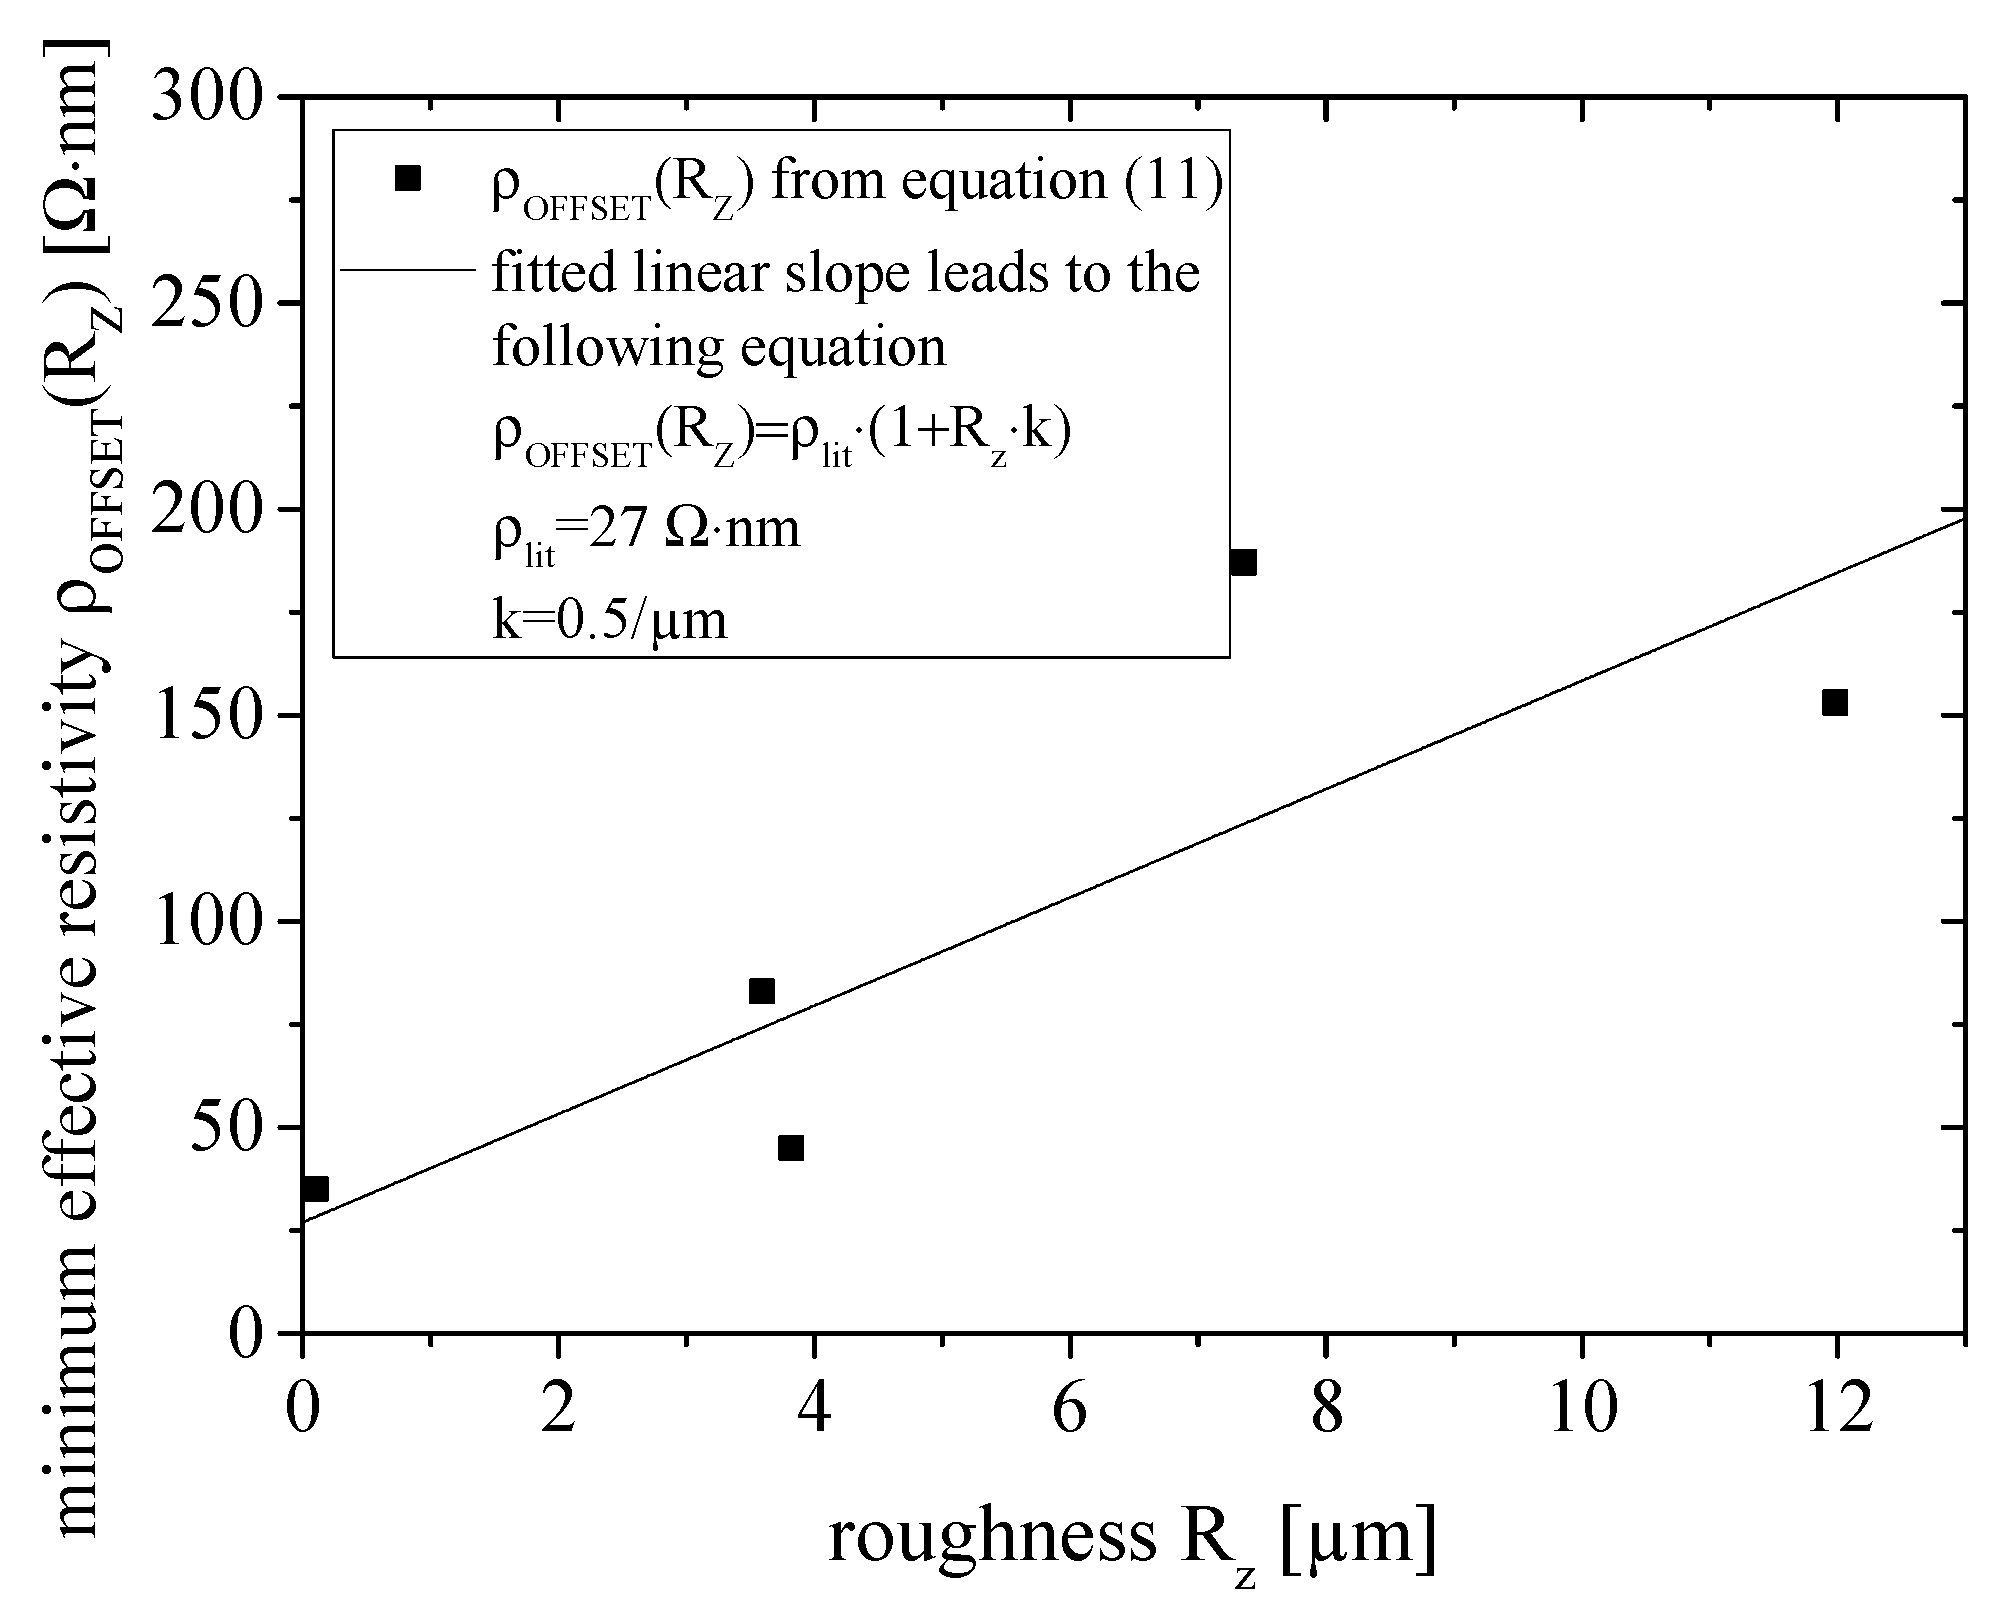
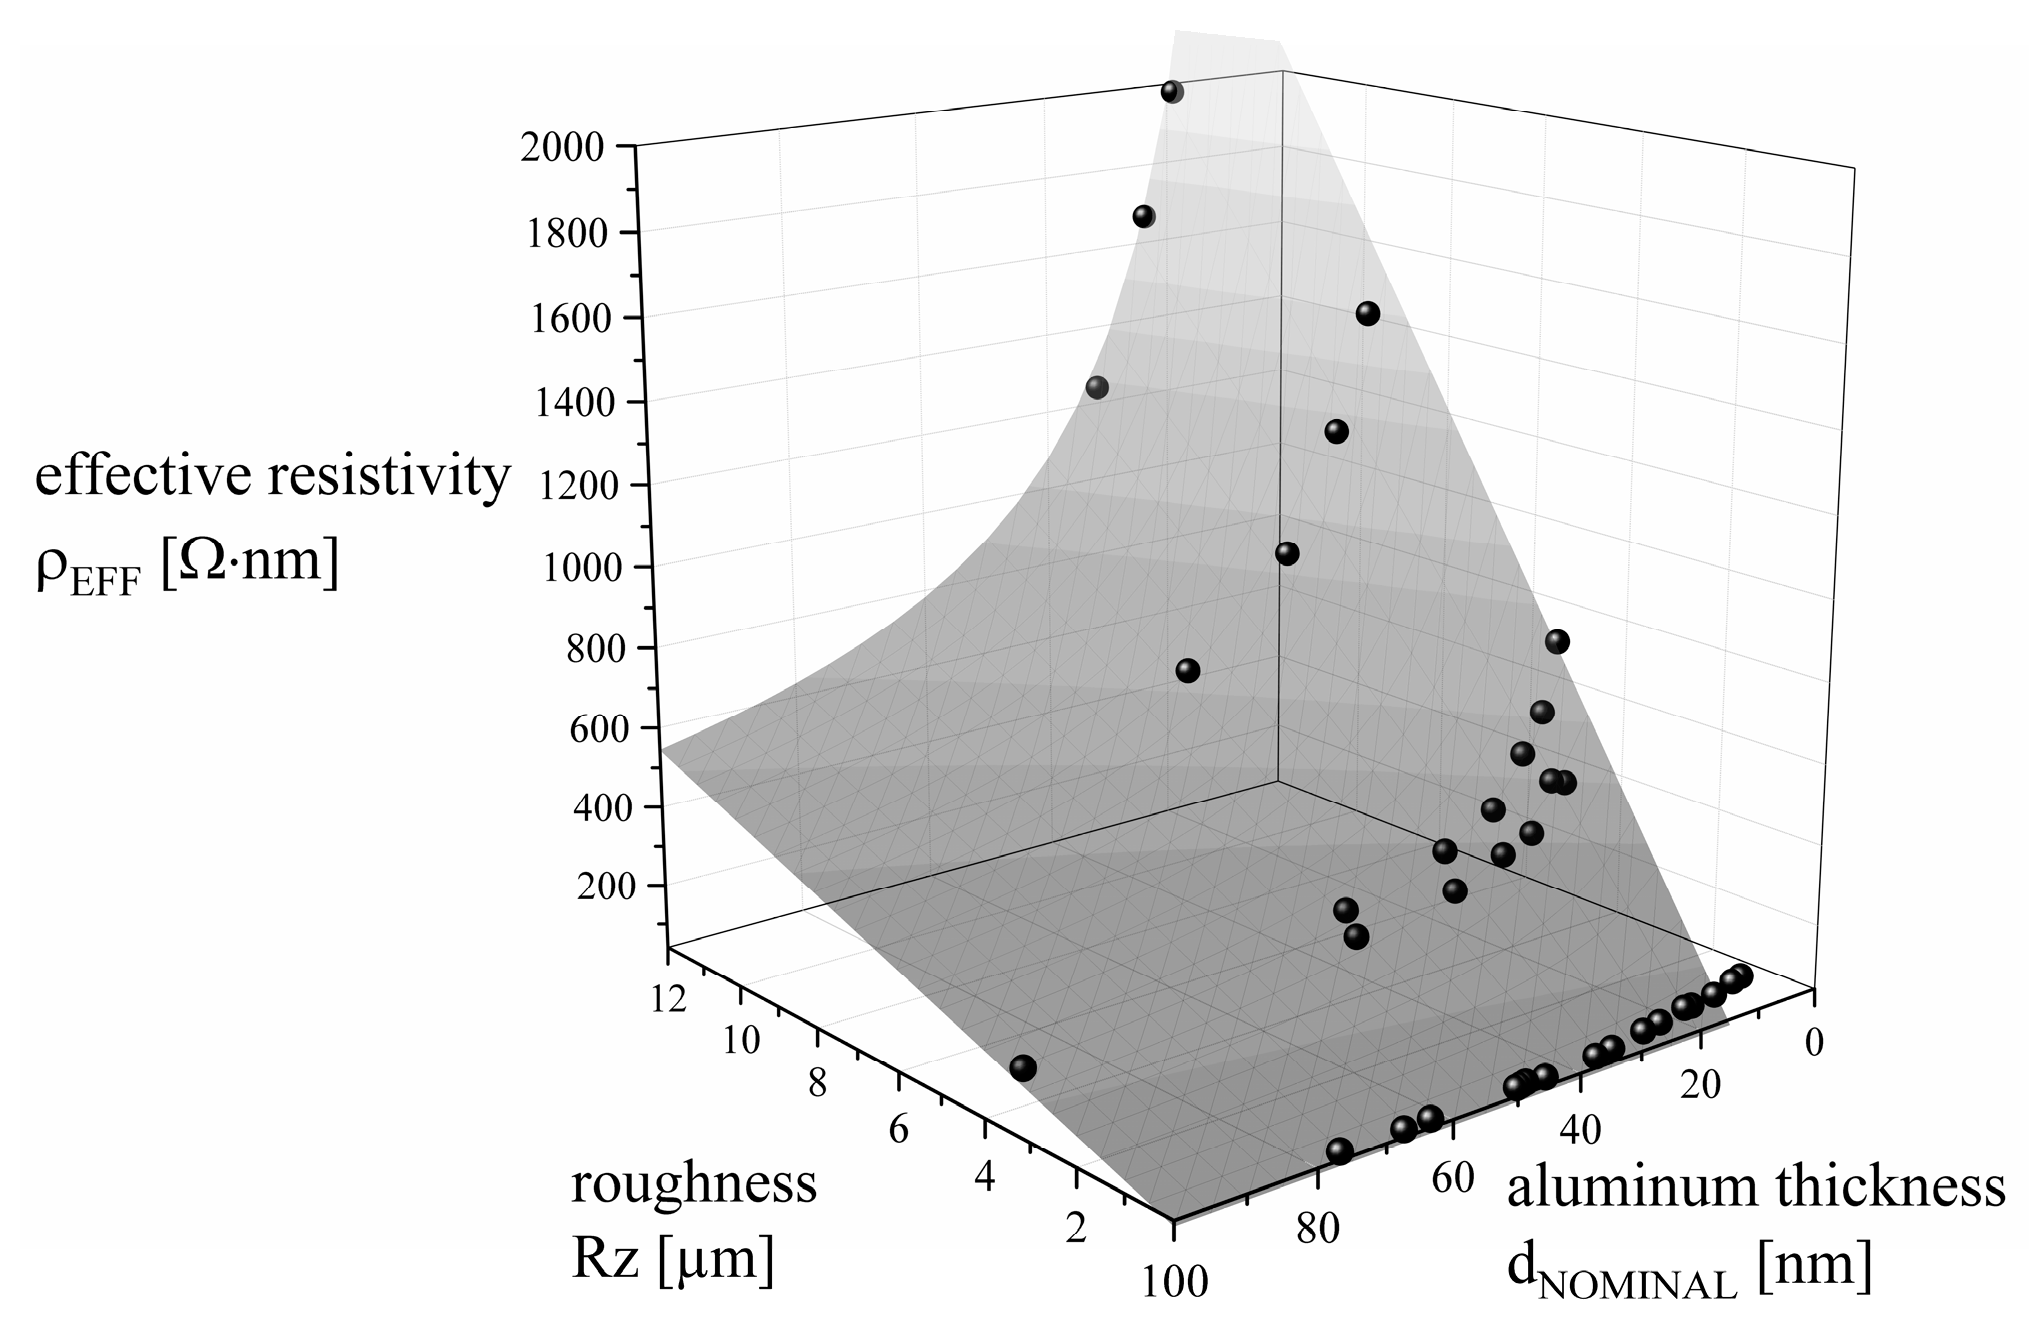
3.2. Effect of Substrate Roughness on Sheet Resistance and Resistivity

Surface features, as shown in the previous section, manifest themselves as a change in electrical conductivity of the applied aluminum coatings. In Figure 4, the effect of dNOMINAL on the sheet resistance is visible (for measurements at 50% RH). Apparently the sheet resistance (R) inversely correlates with the aluminum thickness. This correlation is significantly different for different paper substrates, indicating that the resistivity is not the same on all paper substrates. Thus, the effective resistivity (ρEFF) is calculated from the measured sheet resistance (R) and the thickness (dNOMINAL) (Equation (2)).
As shown in Figure 5, the effective resistivity ρEFF was neither constant nor close to the value reported in the literature. In detail, four observations can be made from this figure.
All curves show a characteristic minimum resistivity value ρOFFSET [Ω∙nm] at high aluminum thickness, superimposed by a variable resistivity ρn [Ω∙nm] at lower thickness (Equation (8)).
ρ EFF = ρ OFFSET + ρ n
Even for the thicker coatings, the minimum resistivity ρOFFSET would not achieve literature values for bulk aluminum ρlit. This can partially be explained as material properties are influenced by the PVD process conditions. Such process conditions include the residual oxygen and water vapor pressures, the kinetic energy of evaporated aluminum atoms, and the mean free path length. However, obviously a second factor affects the values, because the minimum resistivity ρOFFSET increases with substrate roughness (Equation (9)). This can be explained; as a low roughness leads to small defects which can easily become overgrown with aluminum. In comparison, defects on very rough papers are too large to become overgrown, thus increasing the resistance R and minimum resistivity ρOFFSET.
ρ OFFSET ~ R Z
Additionally, for thin coatings, the resistivity is higher on rough substrates. Thus, the variable resistivity ρn also depends on paper roughness RZ (Equation (10)).
ρ n ~   R Z
Low thickness leads to a high resistivity, what can only partially be explained by electron scattering on aluminum grain boundaries [30]. Thus, it can be assumed that with decreasing thickness, less and less aluminum is available to overgrow the aforementioned defects. Thus, a thinner coating leads to more defects and to a higher variable resistivity ρn (Equation (11)).
ρ n ~ 1 / d NOMINAL
The resistivity shows deviating behavior at thicknesses of 47 and 96 nm in the case of Metalkote without CC, and at 96 nm in the case of Nikla Select without CC. This indicates, that thicker coatings on rough substrates have a lower crack onset strain. The three data points mentioned above may therefore deviate due to this effect. This indicates a boundary condition for the application of the developed model. The data points are not considered explicitly in the following.
Observations (I)–(III) can be combined to the following very simple descriptive approach
ρ EFF = f ( R Z ) · 1 d + ρ OFFSET ( R Z )
where f(RZ) and ρOFFSET(RZ) are functions of RZ. The individual numbers for these functions can be obtained for each experimental curve in Figure 5 by fitting Equation (12) to the data points (least square method). However it is not yet clear what f(RZ) and ρOFFSET(RZ) actually are. To test this, the obtained numbers from the fit above are plotted versus RZ (Figure 6) so that the scaling of these functions becomes clear: f(RZ) correlates linearly with a slope c of 2964 Ω∙nm2/µm (Equation (13)). The scaling for ρOFFSET (RZ) is obtained similarly to be linear with a slope of k = 0.5/µm. Additionally the linear plot intersects the y-axis and the respective y-value corresponds to ρlit (Figure 7, Equation (14)). The correlation in ρOFFSET (RZ) is less explicit. This may reflect the additional effects on ρOFFSET, such as the effect of foreign atoms.
f ( R Z ) = R Z · c
ρ OFFSET ( R Z ) = ρ lit · ( 1 + R Z · k )
The combination of Equations (12)–(14) gives Equation (15), which was used to fit the three dimensional graph in Figure 8. This correlation fits well (R2 = 0.88). The results show that the resistivity is not constant, but rather increases with decreasing thickness. Additionally, roughness increases the resistivity, and this effect is much more pronounced.
ρ EFF = R Z · c · 1 d + ρ lit · ( 1 + R Z · k ) ρ lit = 27   Ω · nm   k = 0.5 / µ m   c = 2964   Ω · nm 2 / μ m

3.3. Effect of Substrate Hygroexpansion on Resistivity

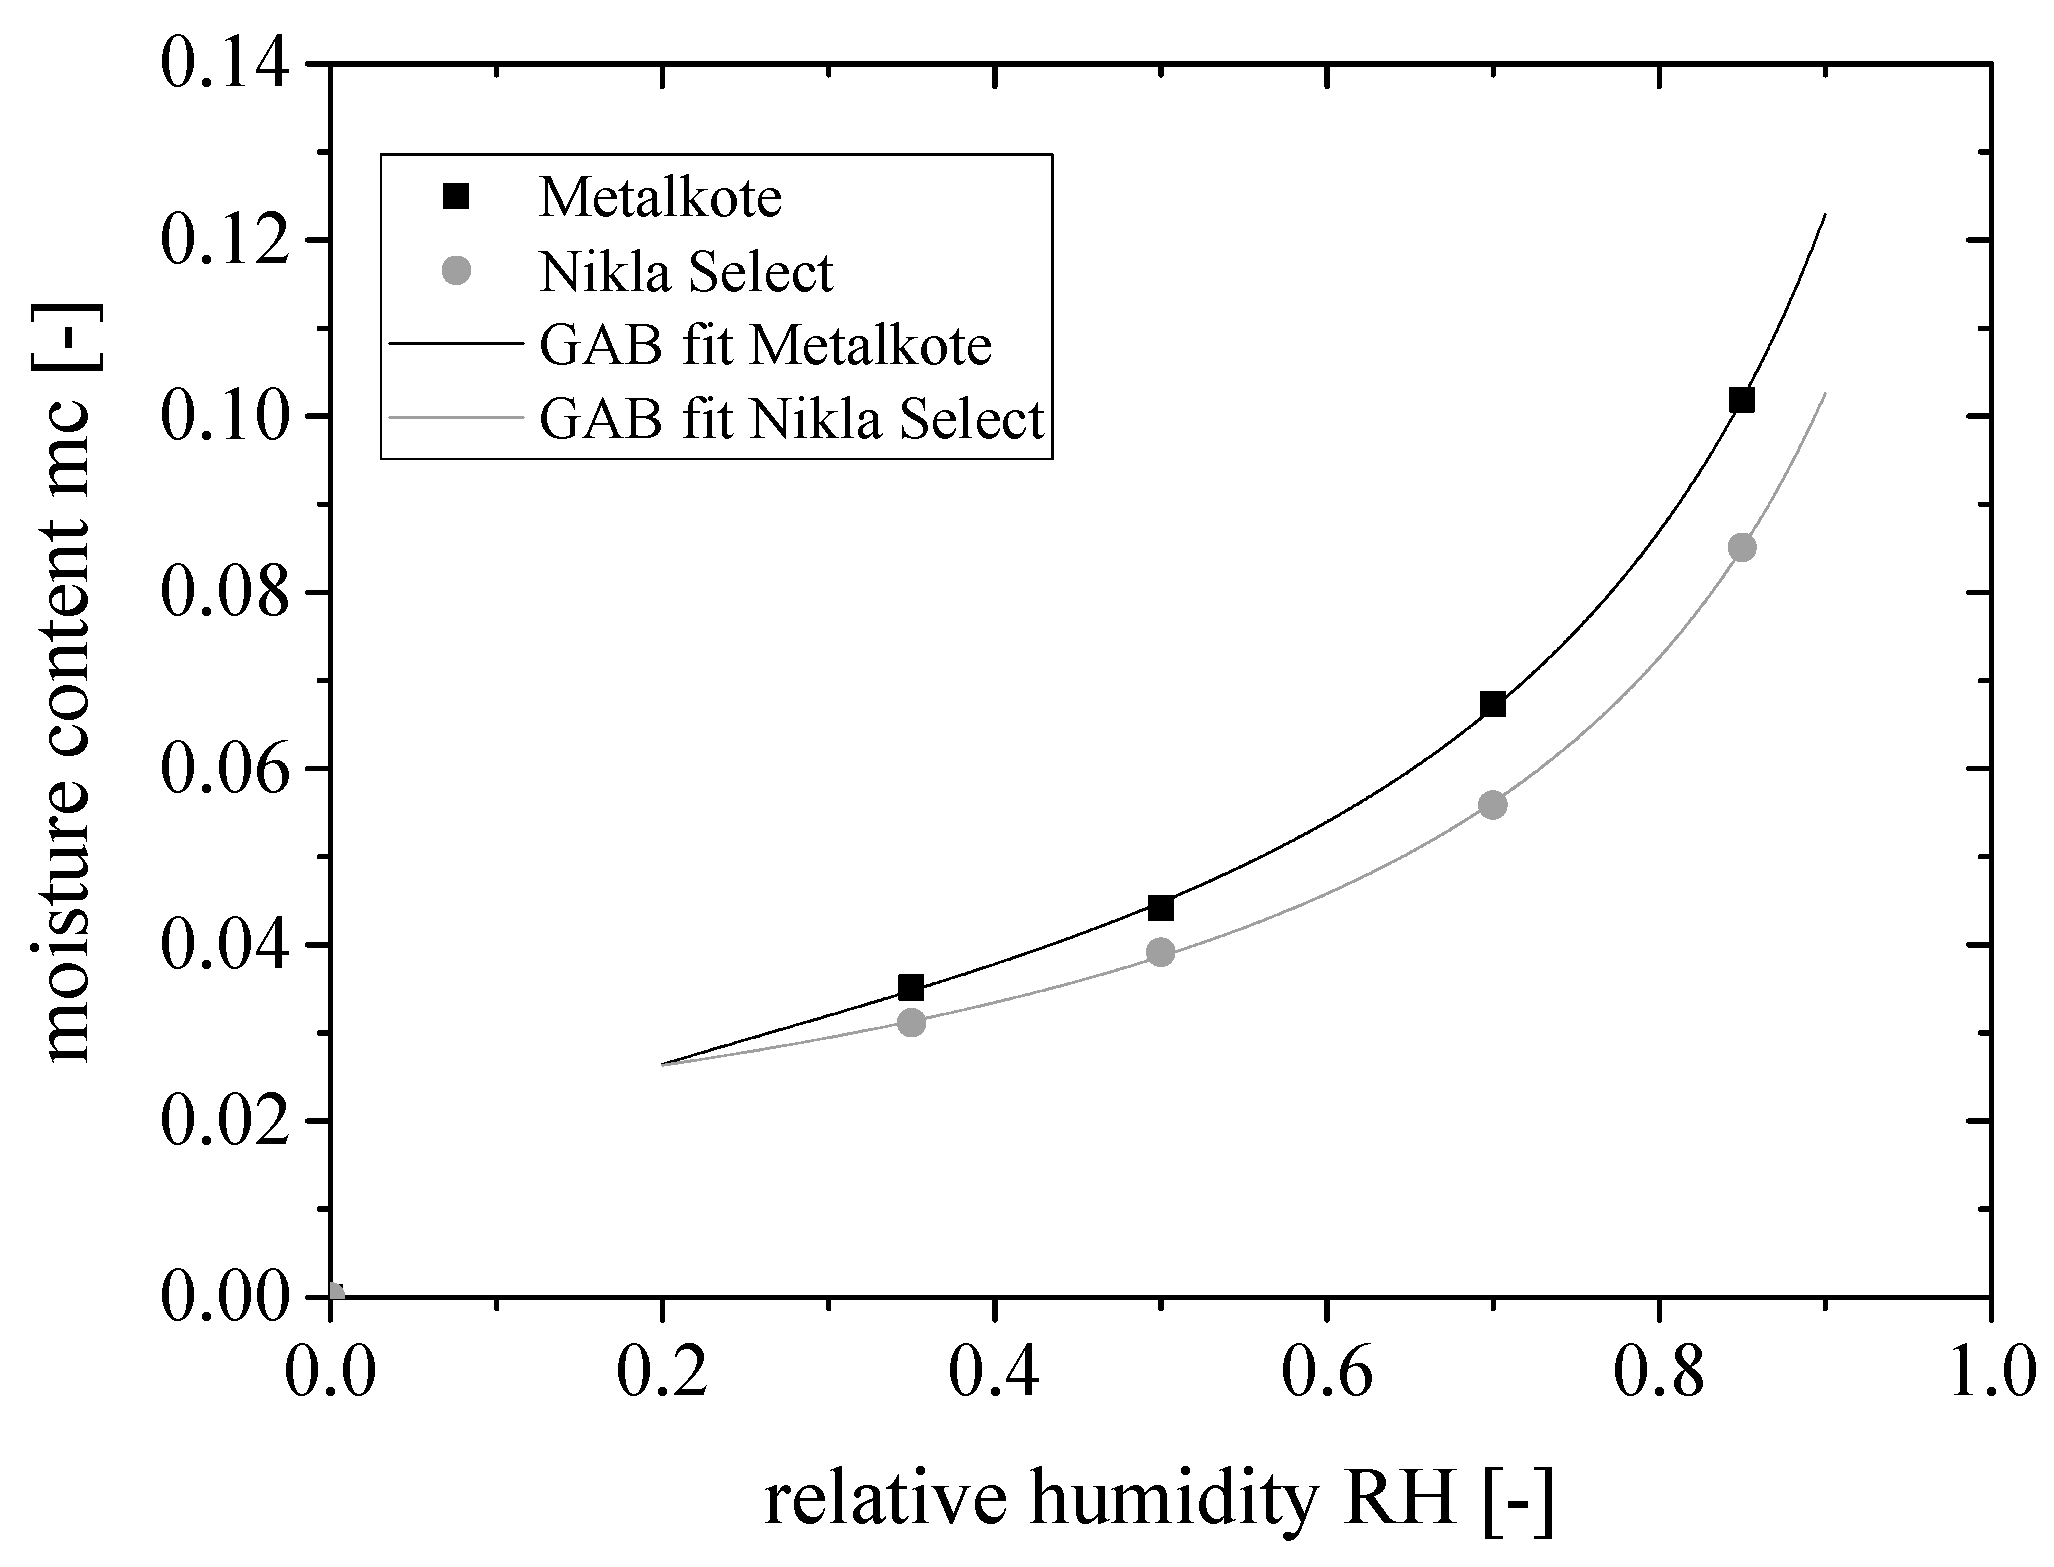
3.3.1. Sorption Isotherm

The relationship between mc and RH for the two paper samples is shown in Figure 9. Within the range 35%–90% RH, the curves were fitted to the GAB Equation (6). The fitted parameters for the GAB equation are shown in Table 1.

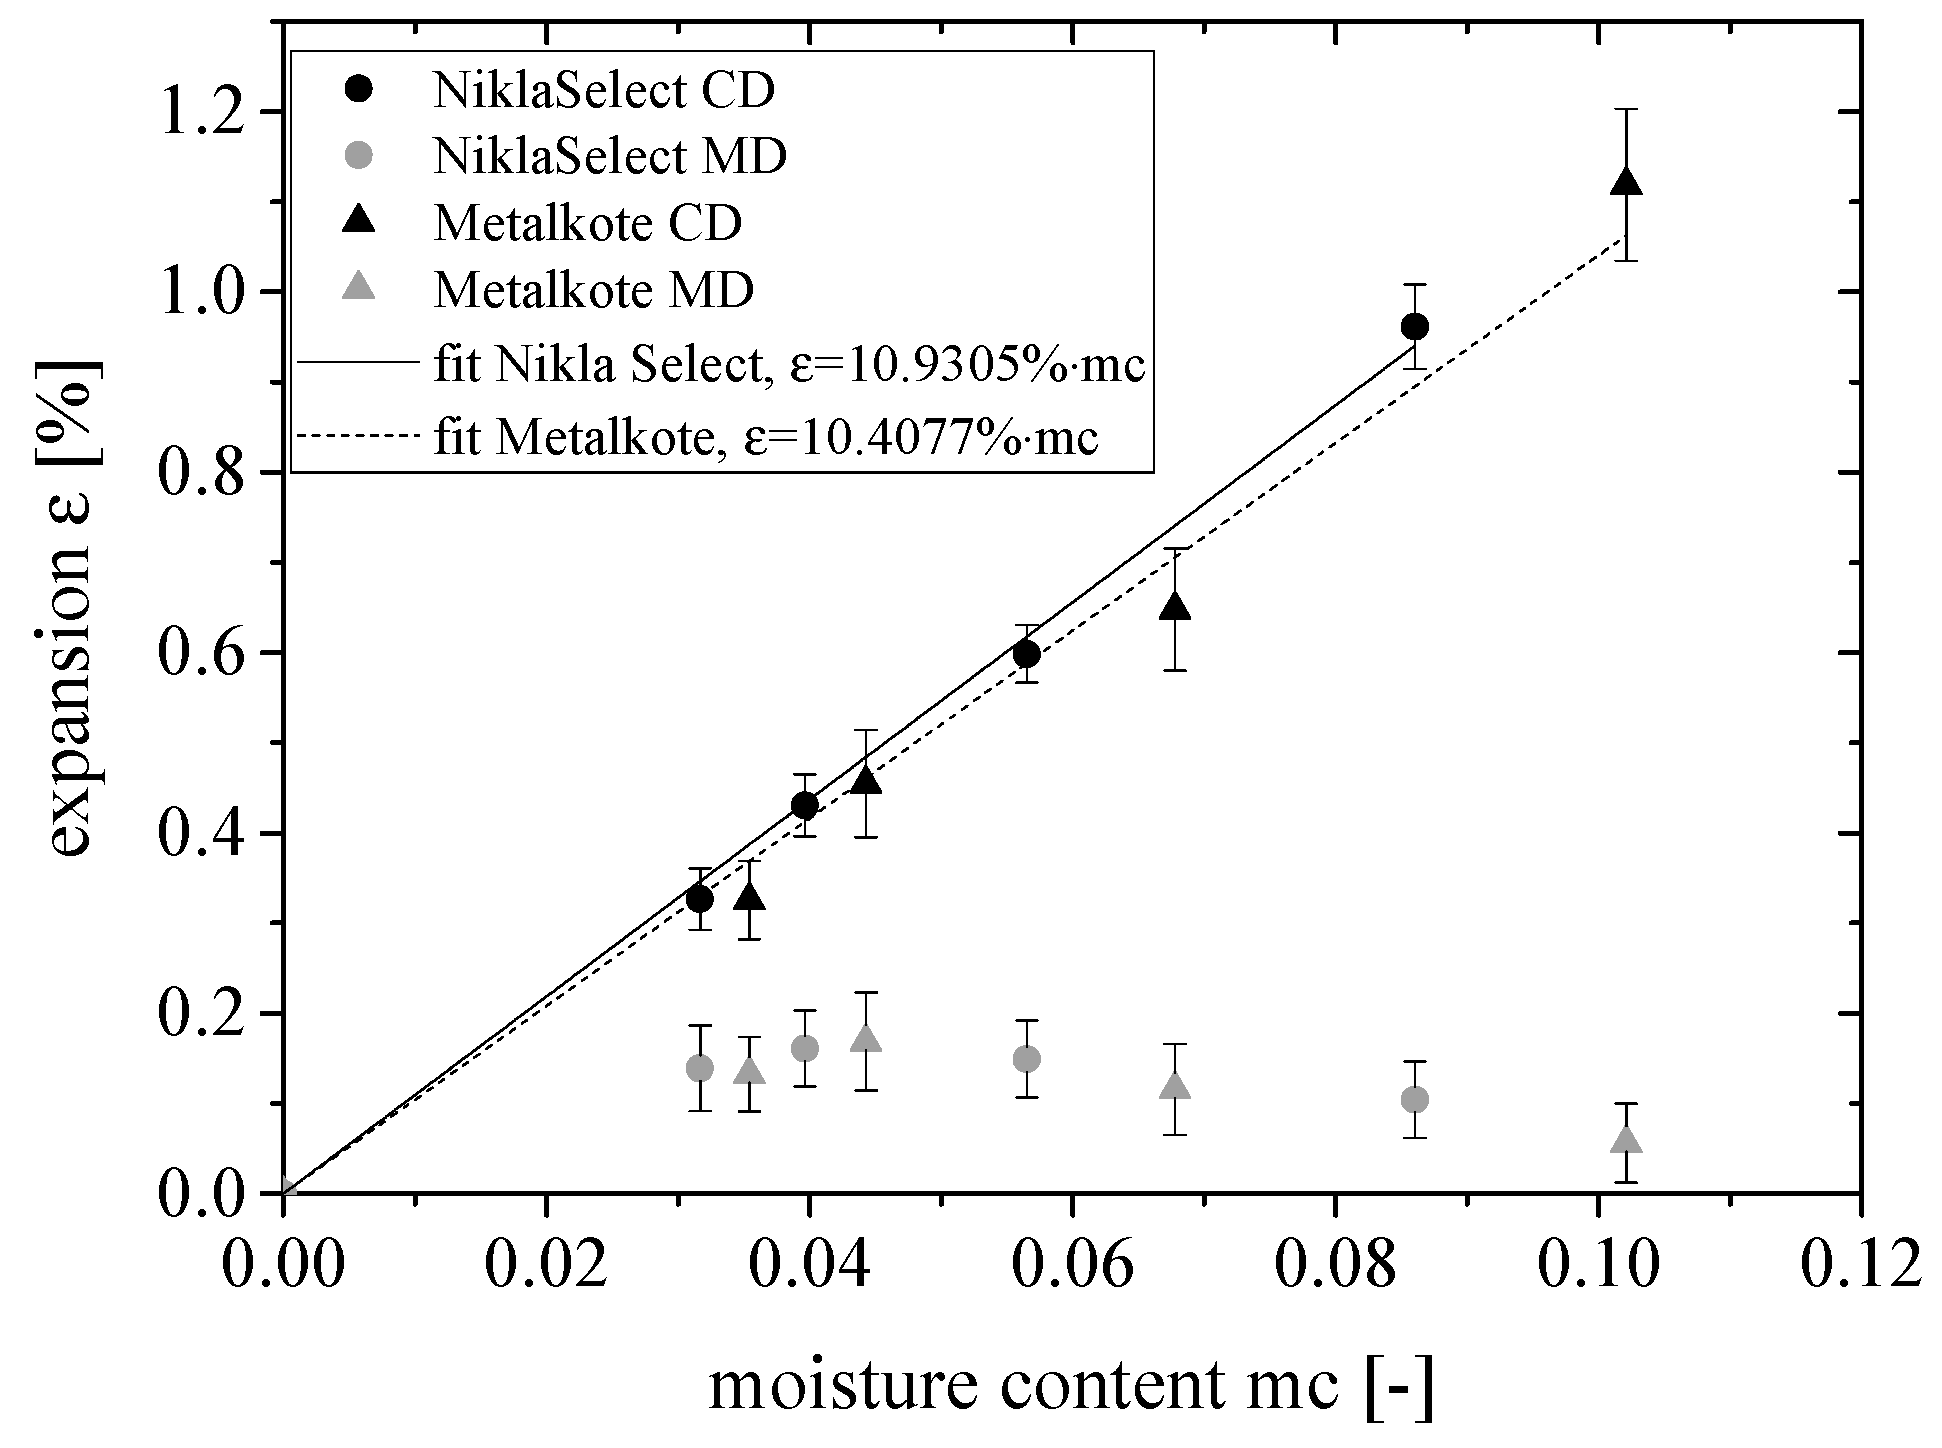
3.3.2. Moisture Content and Hygroexpansion

Fibers in paper expand when they take up moisture. This expansion is greater in the transverse fiber direction and therefore in CD owing to the molecular arrangement of cellulose, hemicellulose, and lignin [31]. In agreement with earlier reports [32,33], hygroexpansion in CD correlates linearly with mc (Figure 10). The relationship is fitted by a linear function with a as the fitting parameter (Equation (16)). In MD, the hygroexpansion appears to be almost constant because the values do not vary significantly (α = 0.05). As the expansion in MD is much lower than in CD, it is disregarded in the following sections.
ε CD = mc · a
with   a Metalkote = 10.4077 %   and   a Nikla   Select = 10.9305 %

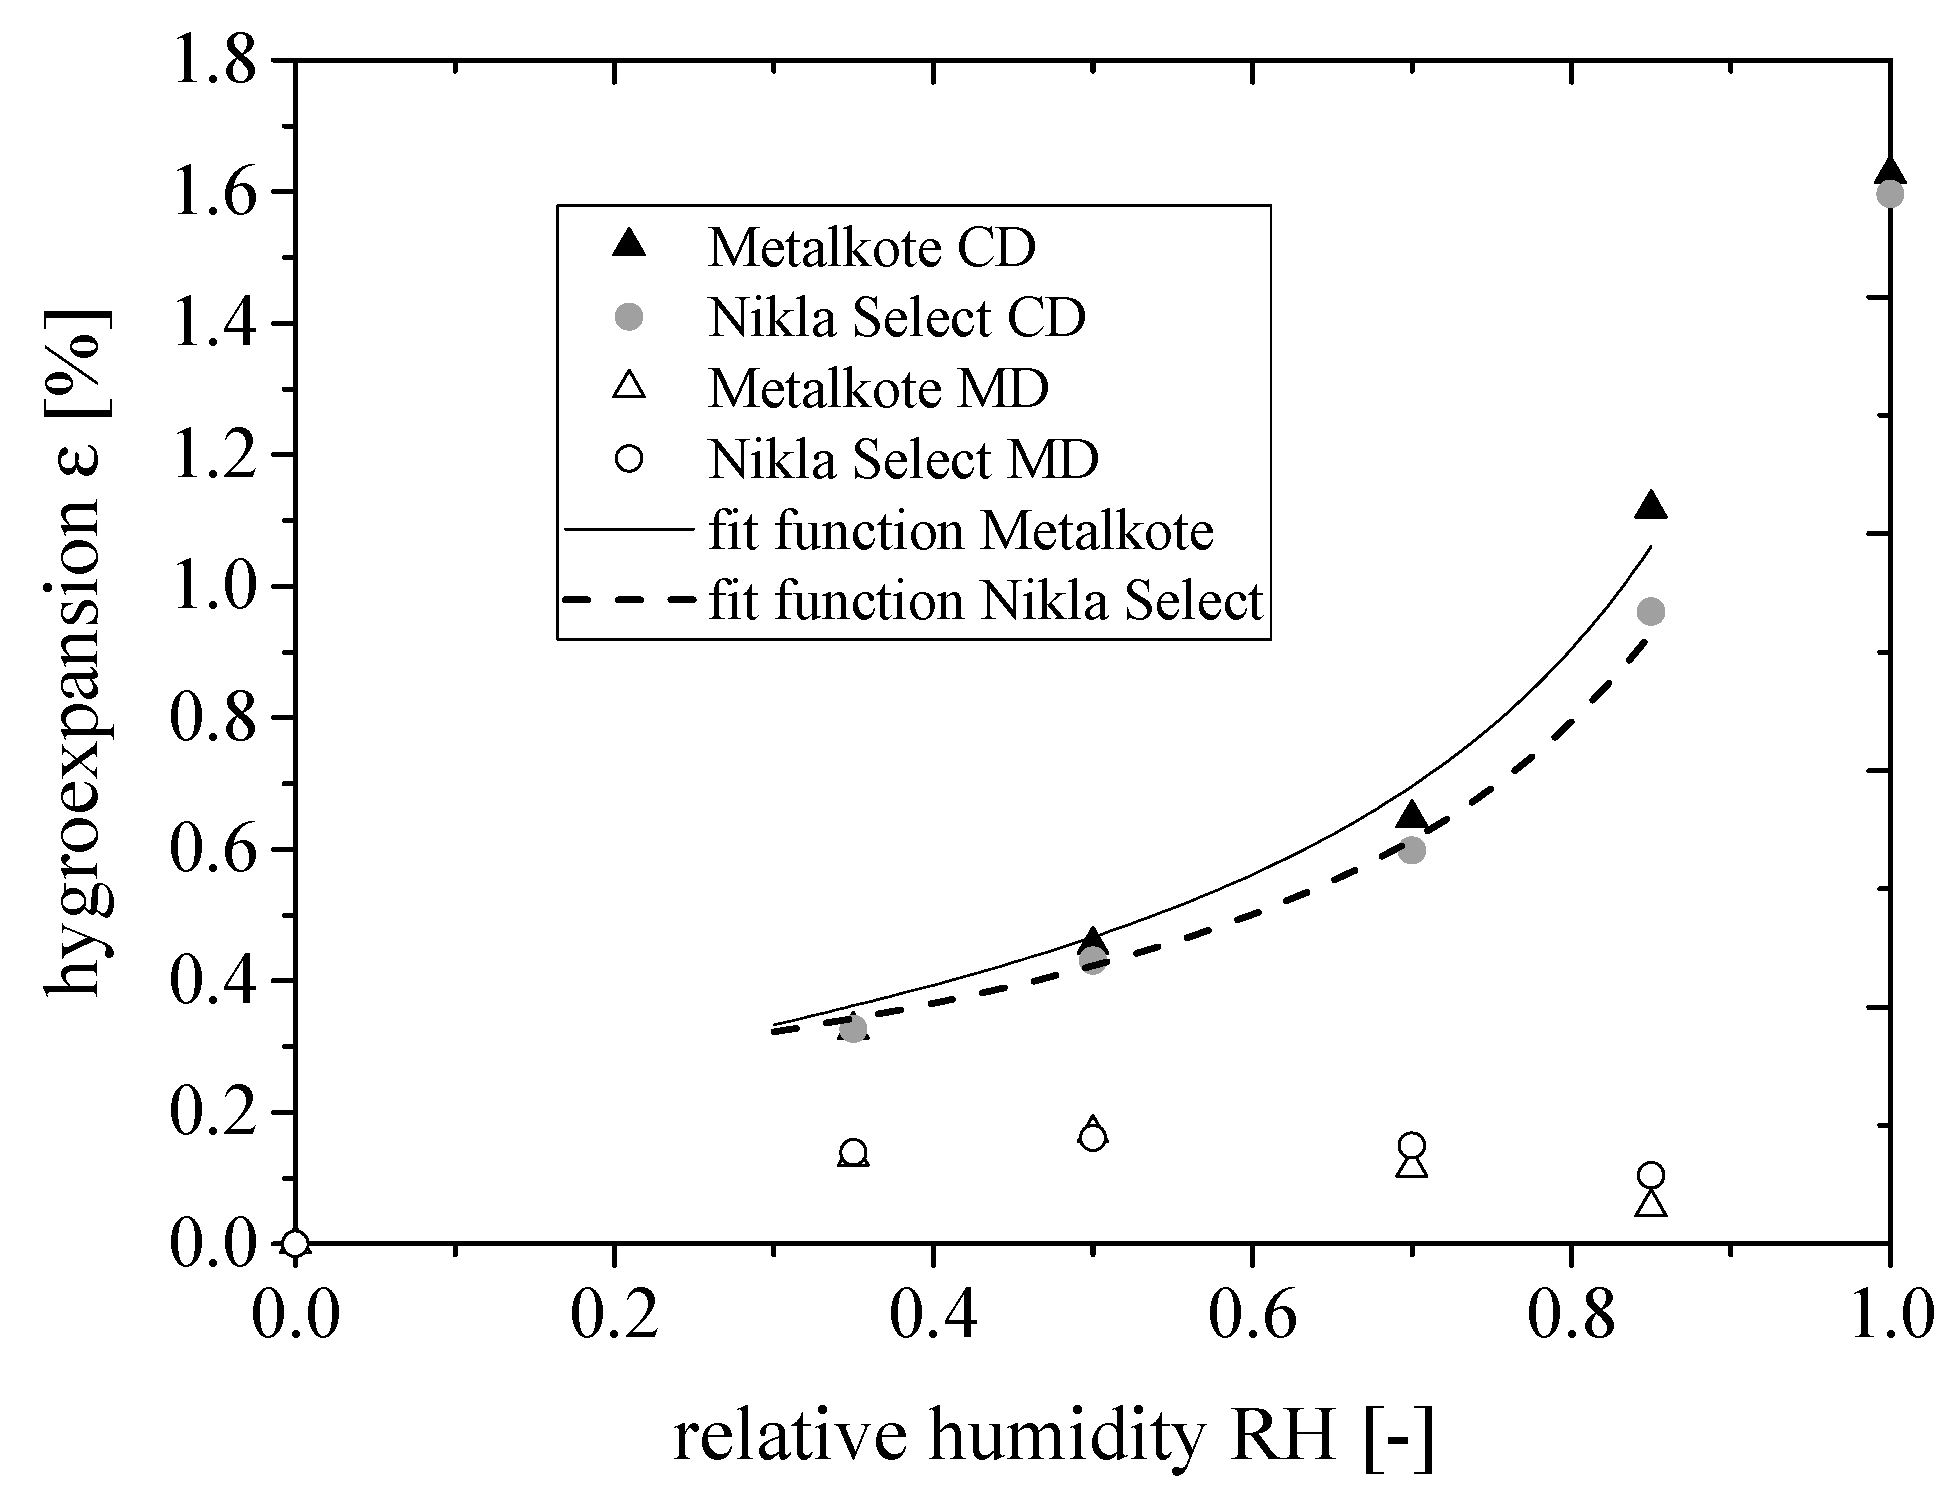
3.3.3. Relative Humidity and Hygroexpansion

In CD, Metalkote expanded significantly (α = 0.05) more than Nikla Select for the same RH value (Figure 11). By combining Equations (6) and (16) with the fitting parameters from Table 1, the relationship between hygroexpansion and RH was modeled, as shown in Equation (17).
ε CD = a · M 0   · c · h · RH ( 1 h · RH ) · ( 1 h · RH + c · h · RH ) .

3.4. Effect of Hygroexpansion on Effective Resistivity

As shown in Section 3.1, sheet resistance and resistivity are strongly dependent on substrate roughness and therefore differ significantly between the coated and non-coated sides of each substrate paper. Moreover, resistance and resistivity are affected by the hygroexpansion of the paper. In order to show the effect of hygroexpansion in isolation from the effect of roughness and thickness, the relative effective resistivity increase γ (rather than resistance or resistivity) is considered in Figure 12, Figure 13 and Figure 14. This value sets the resistivity at a certain RH in relation to the resistivity at 0% RH or 0% hygroexpansion (Equation (3)). Moreover, the effect of aluminum thickness on γ is examined at RH values of 70%, 85%, and 95% (Figure 13 and Figure 14).
We assumed that the aluminum coating forms cracks when the underlying paper expands, thus increasing the resistivity. Aluminum is considered a ductile material, and ductile thin coatings show a more complex fracture behavior than brittle materials. The mechanisms underlying this phenomenon have been extensively reviewed [34,35]. Two generic modes of ductile fracture are (a) failure by void coalescence and (b) failure by instability. In the first case, voids are already present or nucleate at inclusions; then they grow, form necks, and coalesce such that cracks and through thickness cracks appear. Finally, the material ruptures with a complete loss of stress-carrying capacity. In the second case, deformation is localized in thin shear bands arranged in a regular lattice, until the material fractures. In the current study, the first fracture mode is probably applicable because we assume that the paper roughness induces heterogeneity in the aluminum coating. Strain hardening of thin films is not expected because dislocations in metal films can escape due to the limited thickness constraint [15]. In comparison with free-standing films, the strain localization on the film could be suppressed by the substrate due to the geometrical constraint [14,15].
From Figure 12, Figure 13 and Figure 14, the following observations and conclusions can be drawn:
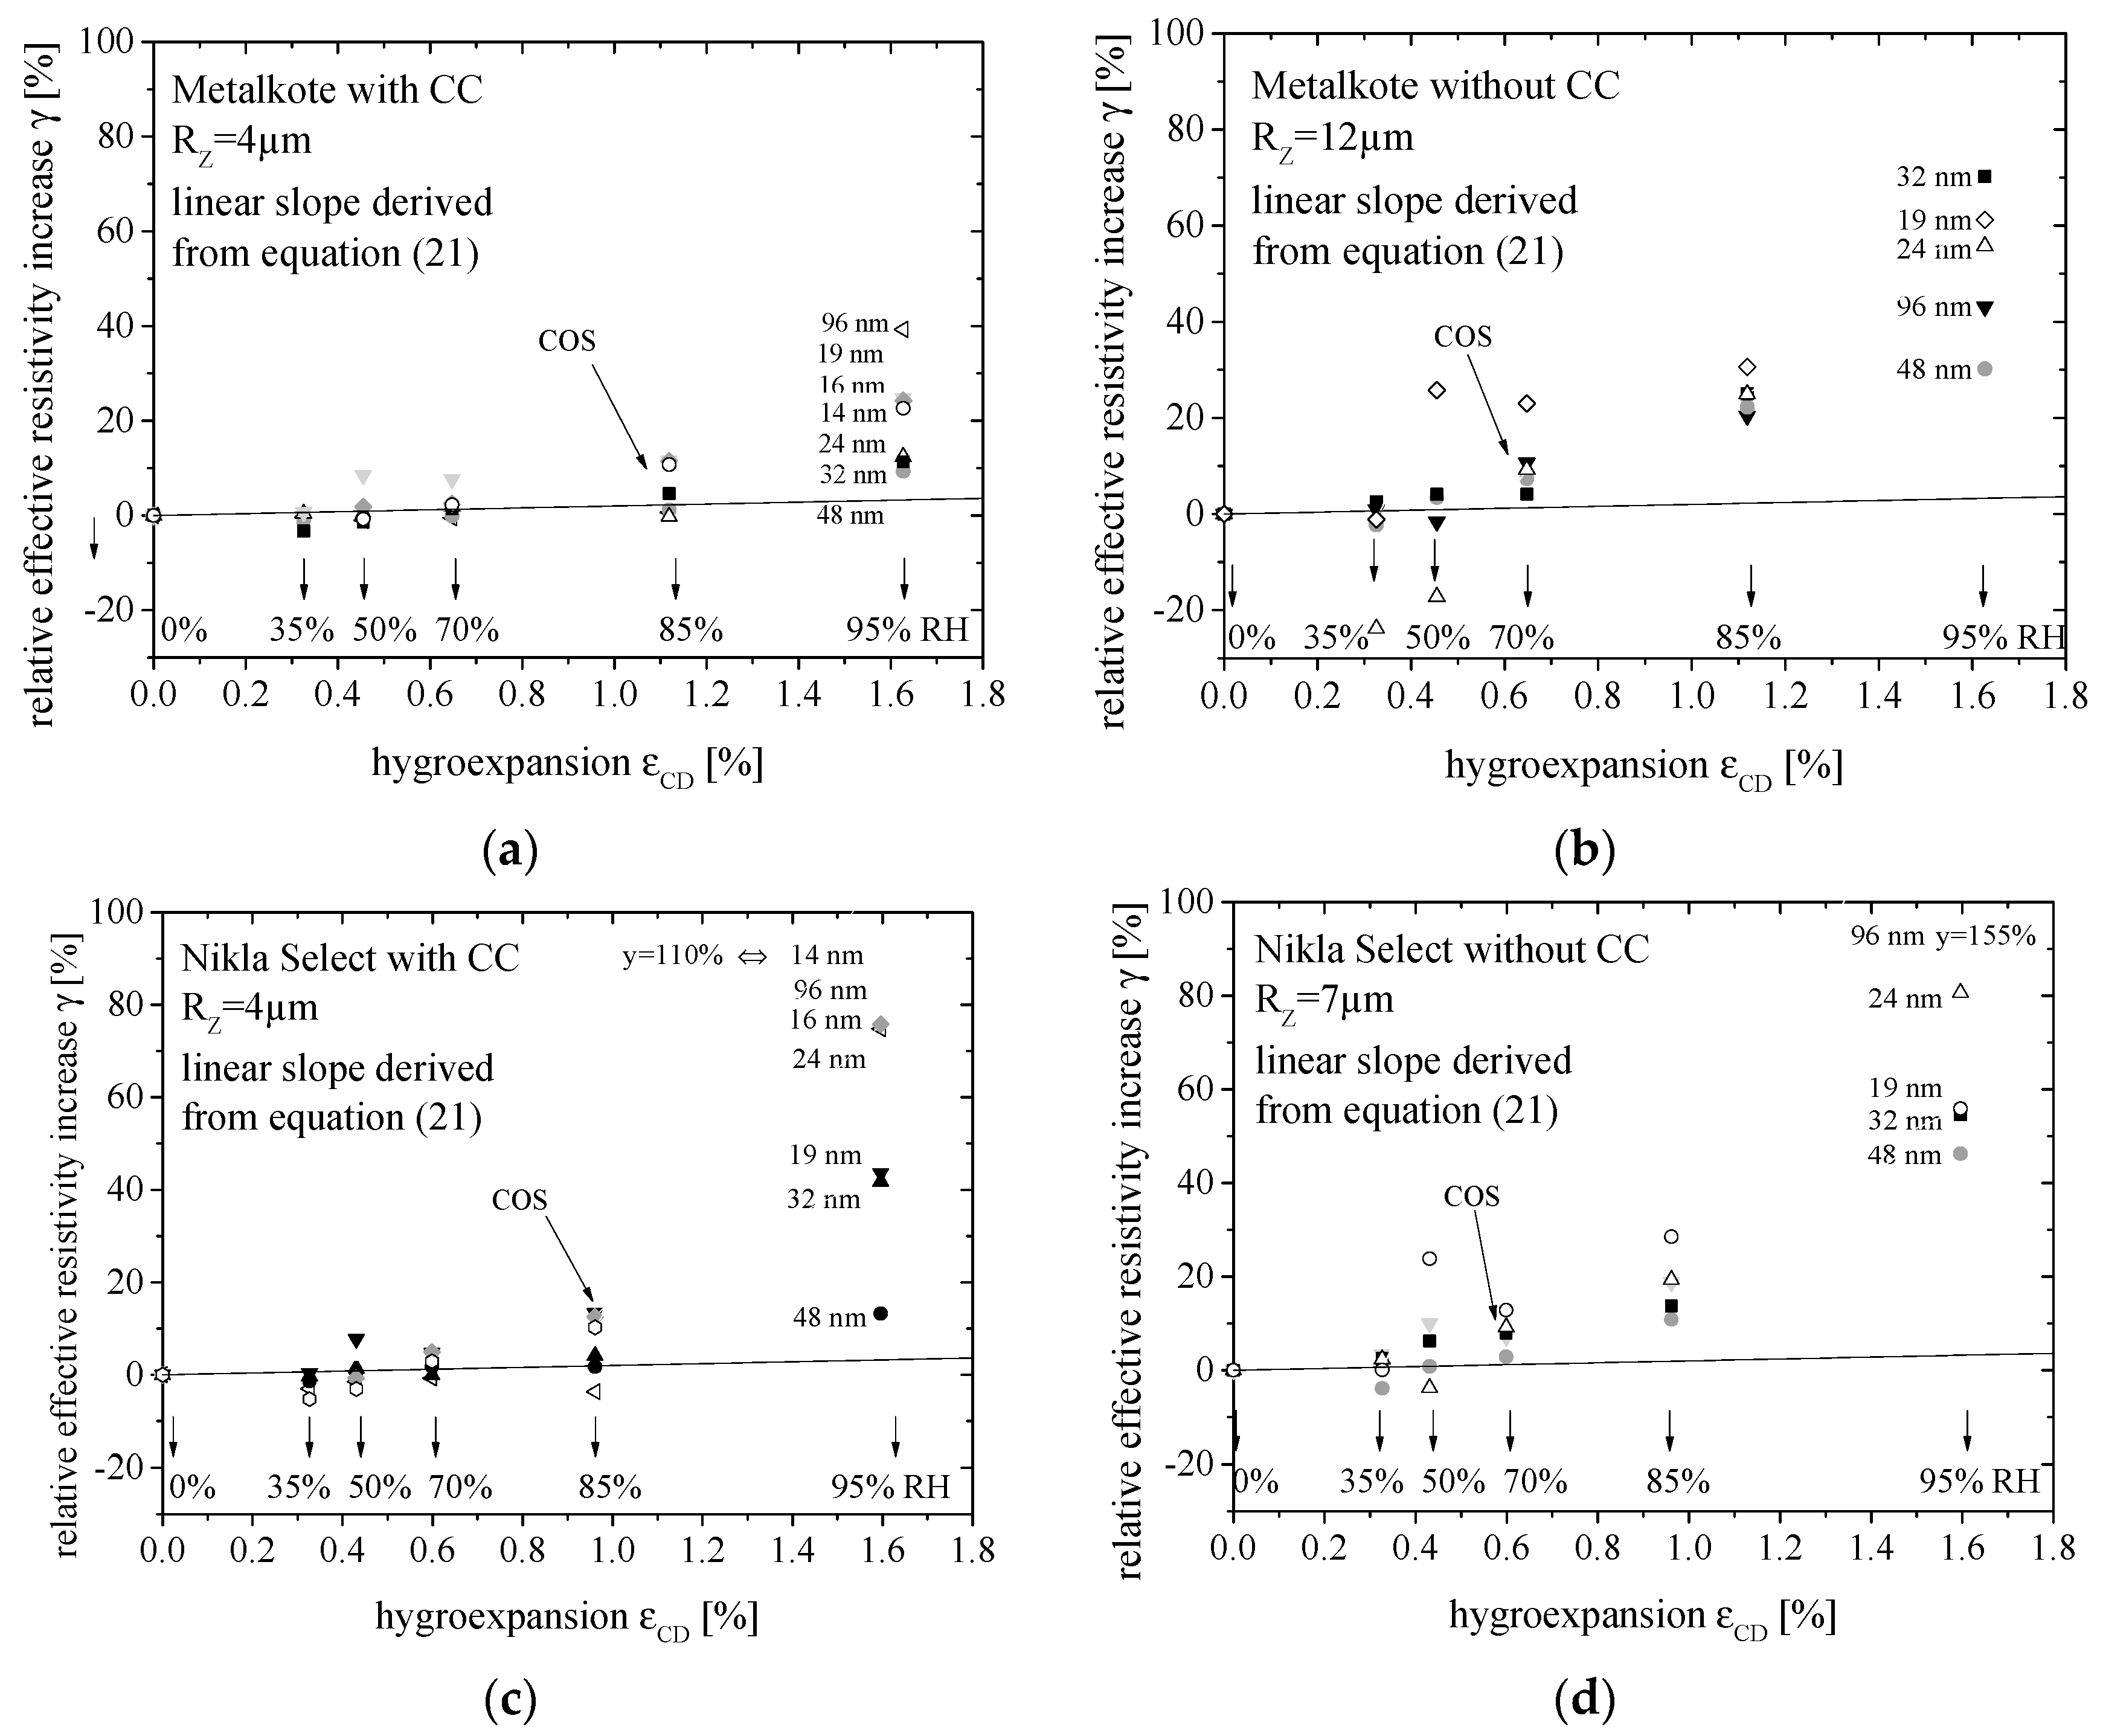
  • Increasing humidity and thus hygroexpansion leads to an increase in resistance and effective resistivity (Figure 12). This implies that aluminum is stretched due to the hygroexpansion of the underlying paper, and hence cracks appear. The values shown are similar to those reported previously [3], where an increase in RH from 35% to 90% at 23 °C increased the resistance by about 40% for silver ink coatings.
  • Initially, the increase in resistivity is almost linear with a strain with a small slope (Figure 12). The initial increase in resistivity follows the theoretical calculation according to Equation (20) [14]. This equation is based on the assumption that the volume of aluminum (cross section A × length l) is constant under tension ε, namely Al = A0l0. Under tension, the material thins out and thus A decreases and l increases due to plastic deformation. From that assumption Equations (18) to (20) are derived. Based on this correlation and Equation (17), γ can be calculated from the RH, as in Equation (21).
    R R 0 = ( l l 0 ) 2
    ρ ρ 0 = ( l l 0 ) 2 = ( 1 + ε ) 2
    γ = ρ ρ 0 1 = ( 1 + ε ) 2 1
    γ = ( 1 + a · M 0   · c · h · RH ( 1 h · RH ) · ( 1 h · RH   + c · h · RH ) ) 2 1
  • Higher substrate roughness leads to more imperfections and thus a lower crack onset strain (COS) (Figure 12). The COS is the strain where γ deviates from the linear region, according to Equations (21) and (20). The COS indicates the appearance of defects in the shapes of necks and cracks in the aluminum. These cracks strongly increase the resistance and thus the nominal resistivity [15]. The COS is reached at RH values of ~70% (εCD ≈ 0.6%) on paper surfaces without CC, but ~85% (εCD ≈ 1.2%) on paper surfaces with CC. This indicates that the COS is lower for rougher surfaces (paper without CC), because higher roughness induces a heterogeneous thickness distribution and thus the appearance of defects. Defects can lead to local necks, which can cause further intense localized deformation, resulting in fast rupture [15].
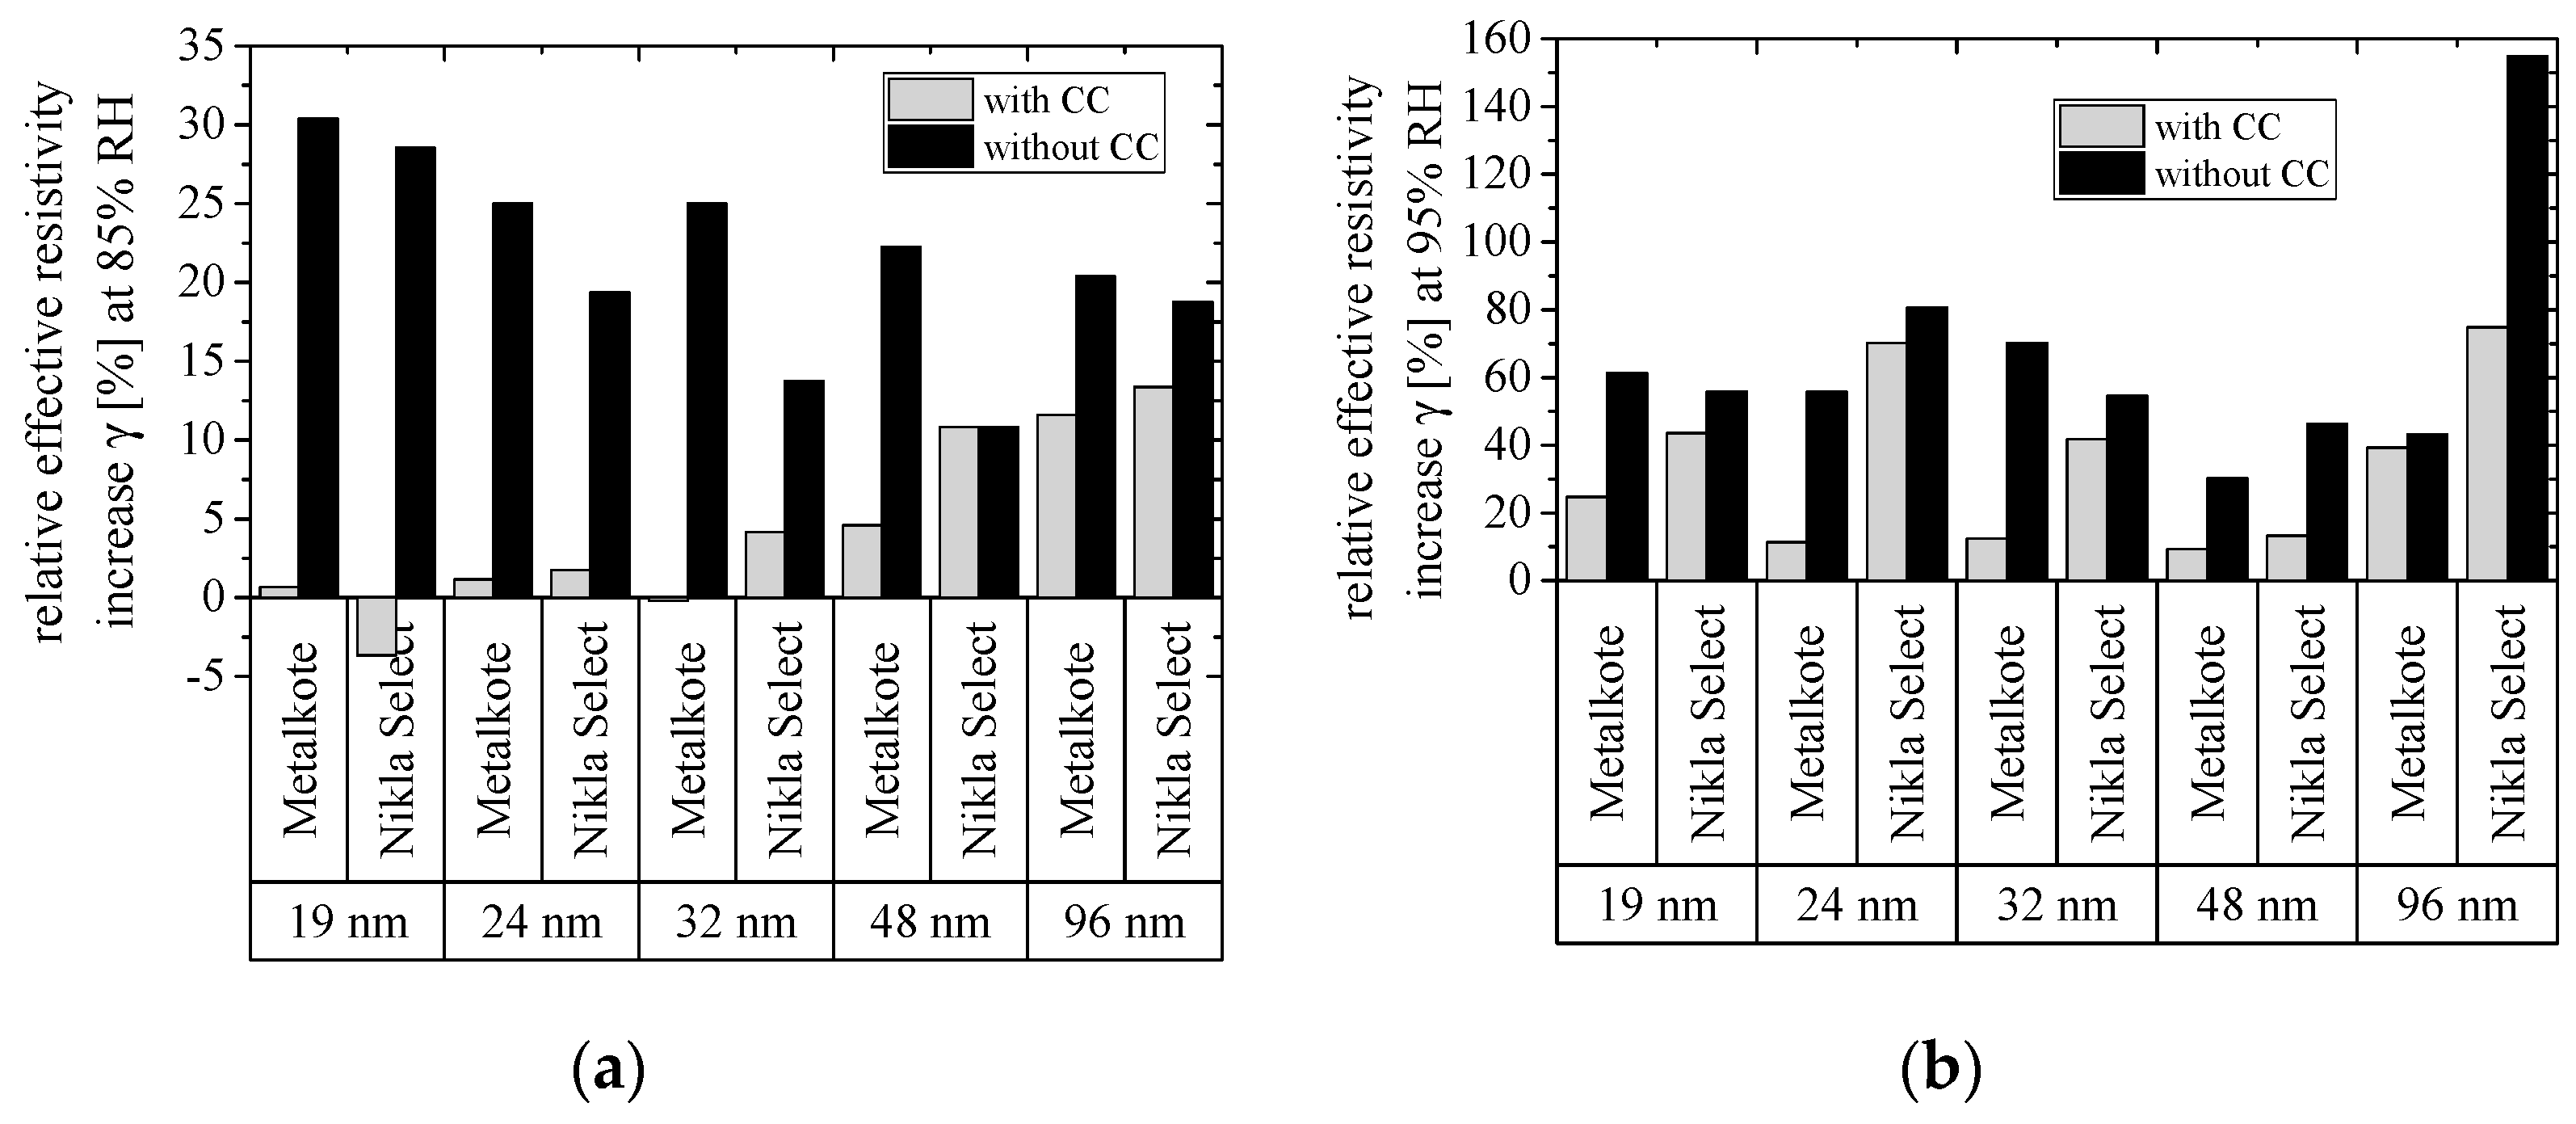
  • Higher substrate roughness leads to more cracks and a higher γ (Figure 14). γ on the rough side of the paper (without CC) is higher than that on the smooth side of the paper (with CC). As described in the previous observation, this leads to more defects, which consequently cause more voids and lead to a higher γ.
  • The effect of aluminum thickness on γ cannot be defined (Figure 14). As the influence of roughness is much more pronounced than the effect of aluminum thickness, no clear correlation between aluminum thickness and γ can be observed. This is in line with the comparably low impact of thickness, as seen in Figure 8.

4. Conclusions

The following conclusions were drawn from the experimental results presented above.
  • Substrate roughness and hygroexpansion both increase the resistance and effective resistivity of aluminum coatings.
  • Hygroexpansion increased the resistivity less than substrate roughness. When aluminum thickness is determined via eddy currents, these factors should either be taken into account or a standard material representing each process/substrate combination should initially be fully characterized, so that each new measurement can be related to the standard material.
  • The effect of substrate roughness and aluminum thickness on resistance and effective resistivity can be mathematically modeled. The effect of substrate roughness becomes more pronounced for thinner coatings.
  • When paper expands due to the uptake of water, the applied aluminum is stretched so that the effective resistivity increases. For low RH values, the relative effective resistivity increase γ correlates linearly with hygroexpansion and can thus easily be linked to RH via basic physical assumptions.
  • γ is higher for rougher substrates. Moreover, aluminum has a lower crack onset strain on rough substrates.
  • The effect of aluminum thickness on the relative effective resistivity increase is low and most probably superimposed by roughness and hygroexpansion.
Various models have been presented to describe phenomena as the effect of hygroexpansion and roughness, such as the model according to the Effective Medium Theory [36,37], Maxwell [38], Maxwell–Garnet [39], Hamilton [40], power law approximation [41], Taylor series [42], percolation models [43,44], bond site models [45,46], and others [20]. However, more data are needed to enable the rational selection and interpretation of such models, which would be desirable for further research.
Moreover, in packaging applications, aluminum coatings are applied as gas barrier coatings. The gas barrier becomes less reliable as the number of defects increases. For such applications, it would be desirable to correlate the effective resistivity with the gas barrier of such coatings.

Author Contributions

Conceptualization, M.L.; Data Curation, J.H.; Formal Analysis, M.L. and J.H.; Investigation, M.L. and J.H.; Methodology, M.L. and J.H.; Supervision, M.R. and H.-C.L.; Visualization, M.L.; Writing—Original Draft, M.L.; Writing—Review and Editing, M.R. and H.-C.L.

Funding

This research received no external funding.

Acknowledgments

The authors gratefully thank Daniel Schlemmer, Michael Stenger, Dieter Bauer and Christine Neumeier for supporting experimental work and for advice.

Conflicts of Interest

The authors declare no conflict of interest.

References

  1. Kirwan, M.J. Handbook of Paper and Paperboard Packaging Technology; Wiley-Blackwell: Oxford, UK, 2012. [Google Scholar]
  2. Joffre, T.; Isaksson, P.; Dumont, P.J.J.; Roscoat, S.R.d.; Sticko, S.; Orgéas, L.; Gamstedt, E.K. A method to measure moisture induced swelling properties of a single wood cell. Exp. Mech. 2016, 56, 723–733. [Google Scholar] [CrossRef]
  3. Wood, L.K.; Hrehorova, E.; Joyce, T.W.; Fleming, P.D.; Joyce, M.; Pekarovicova, A.; Bliznyuk, V. Paper substrates and inks for printed electronics. In Proceedings of the PIRA Ink on Paper Conference, London, UK, 1–3 November 2005. [Google Scholar]
  4. Mueller, K.; Schoenweitz, C.; Langowski, H.-C. Thin laminate films for barrier packaging application—Influence of down gauging and substrate surface properties on the permeation properties. Packag. Technol. Sci. 2012, 25, 137–148. [Google Scholar] [CrossRef]
  5. Kavčič, U.; Pavlovič, L.; Pivar, M.; Đokić, M.; Batagelj, B.; Muck, T. Printed electronics on recycled paper and cardboards. Inf. MIDEM 2013, 43, 50–57. [Google Scholar]
  6. Siegel, A.C.; Phillips, S.T.; Dickey, M.D.; Lu, N.; Suo, Z.; Whitesides, G.M. Foldable printed circuit boards on paper substrates. Adv. Funct. Mater. 2010, 20, 28–35. [Google Scholar] [CrossRef]
  7. Kattumenu, R.; Rebros, M.; Joyce, M.; Fleming, P.D.; Neelgund, G. Effect of substrate properties on conductive traces printed with silver-based flexographic ink. Nordic Pulp Pap. Res. J. 2009, 24, 101–106. [Google Scholar] [CrossRef]
  8. Reinwand, D. Dynamisches Magnetron-Sputterverfahren zur Vorderseitenmetallisierung Kristalliner Silicium-Solarzellen; Shaker: Aachen, Germany, 2012. (In German) [Google Scholar]
  9. Tobjörk, D.; Österbacka, R. Paper electronics. Adv. Mater. 2011, 23, 1935–1961. [Google Scholar] [CrossRef]
  10. Trnovec, B.; Stanel, M.; Hahn, U.; Hübler, A.; Kempa, H.; Sangl, R.; Forster, M. Coated paper for printed electronics. Prof. Papermak. 2009, 104, 48–51. [Google Scholar]
  11. Denneulin, A.; Blayo, A.; Bras, J.; Neuman, C. PEDOT: PSS coating on specialty papers: Process optimization and effects of surface properties on electrical performances. Prog. Org. Coat. 2008, 63, 87–91. [Google Scholar] [CrossRef]
  12. Bishop, C.A. Vacuum Deposition onto Webs, Films and Foils, 2nd ed.; Elsevier: Amsterdam, The Netherlands, 2011. [Google Scholar]
  13. Rogers, J.A.; Someya, T.; Huang, Y. Materials and mechanics for stretchable electronics. Science 2010, 327, 1603–1607. [Google Scholar] [CrossRef]
  14. Lu, N.; Wang, X.; Suo, Z.; Vlassak, J. Metal films on polymer substrates stretched beyond 50%. Appl. Phys. Lett. 2007, 91, 221909. [Google Scholar] [CrossRef]
  15. Niu, R.; Liu, G.; Wang, C.; Zhang, G.; Ding, X.; Sun, J. Thickness dependent critical strain in submicron Cu films adherent to polymer substrate. Appl. Phys. Lett. 2007, 90, 161907. [Google Scholar] [CrossRef]
  16. Berger, J.; Glushko, O.; Marx, V.M.; Kirchlechner, C.; Cordill, M.J. Effect of microstructure on the electro-mechanical behaviour of Cu films on polyimide. J. Miner. Met. Mater. Soc. 2016, 68, 1640–1646. [Google Scholar] [CrossRef]
  17. Glushko, O.; Cordill, M. Electrical resistance of metal films on polymer substrates under tension. Exp. Tech. 2016, 40, 303–310. [Google Scholar] [CrossRef]
  18. Polywka, A.; Stegers, L.; Krauledat, O.; Riedl, T.; Jakob, T.; Görrn, P. Controlled mechanical cracking of metal films deposited on polydimethylsiloxane (PDMS). Nanomaterials 2016, 6, 168. [Google Scholar] [CrossRef] [PubMed]
  19. Hamasha, M.M.; Alzoubi, K.; Switzer, J.C.; Lu, S.; Desu, S.B.; Poliks, M. A study on crack propagation and electrical resistance change of sputtered aluminum thin film on poly ethylene terephthalate substrate under stretching. Thin Solid Films 2011, 519, 7918–7924. [Google Scholar] [CrossRef]
  20. Cairns, D.R.; Witte, R.P.; Sparacin, D.K.; Sachsman, S.M.; Paine, D.C.; Crawford, G.P.; Newton, R. Strain-dependent electrical resistance of tin-doped indium oxide on polymer substrates. Appl. Phys. Lett. 2000, 76, 1425–1427. [Google Scholar] [CrossRef]
  21. Torvinen, K.; Sievänen, J.; Hjelt, T.; Hellén, E. Smooth and flexible filler-nanocellulose composite structure for printed electronics applications. Cellulose 2012, 19, 821–829. [Google Scholar] [CrossRef]
  22. Totten, G.E.; MacKenzie, D.S. Handbook of Aluminum: Vol. 1: Physical Metallurgy and Processes; Dekker: New York, NY, USA, 2003. [Google Scholar]
  23. Lindner, M.; Schmid, M. Thickness measurement methods for physical vapor deposited aluminum coatings in packaging applications: A review. Coatings 2017, 7, 9. [Google Scholar] [CrossRef]
  24. Parker, M.E.; Bronlund, J.E.; Mawson, A.J. Moisture sorption isotherms for paper and paperboard in food chain conditions. Packag. Technol. Sci. 2006, 19, 193–209. [Google Scholar] [CrossRef]
  25. Everett, D.H. Adsorption hysteresis. Solid-Gas Interface 1967, 2, 1055–1113. [Google Scholar]
  26. Quirijns, E.J.; Van Boxtel, A.J.; van Loon, W.K.; Van Straten, G. Sorption isotherms, gab parameters and isosteric heat of sorption. J. Sci. Food Agric. 2005, 85, 1805–1814. [Google Scholar] [CrossRef]
  27. Geometrical Product Specifications (GPS)—Surface Texture: Profile Method—Rules and Procedures for the Assessment of Surface Texture (ISO 4288:1996); German Version EN ISO 4288:1997; German Institute for Standardization: Berlin, Germany, 1998. (In German)
  28. Geometrical Product Specifications (GPS)—Surface Texture: Profile Method—Nominal Characteristics of Contact (Stylus) Instruments (ISO 3274:1996); German Version EN ISO 3274:1997; German Institute for Standardization: Berlin, Germany, 1998. (In German)
  29. Sorg, H. Praxis der Rauheitsmessung und Oberflächenbeurteilung; Hanser: Munich, Germany, 1995. (In German) [Google Scholar]
  30. Liu, H.D.; Zhao, Y.P.; Ramanath, G.; Murarka, S.P.; Wang, G.C. Thickness dependent electrical resistivity of ultrathin (<40 nm) Cu films. Thin Solid Films 2001, 384, 151–156. [Google Scholar]
  31. Lindner, M. Factors affecting the hygroexpansion of paper. J. Mater. Sci. 2017, 53, 1–26. [Google Scholar] [CrossRef] [Green Version]
  32. Larsson, P. Hygro-and Hydroexpansion of Paper. Ph.D. Thesis, KTH Royal Institute of Technology, Stockholm, Sweden, 2010. [Google Scholar]
  33. Lavrykov, S.A.; Ramarao, B.V.; Lyne, O.L. The planar transient hygroexpansion of copy paper: Experiments and analysis. Nordic Pulp Pap. Res. J. 2004, 19, 183–190. [Google Scholar] [CrossRef]
  34. Pineau, A.; Amine Benzerga, A.; Pardoen, T. Failure of metals iii: Fracture and fatigue of nanostructured metallic materials. Acta Mater. 2016, 107, 508–544. [Google Scholar] [CrossRef]
  35. Pineau, A.; Benzerga, A.A.; Pardoen, T. Failure of metals i: Brittle and ductile fracture. Acta Mater. 2016, 107, 424–483. [Google Scholar] [CrossRef]
  36. Bruggeman, V.D. Berechnung verschiedener physikalischer konstanten von heterogenen substanzen. I. Dielektrizitätskonstanten und leitfähigkeiten der mischkörper aus isotropen substanzen. Ann. Phys. 1935, 416, 636–664. (In German) [Google Scholar] [CrossRef]
  37. Landauer, R. The electrical resistance of binary metallic mixtures. J. Appl. Phys. 1952, 23, 779–784. [Google Scholar] [CrossRef]
  38. Levin, M.; Miller, M. Maxwell a treatise on electricity and magnetism. Uspekhi Fizicheskikh Nauk 1981, 135, 425–440. [Google Scholar] [CrossRef]
  39. Landauer, R. Electrical transport and optical properties of inhomogeneous media. In Proceedings of the First Conference on the Electrical Transport and Optical Properties of Inhomogeneous Media, American Institute of Physics Conference Proceedings, Columbus, OH, USA, 7–9 September 1977; Garland, J.C., Tanner, D.B., Eds.; American Institute of Physics: New York, NY, USA, 1978. [Google Scholar]
  40. Hamilton, R.L.; Crosser, O. Thermal conductivity of heterogeneous two-component systems. Ind. Eng. Chem. Fundam. 1962, 1, 187–191. [Google Scholar] [CrossRef]
  41. Nakajima, H. Fabrication, properties, and applications of porous metals with directional pores. Proc. Jpn. Acad. Ser. B 2010, 86, 884–899. [Google Scholar] [CrossRef] [Green Version]
  42. Kraker, P.T.; Glushko, O.; Cordill, M.J. Relationship between cracking and resistance increase in polymer-supported metal films under mechanical load. Presented at Materials Science and Engineering Conference, Darmstadt, Germany, 27–29 September 2016. [Google Scholar]
  43. Krcho, S. Electron percolation in copper infiltrated carbon. Int. J. Electr. Eng. 2015, 66, 339–343. [Google Scholar]
  44. Feng, Y.; Zheng, H.; Zhu, Z.; Zu, F. The microstructure and electrical conductivity of aluminum alloy foams. Mater. Chem. Phys. 2003, 78, 196–201. [Google Scholar] [CrossRef]
  45. Cox, H.L. The elasticity and strength of paper and other fibrous materials. Br. J. Appl. Phys. 1952, 3, 72. [Google Scholar] [CrossRef]
  46. Panek, J.C. Fragmentation of Brittle Polymeric Toner Line Caused by Swelling of Paper Substrate during Immersion in Water. Ph.D. Thesis, Michigan Technological University, Houghton, MI, USA, 1999. [Google Scholar]
Figure 1. Defects appearing on rough surfaces.
Coatings 09 00033 g001
Figure 2. Details of the experimental procedures and work flow used in this study. Following abbreviations are used: RH: relative humidity; mc: moisture content; ICP-MS: inductively coupled plasma-mass spectrometry, and R: sheet resistance.
Coatings 09 00033 g002
Figure 3. SEM images of the four paper surfaces that were PVD-coated with aluminum. Scale bars indicate 10 and 1 µm, respectively. The visible surface roughness induces defects in the aluminum coating and increases the electrical resistance.
Coatings 09 00033 g003
Figure 4. Correlation between sheet resistance and aluminum thickness (lines are included for visual clarity).
Coatings 09 00033 g004
Figure 5. Correlation between aluminum thickness and resistivity; fitted black lines according to Equation (12).
Coatings 09 00033 g005
Figure 6. f(RZ) describes the effect of RZ on the variable resistivity ρn
Coatings 09 00033 g006
Figure 7. Effect of substrate roughness on minimum effective resistivity ρOFFSET
Coatings 09 00033 g007
Figure 8. Correlation between substrate roughness RZ, aluminum thickness dNOMINAL, and effective resistivity ρEFF, as described by Equation (15).
Coatings 09 00033 g008
Figure 9. Effect of relative humidity on moisture content for Metalkote and Nikla Select.
Coatings 09 00033 g009
Figure 10. Effect of moisture content on hygroexpansion; whiskers indicate standard deviation.
Coatings 09 00033 g010
Figure 11. Effect of relative humidity on hygroexpansion in cross direction and machine direction.
Coatings 09 00033 g011
Figure 12. (a) Metalkote with clay coating; (b) Metalkote without clay coating; (c) Nikla Select with clay coating; (d) Nikla Select without clay coating. Correlation between the relative effective resistivity increase (γ) and CD hygroexpansion of Metalkote and Nikla Select on the sides of paper with and without clay coating (CC). γ sets the resistivity at a certain relative humidity (RH) in relation to the resistivity at 0% RH or 0% hygroexpansion, respectively. The linear slope represents the increase of resistivity due to the pure three-dimensional deformation, as described in Equations (20) and (21). Hygroexpansion, substrate roughness, and aluminum thickness affect γ and the crack onset strain (COS).
Coatings 09 00033 g012
Figure 13. Relative effective resistivity increase (γ) at the crack onset strain (COS). This was at 85% relative humidity (RH) on Metalkote and Nikla Select with a clay coating (CC) and 70% RH on Metalkote and Nikla Select without a clay coating.
Coatings 09 00033 g013
Figure 14. (a) Relative effective resistivity increase (γ) at 85% relative humidity (RH); (b) relative effective resistivity increase (γ) at 95% RH. Each for different aluminum thicknesses. No clear impact of thickness is visible. However, rougher surfaces led to greater γ (compare cases with and without clay coating [CC]).
Coatings 09 00033 g014
Table 1. Fitted parameters for GAB equation.
ParameterMetalkoteNikla Select
M00.026930.02177
C20.25593382.55465
h0.870960.87546

