
Air Temperature and Death Rates in the Continental U.S., 1968–2013

Hart Chiropractic, Greenville, SC 29615, USA
Climate 2015, 3(2), 435-441; https://doi.org/10.3390/cli3020435
Submission received: 21 May 2015
/
Revised: 12 June 2015
/
Accepted: 15 June 2015
/
Published: 18 June 2015
(This article belongs to the Special Issue Climate Impacts on Health)
Abstract
:A previous test of global warming theory, on a local level, for Texas revealed inverse correlations between air temperature and death rates. The present study expands the test field to the continental U.S. Using an ecological design, mean daily maximum air temperature (“temperature”) in the 48 contiguous states plus the District of Columbia by year from 1968–2013 was compared to age-adjusted all-cause mortality (“deaths”) in these same jurisdictions for the same years using Pearson correlation (n = 46 years). The comparison was made for three race categories, white, black, and all races, where each category included all ages and both genders. There was 5.0 degree F range for the years studied (62.7–67.7 degrees F). Correlations were moderate strength, inverse, and statistically significant, as follows. Whites: r = −0.576, p < 0.0001; Blacks: r = −0.556, p = 0.0001; and all races: r = −0.577, p < 0.0001. These correlations are consistent with the Texas study, both of which indicated that warmer years tended to correlate with decreased death rates. A limitation to this research is its (ecological) design, but is an initial step towards further investigation.
1. Introduction
Global warming is characterized by the U.S. EPA as a 1.4 degree increase in the last century [1]. Adverse predictions regarding death rates have been made in regard to “climate change” [2,3]. Many of these adverse predictions are based on educated guesses, known as modeling, though some are based on actual (historical) data [2,3]. One of these studies used various statistical manipulations, revealing increased mortality for both low and high air temperatures [3]. Conversely, previous research that used a geographical design, comparing death rates and temperature by county failed to show a trend of higher death rates in the warmer counties [4,5]. Other research on global warming theory was conducted for the state of Texas using a time-series design, comparing air temperature by year to death rates for matching years over a 46 year period [6]. That study revealed inverse relationships between temperature and death rates, where warmer years tended to correlate with lower death rates. Thus, it is not clear as to whether warmer temperatures (excluding heat waves) are associated with higher death rates. Consequently, the present study seeks to simply add to the body of knowledge on this topic by using a time-series design for the continental U.S.
2. Methods
Average age-adjusted all-cause death rates per 100,000 in the continental U.S., all ages, both genders (“death rates”) by year were obtained for all available years at the CDC Wonder website, 1968–2013 [7]. Three race categories were studied: (1) all races combined; (2) blacks; and (3) whites. Average daily maximum air temperature (“temperatures”) in degrees Fahrenheit for all available U.S. jurisdictions—the 48 contiguous states and District of Columbia—were obtained from National Oceanic and Atmospheric Administration (NOAA) databases for matching years (1968–2013) [8]. Alaska and Hawaii temperature data were not available at NOAA databases and therefore were not included in the study.
Using an ecological design, death rates for the three race categories by year were compared to temperatures by year using correlation analysis. Scatter plots for the three race categories vs. temperatures revealed reasonable linear relationships. Probability plots for all four variables (three race categories and temperature) revealed satisfactory normality of the data. Thus, Pearson correlation was considered appropriate for these data and was performed in Stata IC 12.1 (StataCorp, College Station, TX, USA). Two-tailed p-values less than or equal to the conventional alpha level of 0.05 were considered statistically significant.
3. Results
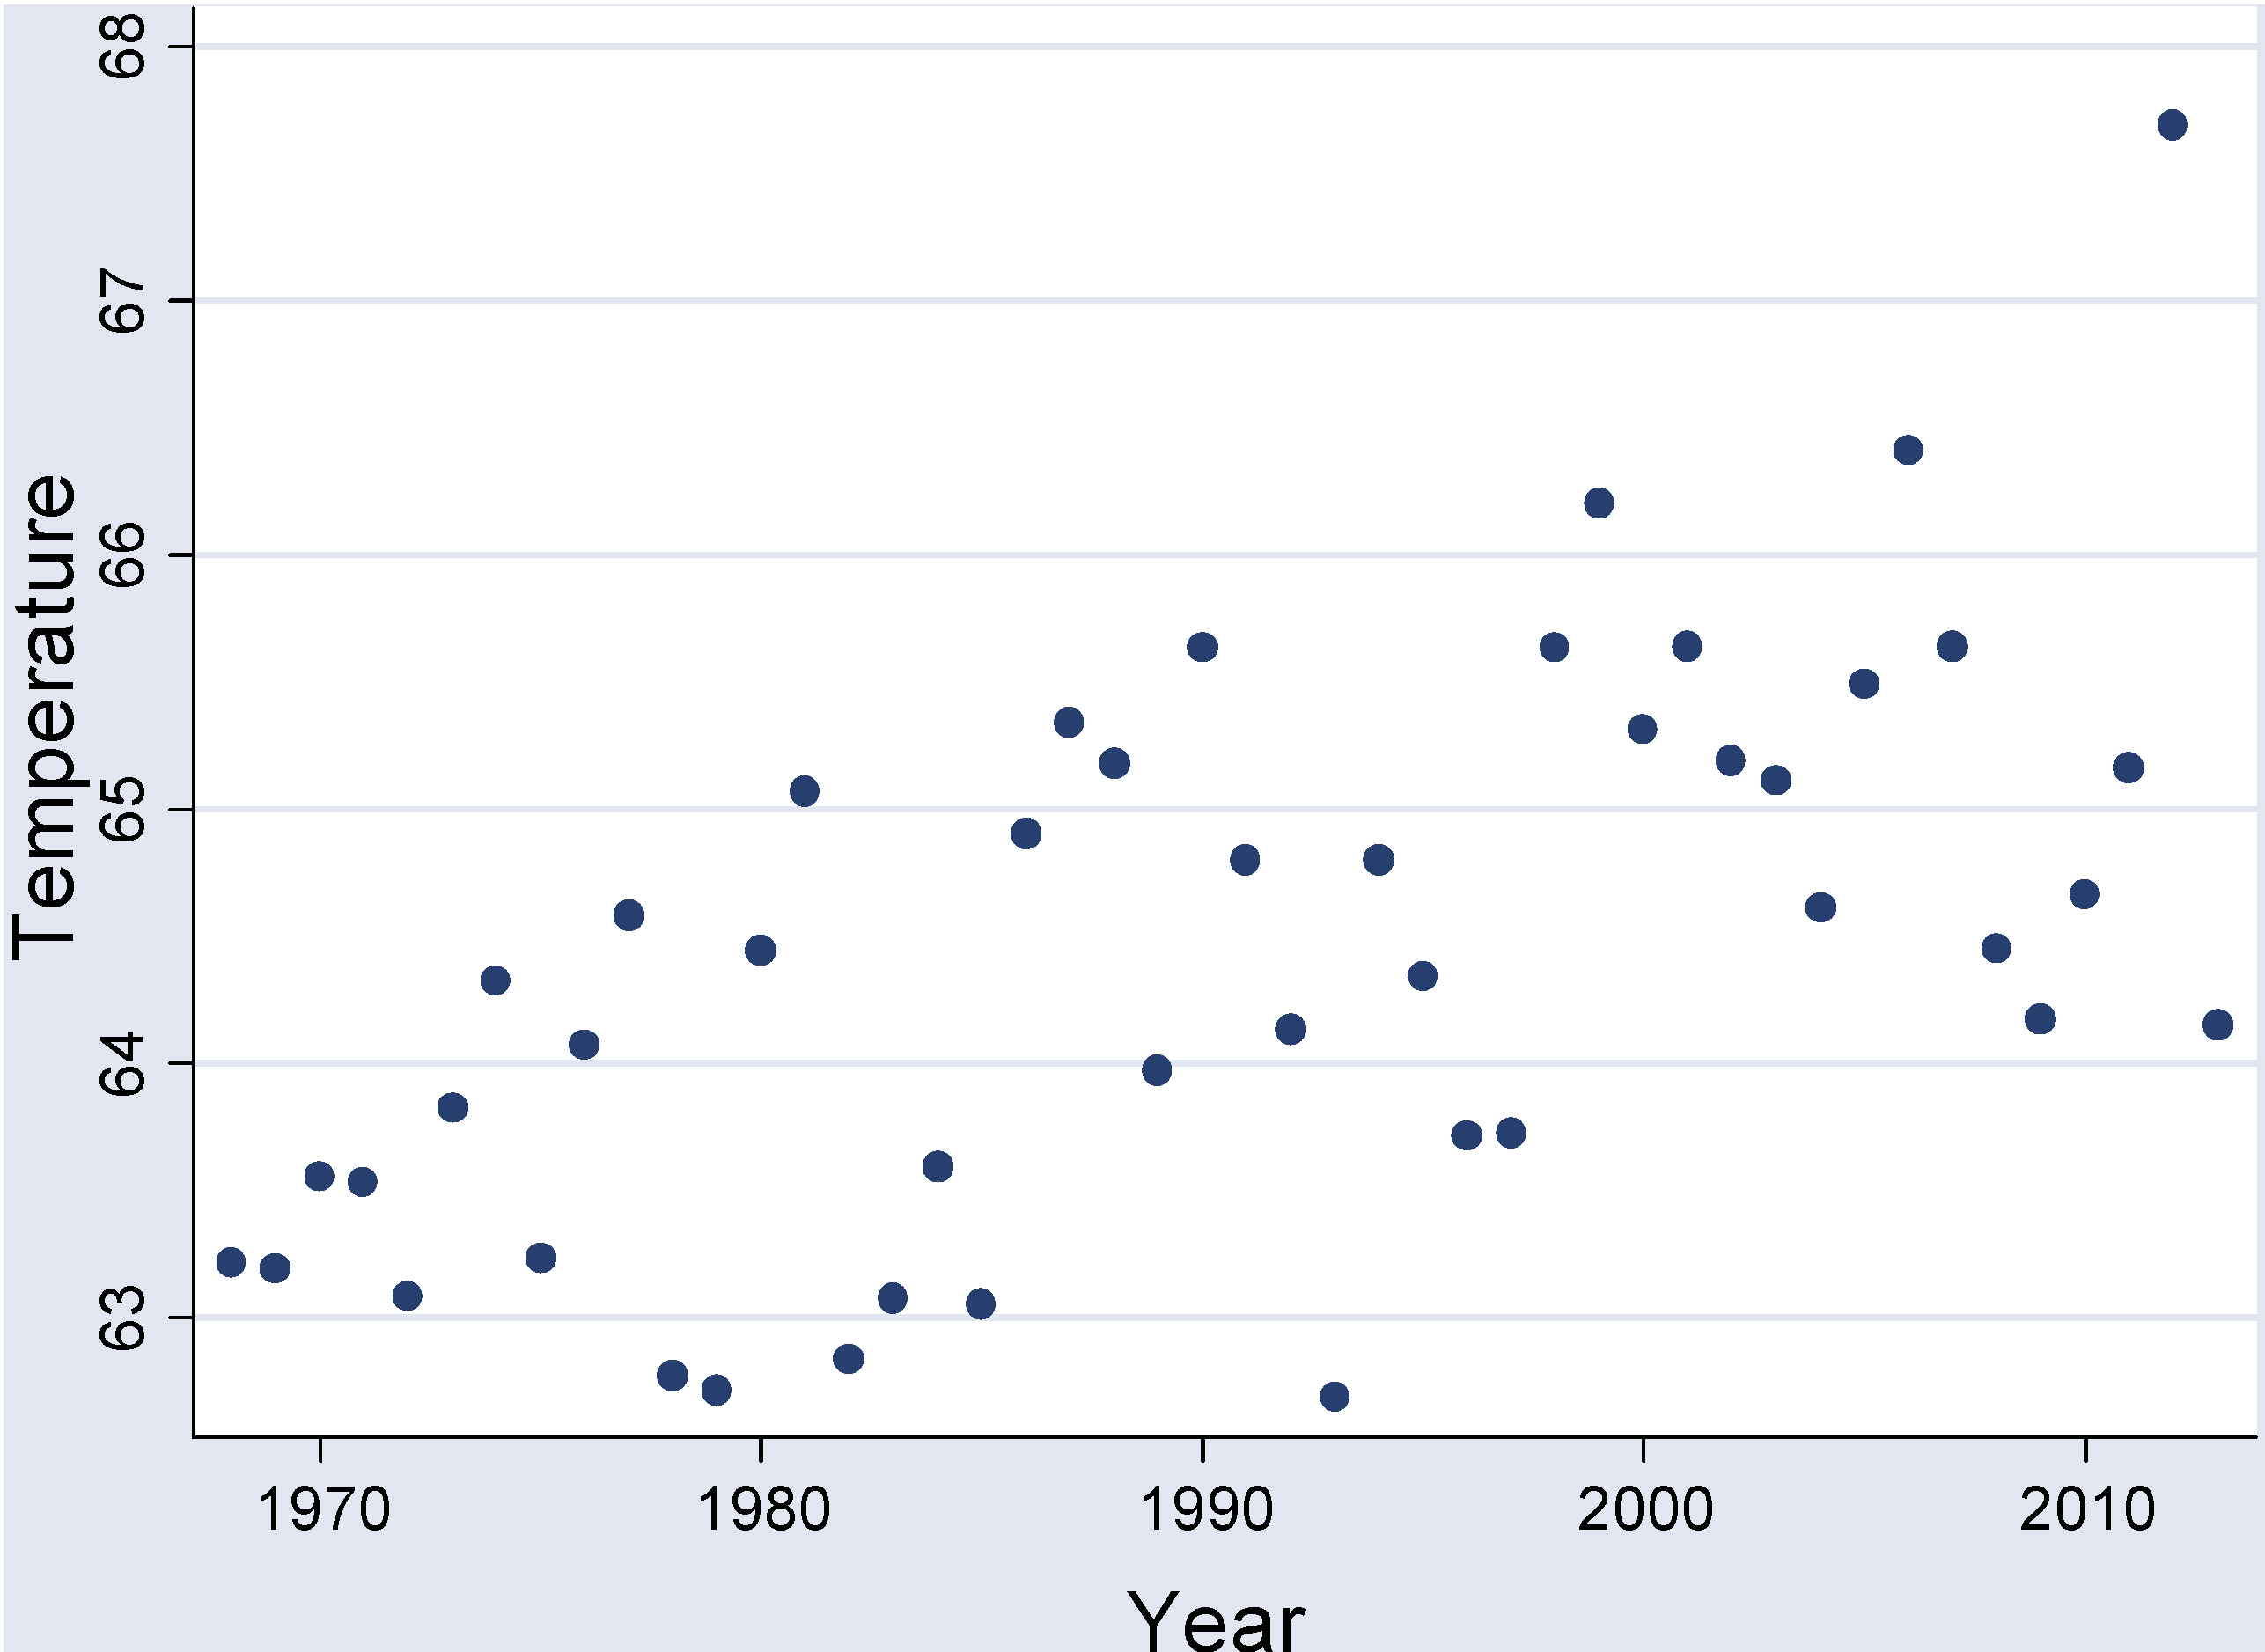
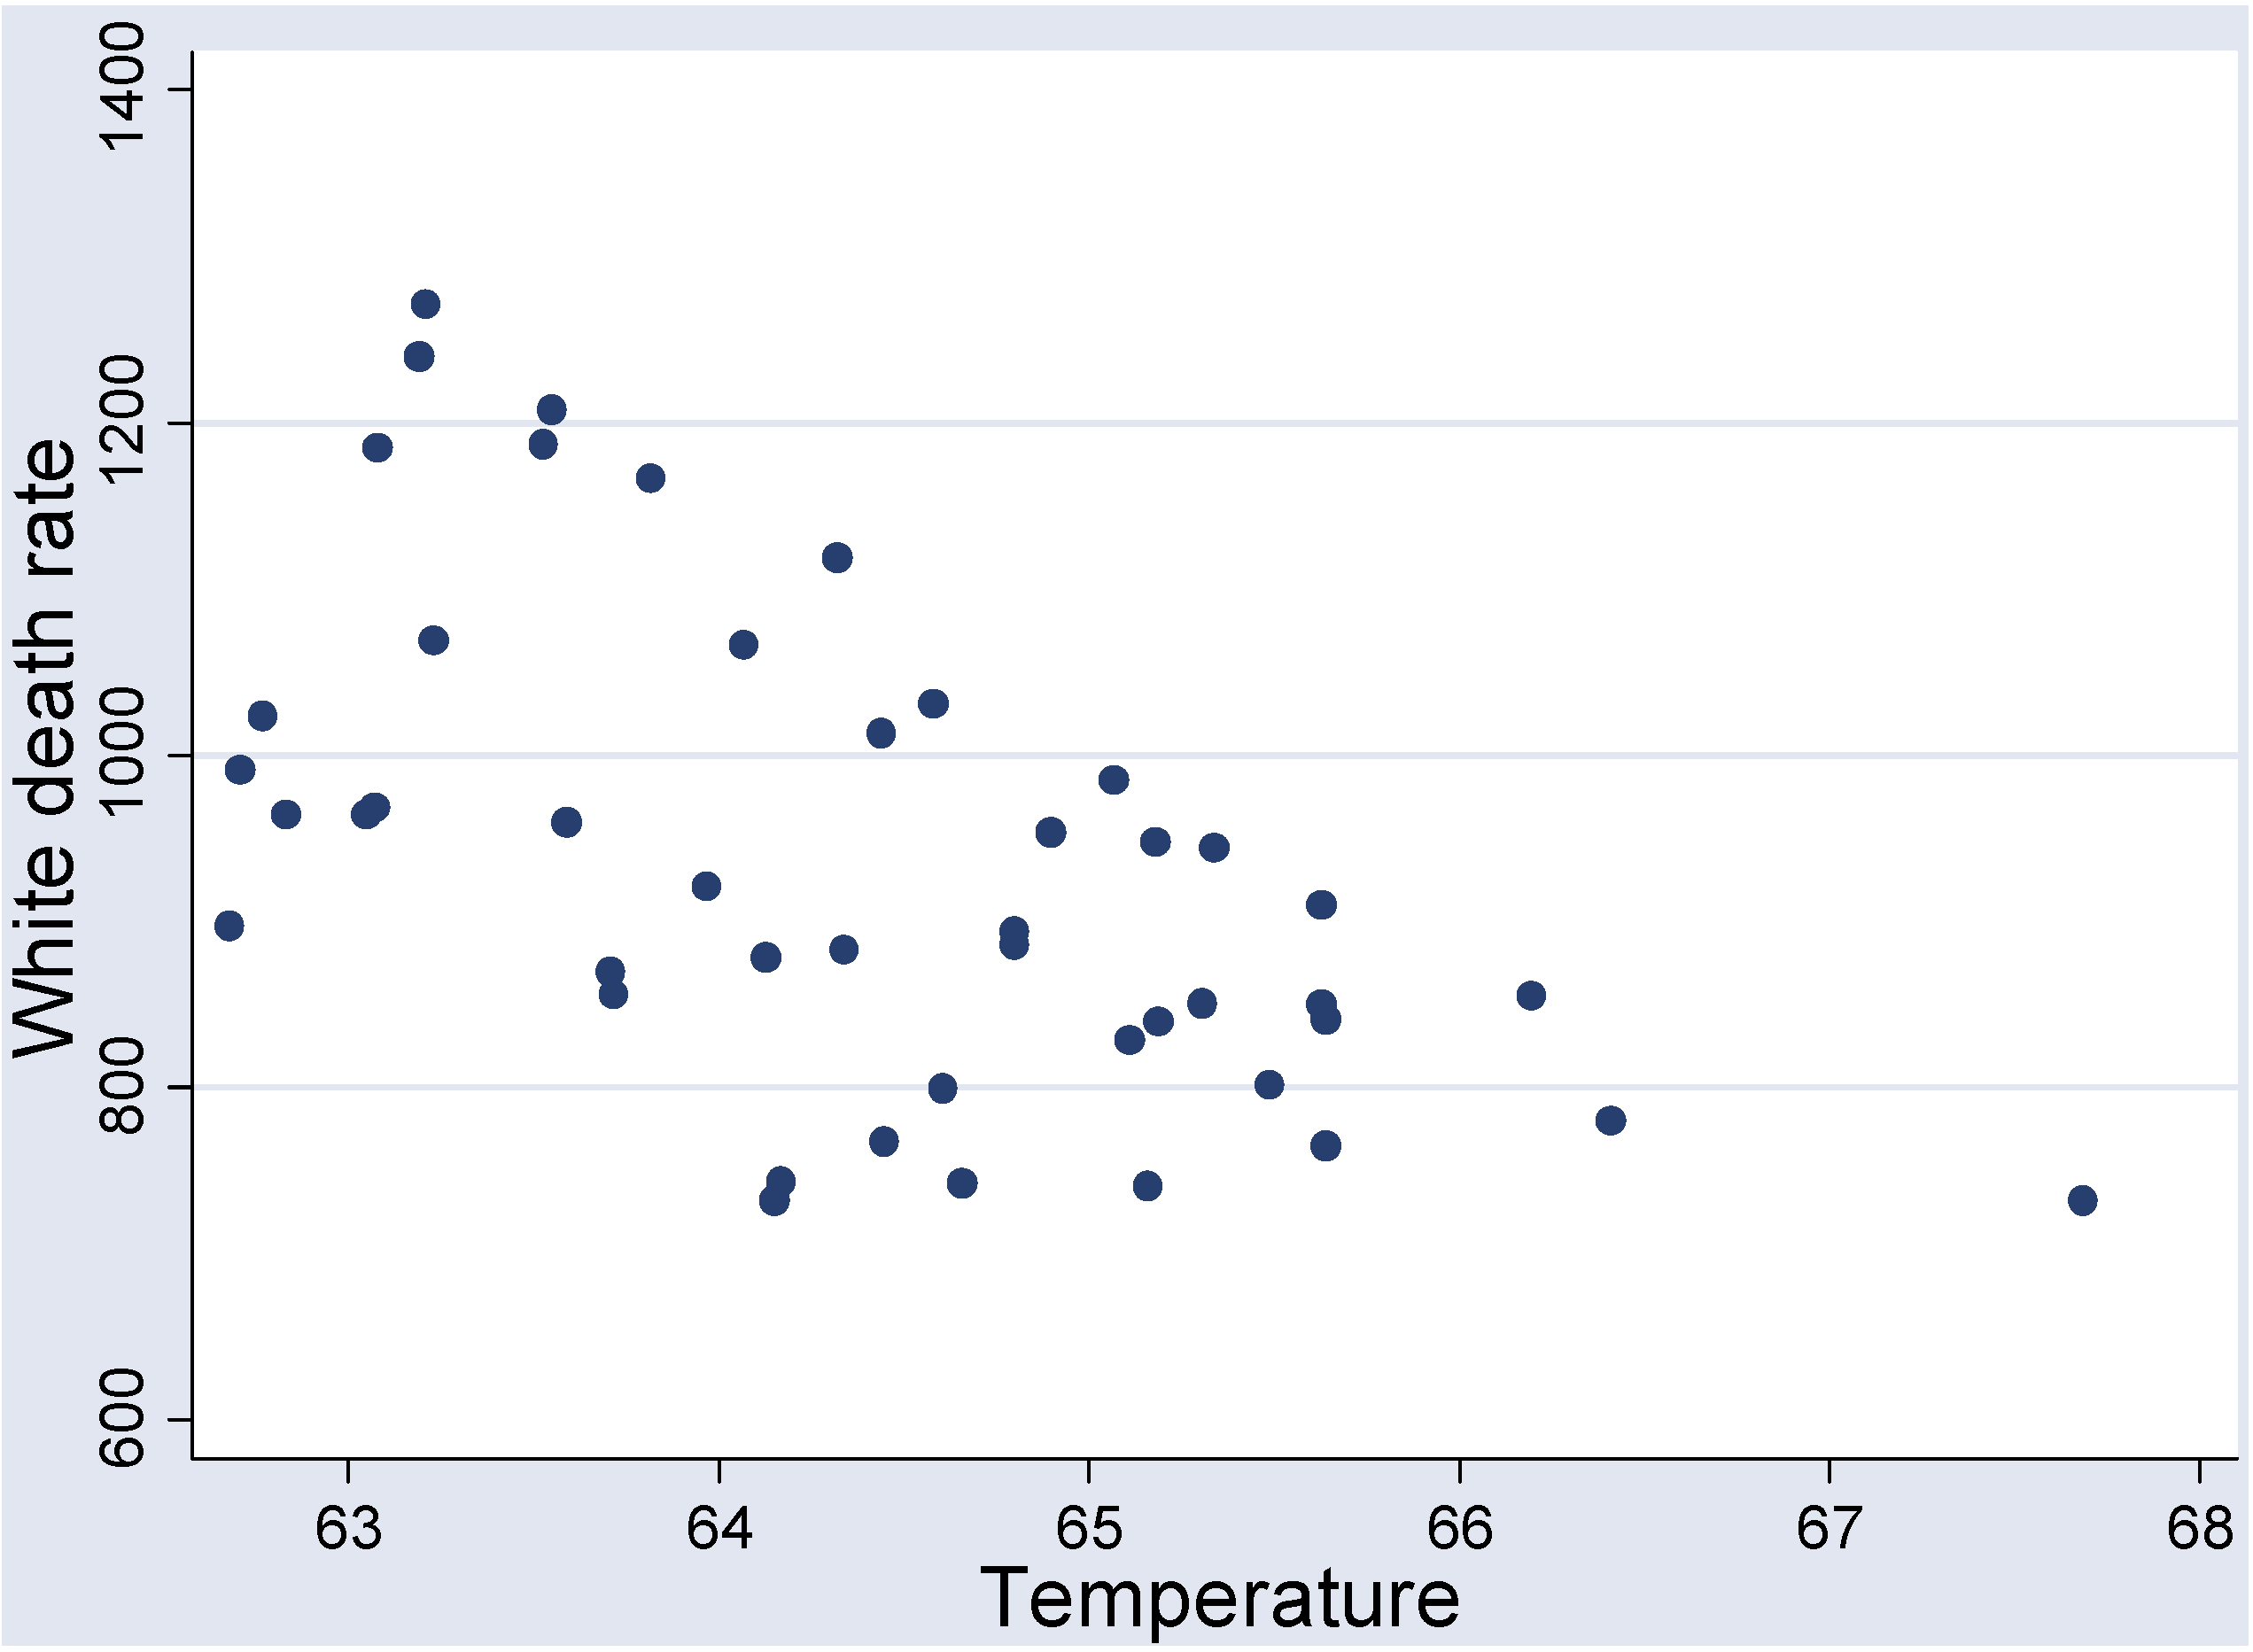
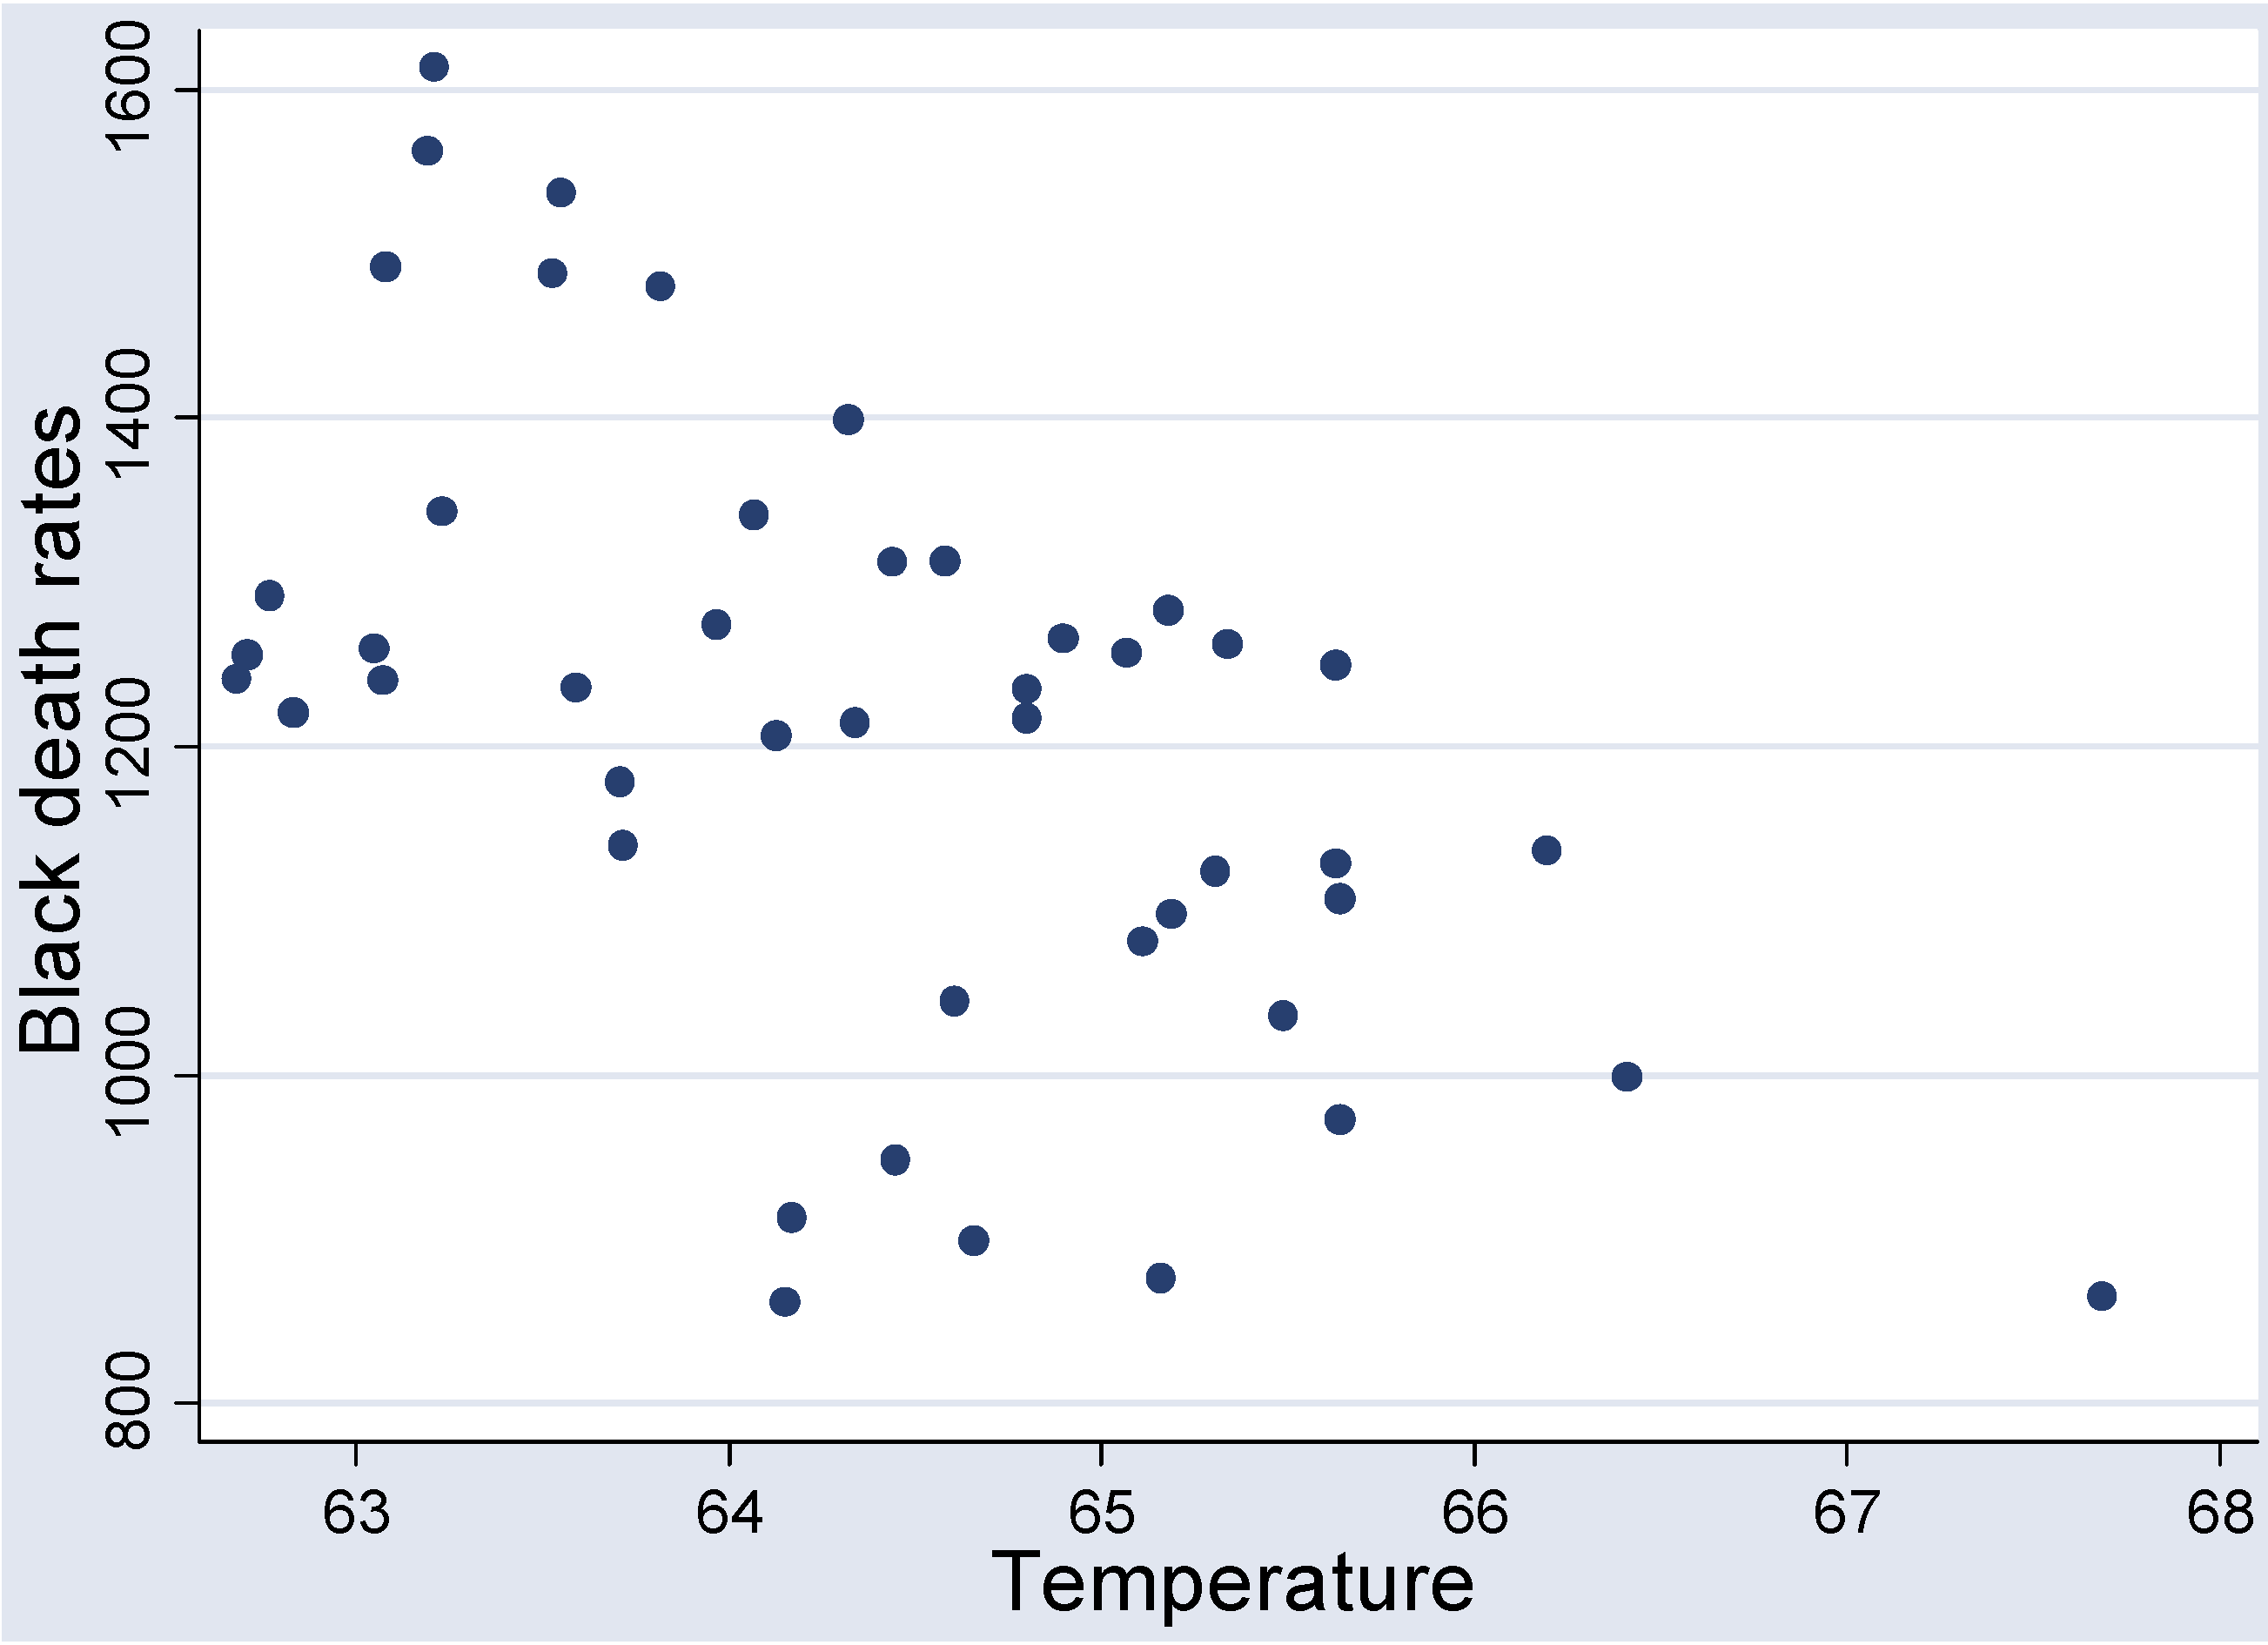
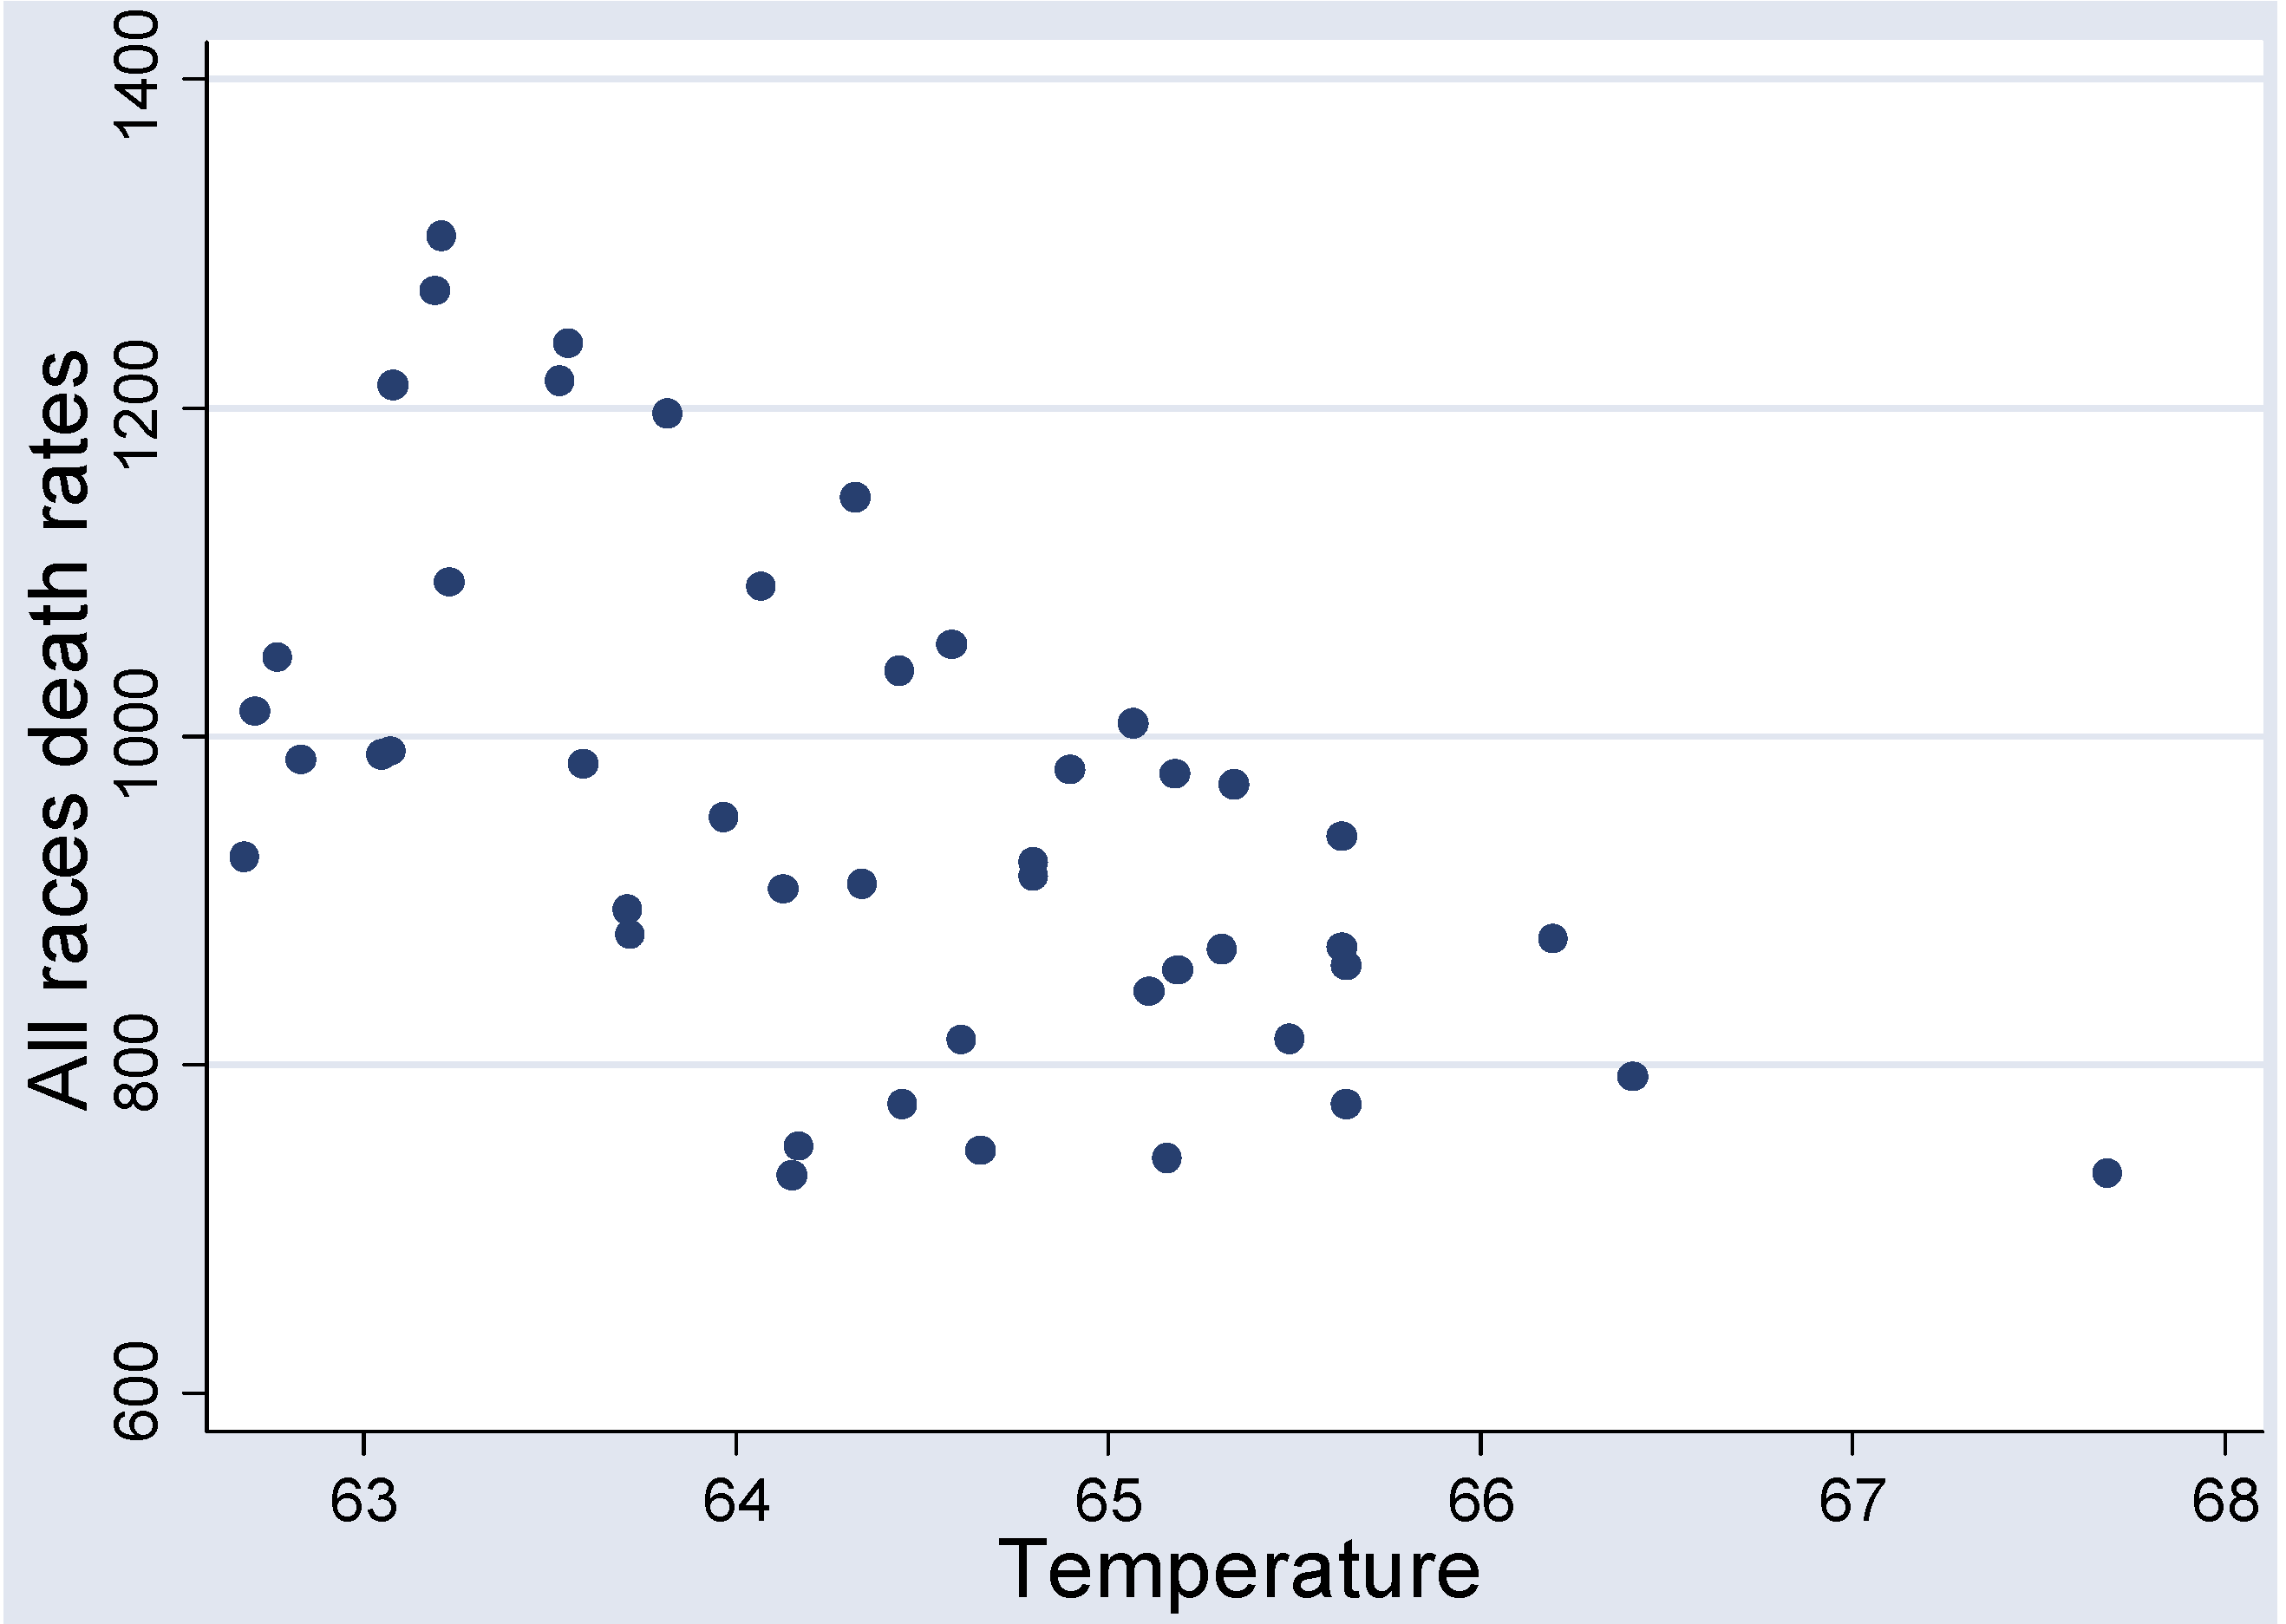
Descriptive statistics are provided in Table 1 and raw data is provided in Table 2. There was a 5.0 degree Fahrenheit range (62.7–67.7 degrees F) where temperatures tended to increase over the 46 year period (Figure 1). All three race categories revealed moderate strength, inverse, statistically significant correlations as follows. Whites: r = −0.576, p < 0.0001; Blacks: r = −0.556, p = 0.0001; and all races: r = −0.577, p < 0.0001 (Figure 2, Figure 3 and Figure 4).

Table 1.
Descriptive statistics. Mortality is age-adjusted per 100,000. Temperature is in degrees Fahrenheit.
| Variable | n | Mean | SD | Minimum | Maximum |
|---|---|---|---|---|---|
| All race mortality | 46 | 954.5 | 151.5 | 732.6 | 1304.0 |
| Black mortality | 46 | 1206.0 | 187.2 | 861.1 | 1612.5 |
| White mortality | 46 | 932.5 | 144.9 | 731.3 | 1271.0 |
| Temperature | 46 | 64.4 | 1.1 | 62.7 | 67.7 |
Table 2.
Raw averages for the four variables in the study. Temp = average daily maximum air temperature [8]. Whites, blacks, and all races refer to race categories for the age-adjusted death rates.
| Year | Temp | Whites | Blacks | All Races |
|---|---|---|---|---|
| 1968 | 63.21 | 1271.00 | 1612.50 | 1304.00 |
| 1969 | 63.19 | 1239.60 | 1561.70 | 1270.80 |
| 1970 | 63.55 | 1207.10 | 1536.50 | 1238.80 |
| 1971 | 63.53 | 1186.50 | 1487.60 | 1216.00 |
| 1972 | 63.08 | 1183.80 | 1492.00 | 1213.60 |
| 1973 | 63.82 | 1166.30 | 1479.20 | 1196.00 |
| 1974 | 64.32 | 1118.50 | 1398.60 | 1144.90 |
| 1975 | 63.23 | 1067.80 | 1342.20 | 1093.30 |
| 1976 | 64.07 | 1065.40 | 1340.70 | 1090.60 |
| 1977 | 64.58 | 1030.10 | 1312.70 | 1055.50 |
| 1978 | 62.77 | 1023.40 | 1291.60 | 1047.80 |
| 1979 | 62.71 | 990.60 | 1255.60 | 1014.40 |
| 1980 | 64.44 | 1012.70 | 1311.60 | 1039.30 |
| 1981 | 65.07 | 984.10 | 1256.60 | 1007.70 |
| 1982 | 62.83 | 963.60 | 1220.20 | 985.50 |
| 1983 | 63.07 | 967.50 | 1239.90 | 990.60 |
| 1984 | 63.59 | 959.60 | 1234.70 | 982.80 |
| 1985 | 63.05 | 963.60 | 1259.20 | 988.50 |
| 1986 | 64.90 | 953.00 | 1264.90 | 979.20 |
| 1987 | 65.34 | 943.40 | 1261.10 | 970.30 |
| 1988 | 65.18 | 947.40 | 1282.20 | 976.10 |
| 1989 | 63.97 | 920.00 | 1273.80 | 950.70 |
| 1990 | 65.63 | 909.40 | 1248.90 | 938.70 |
| 1991 | 64.80 | 893.20 | 1234.00 | 922.70 |
| 1992 | 64.13 | 877.70 | 1205.70 | 906.10 |
| 1993 | 62.68 | 897.00 | 1240.60 | 926.70 |
| 1994 | 64.80 | 885.50 | 1216.60 | 914.10 |
| 1995 | 64.34 | 882.20 | 1213.90 | 910.30 |
| 1996 | 63.71 | 868.90 | 1178.00 | 894.50 |
| 1997 | 63.72 | 855.60 | 1139.60 | 878.50 |
| 1998 | 65.63 | 849.10 | 1127.50 | 870.90 |
| 1999 | 66.20 | 854.90 | 1136.00 | 876.50 |
| 2000 | 65.31 | 850.00 | 1123.10 | 870.20 |
| 2001 | 65.64 | 840.90 | 1106.50 | 859.70 |
| 2002 | 65.19 | 839.30 | 1097.60 | 856.80 |
| 2003 | 65.11 | 827.40 | 1080.90 | 844.30 |
| 2004 | 64.61 | 798.80 | 1044.10 | 814.50 |
| 2005 | 65.49 | 801.30 | 1035.40 | 815.90 |
| 2006 | 66.41 | 779.50 | 998.20 | 792.50 |
| 2007 | 65.64 | 764.40 | 972.20 | 775.90 |
| 2008 | 64.45 | 767.40 | 947.80 | 775.70 |
| 2009 | 64.17 | 742.90 | 913.00 | 750.20 |
| 2010 | 64.66 | 742.00 | 898.40 | 747.70 |
| 2011 | 65.16 | 740.40 | 875.50 | 743.10 |
| 2012 | 67.69 | 731.60 | 864.40 | 733.80 |
| 2013 | 64.15 | 731.30 | 861.10 | 732.60 |
Figure 1.
Temperatures by year for continental U.S., 1968–2013.

Figure 2.
Yearly temperatures vs. yearly white age-adjusted death rates in the continental U.S., 1968–2013.
Figure 2.
Yearly temperatures vs. yearly white age-adjusted death rates in the continental U.S., 1968–2013.

Figure 3.
Yearly temperature vs. yearly black age-adjusted death rates in the continental U.S., 1968–2013.
Figure 3.
Yearly temperature vs. yearly black age-adjusted death rates in the continental U.S., 1968–2013.

Figure 4.
Yearly temperature vs. yearly all races age-adjusted death rates in the continental U.S., 1968–2013.
Figure 4.
Yearly temperature vs. yearly all races age-adjusted death rates in the continental U.S., 1968–2013.

4. Discussion
These findings indicated that warmer years were correlated with lower death rates, which is a similar result to that revealed in the Texas study [6]. However, the study is at odds with other research on this topic that revealed adverse associations between warmer temperatures and death rates [2,3]. One reason for the difference may be in the different designs. The aforementioned studies that revealed adverse associations between warmer temperatures and death rates, looked at cities for the U.S [2,3], whereas the present study looked at nearly the entire U.S. as a whole (48 states + District of Columbia). There is likely more mobility outside of a jurisdiction at the city level vs. at the country level, which would seem to suggest greater reliability with the latter (present) design. Another difference is in the number of years studied: 13 in one study [3] vs. 46 in the present study. The author was unable to determine the number of years analyzed in the other aforementioned paper [2].
Limitations to the study are: (a) its (ecological) design, where individual exposures and outcomes are unknown, as is a limitation to other studies showing different results; and (b) no other factors related to death rates were included. The exclusion of other factors is consistent with predictions for global warming, where warmer temperatures alone (vs. global warming and, for example, smoking) are thought to be predictive (of future adverse events). A factor not included in this study is the general advancement that mankind makes over time that may prolong lifespan. However, it can be argued that these advances may somehow be related to warmer temperatures, just as warmer temperatures may be related to a plethora of future adverse events, as global warming advocates might speculate. Strengths of the study include: (a) the entire continental U.S. population was included; and (b) age and race were accounted for.
5. Conclusions
In this study, warmer years tended to be related to lower death rates, which is consistent with a previous similar study for Texas, but the opposite was claimed in other studies that looked at locations at the city level in the U.S. Thus, the science is not settled on the topic of global warming and death rates. Further research is indicated to verify these findings, using this (ecological) or other research designs.
Author Contributions
The author performed all the tasks involved in this study, including data collection, data analysis, and writing the manuscript.
Conflicts of Interest
The author declares no conflict of interest.
References
- Climate change: Basic information. U.S. Environmental Protection Agency. Available online: http://www.epa.gov/climatechange/basics/ (accessed on 11 June 2015).
- Kalkstein, L.S.; Greene, J.S. An evaluation of climate/mortality relationships in large U.S. cities and the possible impacts of climate change. Environ. Health Perspect. 1997, 105, 84–93. [Google Scholar]
- Guo, Y.; Gasparrini, A.; Armstrong, B.; Shanshan, L.; Tawatsupa, B.; Tobias, A.; Lavigne, E.; de Sousa Zanotti Stagliorio Coelho, M.; Leone, M.; Pan, X.; et al. Global variation in the effects of ambient temperature on mortality: A systematic evaluation. Epidemiology 2014, 25, 781–789. [Google Scholar] [PubMed]
- Hart, J. Association between air temperature and deaths due to cancer and heart disease in Alabama. Appl. Sci. Rep. 2015, 2. [Google Scholar] [CrossRef]
- Hart, J. Association between air temperature and cancer death rates in Florida: An ecological study. Dose Response 2015, 13. [Google Scholar] [CrossRef]
- Hart, J. Air temperature and death rates in Texas, 1968–2013: A brief research note. Epidemiol. Rep. 2015. accepted. [Google Scholar]
- Centers for Disease Control and Prevention (CDC Wonder). Compressed mortality. Available online: http://wonder.cdc.gov/ (accessed on 25 May 2014).
- National Oceanic and Atmospheric Administration. Climate at a glance. Available online: http://www.ncdc.noaa.gov/cag/time-series/us (accessed on 25 May 2014).
© 2015 by the authors; licensee MDPI, Basel, Switzerland. This article is an open access article distributed under the terms and conditions of the Creative Commons Attribution license (http://creativecommons.org/licenses/by/4.0/).
Share and Cite
MDPI and ACS Style
Hart, J. Air Temperature and Death Rates in the Continental U.S., 1968–2013. Climate 2015, 3, 435-441. https://doi.org/10.3390/cli3020435
AMA Style
Hart J. Air Temperature and Death Rates in the Continental U.S., 1968–2013. Climate. 2015; 3(2):435-441. https://doi.org/10.3390/cli3020435
Chicago/Turabian StyleHart, John. 2015. "Air Temperature and Death Rates in the Continental U.S., 1968–2013" Climate 3, no. 2: 435-441. https://doi.org/10.3390/cli3020435