
pH-Induced Modulation of Vibrio fischeri Population Life Cycle
by
 , , and
Ana Rita Silva
1,2, 
Cláudia Sousa
1,2,
Daniela Exner
3,
Ruth Schwaiger
3,
Maria Madalena Alves
1,
Dmitri Y. Petrovykh
2,* and
Luciana Pereira
1 1
Centre of Biological Engineering, University of Minho, 4710-057 Braga, Portugal
2
International Iberian Nanotechnology Laboratory, 4715-330 Braga, Portugal
3
Institute for Applied Materials, Karlsruhe Institute of Technology, 76344 Eggenstein-Leopoldshafen, Germany
*
Author to whom correspondence should be addressed.
Chemosensors 2021, 9(10), 283; https://doi.org/10.3390/chemosensors9100283
Submission received: 28 June 2021
/
Revised: 30 September 2021
/
Accepted: 1 October 2021
/
Published: 5 October 2021
(This article belongs to the Special Issue Nanotechnology for Sensing, Medical and Environmental Application)
Abstract
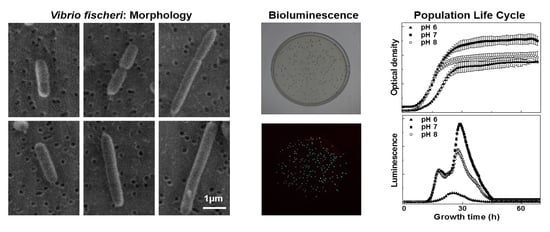
:Commonly used as biological chemosensors in toxicity assays, Vibrio fischeri bacteria were systematically characterized using complementary physicochemical and biological techniques to elucidate the evolution of their properties under varying environmental conditions. Changing the pH above or below the optimal pH 7 was used to model the long-term stress that would be experienced by V. fischeri in environmental toxicology assays. The spectral shape of bioluminescence and cell-surface charge during the exponential growth phase were largely unaffected by pH changes. The pH-induced modulation of V. fischeri growth, monitored via the optical density (OD), was moderate. In contrast, the concomitant changes in the time-profiles of their bioluminescence, which is used as the readout in assays, were more significant. Imaging at discrete timepoints by scanning electron microscopy (SEM) and helium-ion microscopy (HIM) revealed that mature V. fischeri cells maintained a rod-shaped morphology with the average length of 2.2 ± 1 µm and diameter of 0.6 ± 0.1 µm. Detailed morphological analysis revealed subpopulations of rods having aspect ratios significantly larger than those of average individuals, suggesting the use of such elongated rods as an indicator of the multigenerational environmental stress. The observed modulation of bioluminescence and morphology supports the suitability of V. fischeri as biological chemosensors for both rapid and long-term assays, including under environmental conditions that can modify the physicochemical properties of novel anthropogenic pollutants, such as nanomaterials and especially stimulus-responsive nanomaterials.
1. Introduction
For assessing environmental effects of anthropogenic pollutants, including nanomaterials, biological chemosensors, whereby the potential hazards posed by the material are evaluated based on monitoring the behavior of a bacterial population, offer an effective and practical solution [1,2,3]. The short life cycle and correspondingly rapid metabolism of bacteria that are used as biological chemosensors in toxicity assays, in particular, enable rapid assessment for acute toxicity of both soluble compounds [4,5] and samples containing solid materials (e.g., soil, waste, and sludge) [6].
Stimulus-responsive nanomaterials, also known as “smart” nanomaterials, are entering the market [7] in high-volume applications in agriculture [8], food [9], and cosmetics [10]. After the release of nanomaterials in these applications, their eventual fate often leads to accumulation in the soil [11] or aquatic environment [12], where bacterial chemosensors are an important tool for assessment of ecotoxicity, because they are well suited for assays in complex natural environments and because bacteria play a significant role in the interaction of nanomaterials with ecosystems [12,13]. The responsive nanomaterials are also likely to participate in complex interactions with other nanomaterials, compounds, and ionic species that can strongly modulate the combined effect of such mixtures on biological systems [14]. In these complex environments, surface interactions play a particularly important role in modulating the toxic effects of the participating nanomaterials and compounds, as detected by bacterial assays [15]. The complexity of the underlying physicochemical phenomena highlights the need for an improved understanding of the effects that the variation of solution parameters can have on physicochemical and biological properties of the bacteria used in the assays.
As a model microorganism, the marine bacterium Vibrio fischeri from the Vibrionaceae family [16] is primarily studied due to the bioluminescence that naturally emerges in V. fischeri populations. In a normal life cycle, this bioluminescence is activated by quorum sensing in the exponential growth phase [17,18,19,20] and requires luciferase (and adenosine 5’-triphosphate, ATP) activity [21,22,23], thereby making V. fischeri populations a popular choice for model studies of quorum sensing [17,18,24,25,26,27] or bioluminescence modulation [22,28]. Rapid changes in the bioluminescence of V. fischeri populations are typically due to the modulation of the luciferase activity by the presence of stimulating or inhibiting substances or by environmental conditions, including temperature, oxygen concentration, and pH [22,28].
The convenience of the bioluminescence “readout” of their metabolic state, is the basis for using V. fischeri in bioassays [29,30]. The rapid and reproducible bioluminescence-inhibitory response in V. fischeri populations [22,31,32,33,34,35] led to its standardization in several commercially available kits [30,36,37,38,39].
In contrast to their widespread use in acute-toxicity assays, the response of V. fischeri populations to long-term environmental conditions is less well understood. We chose pH as a model environmental parameter to track the resulting long-term life-cycle and metabolic responses of V. fischeri cultures. In addition to being an important parameter subject to variations in natural environments, e.g., during ecotoxicity testing, particularly of responsive nanomaterials, pH represents a factor that can be systematically controlled in model experiments that elucidate the long-term environmental effects on both physicochemical and biological characteristics of V. fischeri. The emerging interest in using model V. fischeri populations in long-term bioassays, including under the environmental exposure to anthropogenic nanoparticles [40,41] that interact with microorganisms via both physicochemical and biological pathways [42,43,44,45,46,47], further highlights the practical importance of understanding the pH-dependent life cycle of V. fischeri populations. Accordingly, we used multiple complementary physicochemical and biological techniques to quantitatively follow the pH-dependent life cycles of V. fischeri populations via a combination of continuous and discrete timepoint measurements.
2. Materials and Methods
All the inorganic reagents used to prepare the media and solutions described in this section were of 98% or higher purity.
2.1. Organism and Growth Medium
V. fischeri strain NRRL-B-11177, commercially designated as “BioFix® Lumi luminous bacteria”, was obtained in freeze-dried form from Macherey-Nagel GmbH & Co. KG (Düren, Germany). The growth medium for bioluminescent bacteria was adapted from the standard protocol described in ISO 1134-1, “Water quality determination of the inhibitory effect of water samples on the light emission of V. fischeri (luminescent bacteria test)” [48,49].
The liquid growth medium was composed of peptic digest of animal tissue (CAS 91079-38-8, VWR, Radnor, PA, USA) (5 g), yeast extract (CAS 8013-01-2, Fisher, Waltham, MA, USA) (0.5 g), NaCl (CAS 7647-14-5, Merck, Kenilworth, NJ, USA) (30 g), Na2HPO4·2H2O (CAS 10028-24-7, Sigma, St. Louis, MO, USA) (6.10 g), KH2PO4 (CAS 7758-11-4, Panreac, Barcelona, Spain) (3.52 g), MgCl2·7H2O (CAS 10034-99-8, Panreac, Barcelona, Spain) (0.204 g), NH4H2PO4 (CAS 7722-76-1, Merck, Kenilworth, NJ, USA) (0.7 g), and glycerol (CAS 56-81-5, Acros, Geel, Belgium) (3 mL) per 1 L of distilled water. Solid medium for stock cultures had the same composition plus agar (CAS 9002-18-0, Panreac, Barcelona, Spain) (12 g·L−1). The pH of the agar medium was adjusted to 7.0 ± 0.2, with HCl (1 M) and NaOH (1 M) (HI 207 pH meter, HANNA Instruments, Smithfield, RI, USA). Sterilization was performed by autoclaving (Hiclave HV-25L, HMC, Engelsberg, Germany) for 20 min at ca. 100 kPa and 121 °C.
2.2. Aerobic Growth of V. fischeri
The freeze-dried commercial bacteria were reactivated by the addition of 1 mL of reconstitution solution (nontoxic ultrapure water), followed by manual shaking. After 5–10 min, the bacteria were plated in Petri dishes with solid growth medium and incubated for 3 days at 20 °C. The luminescent colonies were identified in the dark by visual observation, transferred to Erlenmeyer flasks (250 mL) containing 50 mL of liquid growth medium, and incubated at 20 ± 1 °C in an orbital shaker (Excella E24 Incubator Shaker, New Brunswick Scientific, Edison, NJ, USA) at 180 rpm. After 2 days of incubation, the bacterial culture was centrifuged for 10 min at 7596 rpm (corresponding to 6000× g in Allegra 64R, Beckman Coulter, Pasadena, CA, USA, centrifuge); the pellet was resuspended in 1 mL of the protective medium: d(+)-glucose monohydrate (CAS 14431-43-7, Acros, Geel, Belgium) (66 g), NaCl (CAS 7647-14-5, Merck, Kenilworth, NJ, USA) (4 g), l-histidine (CAS 71-00-1, Sigma, St. Louis, MO, USA) (2 g), bovine serum albumin (CAS 9048-46-8, Sigma, St. Louis, MO, USA) (0.5 g). Aliquots (500 µL) of the resulting suspension were transferred to cryovials, with the addition of 500 µL of glycerol (CAS 56-81-5, Acros, Geel, Belgium). The stock cultures were stored at −80 °C.
For monitoring the bacterial aerobic growth, V. fischeri stock was transferred from cryovials to the solid growth medium in Petri dishes and incubated for 3 days at 20 ± 1 °C. To produce a batch of planktonic culture, a luminescent colony, identified in the dark by visual observation, was inoculated in an Erlenmeyer flask (250 mL) containing 50 mL of growth medium and incubated at 20 ± 1 °C in an orbital shaker (Excella E24 Incubator Shaker, New Brunswick Scientific, Edison, NJ, USA) at 180 rpm.
Continuous monitoring of V. fischeri growth was carried out in 24-well cell-culture plates (flat-bottom nontreated polystyrene plates, CytoOne®, Ocala, FL, USA) placed in a microplate reader (Cytation3, BioTek, Winooski, VT, USA). Each well was filled with 2 mL of the bacterial culture and measured continuously (in kinetic mode) for 70 h, with continuous shaking (355 rpm with amplitude of 4 mm) at 21 ± 2 °C. The light emission and the cell density (optical density, OD578) were monitored as described by the ISO 1134-1 [48]. Three replicates were measured in parallel in different wells.
The influence of the pH of the culture medium on the bacteria growth was evaluated by performing experiments at different pH values (6, 7, and 8). The pH of the medium was adjusted with solutions of HCl (1 M) or NaOH (1 M).
The luminescence emission spectrum was recorded during the exponential phase, 24 h of bacteria growth, at pH 6, 7, or 8, in a microplate reader (Cytation3, BioTek, Winooski, VT, USA), using a 96-well optical-bottom polymer-base black plate (Nalge Nunc International, Rochester, NY, USA).
2.3. Morphological Analysis
V. fischeri morphology was observed by scanning electron microscopy (SEM) at different phases of the growth, corresponding to the lag phase (5 h), exponential phase (20 h and 24 h), stationary phase (53 h), and death phase (117 h). To prepare samples for SEM at each timepoint, aliquots from batch-grown bacterial cultures were centrifuged for 5 min at 7596 rpm (corresponding to 6000× g in Allegra 64R, Beckman Coulter, Pasadena, CA, USA. centrifuge), the supernatants were discarded, and the cells washed twice by centrifugation in artificial seawater (ASW). ASW was composed of NaCl (CAS 7647-14-5, Merck, Kenilworth, NJ, USA) (28.0 g), MgCl2·6H2O (CAS 7791-18-6, Acros, Geel, Belgium) (5.0 g), MgSO4·7H2O (CAS 10034-99-8, Panreac, Barcelona, Spain) (4.5 g), CaCl2·2H2O (CAS 10035-04-8, Panreac, Barcelona, Spain) (1.5 g), and KCl (CAS 7447-40-7, Panreac, Barcelona, Spain) (0.8 g) per 1 L of ultrapure water [28]. After the two washes, the pellets were resuspended in ASW, and the OD was adjusted to 0.2. Then, 3 mL of the bacterial suspension was filtered through a 0.2 µm polycarbonate filter (Whatman, Maidstone, UK), and the filter was placed in a well of a six-well plate containing 3 mL of 2.5% solution of glutaraldehyde (CAS 111-30-8, Sigma, St. Louis, MO, USA) in 0.1 M sodium cacodylate buffer (CAS 6131-99-3, Sigma, St. Louis, MO, USA) at pH 7.3. The filter was kept in the well for 16 h at 4 °C, to fix the bacteria. After the fixation step, the filter was washed with sodium cacodylate buffer (CAS 6131-99-3, Sigma, St. Louis, MO, USA) three times for 10 min in each step. Then, the cells in the filter were dehydrated in a series of ethanol solutions (30%, 50%, 70%, 80%, 90%, 96%, and 100%), for 10 min in each solution. Ethanol-dried samples in 100% ethanol were placed in the critical-point dryer (Leica EM CPD300, Wetzlar, Germany) for a critical-CO2 drying sequence lasting 2 h.
To minimize imaging artifacts [50], SEM images were acquired in a field-emission SEM (Quanta 650 FEG, FEI, Hillsboro, OR, USA), in low-vacuum mode, using the low-kV pressure-limiting aperture (PLA) cone for an operating voltage of 1.5 kV, at 5 mm working distance. The distributions of lengths and diameters for 300 bacteria were obtained via SEM image analysis in ImageJ software (https://imagej.nih.gov/ij/download.html, accessed on 30 September 2021).
The morphology of V. fischeri in the exponential phase (24 h of growth) was also observed by helium-ion microscopy (HIM). The samples were investigated using a microscope (Orion NanoFab, Zeiss, Oberkochen, Germany) equipped with an Everhart–Thornley detector for secondary electron collection. The images were acquired at an acceleration voltage of 25 kV, a beam current of 0.3 pA, and a working distance of 9 mm. The samples were imaged without conductive coatings; an electron flood gun was used to compensate for sample charging caused by the helium-ion beam.
2.4. Viability of V. fischeri Cells
The quantification of live bacteria was performed by colony-forming unit (CFU) counting. After 24 h of growth in liquid culture, the bacterial culture was 1:5 serially diluted in the growth medium; 100 µL aliquots of the diluted samples, corresponding to the dilution factors of 1.28 × 10⁻⁵, 2.56 × 10⁻⁶, 5.12 × 10⁻⁷, and 1.02 × 10⁻⁷, were transferred to Petri dishes containing solid growth medium (each with three replicates). Three assays were performed on different days, and the initial concentration was adjusted to OD578 ≈ 1.0 ± 0.2. The spreading of diluted bacterial culture was performed with sterile glass beads, manually shaking during 5 min. Plates were then incubated for 3 days at 20 ± 1 °C, and the estimation of bacterial abundance in the suspensions was performed by direct counts of CFUs. Confidence intervals (CI) of mean values were calculated using the statistical package of Microsoft Excel 2010, assuming the Student’s t-distribution with n > 30 replicates. The CIs are reported at 95% confidence level (CL) as the mean ± 1.96·s/√n (s = standard deviation).
2.5. Characterization of Surface Charge
Zeta (ζ) potentials of the bacteria were measured in a Zetasizer NANO ZS-ZEN3600 (Malvern Instruments Limited, Malvern, UK), equipped with an He–Ne laser (wavelength of 633 nm) and operating with a detection angle set to 173° (backscatter detection). The ζ-potentials were evaluated in two different assays. In the first assay, the cultures were grown at different pH (6, 7, and 8) for 24 h and measured in ultrapure water. Small amounts of HCl (1 M) or NaOH (1 M) were added to adjust the pH of the growth medium. After growth, the medium containing the bacteria was centrifuged for 5 min at 7596 rpm (corresponding to 6000× g in Allegra 64R, Beckman Coulter, Pasadena, CA, USA, centrifuge), at 20 °C, and the pellet was resuspended in 15 mL of ultrapure water. In the second assay, the bacteria were grown during 24 h under the standard conditions at pH 7, then centrifuged and resuspended as described above. Before measurements, samples in water were adjusted to pH 6, 6.5, 7, 7.5, or 8 with HCl (1 M) or NaOH (1 M). The average value and standard deviation for each sample were obtained from 10 measurements at 25 °C. The results were obtained using the Smoluchowski theory approximation. Zetasizer 7 software (Malvern Instruments Limited, Malvern, UK) was used to estimate ζ-potential values for bacteria.
3. Results
3.1. Dependence of V. fischeri Growth and Bioluminescence on pH
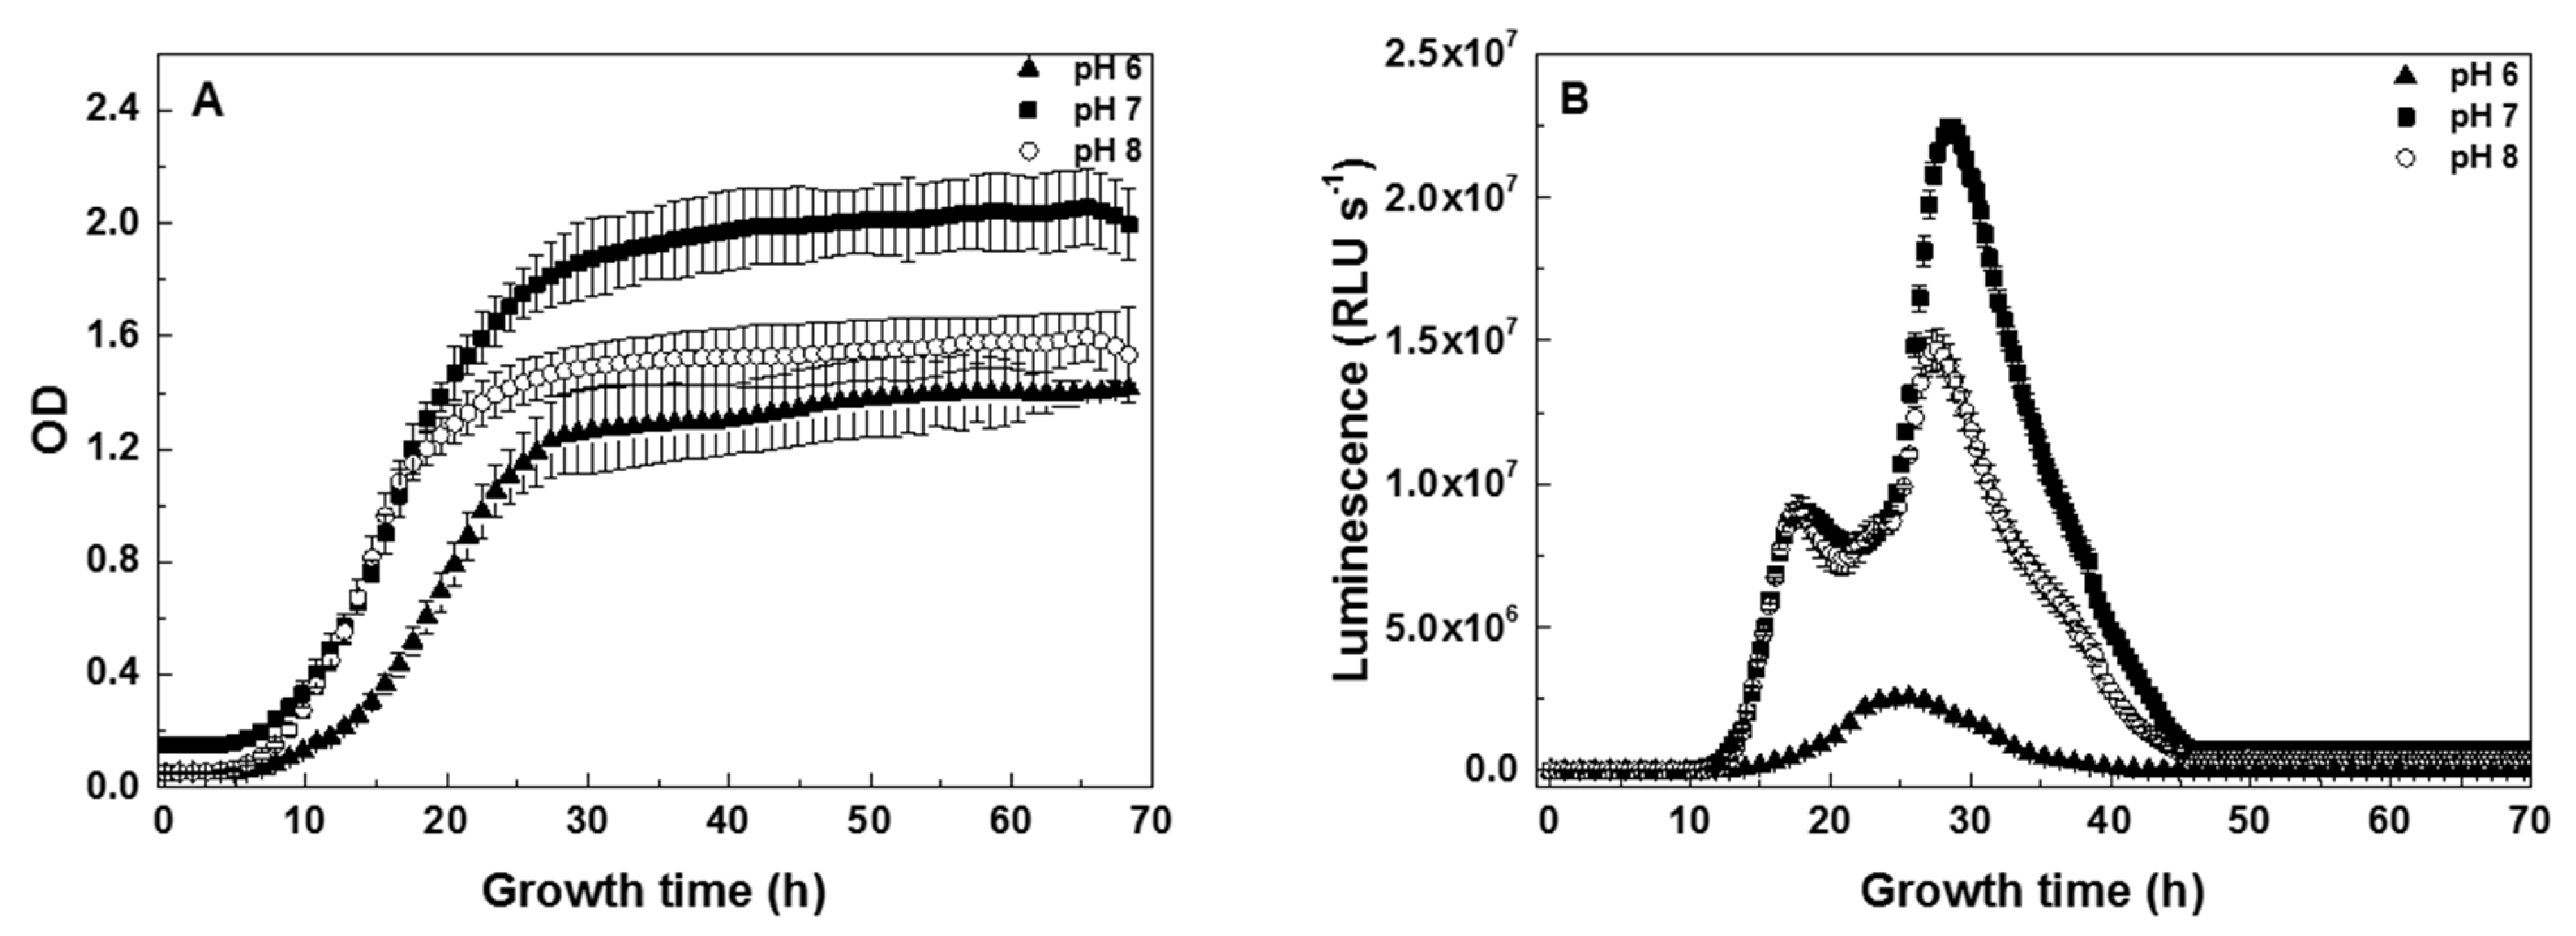
At the ISO-recommended optimal pH value of 7 [28,48,49,51], the lag phase of 6 h after inoculation was followed by the exponential phase until 28 h of growth, reaching the maximum OD of 1.9 in the stationary phase (Figure 1A). Previous reports [28,49] have established that bioluminescence of V. fischeri is strongly attenuated outside the range of pH 6 to pH 9. Because the attenuation of bioluminescence is the basis for using V. fischeri in toxicity assays, to limit the effect of the medium to a range of pH where the bioluminescence readings may be considered reliable, we limited the pH adjustment to one unit above or below the optimal value of pH 7. The effects of changing the pH of the growth medium were significantly different at pH 6 and pH 8 (Figure 1A). At pH 8, the lag and exponential phases were similar to those observed at pH 7 up to 18 h of growth. This earlier onset of the stationary phase at pH 8 resulted in a decreased maximum OD of 1.6, an 11% drop from the maximum at pH 7. In contrast, at pH 6, the growth rate in the exponential phase was significantly lower than that at the higher pH values, and the maximum OD reached in the stationary phase was only 1.3, a 37% drop from the maximum at pH 7. Even in this simple example of using pH as a model environmental parameter, the continuous monitoring helped to reveal both similarities and divergences among the three growth curves [52,53], the exact timing of which could be missed in measurements at discrete timepoints.
In the time-profile of the bioluminescence intensity, two peaks—initial at 17 h and secondary at 28 h—were observed during growth at the optimal pH 7 and at pH 8 (Figure 1B). In contrast to the correlated time-profiles of bioluminescence at both higher pH values, a single peak at 25 h was observed during growth at pH 6 (Figure 1B). The visible intensity differences of batch-grown cultures during the exponential phase (Figure S1A, Supplementary Materials) qualitatively matched those measured continuously in the 96-well plates (Figure 1B). Comparison of the bioluminescence spectra (Figure S1B) measured at pH 6, 7, and 8 revealed that the shapes of the spectral envelopes were similar under all three conditions.
3.2. Surface Charge Analysis
The surface charge of bacterial cells may depend on the pH of their environment. To model the conditions for both long-term and rapid pH-dependent assays, we measured the surface charge of V. fischeri cells following two protocols summarized in Table 1. V. fischeri cells maintained a consistent surface charge independently of the pH-dependent protocol used, with the only exception of the surface charge observed for bacteria grown at pH 7 and resuspended at pH 6.
3.3. Viability Assays
Long-term growth-inhibition assays (Figure 1A) for V. fischeri were complemented by viability assays based on the CFU counting (Table S1, Supplementary Materials). The perfect correlation between the visible and bioluminescent colonies confirmed the presence of V. fischeri in each of the counted CFUs (Figure S2). The intrinsic variability of the viability under optimal growth conditions was directly examined by intra- and inter-assay comparison of the CFU counts (Table S1), which, according to the literature reports for other bacteria [54,55,56], indicated highly reproducible growth of our model V. fischeri cultures and consistency of setting the initial concentration via OD measurements (OD578 ≈ 1.0 ± 0.2).
3.4. Morphological Analysis
To investigate the normal evolution of V. fischeri cell morphology, we systematically analyzed by SEM imaging the size and shape distributions of V. fischeri bacteria at discrete timepoints throughout their full life cycle under optimal conditions (Figure 2, Figure 3, and Figure S3). In agreement with the exponential phase in the growth curve at pH 7 (Figure 1A), we observed clear evidence of active cell division (septa) at the 20 h and 24 h timepoints in Figure 2. Further morphological changes, including the emergence of extreme aspect ratios, were investigated by SEM (Figure 3, Figure S3, and Figure S4) and complementary HIM (Figure 4) imaging.
4. Discussion
4.1. Timing of the V. fischeri Growth Phases
The durations of the lag and exponential phases observed for V. fischeri in this work (Figure 1A) are in general agreement with the literature values, although some much shorter durations have also been reported. For an ES114 strain of V. fischeri from a host squid Euprymna scolope, the lag phase lasted 6 h, followed by the exponential phase for the next 14–16 h [57]. For the same ES114 strain grown in the presence of trimethylamine N-oxide (TMAO), lag phases as short as 2 h and exponential phases as short as 2–4 h were observed [58], indicating that the duration of the growth phases is strongly condition- and stimulant-dependent. Similarly, in a continuous monitoring (based on OD450) study of an unspecified cryopreserved strain of V. fischeri, typical duration of the lag phase was reported to be 2–3 h, with a broader range observed for the exponential phase (between 10 and 24 h), depending on the growth conditions [53]. Lastly, for the MJ1 strain, the reported lag phase duration was <3 h, with the exponential phase lasting until about 16–17 h [26].
4.2. Surface Charge of V. fischeri Is pH-Independent
The largely pH-independent ζ-potential values measured in this work (Table 1) are in good agreement with the −30.1 ± 9 mV previously reported for V. fischeri (DSM 507 strain) at pH 7.2 [59]. In particular, the near-constant surface charge observed for V. fischeri cells grown in the media at pH 6, 7, or 8, i.e., under conditions analogous to those of the long-term cell-growth and bioluminescence measurements in Figure 1, implies that the suppressed growth at pH 6 did not result from dramatic changes in the electrostatic environment of cell surfaces. In terms of bioassay applications, the consistent surface charge of V. fischeri is beneficial for measurements at varying pH, whereby the pH of the environment would modulate the ζ-potential values of nanomaterials being tested for toxicity, but not the surface charge of the cells used as bioluminescent chemo/bio sensors.
4.3. Time-Profiles of V. fischeri Bioluminescence Are pH-Dependent
Superficially, the dramatic differences between the time-dependent bioluminescence profiles measured at pH 6, 7, and 8 (Figure 1B) may suggest that the environmental pH significantly affects the bioluminescence of individual V. fischeri cells. The largely pH-independent cell-surface charge (Table 1) and spectral shapes of the bioluminescence (Figure S1B), however, indicate that the pH effects apparent in Figure 1B are not the result of directly affecting bioluminescent centers, but rather are largely indirect. Specifically, the time-dependent peaks in bioluminescence are correlated with parameters of the corresponding pH-dependent growth curves (Figure 1A) coupled with a quorum-sensing mechanism.
The timing of the initial peak in bioluminescence, i.e., the initial peak at ca. 17 h for pH 7 and 8 or the single peak at ca. 25 h for pH 6, is determined by the initial production among the growing population of the quorum-sensing agent acyl homoserine lactone (AHL), which is known to be an autoinductor for expression of the bioluminescent luciferase in V. fischeri [24,25]. Both the timing (via AHL concentration) and the intensity of the initial peak in bioluminescence, therefore, are proportional to the cell density, in agreement with the data in Figure 1. The exponential phases behaved almost identically at pH 7 and 8 (Figure 1A); therefore, both populations reached the threshold cell density for AHL expression at nearly the same time (before 17 h) and near-identical cell densities at 17 h, resulting in the almost identical timing and intensity of the initial peaks in bioluminescence at pH 7 and 8 (Figure 1B). Conversely, the exponential phase at pH 6 was delayed and had a slower growth rate compared to those at pH 7 and 8 (Figure 1A); therefore, the threshold cell density for AHL expression was also delayed, and the initial peak in bioluminescence at pH 6 was pushed back to 25 h (Figure 1B). Furthermore, the lowest cell density (Figure 1A) reached at pH 6 resulted in the lowest intensity of the bioluminescence peak (Figure 1B and Figure S1).
For the secondary bioluminescence peaks at pH 7 and 8 (Figure 1B), both the correlated delay to ca. 28 h and the intensities relative to those of the initial peaks are consistent with the modeling predictions of the time-dependent concentration of AHL in a medium during bacterial growth past the initial threshold for AHL expression [60]. In direct analogy with the initial peaks, the intensity of the secondary peaks correlated with the corresponding cell density (Figure 1A), resulting in the lower intensity observed at pH 8 than at pH 7 (Figure 1B). In further agreement with the modeling predictions [60], because the initial peak in bioluminescence at pH 6 coincided with the end of the exponential growth phase (see Figure 1A,B), there was no continued increase in cell density to support a secondary delayed peak; thus, it never emerged at pH 6 (Figure 1B).
4.4. Typical Morphology of V. fischeri Cells
The distributions of lengths and diameters of V. fischeri bacteria (Table 2) were estimated for each of the discrete timepoints characterized by SEM. Averaged over all the growth phases, the mean length of the rod-shaped cells was 2.2 ± 1 µm, in good agreement with the length of adult individuals observed in the stationary phase, e.g., at the 53 h timepoint in Figure 2. While there were small variations in the mean values estimated at different timepoints, the differences among them were not statistically significant. The notably higher mean and uncertainty (3.3 ± 2 µm) estimated for the 5 h timepoint was primarily the result of the low bacterial density and, thus, their low total number in SEM images at that early stage of growth. The observed variations in the mean diameter values were not statistically significant among the timepoints, with an overall mean diameter of 0.6 ± 0.1 µm.
The mean length observed in this work was at the lower and upper limits, respectively, of the previous literature values for V. fischeri cells measured using optical microscopy (2–3 µm) [27,32] and SEM (1.5–2 µm) [59]. The overall larger values obtained using optical microscopy were likely due to the shrinking of bacterial cells that commonly results from their preparation for SEM imaging, which includes fixation with glutaraldehyde and dehydration in ethanol and in the critical-point dryer [61].
Apart from this putative shrinking, our preparation protocol did not introduce major artefacts into the observed morphology of V. fischeri cells. The consistent mean diameter observed in this work, with an overall variability lower than that of the mean length (Table 2), for example, implies that the collapse of cell membranes during sample preparation was largely avoided. Furthermore, visualization of the individual flagella at the 24 h timepoint (Figure S5), in agreement with previous observations by transmission electron microscopy [62], indicates that the sample preparation and imaging protocols used in this work were sufficiently mild to preserve fine morphological features of V. fischeri cells. This validation of our experimental protocols supports the interpretation of morphological changes, such as lysed cells at 117 h in Figures S3 and S4, as being related to and representative of the bacterial population life cycle.
4.5. Interpretation of the Apparently Round Cell Morphology
In SEM images with high densities of V. fischeri cells (53 and 117 h timepoints in Figure 2, Figure 3, Figures S3 and S4), an apparently round cell morphology was very common. Elucidating the nature of this morphology of V. fischeri cells is important because, for other Vibrio species, the round-cell morphology with ca. 0.6 µm diameter has been reported specifically for bacteria in a viable but nonculturable (VBNC) state [63,64,65].
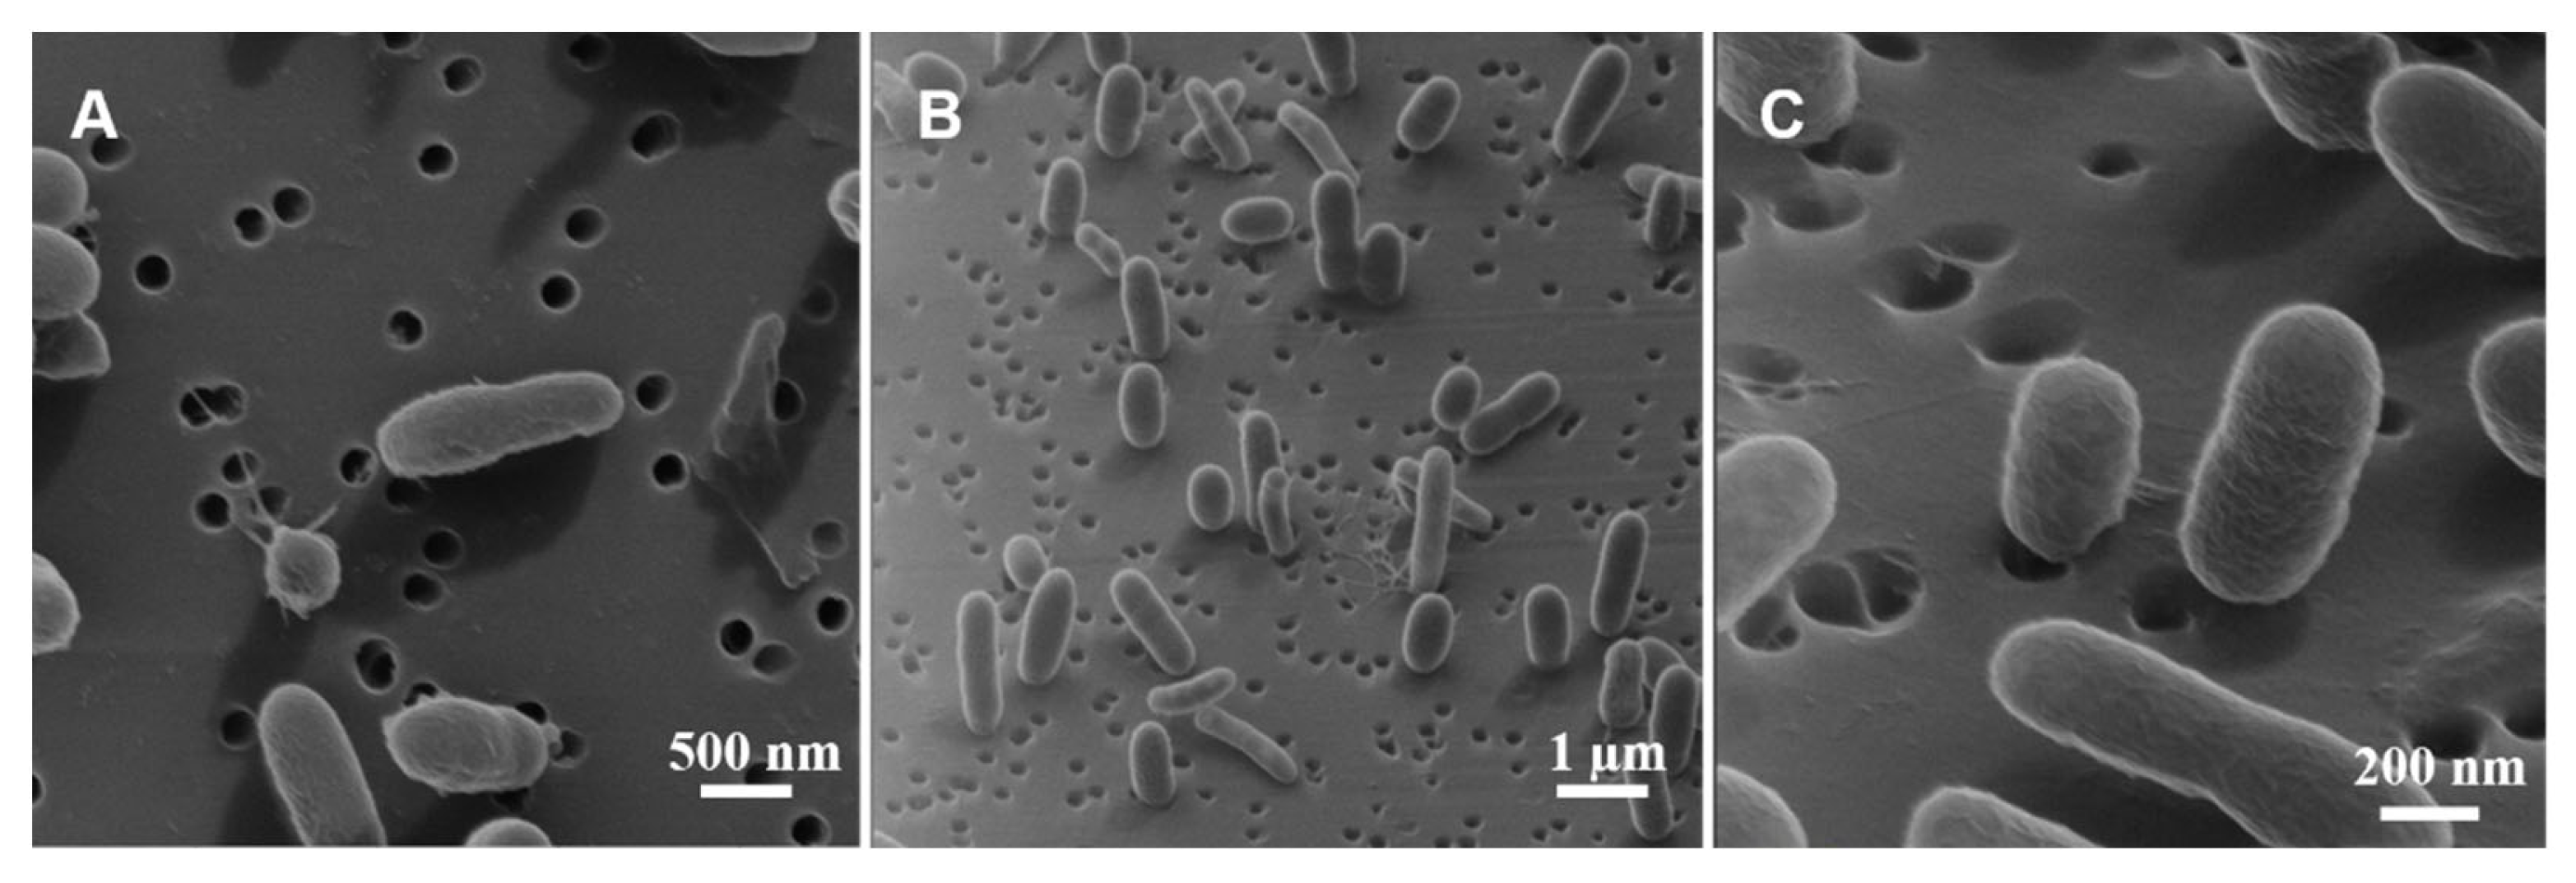
For V. fischeri cells, however, a close inspection of the shading around these apparently round features in SEM images (53 h timepoint in Figures S3 and S4) suggested that they did not correspond to an actual spherical morphology. To reveal the true three-dimensional cell morphology corresponding to these apparently round features in SEM images, we performed complementary high-resolution imaging by HIM [66], which employs a helium-ion beam with a small convergence angle [67] to extend the depth of field 5–10 times beyond that of SEM [68]. HIM images acquired in a top-down view (Figure 4A) were similar to SEM ones (53 h timepoint in Figure 2, Figure 3, Figures S3 and S4), including an apparently round feature (lower-left quadrant of Figure 4A), but off-normal angle HIM images clearly and directly showed these features to be rod-shaped V. fischeri cells attached to the support in a nearly perpendicular orientation (Figure 4B,C). Accordingly, the above statistical analysis of bacterial lengths (Table 2) applied only to the subpopulation of the rod-shaped bacteria for which the flat orientation on the support was clear in SEM images.
4.6. Mechanism for Producing the Extended-Rod Morphology
The consistent mean length and diameter values throughout the entire life cycle of V. fischeri (Table 2) provided an estimate of a mean aspect ratio as ca. 3.7, which was similar to the aspect ratio observed for cells identified in SEM images as adult individuals, e.g., stationary cells at 53 h timepoint in Figure 2. A small fraction of the cells at each timepoint starting from 20 h, however, exhibited an extended-rod morphology with aspect ratios >4 (Figure 3 and Figures S3–S5). Notably, these extended rods were typically about 2–3 times longer than statistically-average individual cells at the same timepoints (a “double-length” example is highlighted in Figure 3). Another yet smaller but distinct subpopulation of extra-long rods with lengths >10 µm could be identified at the 53 h and 117 h timepoints (Figures S3 and S4).
Considering the main bacterial growth mechanisms [69], the extended and extra-long rod minority subpopulations of V. fischeri with the observed characteristics can naturally emerge only in growth by cylindrical elongation and not by cell-tip extension. In the prototypical rod-shaped Escherichia coli, for example, extended and extra-long rod morphologies have previously been produced by cylindrical elongation from cells growing with suppressed division [69,70,71]. In our V. fischeri cultures, however, the double- and triple-length extended rods were much more frequent than the extra-long rods, pointing to discrete failures, rather than continuous suppression, of cell division as the most likely mechanism. Discrete failures should naturally produce many double- and triple-length individuals but few extra-long ones, because, for a given individual, the length would be determined not by the total growth time, but rather by the number of successive failed discrete divisions of its progenitor, i.e., by a mechanism exponentially suppressing extra-long rods. For example, in E. coli studies that employed cephalexin-induced, i.e., continuous, suppression of cell division, extended rods from an earlier timepoint became continuously longer with time [52,71], whereas, in our V. fischeri cultures, most of the extended rods never became extra-long at later timepoints (Figures S3 and S4).
4.7. Extended-Rod Morphology as a Metabolic Stress Indicator
Limited images from previous studies have shown normal V. fischeri populations as either exclusively short rods [62,63] or a mixture of short and extended rods similar to ours [52]. The latter study, in particular, correlated the elongated morphologies of bacteria to their growth under starvation conditions [52]. Accordingly, our extensive SEM imaging of a long-term V. fischeri culture provides the critical baseline statistics for use of the morphological distribution as a robust indicator of the long-term multigenerational environmental stress in environmental (eco)toxicology assays based on V. fischeri.
5. Conclusions
We systematically investigated the physicochemical and biological properties of V. fischeri bacteria to elucidate their compatibility with requirements for use in evaluating long-term environmental (eco)toxicity of novel anthropogenic pollutants, including nanomaterials and stimulus-responsive nanomaterials. Specifically, we investigated the pH-dependent growth, bioluminescence, and surface charge throughout the full life cycle of model V. fischeri populations.
We found that the pH of a V. fischeri culture medium, in the range between pH 6 and 8, primarily affects the growth of the V. fischeri population, which, in turn, modifies the time-profiles of bioluminescence. For applications of V. fischeri in both rapid and long-term bioluminescent-output bioassays, the pH-independent spectral shape of their bioluminescence and the nearly pH-independent ζ-potential provide validation of V. fischeri as a robust model microorganism. Particularly beneficial is the possibility to perform the V. fischeri assays in the practically important range of pH 6 to pH 8 without having to introduce “confounding factors” [72] to adjust the pH. For testing nanomaterials that change their surface charge significantly in this pH range, it is also useful to have model bacteria that maintain their surface charge, so that the testing predominantly reflects the physicochemical effect of the pH on the nanomaterials and not on the bacterial chemosensor.
To evaluate the long-term effects of novel anthropogenic pollutants, bioassays based on bioluminescence can be complemented by morphological analyses of rod-shaped V. fischeri cells, whereby significant changes in the nature and frequency of the extended-rod morphologies—defined as being longer than the 2.2 ± 1 µm average size and having an aspect ratio greater than 4—can be used as a robust indicator of the long-term multigenerational environmental stress in V. fischeri populations.
Supplementary Materials
The following are available online at https://www.mdpi.com/article/10.3390/chemosensors9100283/s1. Figure S1: Comparison of V. fischeri bioluminescence emission at different pH, Figure S2: Plates with a dilution series of V. fischeri for CFU counting, Figure S3: SEM images illustrating morphological changes throughout the life cycle of a V. fischeri population, Figure S4: SEM image of V. fischeri in the stationary phase (53 h timepoint), Figure S5: SEM image of V. fischeri in the exponential phase (24 h timepoint), Table S1: Viability assays for V. fischeri.
Author Contributions
Conceptualization, A.R.S. and D.Y.P.; methodology, A.R.S., C.S., L.P. and D.Y.P.; validation, A.R.S., C.S. and D.Y.P.; formal analysis, A.R.S. and C.S.; investigation, A.R.S., C.S., D.E., R.S., D.Y.P. and L.P.; resources, R.S., D.Y.P. and L.P.; writing—original draft preparation, A.R.S.; writing—review and editing, C.S., R.S., M.M.A., D.Y.P. and L.P.; supervision, M.M.A., D.Y.P. and L.P. All authors have read and agreed to the published version of the manuscript.
Funding
This study was supported by the Portuguese Foundation for Science and Technology (FCT) under the scope of the strategic funding of UIDB/04469/2020 unit and COMPETE 2020 (POCI-01-0145-FEDER-006684) and BioTecNorte operation (NORTE-01-0145-FEDER-000004) funded by European Regional Development Fund under the scope of Norte2020 Programa Operacional Regional do Norte. A.R.S. holds an FCT fellowship SFRH/BD/131905/2017. Measurements using the helium-ion microscope were supported by the Karlsruhe Nano Micro Facility (KNMF) of the Karlsruhe Institute of Technology (KIT) under projects 2016-015-010689 and 2018-019-021475.
Institutional Review Board Statement
Not applicable.
Data Availability Statement
Data are contained within the article and Supplementary Materials.
Acknowledgments
The authors acknowledge Pedro Martins (University of Minho) for the support in the surface charge and bacteria life cycle analysis.
Conflicts of Interest
The authors declare no conflict of interest. The funders had no role in the design of the study; in the collection, analyses, or interpretation of data; in the writing of the manuscript, or in the decision to publish the results.
References
- Abbas, M.; Adil, M.; Ehtisham-ul-Haque, S.; Munir, B.; Yameen, M.; Ghaffar, A.; Shar, G.A.; Asif Tahir, M.; Iqbal, M. Vibrio fischeri bioluminescence inhibition assay for ecotoxicity assessment: A review. Sci. Total Environ. 2018, 626, 1295–1309. [Google Scholar] [CrossRef]
- Kharkova, A.S.; Arlyapov, V.A.; Turovskaya, A.D.; Shvets, V.I.; Reshetilov, A.N. A mediator microbial biosensor for assaying general toxicity. Enzym. Microb. Technol. 2020, 132, 109435. [Google Scholar] [CrossRef] [PubMed]
- Mirjani, M.; Soleimani, M.; Salari, V. Toxicity assessment of total petroleum hydrocarbons in aquatic environments using the bioluminescent bacterium Aliivibrio fischeri. Ecotoxicol. Environ. Saf. 2021, 207, 111554. [Google Scholar] [CrossRef] [PubMed]
- Parvez, S.; Venkataraman, C.; Mukherji, S. A review on advantages of implementing luminescence inhibition test (Vibrio fischeri) for acute toxicity prediction of chemicals. Environ. Int. 2006, 32, 265–268. [Google Scholar] [CrossRef]
- Asano, T.; Wang, P.C.; Iwasaki, A. Spectrophotometric detection of labile zinc (II) released from metallothionein: A simple method to evaluate heavy metal toxicity. J. Biosci. Bioeng. 2010, 109, 638–644. [Google Scholar] [CrossRef]
- Mendonça, E.; Picado, A.; Paixão, S.M.; Silva, L.; Cunha, M.A.; Leitão, S.; Moura, I.; Cortez, C.; Brito, F. Ecotoxicity tests in the environmental analysis of wastewater treatment plants: Case study in Portugal. J. Hazard. Mater. 2009, 163, 665–670. [Google Scholar] [CrossRef] [PubMed]
- Gottardo, S.; Mech, A.; Drbohlavová, J.; Małyska, A.; Bøwadt, S.; Riego Sintes, J.; Rauscher, H. Towards safe and sustainable innovation in nanotechnology: State-of-play for smart nanomaterials. NanoImpact 2021, 21, 100297. [Google Scholar] [CrossRef]
- Grillo, R.; Mattos, B.D.; Antunes, D.R.; Forini, M.M.L.; Monikh, F.A.; Rojas, O.J. Foliage adhesion and interactions with particulate delivery systems for plant nanobionics and intelligent agriculture. Nano Today 2021, 37, 101078. [Google Scholar] [CrossRef]
- Karimi, M.; Sadeghi, R.; Kokini, J. Human exposure to nanoparticles through trophic transfer and the biosafety concerns that nanoparticle-contaminated foods pose to consumers. Trends Food Sci. Technol. 2018, 75, 129–145. [Google Scholar] [CrossRef]
- Fytianos, G.; Rahdar, A.; Kyzas, G.Z. Nanomaterials in cosmetics: Recent updates. Nanomaterials 2020, 10, 979. [Google Scholar] [CrossRef]
- Rodrigues, S.M.; Trindade, T.; Duarte, A.C.; Pereira, E.; Koopmans, G.F.; Römkens, P.F.A.M. A framework to measure the availability of engineered nanoparticles in soils: Trends in soil tests and analytical tools. TrAC Trends Anal. Chem. 2016, 75, 129–140. [Google Scholar] [CrossRef]
- Németh, I.; Molnár, S.; Vaszita, E.; Molnár, M. The Biolog EcoPlateTM technique for assessing the effect of metal oxide nanoparticles on freshwater microbial communities. Nanomaterials 2021, 11, 1777. [Google Scholar] [CrossRef] [PubMed]
- Fekete-Kertész, I.; Piszmán, D.; Molnár, M. Particle size and concentration dependent ecotoxicity of nano- and microscale TiO2 —Comparative study by different aquatic test organisms of different trophic levels. Water Air Soil Pollut. 2017, 228, 245. [Google Scholar] [CrossRef]
- Trinh, T.X.; Kim, J. Status Quo in data availability and predictive models of nano-mixture toxicity. Nanomaterials 2021, 11, 124. [Google Scholar] [CrossRef] [PubMed]
- Ríos, F.; Fernández-Arteaga, A.; Fernández-Serrano, M.; Jurado, E.; Lechuga, M. Silica micro- and nanoparticles reduce the toxicity of surfactant solutions. J. Hazard. Mater. 2018, 353, 436–443. [Google Scholar] [CrossRef]
- Urbanczyk, H.; Ast, J.C.; Higgins, M.J.; Carson, J.; Dunlap, P.V. Reclassification of Vibrio fischeri, Vibrio logei, Vibrio salmonicida and Vibrio wodanis as Aliivibrio fischeri gen. nov., comb. nov., Aliivibrio logei comb. nov., Aliivibrio salmonicida comb. nov. and Aliivibrio wodanis comb. nov. Int. J. Syst. Evol. Microbiol. 2007, 57, 2823–2829. [Google Scholar] [CrossRef] [PubMed] [Green Version]
- Kimura, Y.; Tashiro, Y.; Saito, K.; Kawai-Noma, S.; Umeno, D. Directed evolution of Vibrio fischeri LuxR signal sensitivity. J. Biosci. Bioeng. 2016, 122, 533–538. [Google Scholar] [CrossRef] [Green Version]
- Fuqua, W.C.; Winans, C.S.; Greenberg, E.P. Quorum sensing in bacteria: The LuxR-LuxI family of cell density-responsive transcriptional regulators. J. Bacteriol. 1994, 176, 269–275. [Google Scholar] [CrossRef] [Green Version]
- Madden, D.; Lidesten, B.-M. Bacterial illumination Culturing luminous bacteria. In Bioscience Explained; NCBE, The University of Reading: Reading, UK, 2001; Volume 1, pp. 1–8. [Google Scholar]
- Nealson, K.H.; Platt, T.; Hastings, J.W. Cellular control of the synthesis and activity of the bacterial luminescent system. J. Bacteriol. 1970, 104, 313–322. [Google Scholar] [CrossRef] [Green Version]
- Kaiser, K.L.E. Correlations of Vibrio fischeri bacteria test data with bioassay data for other organisms. Environ. Health Perspect. 1998, 106, 583–591. [Google Scholar]
- Dunn, A.K. Vibrio fischeri metabolism: Symbiosis and beyond. Adv. Microb. Physiol. 2012, 61, 37–68. [Google Scholar] [CrossRef]
- Bose, J.L.; Kim, U.; Bartkowski, W.; Gunsalus, R.P.; Overley, A.M.; Lyell, N.L.; Visick, K.L.; Stabb, E.V. Bioluminescence in Vibrio fischeri is controlled by the redox-responsive regulator ArcA. Mol. Microbiol. 2007, 65, 538–553. [Google Scholar] [CrossRef] [PubMed] [Green Version]
- Li, Y.-H.; Tian, X. Quorum sensing and bacterial social interactions in biofilms. Sensors 2012, 12, 2519–2538. [Google Scholar] [CrossRef] [PubMed]
- Lupp, C.; Ruby, E.G. Vibrio fischeri uses two quorum-sensing systems for the regulation of early and late colonization factors. J. Bacteriol. 2005, 187, 3620–3629. [Google Scholar] [CrossRef] [Green Version]
- Manefield, M.; Chong, G. Quorum Sensing signal synthesis may represent a selective advantage independent of its role in regulation of bioluminescence in Vibrio fischeri. PLoS ONE 2013, 8, e6744. [Google Scholar] [CrossRef]
- Pérez, P.D.; Hagen, S.J. Heterogeneous response to a quorum-sensing signal in the luminescence of individual Vibrio fischeri. PLoS ONE 2010, 5, e15473. [Google Scholar] [CrossRef] [Green Version]
- Scheerer, S.; Gomez, F.; Lloyd, D. Bioluminescence of Vibrio fischeri in continuous culture: Optimal conditions for stability and intensity of photoemission. J. Microbiol. Methods 2006, 67, 321–329. [Google Scholar] [CrossRef]
- Rizzo, L. Bioassays as a tool for evaluating advanced oxidation processes in water and wastewater treatment. Water Res. 2011, 45, 4311–4340. [Google Scholar] [CrossRef] [PubMed]
- Marugán, J.; Bru, D.; Pablos, C.; Catalá, M. Comparative evaluation of acute toxicity by Vibrio fischeri and fern spore based bioassays in the follow-up of toxic chemicals degradation by photocatalysis. J. Hazard. Mater. 2012, 213–214, 117–122. [Google Scholar] [CrossRef]
- Miyashiro, T.; Ruby, E.G. Shedding light on bioluminescence regulation in Vibrio fischeri. Mol. Microbiol. 2013, 84, 795–806. [Google Scholar] [CrossRef] [PubMed] [Green Version]
- Silva, A.R.; Martins, P.M.; Lanceros-Mendez, S.; Teixeira, S.; Carabineiro, S.A.C.; Kuehn, K.; Cuniberti, G.; Alves, M.M.; Pereira, L. Ciprofloxacin wastewater treated by UVA photocatalysis: Contribution of irradiated TiO2 and ZnO nanoparticles on the final toxicity as assessed by Vibrio fischeri. RSC Adv. 2016, 6, 95494–95503. [Google Scholar] [CrossRef]
- Silva, A.R.; Soares, O.S.G.P.; Pereira, M.F.R.; Alves, M.M.; Pereira, L. Tailoring carbon nanotubes to enhance their efficiency as electron shuttle on the biological removal of acid orange 10 under anaerobic conditions. Nanomaterials 2020, 10, 2496. [Google Scholar] [CrossRef]
- Silva, A.R.; Cavaleiro, A.J.; Soares, O.S.G.P.; Braga, C.S.N.; Salvador, A.F.; Pereira, M.F.R.; Alves, M.M.; Pereira, L. Detoxification of ciprofloxacin in an anaerobic bioprocess supplemented with magnetic carbon nanotubes: Contribution of adsorption and biodegradation mechanisms. Int. J. Mol. Sci. 2021, 22, 2932. [Google Scholar] [CrossRef] [PubMed]
- Qi, X.; Liu, P.; Liang, P.; Hao, W.; Li, M.; Huang, X. Dual-signal-biosensor based on luminescent bacteria biofilm for real-time online alert of Cu (II) shock. Biosens. Bioelectron. 2019, 142, 111500. [Google Scholar] [CrossRef] [PubMed]
- Parvez, S.; Venkataraman, C.; Mukherji, S. Toxicity assessment of organic pollutants: Reliability of bioluminescence inhibition assay and univariate QSAR models using freshly prepared Vibrio fischeri. Toxicol. In Vitro 2008, 22, 1806–1813. [Google Scholar] [CrossRef] [PubMed]
- Bird, D.J.; Jennings, V.L.K.; Rayner-Brandes, M.H. Assessing chemical toxicity with the bioluminescent Photobacterium (Vibrio fischeri): A comparison of three commercial systems. Water Res. 2001, 35, 3448–3456. [Google Scholar]
- Bayo, J.; Angosto, J.M.; Gómez-López, M.D. Ecotoxicological screening of reclaimed disinfected wastewater by Vibrio fischeri bioassay after a chlorination-dechlorination process. J. Hazard. Mater. 2009, 172, 166–171. [Google Scholar] [CrossRef]
- Minetto, D.; Libralato, G.; Ghirardini, A.V. Ecotoxicity of engineered TiO2 nanoparticles to saltwater organisms: An overview. Environ. Int. 2014, 66, 18–27. [Google Scholar] [CrossRef]
- Bystrzejewska-Piotrowska, G.; Golimowski, J.; Urban, P.L. Nanoparticles: Their potential toxicity, waste and environmental management. Waste Manag. 2009, 29, 2587–2595. [Google Scholar] [CrossRef]
- Hussain, S.M.; Braydich-Stolle, L.K.; Schrand, A.M.; Murdock, R.C.; Yu, K.O.; Mattie, D.M.; Schlager, J.J. Toxicity evaluation for safe use of nanomaterials: Recent achievements and technical challenges. Adv. Mater. 2009, 21, 1549–1559. [Google Scholar] [CrossRef]
- Neal, A.L. What can be inferred from bacterium—nanoparticle interactions about the potential consequences of environmental exposure to nanoparticles? Ecotoxicology 2008, 17, 362–371. [Google Scholar] [CrossRef] [PubMed]
- Tartanson, M.-A.; Soussan, L.; Rivallin, M.; Pecastaings, S.; Chis, C.V.; Penaranda, D.; Roques, C.; Faur, C. Dynamic mechanisms of the bactericidal action of an Al2O3-TiO2-Ag granular material on an Escherichia coli strain. Appl. Environ. Microbiol. 2015, 81, 7135–7142. [Google Scholar] [CrossRef] [Green Version]
- Zhang, W.; Hughes, J.; Chen, Y. Impacts of hematite nanoparticle exposure on biomechanical, adhesive, and surface electrical properties of Escherichia coli cells. Appl. Environ. Microbiol. 2012, 78, 3905–3915. [Google Scholar] [CrossRef] [PubMed] [Green Version]
- Gao, X.-L.; Shao, M.-F.; Xu, Y.-S.; Luo, Y.; Zhang, K.; Ouyang, F.; Li, J. Non-selective separation of bacterial cells with magnetic nanoparticles facilitated by varying surface charge. Front. Microbiol. 2016, 7, 1891. [Google Scholar] [CrossRef] [PubMed]
- Westmeier, D.; Hahlbrock, A.; Reinhardt, C.; Fröhlich-Nowoisky, J.; Wessler, S.; Vallet, C.; Pöschl, U.; Knauer, S.K.; Stauber, R.H. Nanomaterial–microbe cross-talk: Physicochemical principles and (patho) biological consequences. Chem. Soc. Rev. 2018, 47, 5312–5337. [Google Scholar] [CrossRef] [PubMed]
- Kurvet, I.; Juganson, K.; Vija, H.; Sihtmäe, M.; Blinova, I.; Syvertsen-Wiig, G.; Kahru, A. Toxicity of nine (doped) rare earth metal oxides and respective individual metals to aquatic microorganisms Vibrio fischeri and Tetrahymena thermophila. Materials 2017, 10, 754. [Google Scholar] [CrossRef] [Green Version]
- ISO 11348-1 INTERNATIONAL STANDARD. Water Quality—Determination of the Inhibitory Effect of Water Samples on the Light Emission of Vibrio fischeri (Luminescent Bacteria Test)—Part1: Method Using Freshly Prepared Bacteria; ISO—International Organization for Standardization: Geneva, Switzerland, 1998. [Google Scholar]
- ISO 11348-3 INTERNATIONAL STANDARD. Water Quality—Determination of the Inhibitory Effect of Water Samples on the Light Emission of Vibrio fischeri (Luminescent Bacteria Test)—Part3: Method Using Freeze-Dried Bacteria; ISO—International Organization for Standardization: Geneva, Switzerland, 2007. [Google Scholar]
- Sousa, C.; Petrovykh, D.Y. Characterization of Bio-nanosystems. In Advances in Processing Technologies for Bio-Based Nanosystems in Food; Ramos, O., Pereira, R., Cerqueira, M., Martins, J., Teixeira, J., Malcata, F., Vicente, A., Eds.; CRC Press: Boca Raton, FL, USA, 2019; pp. 271–306. ISBN 9780128115169. [Google Scholar]
- Waters, P.; Lloyd, D. Salt, pH and temperature dependencies of growth and bioluminescence of three species of luminous bacteria analysed on gradient plates. Microbiology 1985, 131, 2865–2869. [Google Scholar] [CrossRef] [Green Version]
- Fulladosa, E.; Murat, J.C.; Villaescusa, I. Effect of cadmium (II), chromium (VI), and arsenic (V) on long-term viability- and growth-inhibition assays using Vibrio fischeri marine bacteria. Arch. Environ. Contam. Toxicol. 2005, 49, 299–306. [Google Scholar] [CrossRef]
- Schmitz, R.P.H.; Eisentrager, A.; Dott, W. Miniaturized kinetic growth inhibition assays with Vibrio fischeri and Pseudomonas putida (application, validation and comparison). J. Microbiol. Methods 1998, 31, 159–166. [Google Scholar] [CrossRef]
- Pan, H.; Zhang, Y.; He, G.-X.; Katagori, N.; Chen, H. A comparison of conventional methods for the quantification of bacterial cells after exposure to metal oxide nanoparticles. BMC Microbiol. 2014, 14, 222. [Google Scholar] [CrossRef] [Green Version]
- Hannig, C.; Hannig, M.; Rehmer, O.; Braun, G.; Hellwig, E.; Al-Ahmad, A. Fluorescence microscopic visualization and quantification of initial bacterial colonization on enamel in situ. Arch. Oral Biol. 2007, 52, 1048–1056. [Google Scholar] [CrossRef] [PubMed]
- Sousa, C.; Sequeira, D.; Kolen’ko, Y.V.; Pinto, I.M.; Petrovykh, D.Y. Analytical protocols for separation and electron microscopy of nanoparticles interacting with bacterial cells. Anal. Chem. 2015, 87, 4641–4648. [Google Scholar] [CrossRef] [PubMed] [Green Version]
- Foster, J.S.; Khodadad, C.L.M.; Ahrendt, S.R.; Parrish, M.L. Impact of simulated microgravity on the normal developmental time line of an animal-bacteria symbiosis. Sci. Rep. 2013, 3, 1340. [Google Scholar] [CrossRef] [PubMed] [Green Version]
- Dunn, A.K.; Stabb, E.V. Genetic analysis of trimethylamine N- oxide reductases in the light organ symbiont Vibrio fischeri ES114. J. Bacteriol. 2008, 190, 5814–5823. [Google Scholar] [CrossRef] [Green Version]
- Ivanova, E.P.; Mitik-Dineva, N.; Mocanasu, R.C.; Murphy, S.; Wang, J.; van Riessen, G.; Crawford, R.J. Vibrio fischeri and Escherichia coli adhesion tendencies towards photolithographically modified nanosmooth poly (tert-butyl methacrylate) polymer surfaces. Nanotechnol. Sci. Appl. 2008, 1, 33–44. [Google Scholar] [CrossRef] [Green Version]
- Barbarossa, M.V.; Kuttler, C.; Fekete, A.; Rothballer, M. A delay model for quorum sensing of Pseudomonas putida. BioSystems 2010, 102, 148–156. [Google Scholar] [CrossRef]
- Gusnard, D.; Kirschner, R.H. Cell and organelle shrinkage during preparation for scanning electron microscopy: Effects of fixation, dehydration and critical point drying. J. Microsc. 1977, 110, 51–57. [Google Scholar] [CrossRef]
- Millikan, D.S.; Ruby, E.G. Vibrio fischeri flagellin A is essential for normal motility and for symbiotic competence during initial squid light organ colonization. J. Bacteriol. 2004, 186, 4315–4325. [Google Scholar] [CrossRef] [Green Version]
- Falcioni, T.; Papa, S.; Campana, R.; Manti, A.; Battistelli, M.; Baffone, W.; Bo, C. State transitions of Vibrio parahaemolyticus VBNC cells evaluated by flow cytometry. Cytom. Part B Clin. Cytom. 2008, 74, 272–281. [Google Scholar] [CrossRef]
- Oliver, J.D.; Nilsson, L.; Kjelleberg, S. Formation of nonculturable Vibrio vulnificus cells and its relationship to the starvation state. Appl. Environ. Microbiol. 1991, 57, 2640–2644. [Google Scholar] [CrossRef] [Green Version]
- Oliver, J.D. The viable but non-culturable state in the human pathogen Vibrio vulnificus. FEMS Microbiol. Lett. 1995, 133, 203–208. [Google Scholar] [CrossRef]
- Joens, M.S.; Huynh, C.; Kasuboski, J.M.; Ferranti, D.; Sigal, Y.J.; Zeitvogel, F.; Obst, M.; Burkhardt, C.J.; Curran, K.P.; Chalasani, S.H.; et al. Helium Ion Microscopy (HIM) for the imaging of biological samples at sub-nanometer resolution. Sci. Rep. 2013, 3, 3514. [Google Scholar] [CrossRef] [PubMed] [Green Version]
- Hill, R.; Notte, J.; Ward, B. The ALIS He ion source and its application to high resolution microscopy. Phys. Procedia 2008, 1, 135–141. [Google Scholar] [CrossRef] [Green Version]
- Ward, B.W.; Notte, J.A.; Economou, N.P. Helium ion microscope: A new tool for nanoscale microscopy and metrology. J. Vac. Sci. Technol. B 2006, 24, 2871–2874. [Google Scholar] [CrossRef] [Green Version]
- Chang, F.; Huang, K.C. How and why cells grow as rods. BMC Biol. 2014, 12, 54. [Google Scholar] [CrossRef] [Green Version]
- Ursell, T.S.; Nguyen, J.; Monds, R.D.; Colavin, A.; Billings, G.; Ouzounov, N.; Gitai, Z.; Shaevitz, J.W.; Huang, K.C. Rod-like bacterial shape is maintained by feedback between cell curvature and cytoskeletal localization. Proc. Natl. Acad. Sci. USA 2014, 111, 1025–1034. [Google Scholar] [CrossRef] [Green Version]
- Kruse, T.; Bork-Jensen, J.; Gerdes, K. The morphogenetic MreBCD proteins of Escherichia coli form an essential membrane-bound complex. Mol. Microbiol. 2005, 55, 78–89. [Google Scholar] [CrossRef]
- Postma, J.F.; de Valk, S.; Dubbeldam, M.; Maas, J.L.; Tonkes, M.; Schipper, C.A.; Kater, B.J. Confounding factors in bioassays with freshwater and marine organisms. Ecotoxicol. Environ. Saf. 2002, 53, 226–237. [Google Scholar] [CrossRef]
Figure 1.
Continuous monitoring of V. fischeri aerobic growth at different pH. Data are shown with a different symbol for each of the three pH values and represent continuous measurements over 70 h of (A) optical density (OD) and (B) bioluminescence emission. Correlated initial (17 h) and secondary (28 h) peaks in bioluminescence are observed at pH 7 and 8, in contrast to a single peak (25 h) at pH 6.

Figure 2.
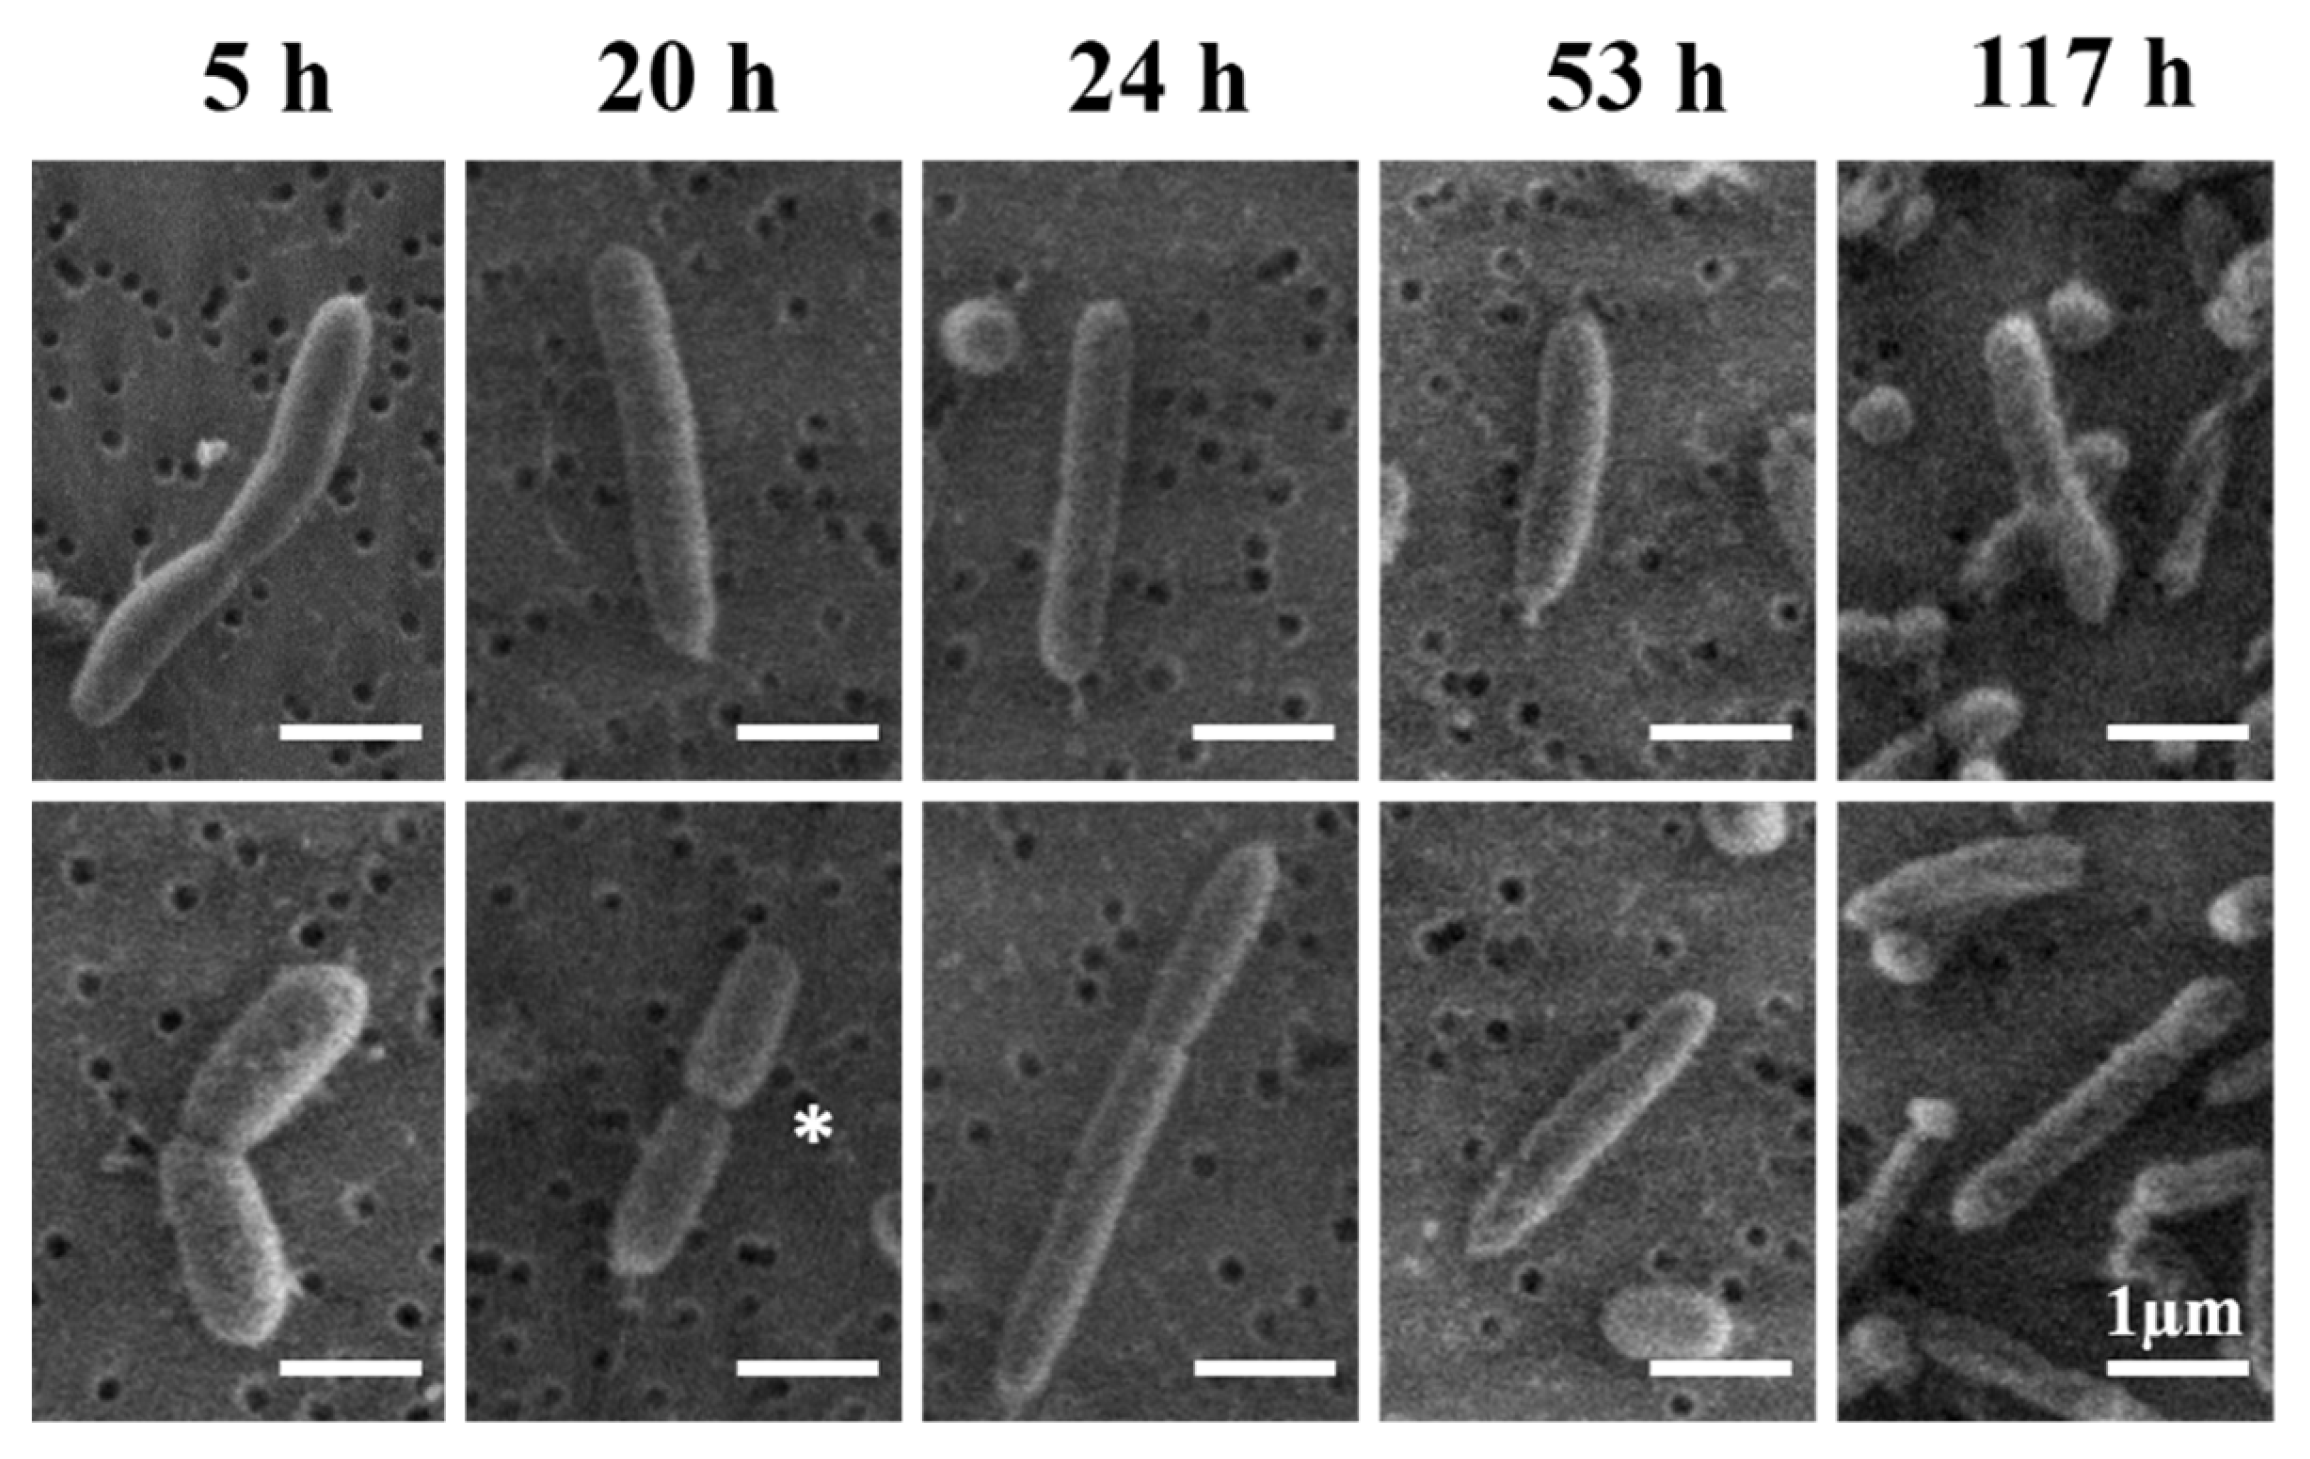
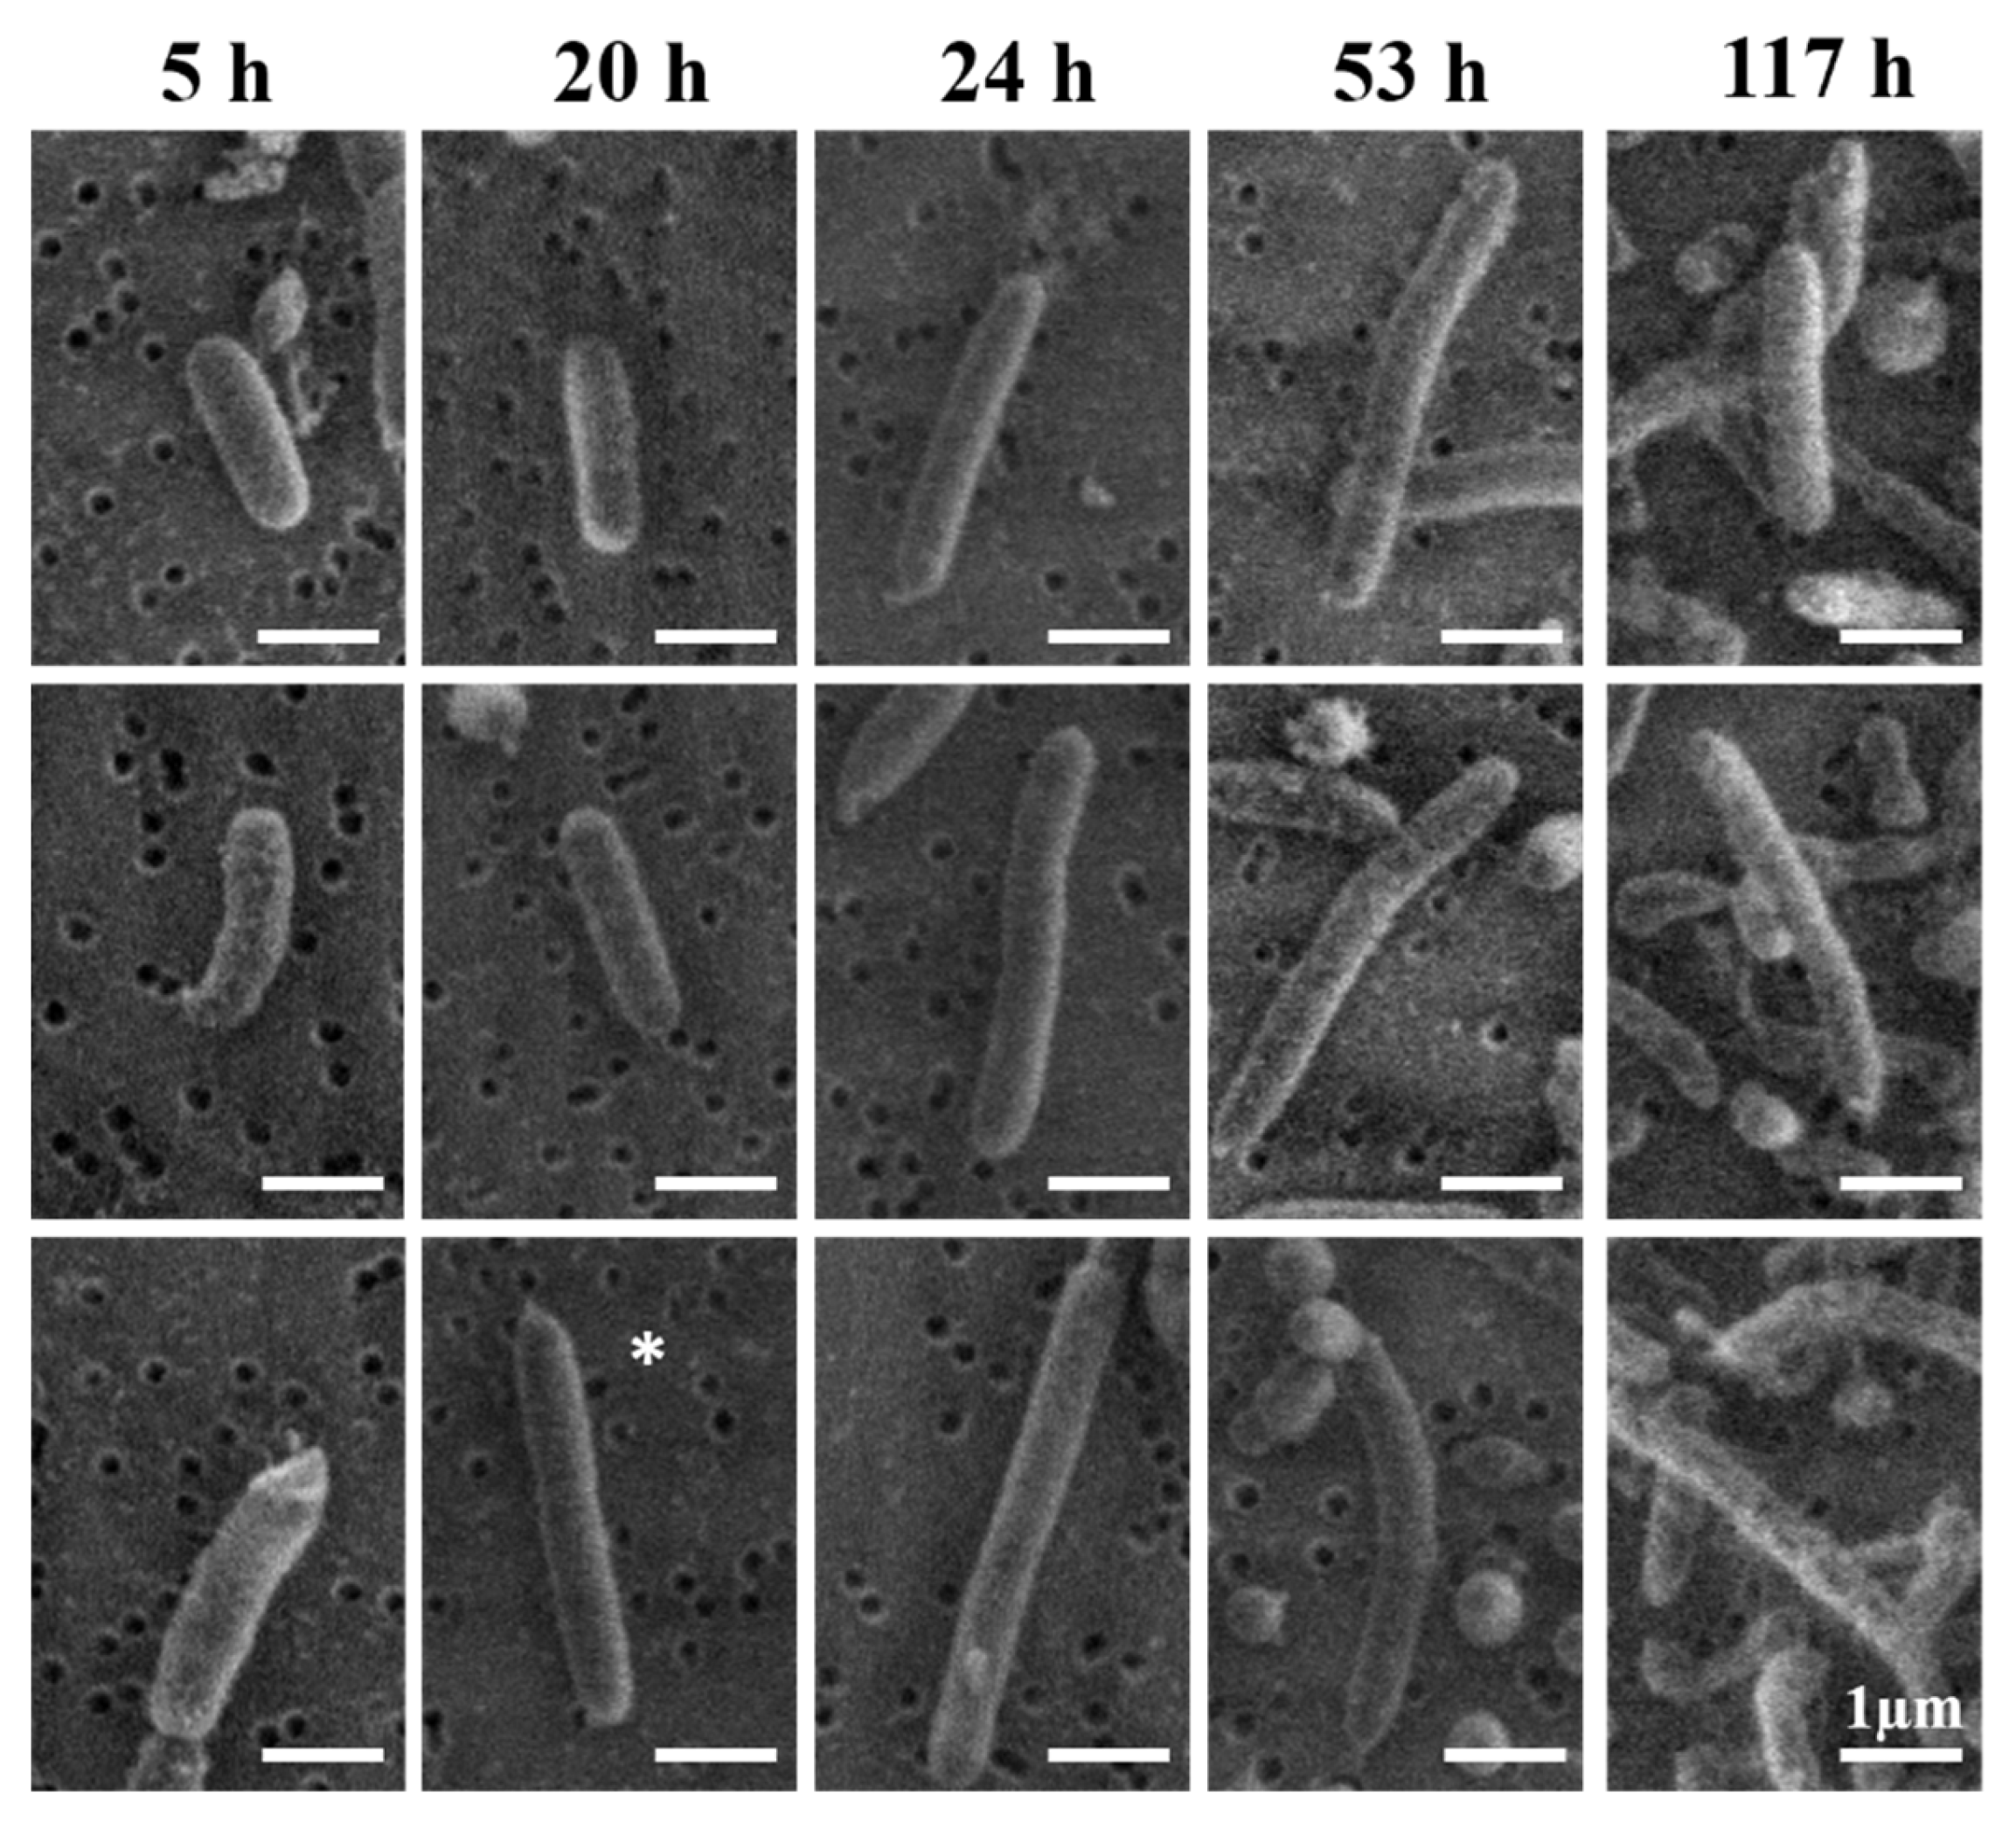
Scanning electron microscopy (SEM) images illustrating the cell division pattern throughout the life cycle of a V. fischeri population. The depicted timepoints correspond to the lag (5 h), exponential (20 h and 24 h), stationary (53 h), and death (117 h) phases (see Figure 1A). The full-grown adult cells of ca. 2 µm length are observed at 53 h. Cells undergoing division are commonly observed only in the first two phases (5 h, 20 h, and 24 h); * clear example of a septum in the exponential phase (20 h). Dark round features in the background are ca. 0.2 µm pores in the supporting polycarbonate filter.
Figure 2.
Scanning electron microscopy (SEM) images illustrating the cell division pattern throughout the life cycle of a V. fischeri population. The depicted timepoints correspond to the lag (5 h), exponential (20 h and 24 h), stationary (53 h), and death (117 h) phases (see Figure 1A). The full-grown adult cells of ca. 2 µm length are observed at 53 h. Cells undergoing division are commonly observed only in the first two phases (5 h, 20 h, and 24 h); * clear example of a septum in the exponential phase (20 h). Dark round features in the background are ca. 0.2 µm pores in the supporting polycarbonate filter.

Figure 3.
Emergence of the extended-rod morphology over the life cycle of V. fischeri. SEM images were acquired at five timepoints corresponding to the lag (5 h), exponential (20 h and 24 h), stationary (53 h), and death (117 h) phases (see Figure 1A). Panels at each timepoint illustrate that, starting from aspect ratios in the 3.5–4.0 range for normal adult individuals (ca. 2 µm in length), increasingly higher aspect ratios are observed for extended-rod morphologies as a function of increasing growth time; * clear example of a “double-length” extended-rod morphology in the exponential phase (20 h).

Figure 4.
Helium-ion microscopy (HIM) images of V. fischeri in the exponential phase (24 h timepoint). Ambiguity in interpreting the cell morphology based on the top-down view (A) is resolved by tilting the stage 50° off-normal (B,C).
Figure 4.
Helium-ion microscopy (HIM) images of V. fischeri in the exponential phase (24 h timepoint). Ambiguity in interpreting the cell morphology based on the top-down view (A) is resolved by tilting the stage 50° off-normal (B,C).


Table 1.
Zeta-potential of V. fischeri grown under different pH conditions.
| pH | Growth at Specified pH 1 (ζ-Potential, mV) | Exposed to Specified pH 2 (ζ-Potential, mV) |
|---|---|---|
| 6 | −40.8 ± 5.9 | −18.0 ± 1.2 |
| 6.5 | - | −37.9 ± 0.8 |
| 7 | −44.5 ± 3.9 | −38.9 ± 0.7 |
| 7.5 | - | −37.5 ± 0.6 |
| 8 | −45.8 ± 7.4 | −38.4 ± 0.9 |
1 Grown for 24 h in medium at the specified pH, then measured in water at pH 7. 2 Grown for 24 h in medium at pH 7, then measured in water at the specified pH.
Table 2.
Distributions of length and diameter of V. fischeri throughout the life cycle.
| Growth Time (h) | Length (µm) | Diameter (µm) |
|---|---|---|
| 5 | 3.2 ± 1.9 | 0.59 ± 0.1 |
| 20 | 2.2 ± 1.0 | 0.63 ± 0.1 |
| 24 | 1.9 ± 0.6 | 0.59 ± 0.1 |
| 53 | 2.1 ± 0.9 | 0.59 ± 0.1 |
| 117 | 2.1 ± 0.8 | 0.53 ± 0.1 |
| Average | 2.2 ± 1 | 0.6 ± 0.1 |
Publisher’s Note: MDPI stays neutral with regard to jurisdictional claims in published maps and institutional affiliations. |
© 2021 by the authors. Licensee MDPI, Basel, Switzerland. This article is an open access article distributed under the terms and conditions of the Creative Commons Attribution (CC BY) license (https://creativecommons.org/licenses/by/4.0/).
Share and Cite
MDPI and ACS Style
Silva, A.R.; Sousa, C.; Exner, D.; Schwaiger, R.; Alves, M.M.; Petrovykh, D.Y.; Pereira, L. pH-Induced Modulation of Vibrio fischeri Population Life Cycle. Chemosensors 2021, 9, 283. https://doi.org/10.3390/chemosensors9100283
AMA Style
Silva AR, Sousa C, Exner D, Schwaiger R, Alves MM, Petrovykh DY, Pereira L. pH-Induced Modulation of Vibrio fischeri Population Life Cycle. Chemosensors. 2021; 9(10):283. https://doi.org/10.3390/chemosensors9100283
Chicago/Turabian StyleSilva, Ana Rita, Cláudia Sousa, Daniela Exner, Ruth Schwaiger, Maria Madalena Alves, Dmitri Y. Petrovykh, and Luciana Pereira. 2021. "pH-Induced Modulation of Vibrio fischeri Population Life Cycle" Chemosensors 9, no. 10: 283. https://doi.org/10.3390/chemosensors9100283
Note that from the first issue of 2016, this journal uses article numbers instead of page numbers. See further details here.