Article

One-Step Polylactic Acid Screen-Printing Microfluidic Paper-Based Analytical Device: Application for Simultaneous Detection of Nitrite and Nitrate in Food Samples

by
Siriwan Teepoo
*,
Supattra Arsawiset
and
Pitchayatida Chanayota
Department of Chemistry, Faculty of Science and Technology, Rajamangala University of Technology Thanyaburi, Pathum Thani 12110, Thailand
*
Author to whom correspondence should be addressed.
Chemosensors 2019, 7(3), 44; https://doi.org/10.3390/chemosensors7030044
Submission received: 5 August 2019 / Revised: 26 August 2019 / Accepted: 3 September 2019 / Published: 9 September 2019

Abstract

:
In this work, we report a one-step approach for fabricating screened-printed microfluidic paper-based analytical devices (μPADs) using polylactic acid as a new hydrophobic material. A polylactic acid solution was screen printed onto chromatography papers to create hydrophobic patterns for fluidic channels. The optimal polylactic acid concentration for successful device fabrication is 9% w/v. The μPADs were fabricated within 2 min and provided high reproducibility and stability. The utility of polylactic acid screen-printing was demonstrated for the simultaneous detection of nitrite and nitrate using colorimetric detection. Under optimized experimental conditions, the detection limits and the linear ranges, respectively, were 1.2 mg L−1 and 2–10 mg L−1 for nitrite and 3.6 mg L−1 and 10–50 mg L−1 for nitrate. The detection times for both ions were found to be within 12 min. The developed μPAD was applied for the simultaneous determination of these ions in food samples, and no significant differences in the analytical results were observed compared to those of the reference method. The polylactic acid screen-printing approach presented here provides a simple, rapid, and cost-effective alternative fabrication method for fabricating μPADs.

Graphical Abstract

1. Introduction

Paper-based analytical devices are a new technology [1,2,3]. They have many practical applications due to their simplicity and portability, low cost and reduced sample/reagent consumption [4,5]. Thus, microfluidic paper-based analytical devices (µPADs) have been widely applied in such fields as medicine [6,7,8], the food industry [9,10,11], and environmental fields [12,13,14]. Multiple processes can be applied to create a hydrophobic barrier on paper, including photolithography [15,16], light irradiation [17], plasma treatment [18], laser cutting [19], stamping [20], inkjet printing [21,22], wax printing [23,24], and screen printing [25,26]. However, photolithography, plasma-treatment, laser-cutting, and inkjet-printing techniques have some limitations, such as expensive fabrication instrumentation, multi-step fabrication processes, and long fabrication times [27]. Wax printing enables easy fabrication and low cost but requires a heating step that causes the wax to spread, decreasing the feature resolution [27,28]. Alternative materials such as polymer solutions, polystyrene [28], polydimethylsiloxane [29], and polycaprolactone [30] have been used to create hydrophobic regions on μPADs to overcome wax material’s drawbacks. This technique provides high resolution and repeatability.
In this work, we demonstrate an alternative material approach for fabricating μPADs using polylactic acid (Figure 1). Polylactic acid is an aliphatic polyester that is strongly hydrophobic, making it suitable for creating hydrophobic areas [31]. Another advantage of polylactic acid is that it is a biomaterial polymer, so the final product of μPADs can be degraded and reabsorbed into the environment [32]. The new biopolymer screen-printing method is performed in one step, without requiring complex instrumentations and using only a patterned screen. Hydrophobic patterns are created on paper, and polylactic acid solution passes through the patterned screen and is deposited on the paper’s surface.
To demonstrate its analytical capabilities, the proposed μPAD was applied to detect nitrite and nitrate contamination in food samples. Nitrite and nitrate salts are traditionally used as food additives in food processes and as preservatives, antioxidants, and antimicrobial agents [33,34]. These salts have been used as additives in the food industry for a long time, such as in sausages, bacon, and jerky [35,36]. However, excess nitrite and nitrate in food products is harmful [37]. The Joint Expert Committee of the Food and Agriculture Organization of the United Nations/World Health Organization (WHO) [JECFA] and the European Commission’s (EC) Scientific Committee on Food 2002 have set an acceptable daily intake (ADI) for nitrate from 0.0 to 3.7 mg nitrate ions per kg of body weight and from 0.00 to 0.07 mg nitrite ions per kg of body weight. The maximum permitted levels of nitrate and nitrite based on Thai regulations are 500 and 125 mg kg−1, respectively, for the industrial preparation of food from vegetables, meat, and fruits. Because of the harmful effects of nitrite and nitrate, developing reliable techniques for detecting nitrite and nitrate contamination in foods has attracted significant interest to prevent toxicity. Therefore, in this work, a µPAD was evaluated for nitrite and nitrate detection, based on the Griess method [38,39]. Nitrate-to-nitrite reduction was attained with zinc followed by derivatization with sulfanilamide and N-(1-naphthyl)-ethylenediamine, which resulted in a red-pink azo dye being formed. The nitrite and nitrate concentrations were then inversely derived from the measured color intensity using the Image J program (Figure 2). The fabricating strategy with polylactic acid in this study provides a high-resolution platform, repeatability, and a fast procedure without using expensive instruments. Based on this fabrication method, nitrite and nitrate were successfully detected in food samples.

2. Materials and Methods

Polylactic acid was purchased from Nature Work LLC (Minnetonka, MN, USA). Sodium nitrite, sodium nitrate, N-(1-naphthyl)-ethylenediamine, sulfanilamide, and dichloromethane were obtained from Sigma-Aldrich (Castle Hill, NSW, Australia). The zinc suspension was prepared by mixing 500 mg of zinc dust (<10 μm, ≥98%, Sigma-Aldrich) in 10.0 mL of deionized water. All of the reagents were of analytical purity grade. Deionized water was used for solution preparation. Chromatography paper no. 4 was obtained from Whatman International, Ltd. (Buckinghamshire, UK). The screen was made from a 100-mesh polyester fabric with a thickness of 295 ± 5 µm on a wooden frame (purchased from a local screen-printing printing shop in Bangkok, Thailand). The size of the screen is 30 cm width and 35 cm length.
A CanoScan LiDE 120 Color Image Scanner was used for colorimetric detection. A contact angle meter (DM-CE2) was purchased from Kyowa Interface Science Co., Ltd., Japan. As a reference method, absorbance measurements were carried out using a UV-1601 UV-visible spectrophotometer (Shimadzu, Japan) with a 10 mm path length quartz cuvette sub-micro (16.40/Q/10 Starna, Atascadero, CA, USA).

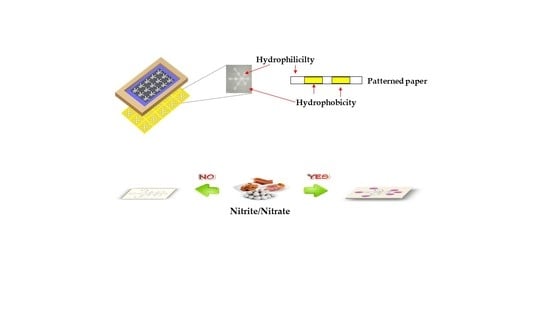
2.1. Paper-Based Design and Fabrication

The µPAD was designed with a pattern consisting of two main detection zones for nitrite and nitrate (Figure 1a). The three test zones on the right-hand area were designed to detect nitrite (diameter = 8 mm), while the three test zones and reducing zone in the left-hand area were designed for nitrate detection (diameter = 8 mm) and the central area was designed to be the sample zone (diameter = 8 mm). The width and length of the microfluidic channels were 3 mm and 5 mm, respectively. The screen pattern was drawn in the Adobe Illustrator software and was used to create a patterned screen. Figure 1b presents a schematic illustration of the µPAD fabrication process. The patterned screen was placed onto chromatography paper. The 5 µL of 9% w/v polylactic acid solution dissolved in dichloromethane was applied over the screen. The polylactic acid solution was squeezed by wood screen printing squeegee, which then penetrated the chromatography paper to form hydrophobic area. After drying (1 min), the µPAD was cut into 57 mm × 63 mm pieces.

2.2. Detection of Nitrite and Nitrate with the µPAD

The assay for simultaneous detection of nitrite and nitrate is shown in Figure 2. First, 1.5 μL of 10 mM N-(1-naphthyl)-ethylenediamine and 22 mM sulfanilamide was dropped onto the μPAD detection zone. For nitrate analysis, the zinc suspension was deposited onto the reducing zone. Next, 80 µL of either extracted sample or nitrate/nitrite standard solution was added to the sample zone. The paper was air-dried and then digitized by scanner. The mean intensity of the color in the detection zones was measured for quantitative analysis with the ImageJ software using the red channel, which gave the best sensitivity from among the RGB color space.

2.3. Samples Preparation

To test the developed µPAD, five food samples—smoked sausage, chicken sausage, fish balls, meatballs, and sour pork—were acquired at a local supermarket (Thanyaburi, Pathum Thani). All of the samples were first cut into small pieces; 3.0 g of each sample was homogenized with 10 mL distilled water using homogenizer for 5 min and then centrifuged at 5000 rpm for 20 min. The precipitate was extracted again. The supernatant was separated, and the nitrite and nitrate concentration was then analyzed with µPAD and spectrophotometric method.

2.4. The Detection of Nitrite and Nitrate Using Spectrophotometric as a Reference Method

The assay was performed according to the procedure described in the literature with a few modification [40,41]. For analysis of nitrite, 5 mL of extracted sample was mixed with 2.5 mL of 22 mM sulfanilamide and 2.5 mL 10 mM of N-(1-naphthyl)-ethylenediamine. For nitrate analysis, 5 mL of extracted sample was treated with 0.12 g of zinc before analysis. After 12 min, the mixture solution was then transferred into optical glass cuvettes, and the 540 nm spectrum was recorded.

3. Results and Discussion

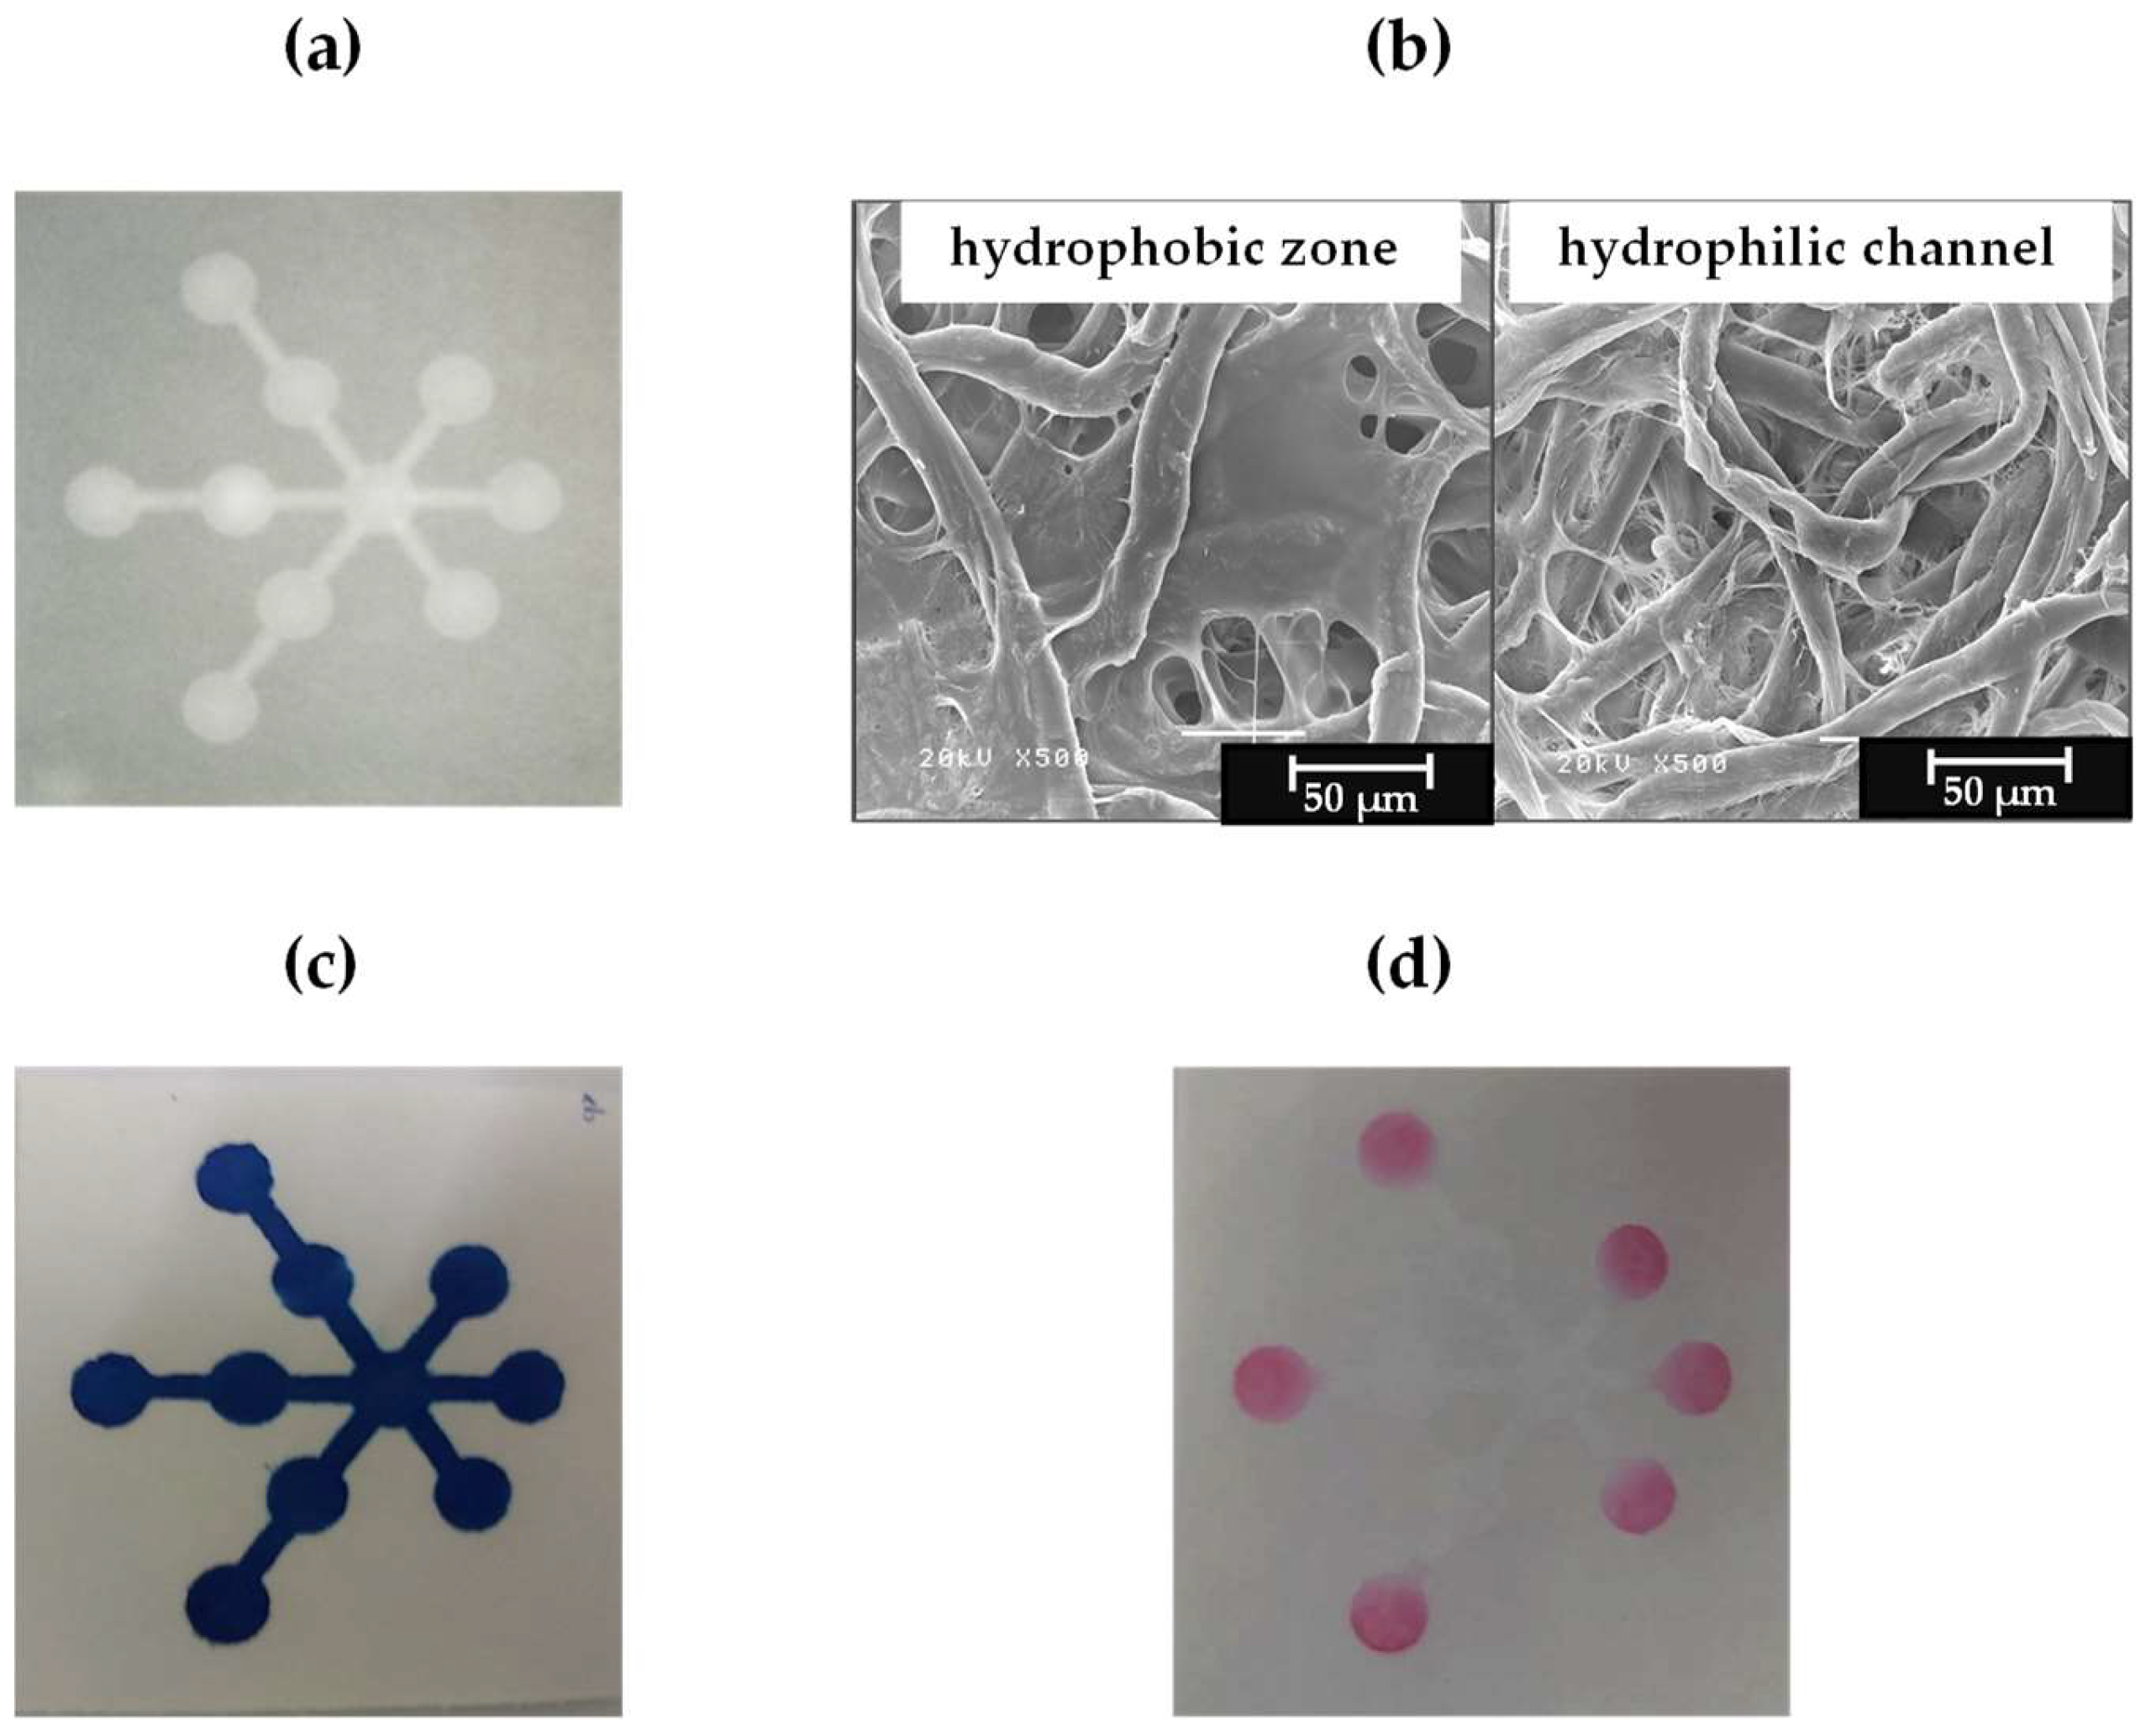
3.1. Fabrication of the µPAD Using the Single-Step Polylactic Acid Screen-Printing Method

Because of its hydrophobic property, polylactic acid was applied in our work as the hydrophobic material to fabricate a μPAD based on screen-printing method for the first time. The screens were made from 100-mesh polyester fabric on a wooden frame. The polylactic acid solution was poured over the screen to create a hydrophobic region. This solution was passed through the screen and paper. After the paper was taken out from the screen and dried at room temperature, the hydrophobic parts and hydrophilic channels were formed on the paper. Figure 3a shows a real photograph of a μPAD using the polylactic acid screen-printing method.
The surface topography of the μPAD was observed using scanning electron microscope, as shown in Figure 3b. It can been seen that hydrophobic zone, the surface topography was covered with polylactic acid network while hydrophilic channel was retained only cellulose fibers. Thus, hydrophobic and hydrophilic areas were obtained on chromatography paper. Figure 3c shows images of the blue dye solution (methylene blue) wicking through the hydrophilic region, and no outside spread was observed. We calculated the fabrication cost, including of the chromatography paper and polylactic acid, and the total cost is estimated to be around $0.03/device. In one production cycle, 15 devices were obtained (shown in Figure 1), with a fabrication time of 2 min.

3.2. Reproducibility and Stability of the Fabricated µPADs

The reproducibility of the μPADs’ fabrication was also evaluated by mearing the diameter of the circular reservoirs and the widths and lengths of the microchannels using the Image J software (50 devices). The results showed an average diameter of the circular reservoirs of 7.92 ± 0.02 mm with relative standard deviation (RSD) of 2.34, and the mean widths and lengths were 2.91 ± 0.01 mm (% RSD = 3.19) and 4.95 ± 0.03 mm (% RSD = 4.02), respectively. The hydrophilic channel and the hydrophobic barrier remained stable for at least 10 months when the device was stored in a plastic bag at room temperature. These results indicated the polylactic acid screen-printing method is good for reproducible production and device stability.

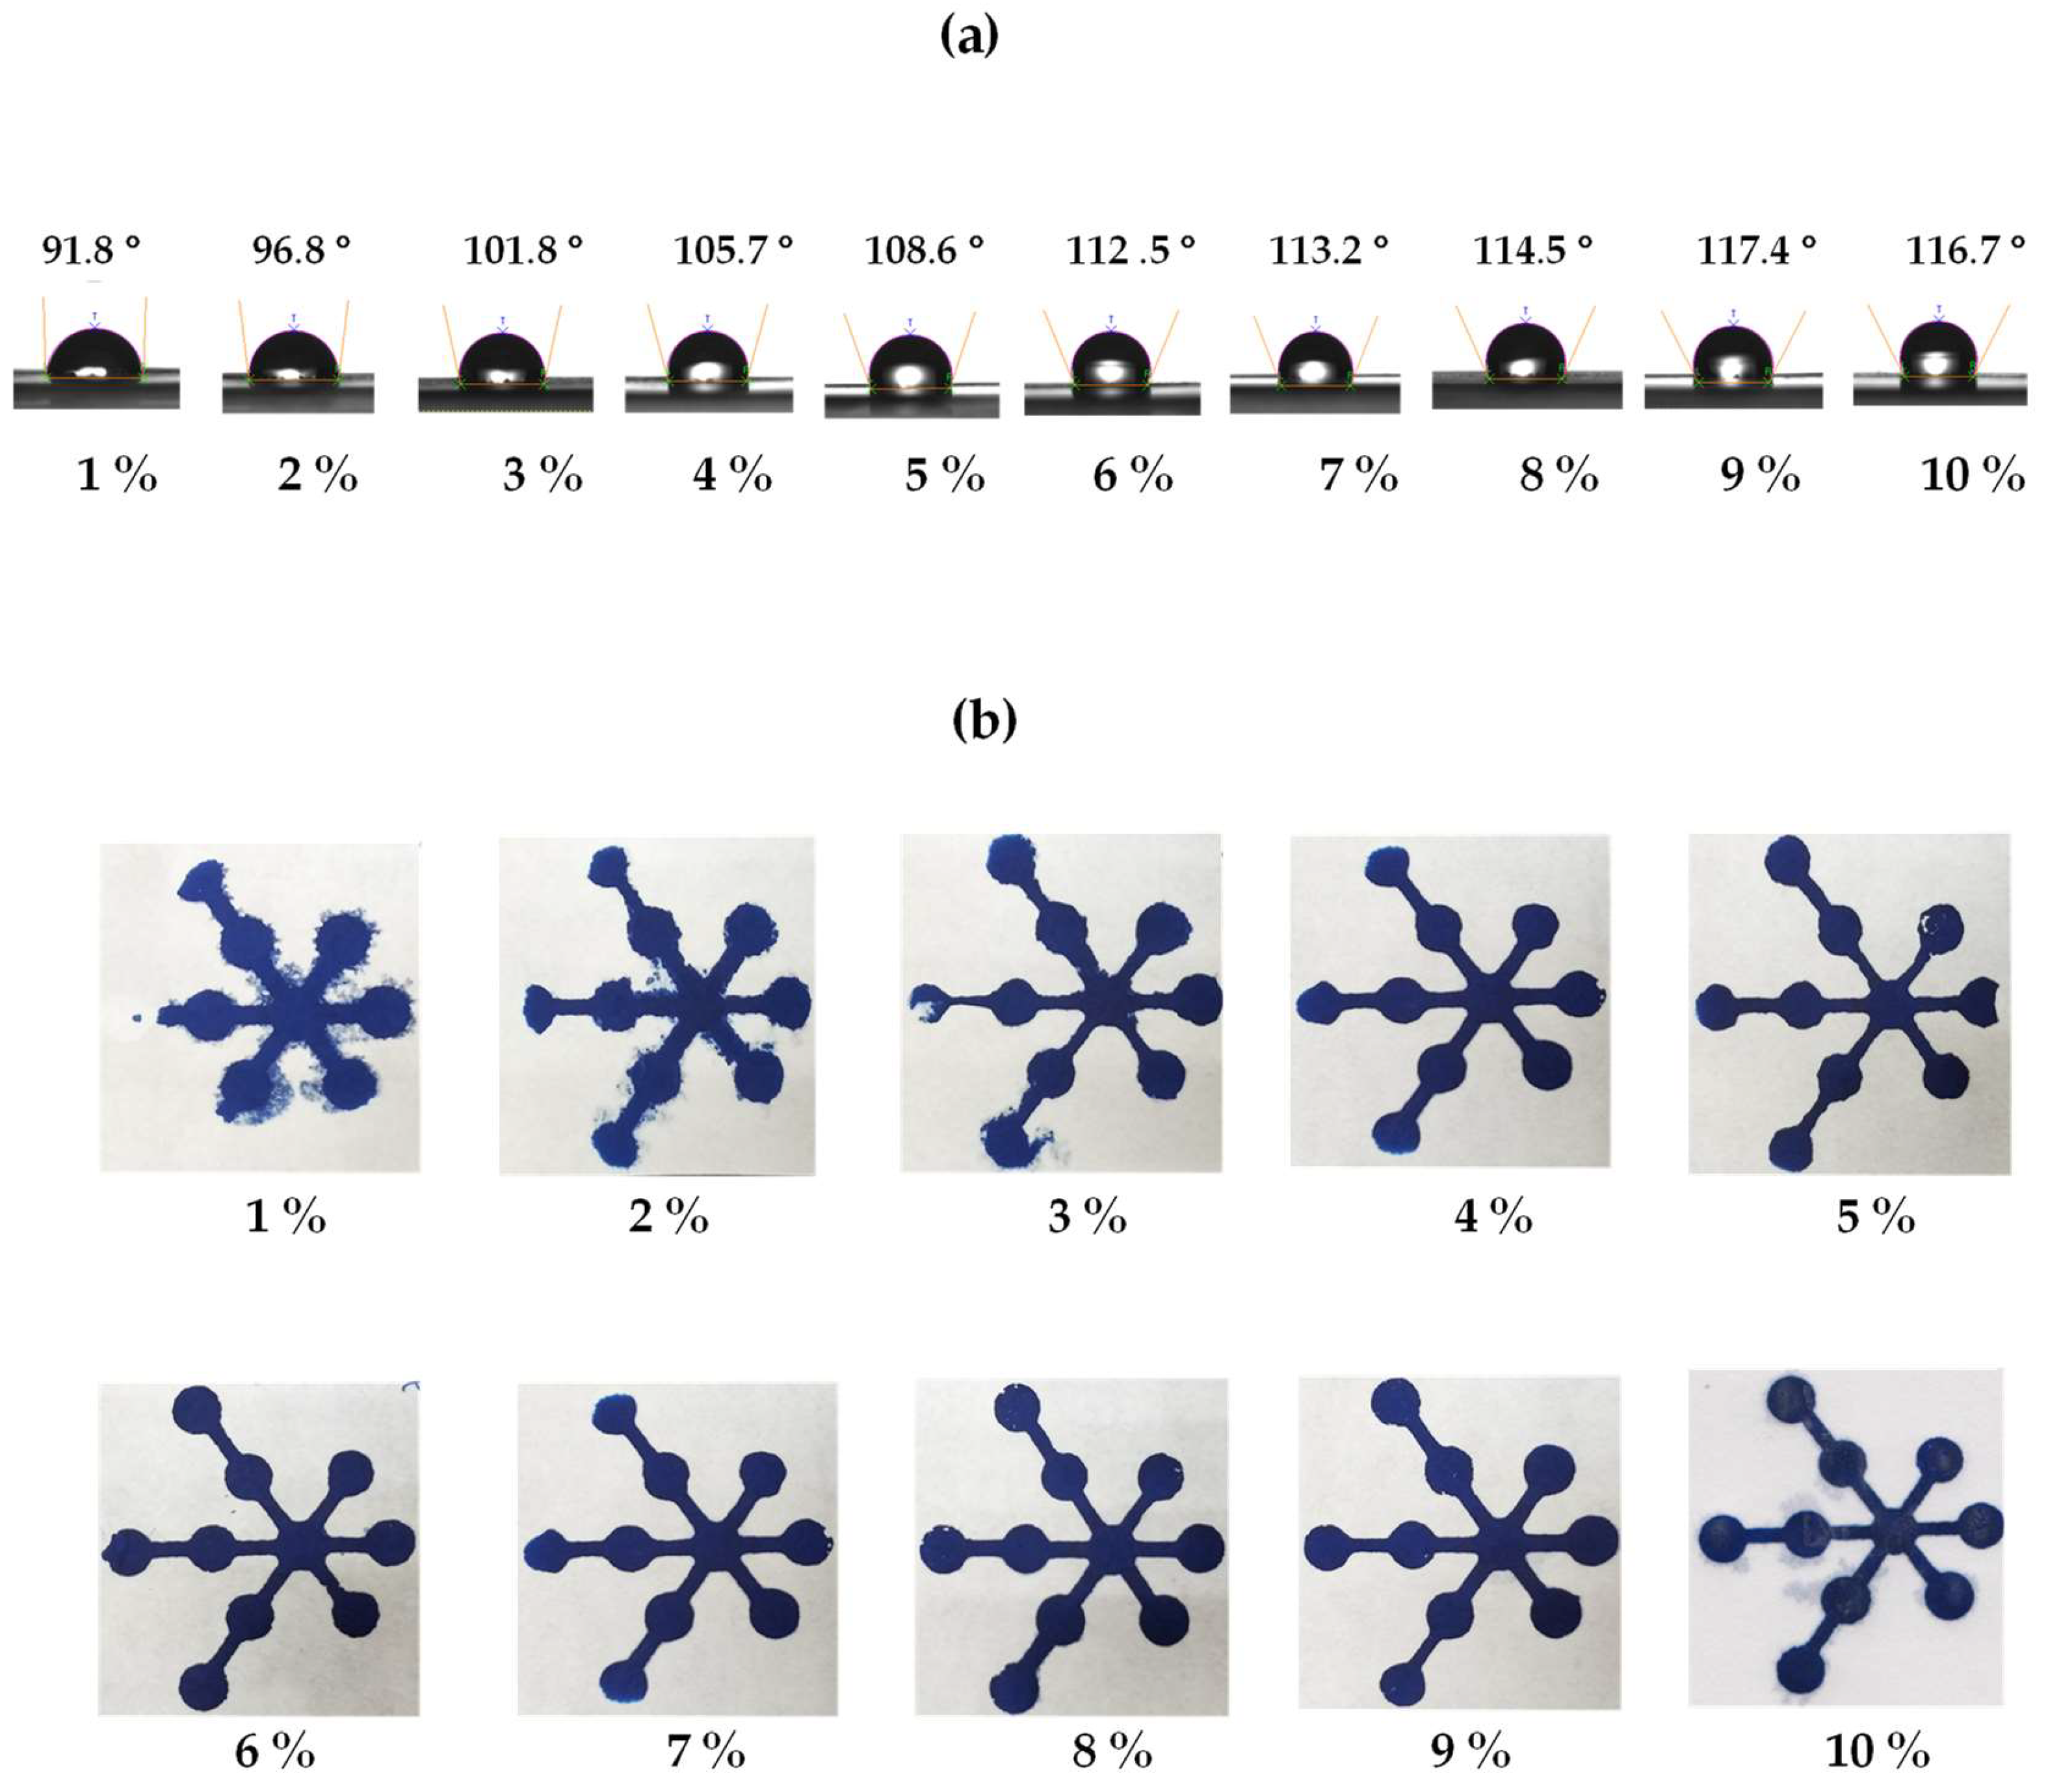
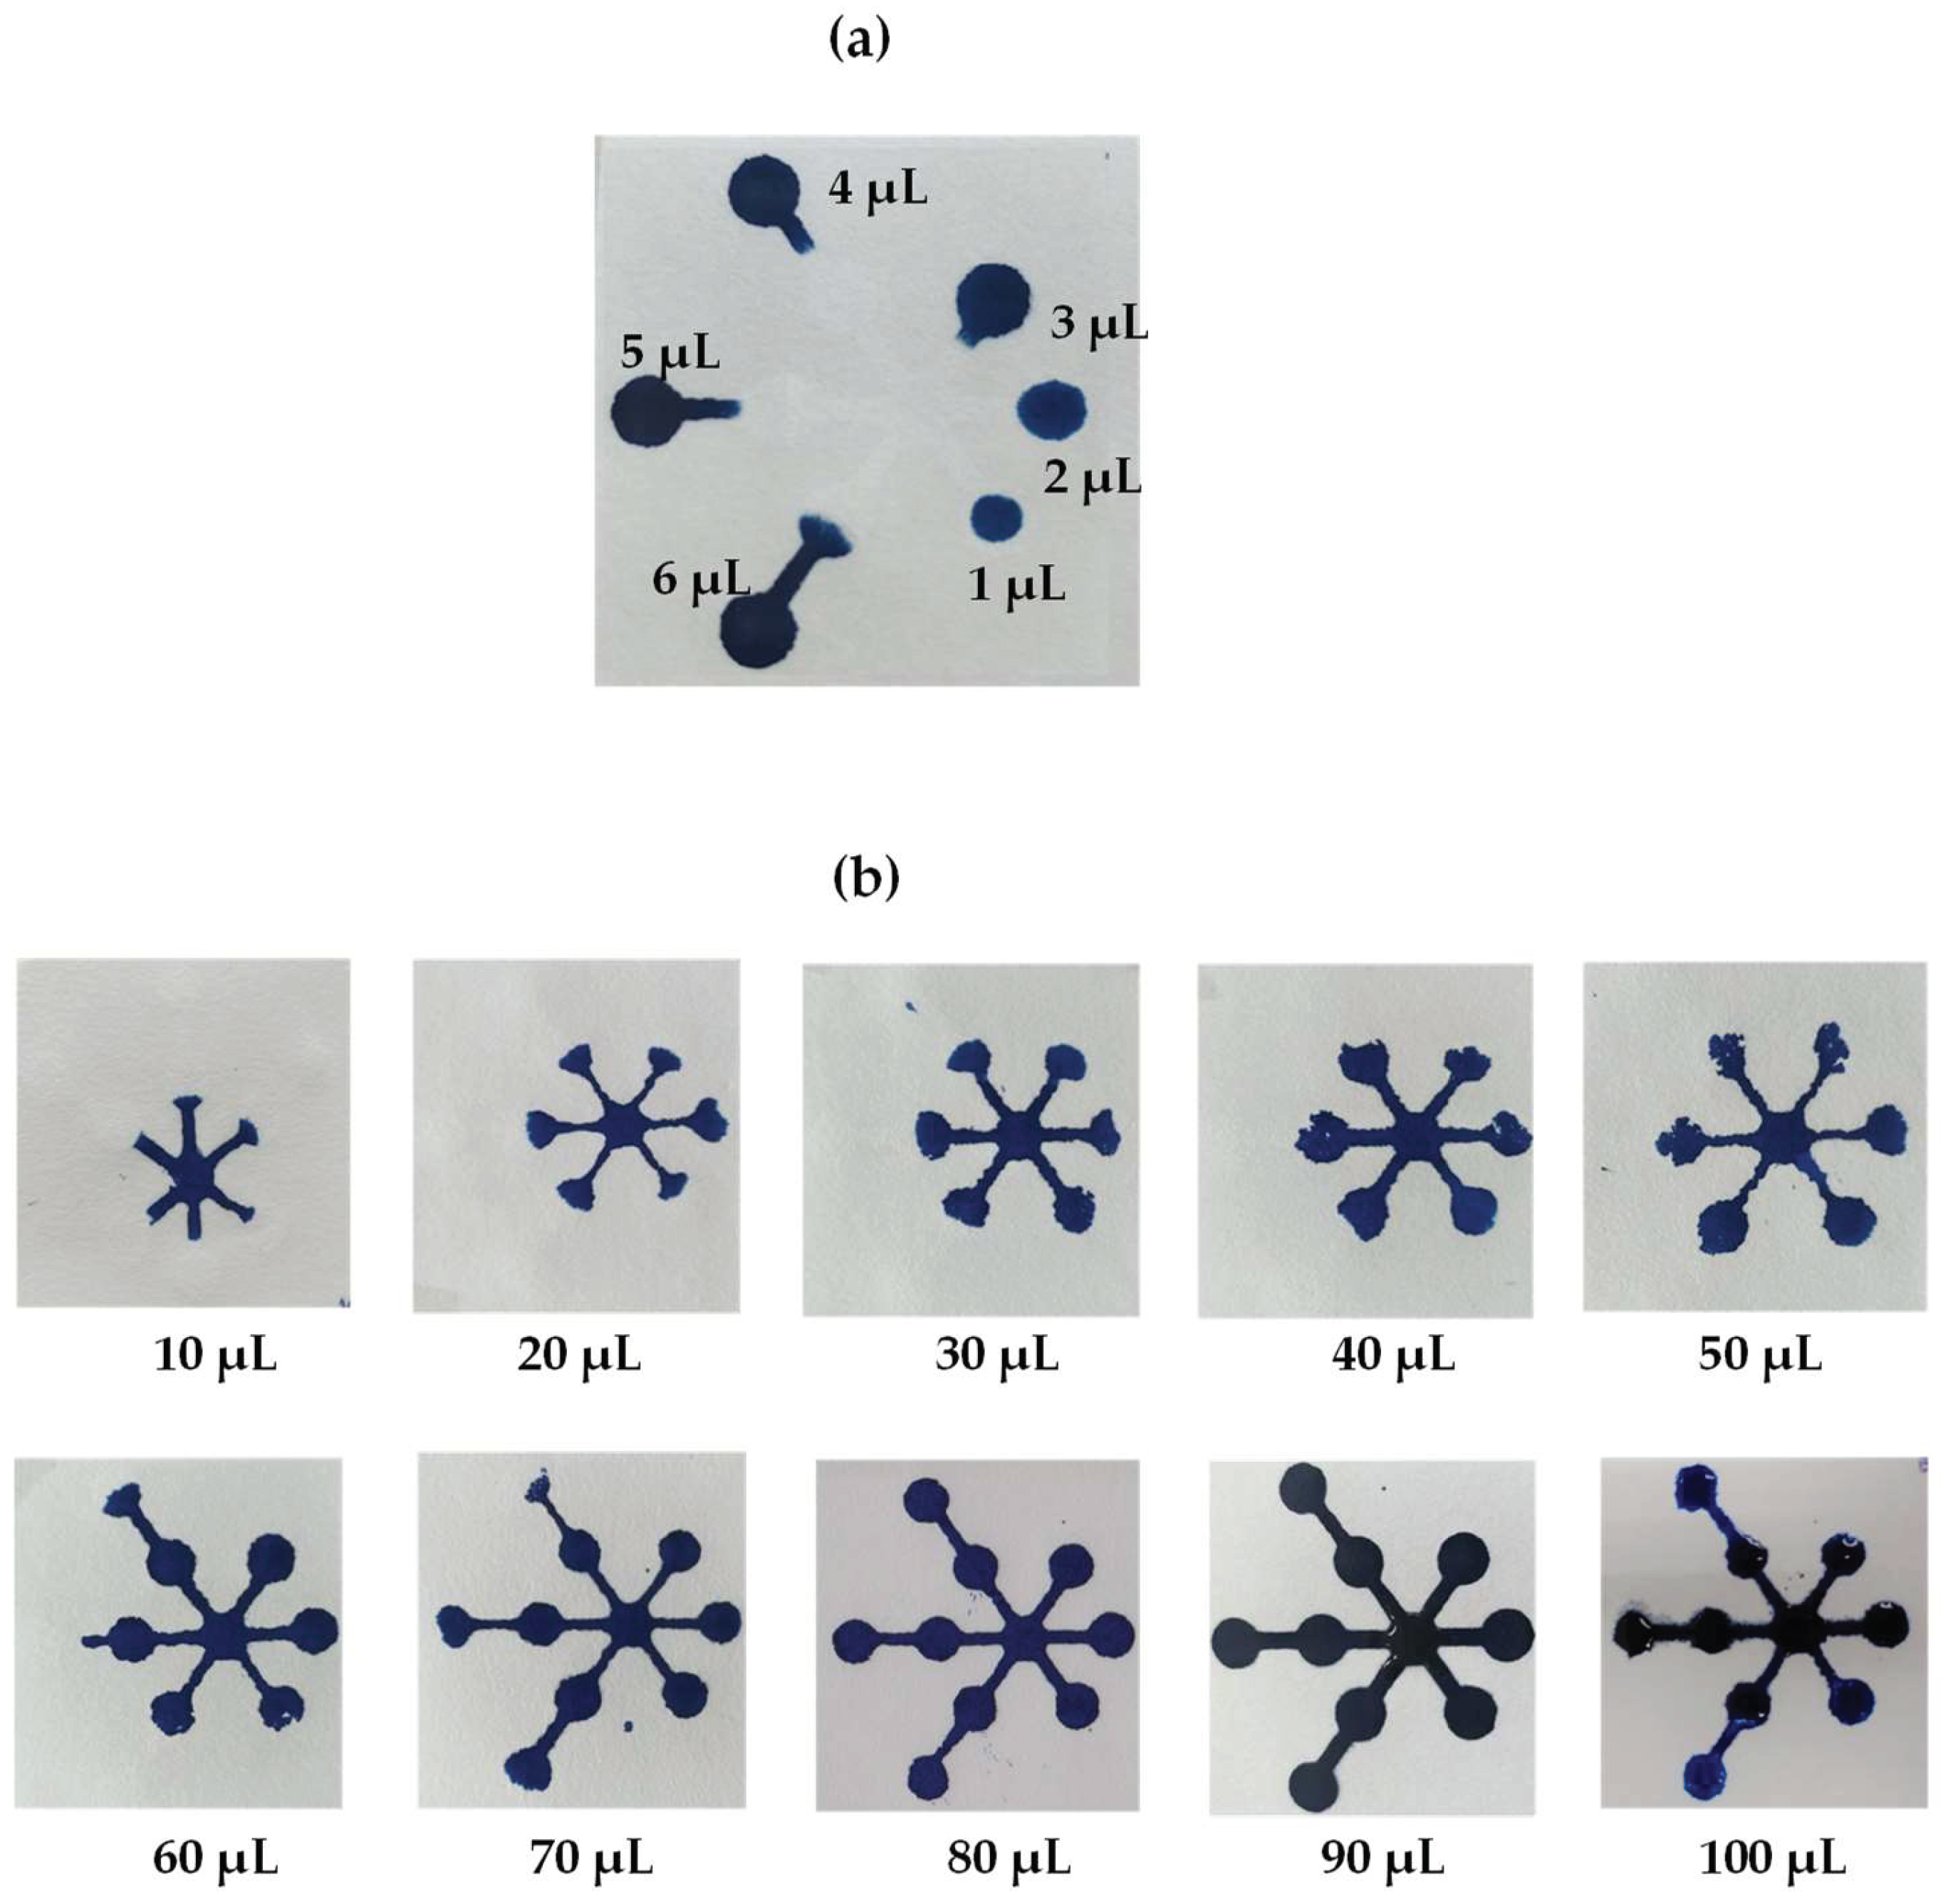
3.3. Optimization of the Polylactic Acid Concentration

The polylactic acid concentration influenced the resolution between the hydrophobic and hydrophilic areas of the μPADs. Thus, the concentrations of polylactic acid were optimized at 1 to 10% w/v on the front and back of the paper. The contact angles of water on the paper were measured to examine the hydrophilicity and hydrophobicity of the paper. As the results show in Figure 4a, all concentrations of polylactic acid provided a contact angle higher than 90°, meaning that hydrophobic surfaces were formed on the paper [42]. At concentrations less than 9%, low contract angles were obtained, resulting in incomplete hydrophobic barriers (Figure 4b). On the other hand, at concentrations exceeding 10%, the contact angle decreased because a high-viscosity polylactic acid solution makes it difficult to penetrate through the paper, leading to reduced reproducibility of the hydrophobic barrier’s dimensions. Thus, 9% was selected as the optimum polylactic acid solution concentration because it provides the best hydrophobic pattern.

3.4. Application for Nitrite and Nitrate Detection

After standard solutions of nitrite/nitrate were introduced into the sample zone, the fluid began to flow along the channels toward the detection zone. Nitrate solution was reduced to nitrite with zinc onto the reducing zone before reaction in the detection zone to form a red-pink azo dye by a diazonium coupling reaction with sulfanilamide and N-(1-Naphthyl)ethylenediamine (Figure 3d). The concentration of nitrite (or nitrate) was proportional to the color intensity of the resulting pink color.

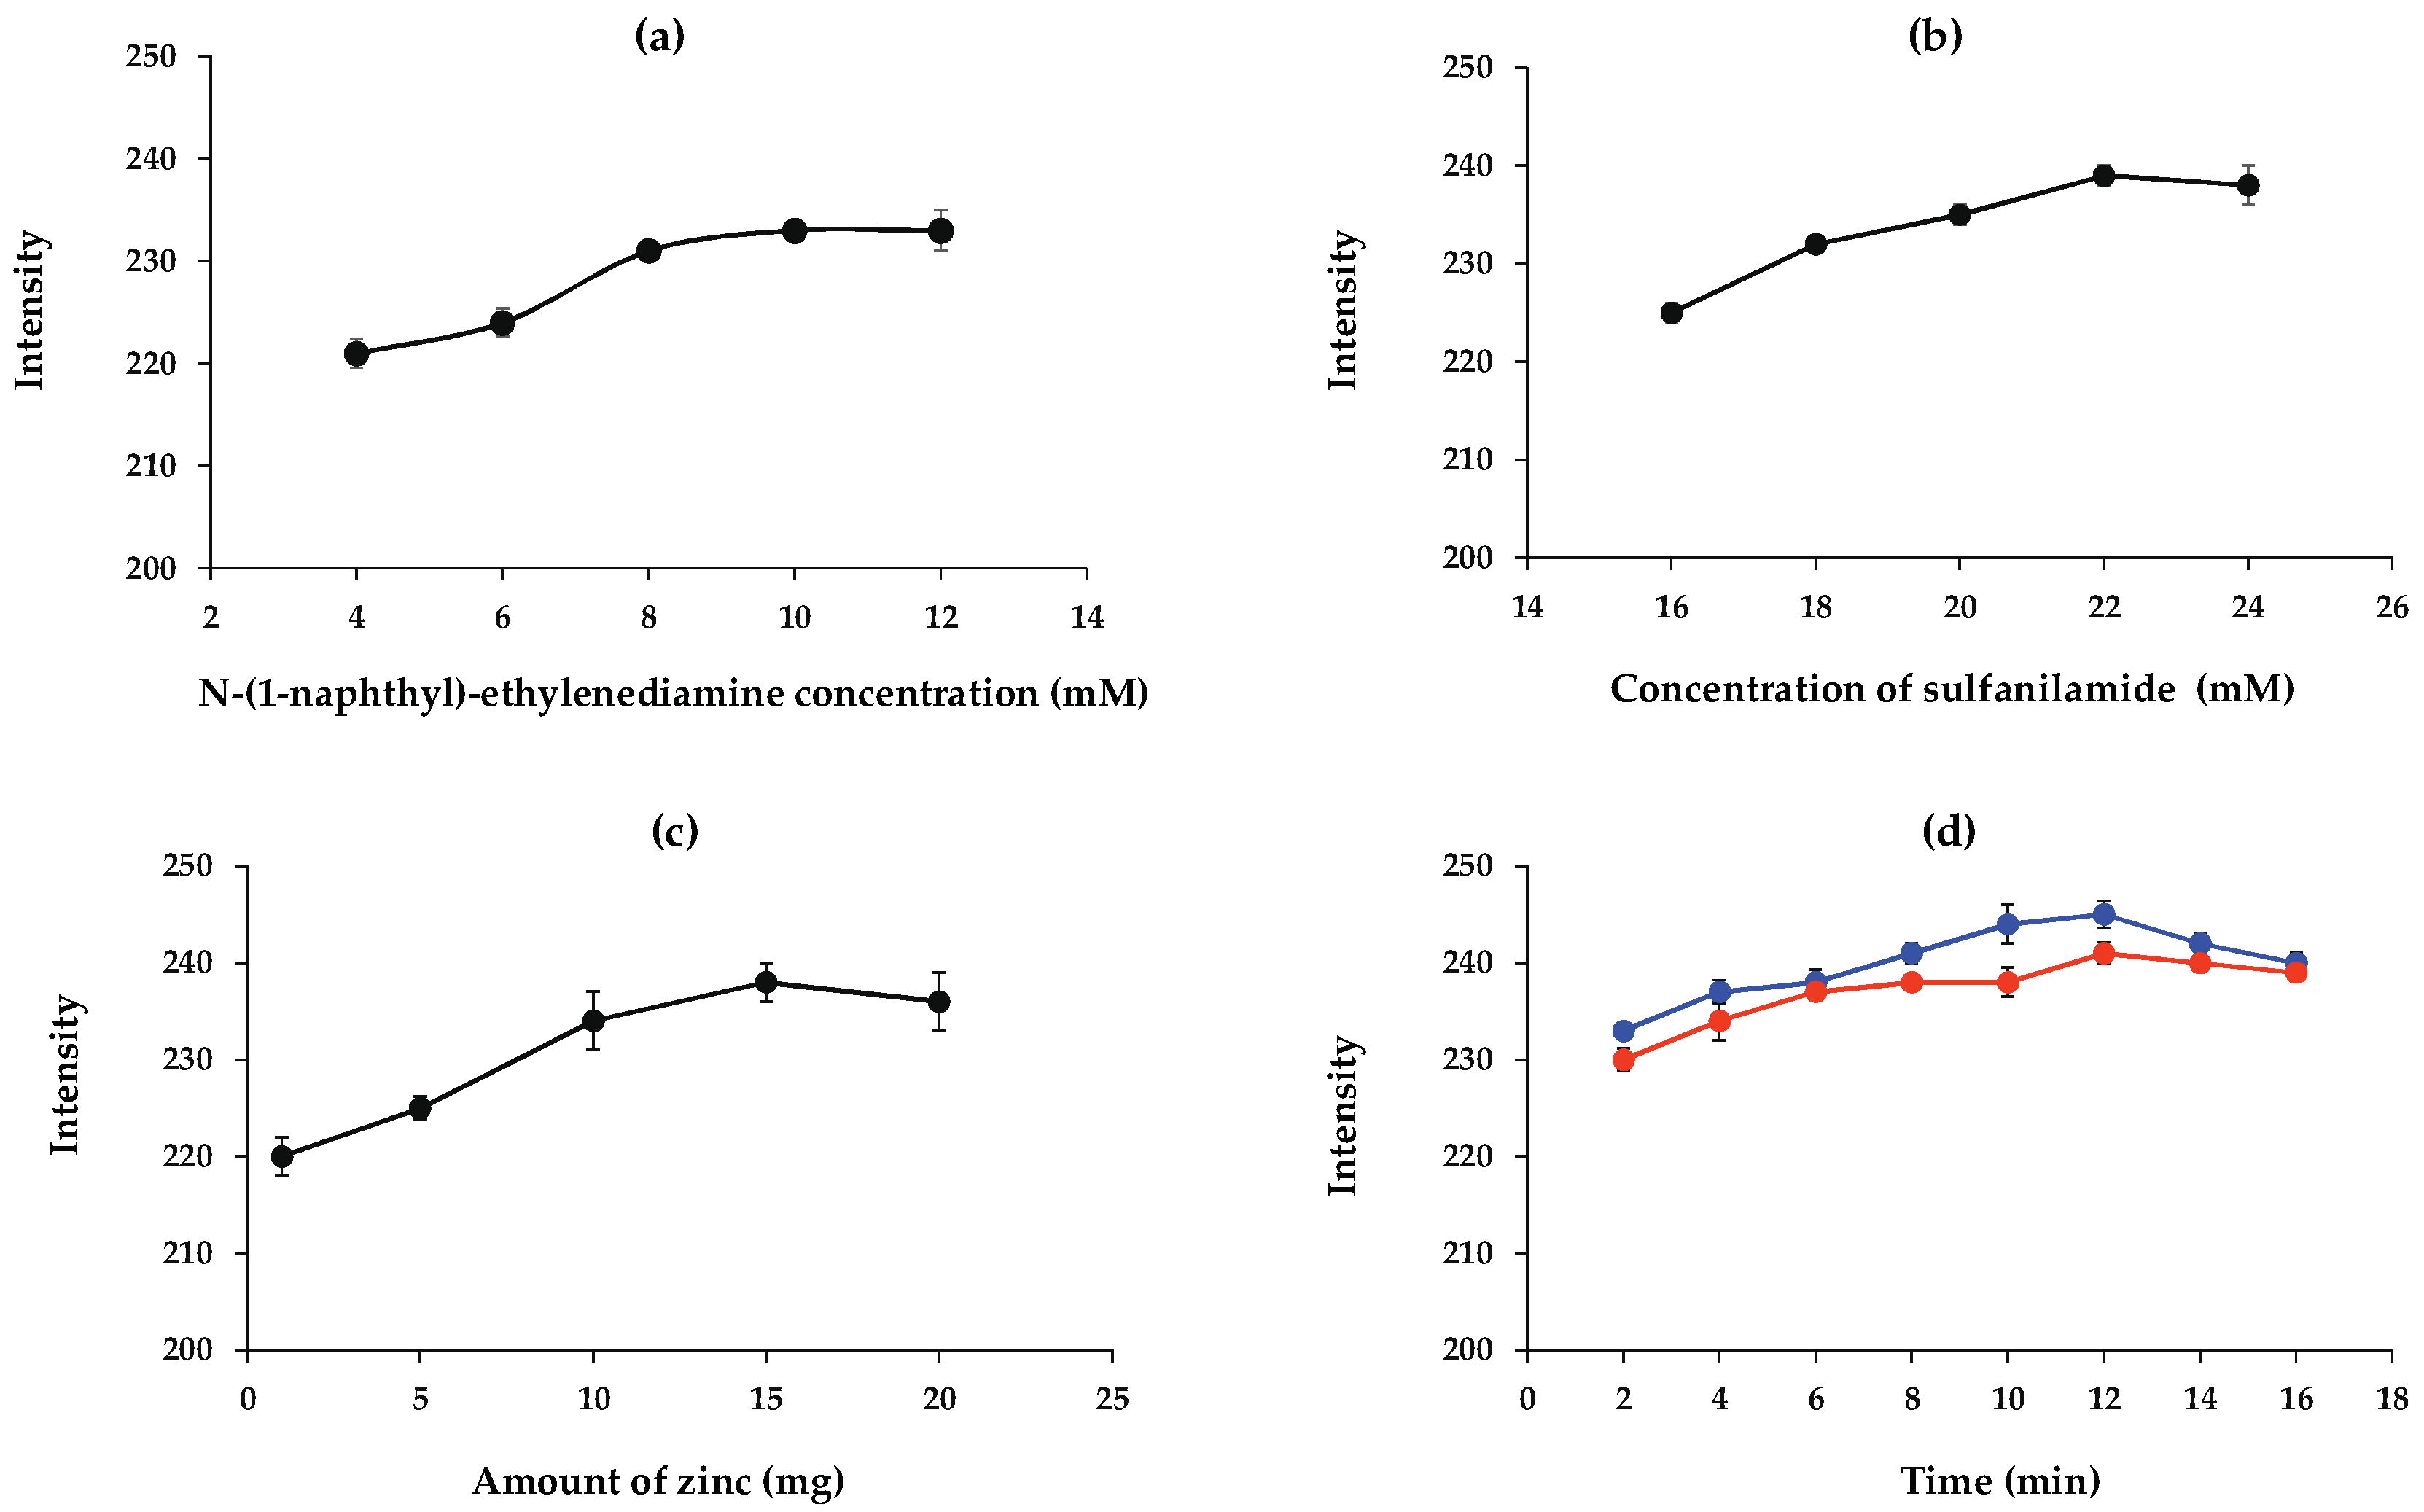
3.5. Optimization of the Nitrite and Nitrate Assays

The effects of reagent volume on the detection zone were studied in the range from 1 to 6 µL using blue dye solution dropped on the detection zones (Figure 5a). Low reagent volume was insufficient for the color to cover the detection zone, whereas higher volumes allowed the reagent to spread outside the detection zone. The results showed that the optimal volume of reagent on the detection zone was 3 µL. The sample volumes studied on the sample zone included 10, 20, 30, 40, 50, 60, 70, 80, 90 and 100 µL, as shown in Figure 5b. Adding nitrite to the sample zone at lower volumes did not cause the color to move to the reaction zones, but higher volumes caused color products to move over the detection zone. The results showed that the 80 µL sample volume showed reaction product completely on the detection zone; thus, this sample volume was selected as the sample volume for the paper-based device.
The N-(1-naphthyl)-ethylenediamine concentration influences the color intensity. The effects of N-(1-naphthyl)-ethylenediamine concentration were examined at 4, 6, 8, 10, and 12 mM. As the results show in Figure 6a, the intensity value increased with increasing N-(1-naphthyl)-ethylenediamine and then remained constant above 10 mM. Therefore, 10 mM of N-(1-naphthyl)-ethylenediamine was applied to the detection area on the paper-based device in future experiments.
The effect of sulfanilamide concentration on the color intensity was studied in the range of 16 to 24 mM. According to the results presented in Figure 6b, the color intensity increased with increasing concentrations of sulfanilamide. Therefore, 22 mM solution of sulfanilamide was selected for subsequent experiments.
Zinc as the reducing agent converts nitrate to nitrite. To study the effect of the amount of zinc on color intensity, the mass of zinc in the range of 1–20 mg was investigated on the reducing zone. As shown in Figure 6c, the color intensity enhanced with increasing mass of zinc up to 15 mg and remained constant at higher amounts. Therefore, 15 mg of zinc was selected as the optimum amount of reducing agent.
In order to determine the appropriate reaction time when the images should be captured, a study of reaction time was carried out. The results of reaction time are shown in Figure 6d. A longer reaction time allows the substrate to react more completely with nitrite or nitrate. After 12 min, the absorbance decreased with time due to a decomposition of the azo dye [38]. An optimal reaction time of 12 min was selected for nitrite and nitrate detection.

3.6. Method Validation

The precision of the µPADs was evaluated by seven consecutive detections of standard solutions at 10 mg L−1 of nitrite and 50 mg L−1 of nitrate. The intra-day precision of the assay was estimated by calculating the RSD for the analysis of nitrite and nitrate in seven replicates and inter-day precision was determined by the analysis of nitrite and nitrate on seven consecutive days. The RSD values were 0.3 and 0.6% (intra-day precision) and 0.7 and 0.9% (inter-day precision) for nitrite and nitrate, respectively.
Under the optimized parameters, the µPADs showed good linearity (r = 0.9995) over the concentration range of 2 to 10 mg L−1 for nitrite measurement as shown in Figure S1. The nitrate concentration was linear in range of 10 to 50 mg L−1, with a correlation coefficient of 0.9993 (Figure S2). The limit of detection (LOD) and limit of quantification (LOQ) were calculated based on the ratio of 3 and 10 times the noise to the slope of the calibration curve, respectively. The LOD values were 1.2 mg L−1 for nitrite and 3.6 mg L−1 for nitrate which were lower than previous work [43] The LOQs for nitrite and nitrate detection were 4 and 12 mg L−1, respectively. The LOD values were was significantly lower than the maximum allowable levels of nitrite (125 mg L−1) and nitrate (500 mg L−1) in food allowed by Thai regulations. The analytical performance of a proposed µPAD for simultaneous detection of nitrite and nitrate is summarized in Table 1.

3.7. Selectivity of the µPADs

In order to demonstrate the selectivity of the developed µPAD assay, we investigated the effects of the most common ions that may interfere with the nitrite and nitrate detection, including Na+, Ca2+, SO42−, and Fe2+, which were found in food samples investigated at a concentration of 10 mg L−1. As shown in Figure 7, the results show that none of the ions had an interfering effect on nitrite or nitrate detection.

3.8. Analysis of Nitrite and Nitrate in Food Samples

Food samples of smoked sausage, chicken sausage, fish balls, meatballs, and sour pork were analyzed to validate the applicability of the µPADs for determining nitrite and nitrate in real samples, and the results were compared with those of a spectrophotometric method. The analysis results are shown in Table 2. There were no statistically significant differences between the results obtained using the µPAD and using a spectrophotometric comparative method (Student’s t-test at 95% confidence level). In the real samples, nitrite concentrations in the range 11 to 26 mg kg−1 were detected, whereas for nitrate detection, concentrations ranging from 63 to 91 mg kg−1 were obtained. Both were lower than the maximum levels of nitrite and nitrate in food allowed by Thai regulations. In case of high nitrite and nitrate concentrations contained in samples, dilution must be performed with distilled water to match the linear range of the calibration curve before the analysis. The nitrite and nitrate concentrations were then calculated from the calibration curve by applying an appropriate dilution factor.
The method’s accuracy was further evaluated by measuring the recovery of nitrite and nitrate in the spiked smoked sausage at 3 levels of concentrations. Good recovery was obtained in the range of 89–118%, with RSDs all below 3.2%, suggesting that the developed µPAD method possess high accuracy. Therefore, these results confirm that the proposed µPADs achieve the detection of nitrite and nitrate in food samples. The proposed device consisted of only chromatography paper, a scanner, and the Image J software and has the advantages of being instrument-free, simplicity, cost-effectiveness, requiring less chemical reagent, and being a rapid analysis method.
As it can be seen in Table S1, it is important to highlight the fabrication of µPAD for the simultaneous nitrite and nitrate detections in food samples. The proposed device consisted of only chromatography paper, scanner and Image J software with following advantages: instrument-free, simplicity, cost effectiveness, less chemical reagent and rapid analysis method.

4. Conclusions

We have developed a μPAD fabrication method using polylactic acid as a new hydrophobic material with which to create a hydrophilic channel and a hydrophobic barrier on paper with a screen-printing method performed in a single fabrication step without requiring external heat, UV light, expensive printers, or complex instrumentation. To demonstrate the feasibility of the proposed μPAD as an analytical device, it was applied to detect nitrite and nitrate in food samples. Consequently, the analytical results obtained by the μPAD were in good agreement with those obtained by the spectrophotometric method. The developed μPAD exhibited low-cost, rapid results, low consumption of reagents, and simplicity, in that it does not require instrumentation for the read-out. Therefore, this polylactic acid screen-printing method provides an alternative and inexpensive fabrication method for μPADs. This fabrication technique has potential applications for chemical sensor and biosensors devices in developing countries.

Supplementary Materials

The following are available online at https://www.mdpi.com/2227-9040/7/3/44/s1, Figure S1: Calibration curves for nitrite, Figure S2: Calibration curves for nitrate Table S1: The comparison between different methods used for detection of nitrite and nitrate in food samples.

Author Contributions

S.T.; methodology and writing—review and editing, S.A.; data analysis, P.C.; validation. All authors have given approval to the final version of the manuscript.

Funding

This research was funded by RMUTT annual government statement of expenditure in 2015 (NRMS No. 2558A16502264).

Acknowledgments

Naris Barnthip from Division of Physics, Faculty of Science and Technology, Rajamangala University of Technology Thanyaburi, Thailand is acknowledged for contact angle experiment.

Conflicts of Interest

The authors declare no conflict of interest.

References

  1. Almeida, M.I.G.S.; Jayawardane, B.M.; Kolev, S.D.; McKelvie, I.D. Developments of microfluidic paper-based analytical devices (μPADs) for water analysis: A review. Talanta 2018, 177, 176–190. [Google Scholar] [CrossRef] [PubMed]
  2. Akyazi, T.; Basabe-Desmonts, L.; Benito-Lopez, F. Review on microfluidic paper-based analytical devices towards commercialization. Anal. Chim. Acta 2018, 1001, 1–17. [Google Scholar] [CrossRef] [PubMed]
  3. Fu, L.M.; Wang, Y.N. Detection methods and applications of microfluidic paper-based analytical devices. Trends Anal. Chem. 2018, 107, 196–211. [Google Scholar] [CrossRef]
  4. Morbioli, G.G.; Mazzu-Nascimento, T.; Stockton, A.M.; Carrilho, E. Technical aspects and challenges of colorimetric detection with microfluidic paper-based analytical devices (μPADs)—A review. Anal. Chim. Acta 2017, 970, 1–22. [Google Scholar] [CrossRef] [PubMed]
  5. Lin, Y.; Gritsenko, D.; Feng, S.; The, Y.C.; Lu, X.; Xu, J. Detection of heavy metal by paper-based microfluidics. Biosens. Bioelectron. 2016, 83, 256–266. [Google Scholar] [CrossRef] [PubMed]
  6. Ruecha, N.; Shin, K.; Chailapakul, O.; Rodthongkum, N. Label-free paper-based electrochemical impedance immunosensor for human interferon gamma detection. Sens. Actuators B Chem. 2019, 279, 298–304. [Google Scholar] [CrossRef]
  7. Liu, C.; Gomez, F.A.; Miao, A.Y.; Cui, P.; Lee, W. A colorimetric assay system for dopamine using microfluidic paper-based analytical devices. Talanta 2019, 194, 171–176. [Google Scholar] [CrossRef]
  8. Yang, R.J.; Tseng, C.C.; Ju, W.J.; Fu, L.M.; Syu, M.P. Integrated microfluidic paper-based system for determination of whole blood albumin. Sens. Actuators B Chem. 2018, 273, 1091–1097. [Google Scholar] [CrossRef]
  9. Wang, Z.; Zhang, J.; Liu, L.; Wu, X.; Kuang, H.; Xu, C.; Xu, L. A colorimetric paper-based sensor for toltrazuril and its metabolites in feed, chicken, and egg samples. Food Chem. 2019, 276, 707–713. [Google Scholar] [CrossRef]
  10. Liu, C.C.; Wang, Y.N.; Fu, L.M.; Chen, K.L. Microfluidic paper-based chip platform for benzoic acid detection in food. Food Chem. 2018, 249, 162–167. [Google Scholar] [CrossRef]
  11. Ma, L.; Nilghaz, A.; Choi, J.R.; Liu, X.; Lu, X. Rapid detection of clenbuterol in milk using microfluidic paper-based ELISA. Food Chem. 2018, 246, 437–441. [Google Scholar] [CrossRef] [PubMed]
  12. Saraji, M.; Bagheri, N. Paper-based headspace extraction combined with digital image analysis for trace determination of cyanide in water samples. Sens. Actuators B Chem. 2018, 270, 28–34. [Google Scholar] [CrossRef]
  13. Kumar, S.B.; Shinde, A.H.; Meht, R.; Bhattachary, A. Simple, one-step dye-based kit for bacterial contamination detection in a range of water sources. Sens. Actuators B Chem. 2018, 276, 121–127. [Google Scholar] [CrossRef]
  14. Devadhasan, J.P.; Kim, J. A chemically functionalized paper-based microfluidic platform for multiplex heavy metal detection. Sens. Actuators B Chem. 2018, 273, 18–24. [Google Scholar] [CrossRef]
  15. Asano, H.; Shiraishi, Y. Development of paper-based microfluidic analytical device for iron assay using photomask printed with 3D printer for fabrication of hydrophilic and hydrophobic zones on paper by photolithography. Anal. Chim. Acta 2015, 883, 55–60. [Google Scholar] [CrossRef] [PubMed]
  16. Cao, L.; Fang, C.; Zeng, R.; Zhao, X.; Jiang, Y.; Chen, Z. Paper-based microfluidic devices for electrochemical immunofiltration analysis of human chorionic gonadotropin. Biosens. Bioelectron. 2017, 92, 87–94. [Google Scholar] [CrossRef] [PubMed]
  17. Bretel, G.; Rull-Barrull, J.; Nongbe, M.C.; Terrier, J.P.; Grognec, E.L.; Felpin, F.X. Hydrophobic Covalent Patterns on Cellulose Paper through Photothiol-X Ligations. ACS Omega 2018, 3, 9155–9159. [Google Scholar] [CrossRef] [PubMed]
  18. Zhao, M.; Li, H.; Liu, W.; Guo, Y.; Chu, W. Plasma treatment of paper for protein immobilization on paper-based chemiluminescence immunodevice. Biosens. Bioelectron. 2016, 79, 581–588. [Google Scholar] [CrossRef] [PubMed]
  19. Kim, Y.S.; Yang, Y.; Henry, C.S. Laminated and infused Parafilm®–paper for paper-based analytical devices. Sens. Actuators B Chem. 2018, 255, 3654–3661. [Google Scholar] [CrossRef]
  20. Garcia, P.T.; Cardoso, T.M.G.; Garcia, C.D.; Carrilho, E.; Coltro, W.K.T. A handheld stamping process to fabricate microfluidic paper-based analytical devices with chemically modified surface for clinical assays. RSC Adv. 2014, 4, 37637–37644. [Google Scholar] [CrossRef]
  21. Liang, W.H.; Chu, C.H.; Yang, R.J. Bio-sample detection on paper-based devices with inkjet printer-sprayed reagents. Talanta 2015, 145, 6–11. [Google Scholar] [CrossRef] [PubMed]
  22. Yamada, K.; Henares, T.G.; Suzuki, K.; Citterio, D. Paper-Based Inkjet-Printed Microfluidic Analytical Devices. Angew. Chem. Int. Ed. 2015, 54, 5294–5310. [Google Scholar] [CrossRef] [PubMed]
  23. Chiang, C.K.; Kurniawan, A.; Kaoa, C.Y.; Wang, M.J. Single step and mask-free 3D wax printing of microfluidic paper-based analytical devices for glucose and nitrite assays. Talanta 2019, 194, 837–845. [Google Scholar] [CrossRef] [PubMed]
  24. Wang, S.; Ge, L.; Song, X.; Yu, J.; Ge, S.; Huang, J.; Zeng, F. Paper-based chemiluminescence ELISA: Lab-on-paper based on chitosan modified paper device and wax-screen-printing. Biosens. Bioelectron. 2012, 31, 212–218. [Google Scholar] [CrossRef] [PubMed]
  25. Lamas-Ardisana, P.J.; Martínez-Paredes, G.; Añorga, L.; Grande, H.J. Glucose biosensor based on disposable electrochemical paper-basedtransducers fully fabricated by screen-printing. Biosens. Bioelectron. 2018, 109, 8–12. [Google Scholar] [CrossRef] [PubMed]
  26. Mohammadi, S.; Maeki, M.; Mohamadi, R.M.; Ishidkihiko, A.; Tani, H.; Tokeshi, M. An instrument-free, screen-printed paper microfluidic device that enables bio and chemical sensing. Analyst 2015, 140, 6493–6499. [Google Scholar] [CrossRef] [Green Version]
  27. Konarsu, T.; Maeki, M.; Ishida, A.; Tani, H.; Tokeshi, M. Characteristics of microfluidic paper-based analytical devices fabricated by four different method. Anal. Sci. 2018, 34, 39–44. [Google Scholar]
  28. Sameenoi, Y.; Nongka, P.N.; Nouanthavong, S.; Henry, C.S.; Nacapricha, D. One-step polymer screen-printing for microfluidic paper-based analytical device (µPAD) fabrication. Analyst 2014, 139, 6580–6588. [Google Scholar] [CrossRef]
  29. Bruzewicz, D.A.; Reches, M.; Whitesides, G.M. Low-Cost Printing of Poly(dimethylsiloxane) Barriers to Define Microchannels in Paper. Anal. Chem. 2008, 80, 3387–3392. [Google Scholar] [CrossRef]
  30. Yew, C.H.T.; Azari, P.; Choi, J.R.; Li, F.; Pingguan-Murphy, B. Electrospin-coating of nitrocellulose membrane enhances sensitivity in nucleic acid-based lateral flow assay. Anal. Chim. Acta 2018, 1009, 81–88. [Google Scholar] [CrossRef]
  31. Hamad, K.; Kaseem, M.; Ayyoob, M.; Joo, J.; Deri, F. Polylactic acid blends: The future of green, light and tough. Prog. Polym. Sci. 2018, 85, 83–127. [Google Scholar] [CrossRef]
  32. Hussain, T.; Tausif, M.; Ashraf, M. Review: A review of progress in the dyeing of eco-friendly aliphatic polyester-based polylactic acid fabrics. J. Clean. Prod. 2015, 108, 476–483. [Google Scholar] [CrossRef]
  33. Cammack, R.; Joannou, C.L.; Cui, X.Y.; Martinez, C.T.; Maraj, S.R.; Hughes, M.N. Nitrite and nitrosyl compounds in food preservation. Biochim. Biophys. Acta 1999, 1411, 475–488. [Google Scholar] [CrossRef] [Green Version]
  34. Morton, I.D. Nitrate and nitrite in food. Nutr. Food Sci. 1975, 75, 8–9. [Google Scholar] [CrossRef]
  35. Hospital, X.; Hierro, F.; Fernández, M. Effect of reducing nitrate and nitrite added to dry fermented sausages on the survival of Salmonella Typhimurium. Food Res. Int. 2014, 62, 410–415. [Google Scholar] [CrossRef]
  36. Azanza, P.V.; Rustia, A.S. Residual nitrite levels in Philippine sweet bacon. Food Control 2004, 15, 385–389. [Google Scholar] [CrossRef]
  37. Suzuki, H.; Iijima, K.; Moriya, A.; McElroy, K.; Scobie, G.; Fyfe, V.; McColl, K. Conditions for acid catalysed luminal nitrosation are maximal at the gastric cardia. Gut 2003, 52, 1059–1101. [Google Scholar] [CrossRef]
  38. Jayawardane, M.B.; Wei, S.; McKelvie, I.D.; Kolev, S.D. Microfluidic paper-based analytical device for the determination of nitrite and nitrate. Anal. Chem. 2014, 86, 7274–7279. [Google Scholar] [CrossRef]
  39. Iverson, N.M.; Hofferber, E.M.; Stapleton, J.A. Nitric Oxide Sensors for Biological Applications. Chemosensors 2018, 6, 8. [Google Scholar] [CrossRef]
  40. Ellis, P.S.; Shabani, A.M.H.; Gentle, B.S.; McKelvie, I.D. Field measurement of nitrate in marine and estuarine waters with a flow analysis system utilizing on-line zinc reduction. Talanta 2011, 84, 98–103. [Google Scholar] [CrossRef]
  41. Ridnour, L.A.; Sim, J.E.; Hayward, M.A.; Wink, D.A.; Martin, S.M.; Buettner, G.R.; Spitz, D.R. A Spectrophotometric Method for the Direct Detection and Quantitation of Nitric Oxide, Nitrite, and Nitrate in Cell Culture Media. Anal. Biochem. 2000, 281, 223–229. [Google Scholar] [CrossRef] [PubMed] [Green Version]
  42. Law, K.Y. Definitions for Hydrophilicity, Hydrophobicity, and Superhydrophobicity: Getting the Basics Right. J. Phys. Chem. Lett. 2014, 54, 686–688. [Google Scholar] [CrossRef] [PubMed]
  43. Kunduru, K.R.; Basu, A.; Tsah, T.; Domb, A.J. Polymer with pendant diazo-coupling functionality for colorimetric detection of nitrates. Sens. Actuators B Chem. 2017, 251, 21–26. [Google Scholar] [CrossRef]
Figure 1. μPAD design for simultaneous detection of nitrite and nitrate (a) and a schematic diagram of the screen-printing process for µPAD fabrication using polylactic acid (b).
Chemosensors 07 00044 g001
Figure 2. Schematic diagram of the detection assay for nitrite and nitrate in food samples based on colorimetric µPAD.
Chemosensors 07 00044 g002
Figure 3. (a) The fabricated μPAD, (b) the SEM images of the μPAD at the hydrophobic and hydrophilic areas, (c) the blue dye solution wicking through the hydrophilic region of the μPAD, and (d) the μPAD after reaction with nitrite and nitrate.
Chemosensors 07 00044 g003
Figure 4. (a) Contact-angle images and (b) photographs of the blue dye solution in the hydrophilic microchannels to indicate the hydrophilic regions.
Chemosensors 07 00044 g004
Figure 5. Effects of (a) the reagent volume on the detection zones and of (b) sample volume on the sample zones.
Chemosensors 07 00044 g005
Figure 6. Effects of (a) N-(1-naphthyl)-ethylenediamine concentration and (b) sulfanilamide concentration on 10 mg L−1 nitrite detection as well as of (c) amount of zinc for 50 mg L−1 nitrate detection and (d) reaction time for 10 mg L−1 nitrite (blue line) and 50 mg L−1 nitrate (orange line) detections (n = 3).
Chemosensors 07 00044 g006
Figure 7. Selectivity of the µPADs to the addition of (a) Na+, (b) Ca2+, (c) SO42−, (d) Fe2+, and (e) nitrite and nitrate.
Chemosensors 07 00044 g007
Table 1. The performance of µPADs for simultaneous detection of nitrite and nitrate.
ParameterNitrite DetectionNitrate Detection
Intra-day precision (% RSD)0.30.6
Inter-day precision (% RSD)0.70.9
Linear range2–10 mg L−110–50 mg L−1
LOD1.2 mg L−13.6 mg L−1
LOQ4 mg L−112 mg L−1
Analysis time12 min12 min
Table 2. Detection results of nitrite and nitrate in food samples using the µPAD and spectrophotometric methods.
Food SamplesNitrite Concentration (mg kg−1)Nitrate Concentration (mg kg−1)
µPADSpectrophotometric MethodµPADSpectrophotometric Method
Smoked sausage13 ± 0.113 ± 0.663 ± 0.163 ± 0.5
Chicken sausage12 ± 0.211 ± 0.491 ± 0.192 ± 0.6
Fish ball23 ± 0.222 ± 0.776 ± 0.675 ± 0.8
Meatballs 26 ± 0.327 ± 0.278 ± 0.176 ± 0.4
Sour pork 11 ± 0.511 ± 0.883 ± 0.883 ± 0.2

