Article

Application of Screen Printed Diamond Electrode, Coupled with “Point-of-Care” Platform, for Nanomolar Quantification of Phytonutrient Pterostilbene in Dietary Supplements: An Experimental Study Supported by Theory

1
Department of Analytical Chemistry, Faculty of Chemistry, University of Belgrade, Studentski trg 12-16, 11000 Belgrade, Serbia
2
Scientific Institution, Institute of Chemistry, Technology and Metallurgy, National Institute University of Belgrade, 11000 Belgrade, Serbia
3
Institute for Oncology and Radiology of Serbia (IORS), Department of Radiotherapy Physics, Pasterova 14, 11000 Belgrade, Serbia
4
Department for Ecology and Chemical Technology, South Ural State University, Lenin Prospect 76, 454080 Chelyabinsk, Russia
5
Institute of Analytical Chemistry, Faculty of Chemical and Food Technology, Slovak University of Technology in Bratislava, Radlinského 9, SK-812 37 Bratislava, Slovakia
6
Department of Radioisotopes, “VINČA” Institute of Nuclear Sciences-National Institute of the Republic of Serbia, University of Belgrade, 11000 Belgrade, Serbia
*
Author to whom correspondence should be addressed.
Chemosensors 2023, 11(1), 15; https://doi.org/10.3390/chemosensors11010015
Submission received: 15 November 2022 / Revised: 14 December 2022 / Accepted: 20 December 2022 / Published: 23 December 2022
(This article belongs to the Section Electrochemical Devices and Sensors)

Abstract

:
Herein, a screen–printed diamond electrode (SPDE) coupled with a “point-of-care” platform (30 µL-drop concepts, single-drop-detection approach) was successfully applied for the electrochemical determination of pterostilbene (PTS). Cyclic voltammetry identified irreversible oxidation of PTS, where oxidation peak was shown to be strongly dependent on the pH of the working environmental. Although the proposition of the detailed electrochemical oxidation mechanism of PTS goes out of the scope of the present research, we have determined the most probable reactive site of our analyte, by utilizing DFT-based reactivity descriptors (Fukui functions). For electrochemical quantification of PTS, oxidation peak at 0.32 V (vs. Ag/AgCl) was followed in presence of 0.5 mol L−1 of Briton–Robinson buffer solution (pH = 9). Coupled with the optimized parameters of differential pulse voltammetry (DPV), SPDE detected PTS in two linear ranges (first range was from 0.011 to 0.912 µmol L−1; second range was from 0.912 to 4.420 µmol L−1), providing the LOD and LOQ on a nanomolar level (3.1 nmol L−1 and 10.0 nmol L−1, respectively). The selectivity of the optimized DPV method was found to be excellent, with the current changes of less than 7%, in the presence of ten times higher concentrations of the certain interferences. The practical applicability of the SPDE and single-drop-detection approach in dietary supplements (with a declared PTS content of 50 mg/tablet), with the recovery values ranging from 95 to 102%, shows that the developed method has high potential for precise and accurate PTS detection, as well as exceptional miniaturization possibilities of relevant equipment for on-site sensing.

1. Introduction

Pterostilbene (PTS) is a 3,5-dimethoxy analogue of resveratrol, and the primary antioxidant component of blueberries. Because of the conjugated double bond between phenol and methoxy resorcinol moiety, PTS has a planar structure. Multiple studies have demonstrated the antioxidant activity of PTS in both in vitro and in vivo models, illustrating both preventative and therapeutic benefits. PTS acts through various mechanisms and shows anti-oxidant [1], neuroprotective [2], anti-inflammatory [3], anti-tumor [4], lipid-lowering [5], and hypoglycemic [6] activities. Although the precise mechanism of how PTS induces cancer cell death remains unclear, it has been discovered that generation of the reactive oxygen species (ROS) plays a significant role in the apoptotic mechanism in pterostilbene-treated breast and prostate cancer cells [7,8]. PTS is characterized with much better bioavailability than resveratrol and other stilbenes due to two methoxy groups, which cause it to exhibit increased lipophilic and oral absorption. In animal studies, PTS was shown to have an 80% bioavailability compared to 20% for resveratrol, suggesting that it is a superior choice. Although all scientific studies concerning PTS show promising results relevant for both general health care and medicine, this compound has been significantly less examined than resveratrol. It is important to mention that PTS belongs to the group of molecules that stimulate the AMP-activated protein kinase (AMPK), which is a master regulator of cellular energy homeostasis. AMPK is one of the two catabolic signaling systems, works together with sirtuins in a feedback loop, and as a result, serve as signal nutrient scarcity [9]. These systems are part of our energy metabolism, and deregulation of this system is thought to be one of the reasons we age. For all these reasons, the development of a rapid, low-cost, and reliable detection system of PTS in dietary supplements, as well as more complex matrices, such as food and clinical samples, is of great importance.
Liquid chromatographic and spectrophotometric methods have found a wide application in the quantification and/or evaluation of antioxidative activity of PTS in food/drinks [10,11] and pharmaceuticals [11,12]. Moreover, these methods were used in preclinical treatment [13] for the explanation of PTS bioavailability and distribution in certain animal tissues [14,15], as well as for evaluation of the biochemical kinetics mechanism [16]. On the other hand, electrochemical methods emerged as one of the most convenient methods for simple drug analysis, due to its various advantages, such as its cost-effective instrumentation, fast-response and time-saving characteristics, and its simple operation. Most importantly, these methods provide high sensitivity, precision, accuracy, and good or satisfactory selectivity during drug sensing [17,18,19]. Screen-printing technology (thick film technology) is widely used for large-scale production of disposable electrochemical sensors, with its low cost, high reproducibility [20], and a possibility of miniaturization. In recent years, screen-printed electrodes are experiencing an expansion in electrochemical analysis, where the possibility of their simple modification, and fabrication of analyte-specific sensors, significantly extends their application in biological/clinical research [21,22], food analysis [23], and environmental [24,25] and pharmaceuticals [22,26] fields. In addition to carbon- and metal-printed electrodes, certain papers examine the performance of printed sensors with boron-doped diamond (BDD) electrodes [27,28]. Conventional BDD electrodes have been widely used in electrochemical analysis, due to their unique properties, such as wide “potential windows” in both aqueous and non-aqueous media, high chemical stability, excellent biocompatibility, low background current, resistance to passivation and corrosion, as well as high thermal conductivity [18]. The application of BDD electrodes in electroanalytical determination is depicted in several review articles [29,30]. Screen-printed diamond electrodes (SPDE) are commonly prepared directly on a silicon wafer substrate using chemical vapor deposition, yet this technique is expensive, and as such, not suitable for the large-scale production of this type of sensor [31,32]. An alternative method of fabrication for disposable SPDEs involves the use of BDD powder ink, unconducive organic binder, and inexpensive carriers [31]. According to our best knowledge, only one paper, dealing with the electrochemistry of PTS, exists in the literature [33]. Authors used a cathodically pretreated boron-doped diamond electrode (CP-BDD), and found that PTS provides a well-defined oxidation peak at +0.78 V (vs. Ag/AgCl) in 0.1 mol L-1 HNO3 solution containing cationic surfactant. Using the square-wave adsorptive anodic stripping voltametric method, the linear working range from 0.02 to 3.90 µmol L−1 was obtained, and the detection limit was calculated to be 4.30 nmol L−1. The authors successfully applied this method for the analysis of real samples of dietary supplements [33].
“Point-of-care” diagnostic systems have proven to be very applicable for the early detection of diseases at curable stages (cancer especially). Electrochemical sensors represent a very convenient platform for the “point-of-care” technology. The coupling of miniaturized detection systems with electrochemical devices offers a unique capability for the detection and monitoring of various diseases. “Point-of-care” platform-based portable devices, with further development and investment, are expected to accelerate disease diagnosis, making valid analytical results available within minutes [34,35]. Although an electrochemical method for the quantification of PTS already exists, with similar electroanalytical performances to our work, the aim of this study is the application of “point-of-care” testing on the SPDE. We are aiming to tune the conditions and augment the general properties of the method and hopefully later transfer this technology from laboratory conditions, and bulky equipment, to commercial use, with miniaturized analytical systems (at line sensing). The application of printed three-electrode systems, which require a minimum sample amount of approximately 30 µL, enables the detection of analytes in "one drop". With the method developed in this way, we are paving the way to satisfy one of the leading modern analytical requirements, which is the transfer of technology from laboratory tests to commercial use.
In this present work, we present the first use of a screen-printed sensor for the determination of PTS. In addition, all electrochemical measurements were conducted using a 30 µL drop of PTS-analyzed solution (single-drop-detection approach), in order to achieve the miniaturization of the detection system, its simplicity, and to ensure its minimal consumption of analytes and chemicals. Practical application of developed method was tested in the analysis of dietary supplements. We have enriched our experimental work with theoretical insights, provided by density functional theory (DFT) [36]. DFT represents an indispensable modeling toolbox, capable of investigating, explaining, and most importantly, predicting the physicochemical properties of both organic and inorganic molecules. DFT-based reactivity descriptors, such as Fukui functions [37], were widely used to predict the most probable reactive sites without the actual calculations of the corresponding potential energy surface [38,39]. In this regard, using the condensed form of local Fukui functions, we have theoretically determined the most reactive center of PTS and opened a door for a more straightforward exploration of the complete oxidation mechanism.

2. Materials and Methods

2.1. Chemicals and Reagents

All chemicals used in this study were of analytical grade. Pterostilbene (PTS) [≥97%, HPLC grade, solid] was supplied by Merck (Darmstadt, Germany). Sulfuric acid [95.0–98.0 wt.% in H2O], phosphoric acid [85 wt.% in H2O], and boric acid [≥99.5%, solid], used for the preparation of the Britton–Robinson buffer solution (BRBS), were supplied by Alfa Aesar (Haverhill, MA, USA).
Acetonitrile (ACN) [anhydrous, 99.8%], sodium hydroxide [≥98%, pellets] and interferences (glucose [≥99.5%, solid], dopamine hydrochloride [≥98%, powder], ascorbic acid [99%, solid], caffeic acid [≥98.0%, HPLC, solid], uric acid [≥99%, crystalline], paracetamol [≥97%, HPLC, solid], sodium chloride [≥99.0%, solid], calcium chloride [≥97%, anhydrous, powder], potassium chloride [99.0%, solid], and sodium nitrite [≥97.0%, solid]) were supplied by Merck (Darmstadt, Germany).
A standard solution of PTS (1 mmol L−1) was prepared by the dissolving of the appropriate amount of powder in a mixture of ultra-pure water and ACN (80:20, v/v). Although the analyte is soluble in other organic solvents, we have chosen ACN in order to reduce the organic solvent requirement and ensure a good solubility of the analyte in the dominantly water-based mixture.
BRBS was prepared by first dissolving boric acid in 1000 cm3 of ultra-pure water, and then carefully adding concentrated acetic (17 mol L−1) and phosphoric (18 mol L−1) acids in the initial solution, until the final concentration of each component in the resulting solution was set to 0.04 mol L−1. Acidic pH = 1 of BRBS was obtained by the addition of 0.5 mol L−1 HCl.
Conventionally available PTS capsules were purchased at a local pharmacy. According to the drug information leaflet, each capsule contained 50 mg of PTS (without any other additive drug indicated) and fillers, such as rice flour and hidroxypropyl methylcellulose.

2.2. Measurements and Instrumentation

In this study, a screen-printed diamond electrode (SPDE) [Thick-Film Boron Doped Diamond Electrodes, model DRP-BDD10, DropSens, Oviedo (Asturias) Spain] was used as a working electrode, with printed Ag/AgCl and printed carbon as the reference and auxiliary electrodes, respectively. “Point-of-care” methodology and single-drop-detection approach have been achieved by applying 30 µL of the solution (supporting electrolyte, analyte, real sample depending on the experiment) on the surface of the SPDE (Scheme 1). All electrochemical measurements were carried out on 30 µL-drop concepts.
Cyclic voltammetry (CV) and differential pulse voltammetry (DPV) were performed at potentiostat/galvanostat Autolab PGSTAT 302 N (MetrohmAutolab B.V., Utrecht, The Netherlands) controlled by Metrohm Nova 2.0 software.
The pH meter (Orion 1230), equipped with combined glass electrode (Orion 9165BNWP, Waltham, MA, USA), was used for all pH measurements.

2.3. Real Sample Preparation

PTS capsules, for dietary supplementation, were used as a real sample in this study, to present the analytical application of the developed electroanalytical method. Firstly, 15 capsules were opened and their contents were mixed. Then, 1 mg of the obtained powder was transferred into 50 mL-voltametric dark flask and dissolved in the ultra-pure water:ACN (80:20, v/v) mixture. After an ultrasonication period of 60 min, the content of the flask was diluted 100 times with BRBS (pH = 9) supporting electrolyte (solution A). Standard addition method was used for determination of PTS content in real samples. For that purpose, 10 mL of solution A was spiked with different volumes of 1 mmol L−1 PTS standard solution (10, 15, 25 and 40 µL). For each standard addition, individual 10 mL of solution A were used. The final PTS concentration of the standard addition was 1 µmol L−1 (solution B), 1.5 µmol L−1 (solution C), 2.5 µmol L−1 (solution D), and 4 µmol L−1 (solution E). All samples were directly analyzed.

2.4. Computational Details

All theoretical results are obtained through the Orca [40] electronic structure program suite (Program Version 5.0.2) by using the DFT approach. All calculations have been carried out on the B3LYP [41,42] level of theory, coupled with def2-TZVP orbital basis set with the dispersion correction on the D3BJ-level [43]. All molecular structures of interest have been fully optimized. To make calculations as realistic as possible, the solvation effects of water have been included using the conductor-like polarizable continuum model (C-PCM) [44].

3. Results and Discussion

3.1. Study of Electrochemical Behaviour of PTS on the SPDE

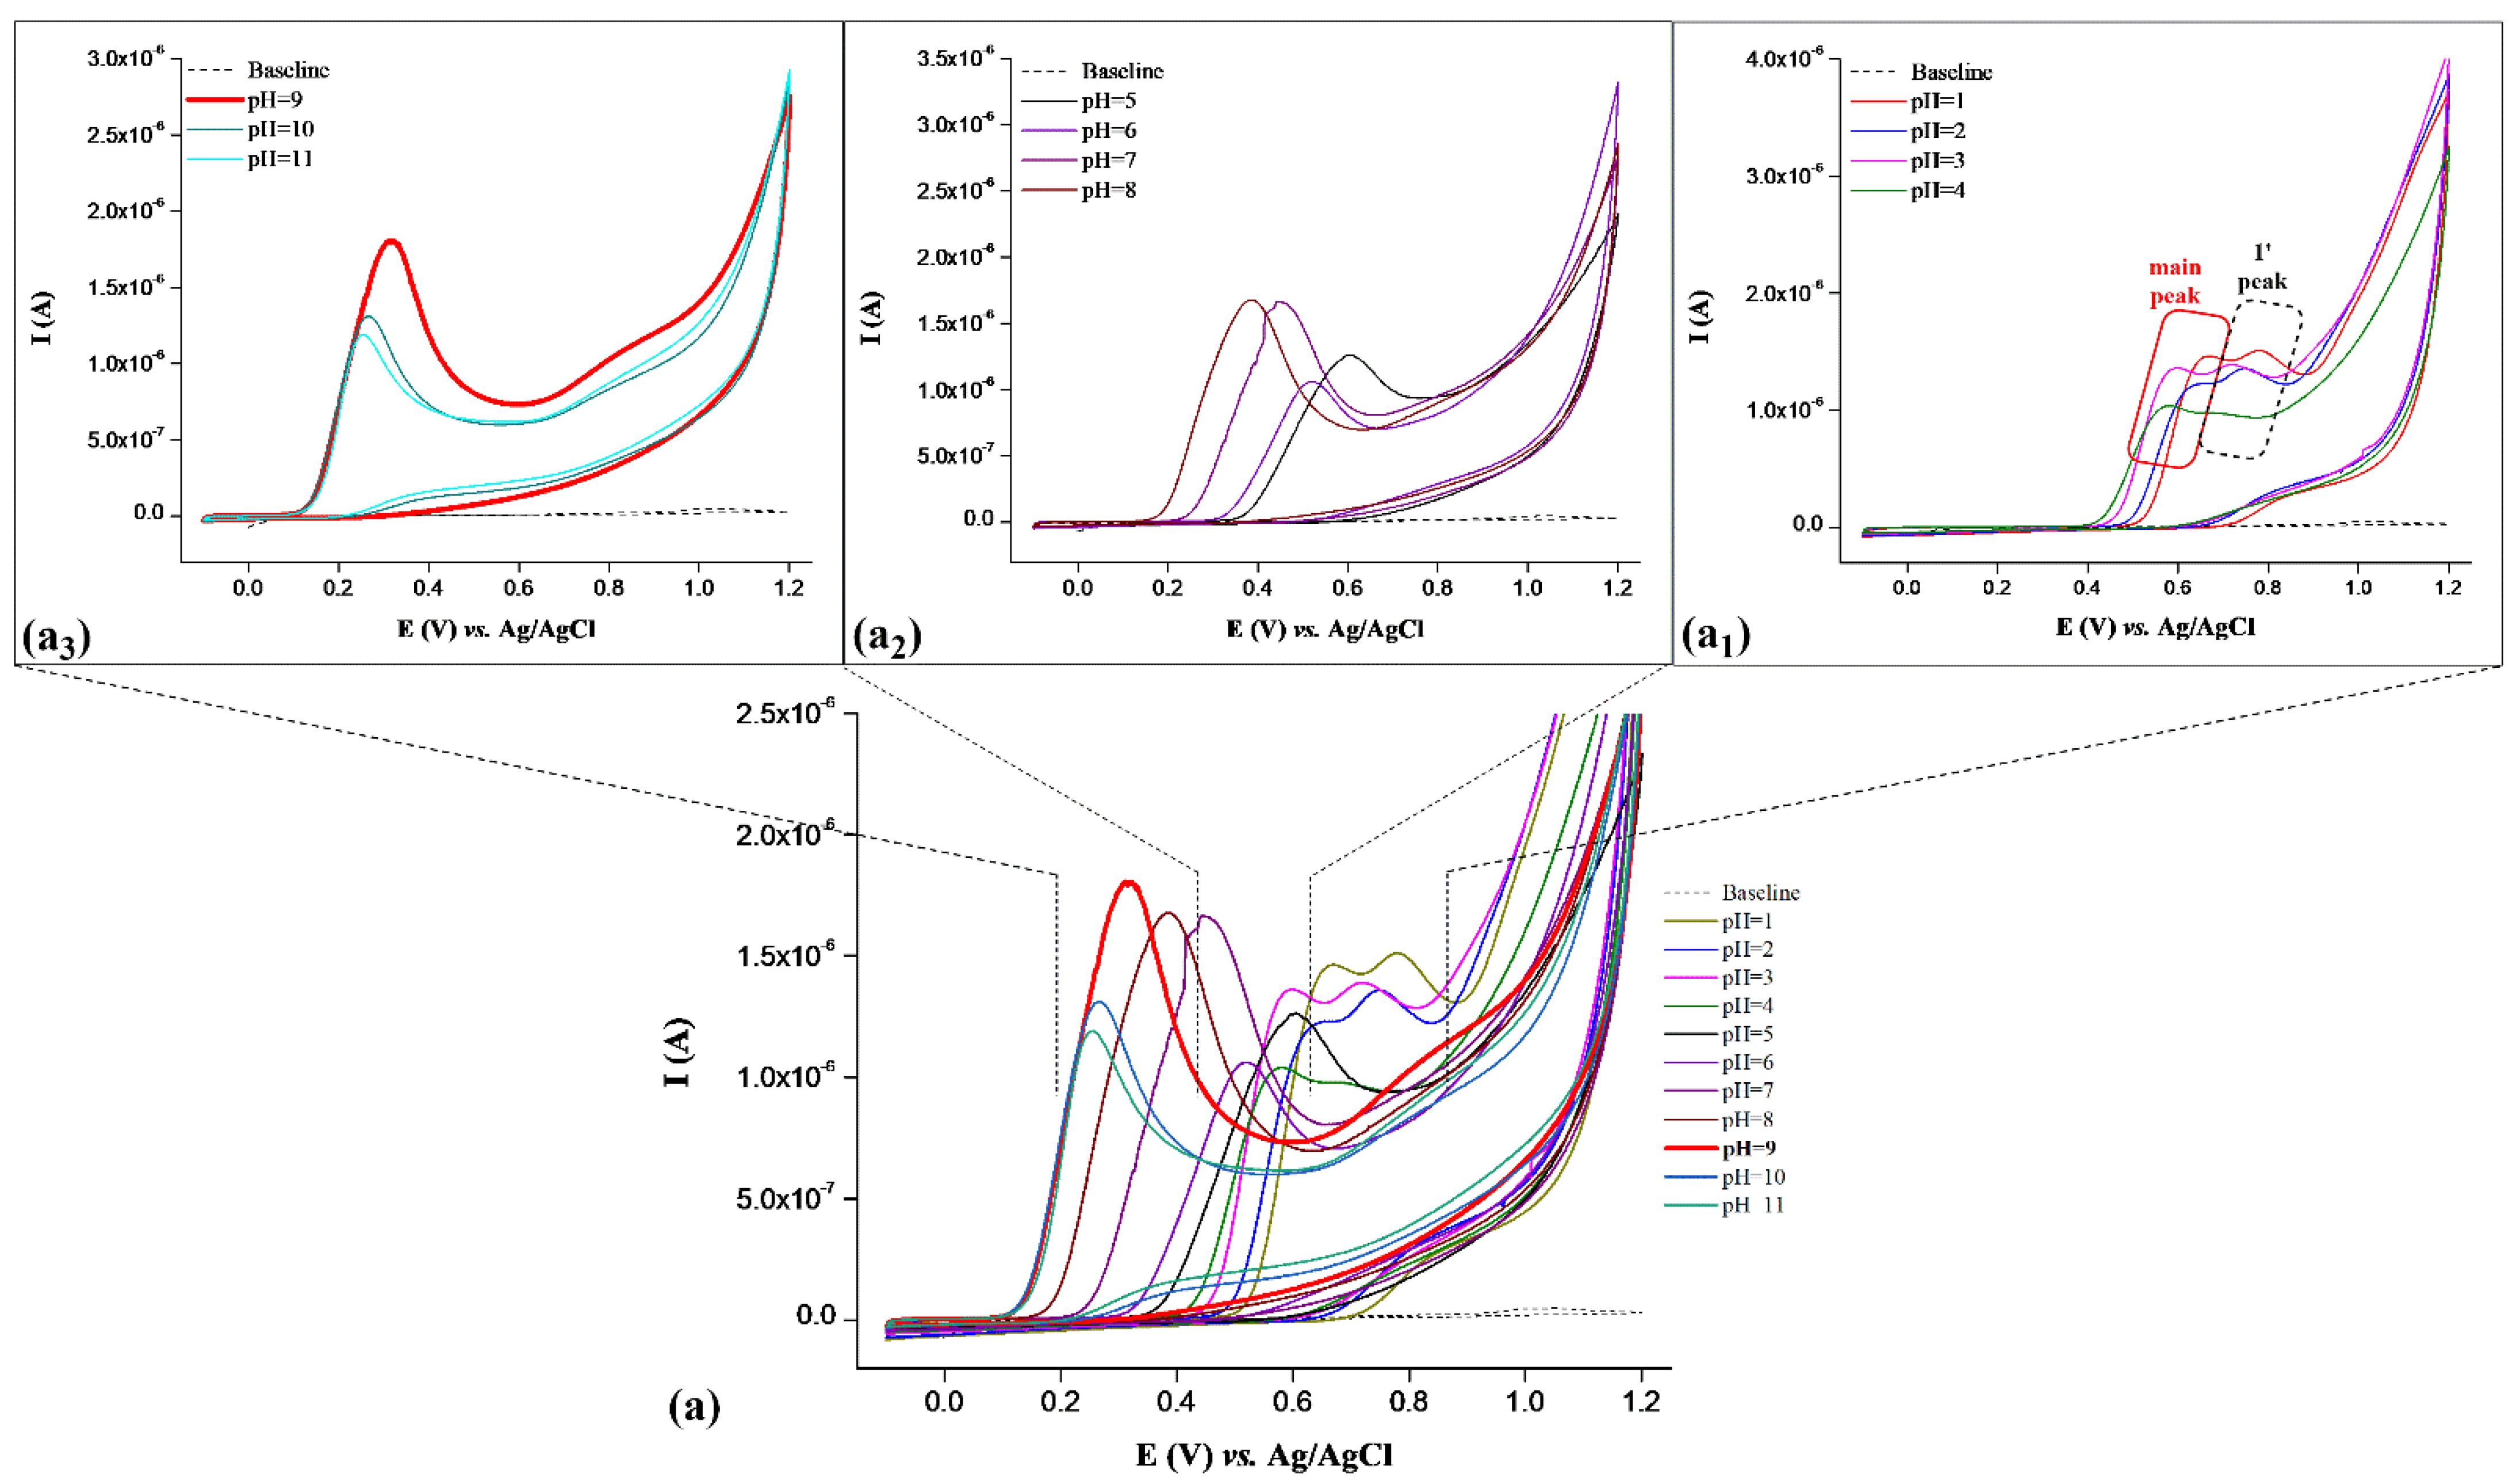
3.1.1. Electrochemical Behavior of PTS on the SPDE and the Influence of pH

To acquire the most favorable experimental conditions for selective and sensitive determination of PTS, CV study was executed in BRBS, at pH range from 1 to 11 (Figure 1). CV measurements were applied in potential range from −0.1 V to 1.2 V, with scan rate of 25 mV s−1, while concentration of PTS was 13 µmol L−1. All measurements were performed in triplicates. As it can be noticed from Figure 1a1, the oxidation of PTS on the SPDE surface causes the appearance of partially separated peaks in the acidic media (pH = 1 to pH = 4). The oxidation peaks of PTS occur at 0.66 V (main peak) and 0.78 V (1’ peak) at pH=1, while pH = 4 provided PTS oxidation at 0.58 V (main peak) and 0.69 V (1’ peak). The partial separation of the main oxidation peaks in BRBS from pH = 1 to pH = 4 is explained in Section 3.3. Quantum chemical calculations and theoretical modeling of the experiment. In the pH range from 1 to 4, two oxidation peaks for PTS oxidation appear (Figure 1a1). Those two peaks merge into one oxidation peak in the pH range of 5 and 8 (Figure 1a2). At the pH values of the supporting electrolyte from 9 to 11, the formation of an additional oxidation peak, which occurs at a constant potential of approximately 0.85 V, is noticeable (Figure 1a3). The nature of that peak requires additional research and is not taken into account in this work; it can be related to the pKa value for PTS, which is 9.5. Moreover, Figure 1a,a3 demonstrates the CV records for PTS on the SPDE with the most distinctive voltametric profile (highest magnitude and the lowest background current) achieved in BRBS pH = 9, where oxidation peak of PTS appears at 0.32 V. Therefore, pH = 9 of BRBS was chosen as optimal and used in further measurements. Slightly high pH of supporting electrolyte and redox processes at lower potential are very suitable for minimizing the impact of interfering substances.
In addition, Figure 2 shows a strong pH dependence of PST oxidation on the SPDE. Each data point of current in Figure 2 represents the average value of the three measurements, and the error bars correspond to their standard deviations (SD). The PTS oxidation peaks at pH = 1 occur at 0.66 V and 0.78 V, while pH = 11 provided peak potential at 0.25 V. High dependence between pH and peak potential is also present in the pH range from 1 to 4, observing both PTS oxidation peaks. Linear dependence of peak potential (Ep) on the pH, observed for the main peak (in pH range from 1 to 11), can be described by equation (1), where a slope of −46 mV/pH units is close to the theoretical value of −59 mV and indicates the exchange of an equal number of electrons and protons during the reaction. Although the proposition of the detailed electrochemical oxidation mechanism of PTS goes out of the scope of present research, we have determined the most probable reactive site of our analyte, by utilizing DFT-based reactivity descriptors—Fukui functions (Section 3.3. Quantum chemical calculations and theoretical modeling of the experiment).
E p ( V ) = 0.758 0.046   pH ,   r = 0.980

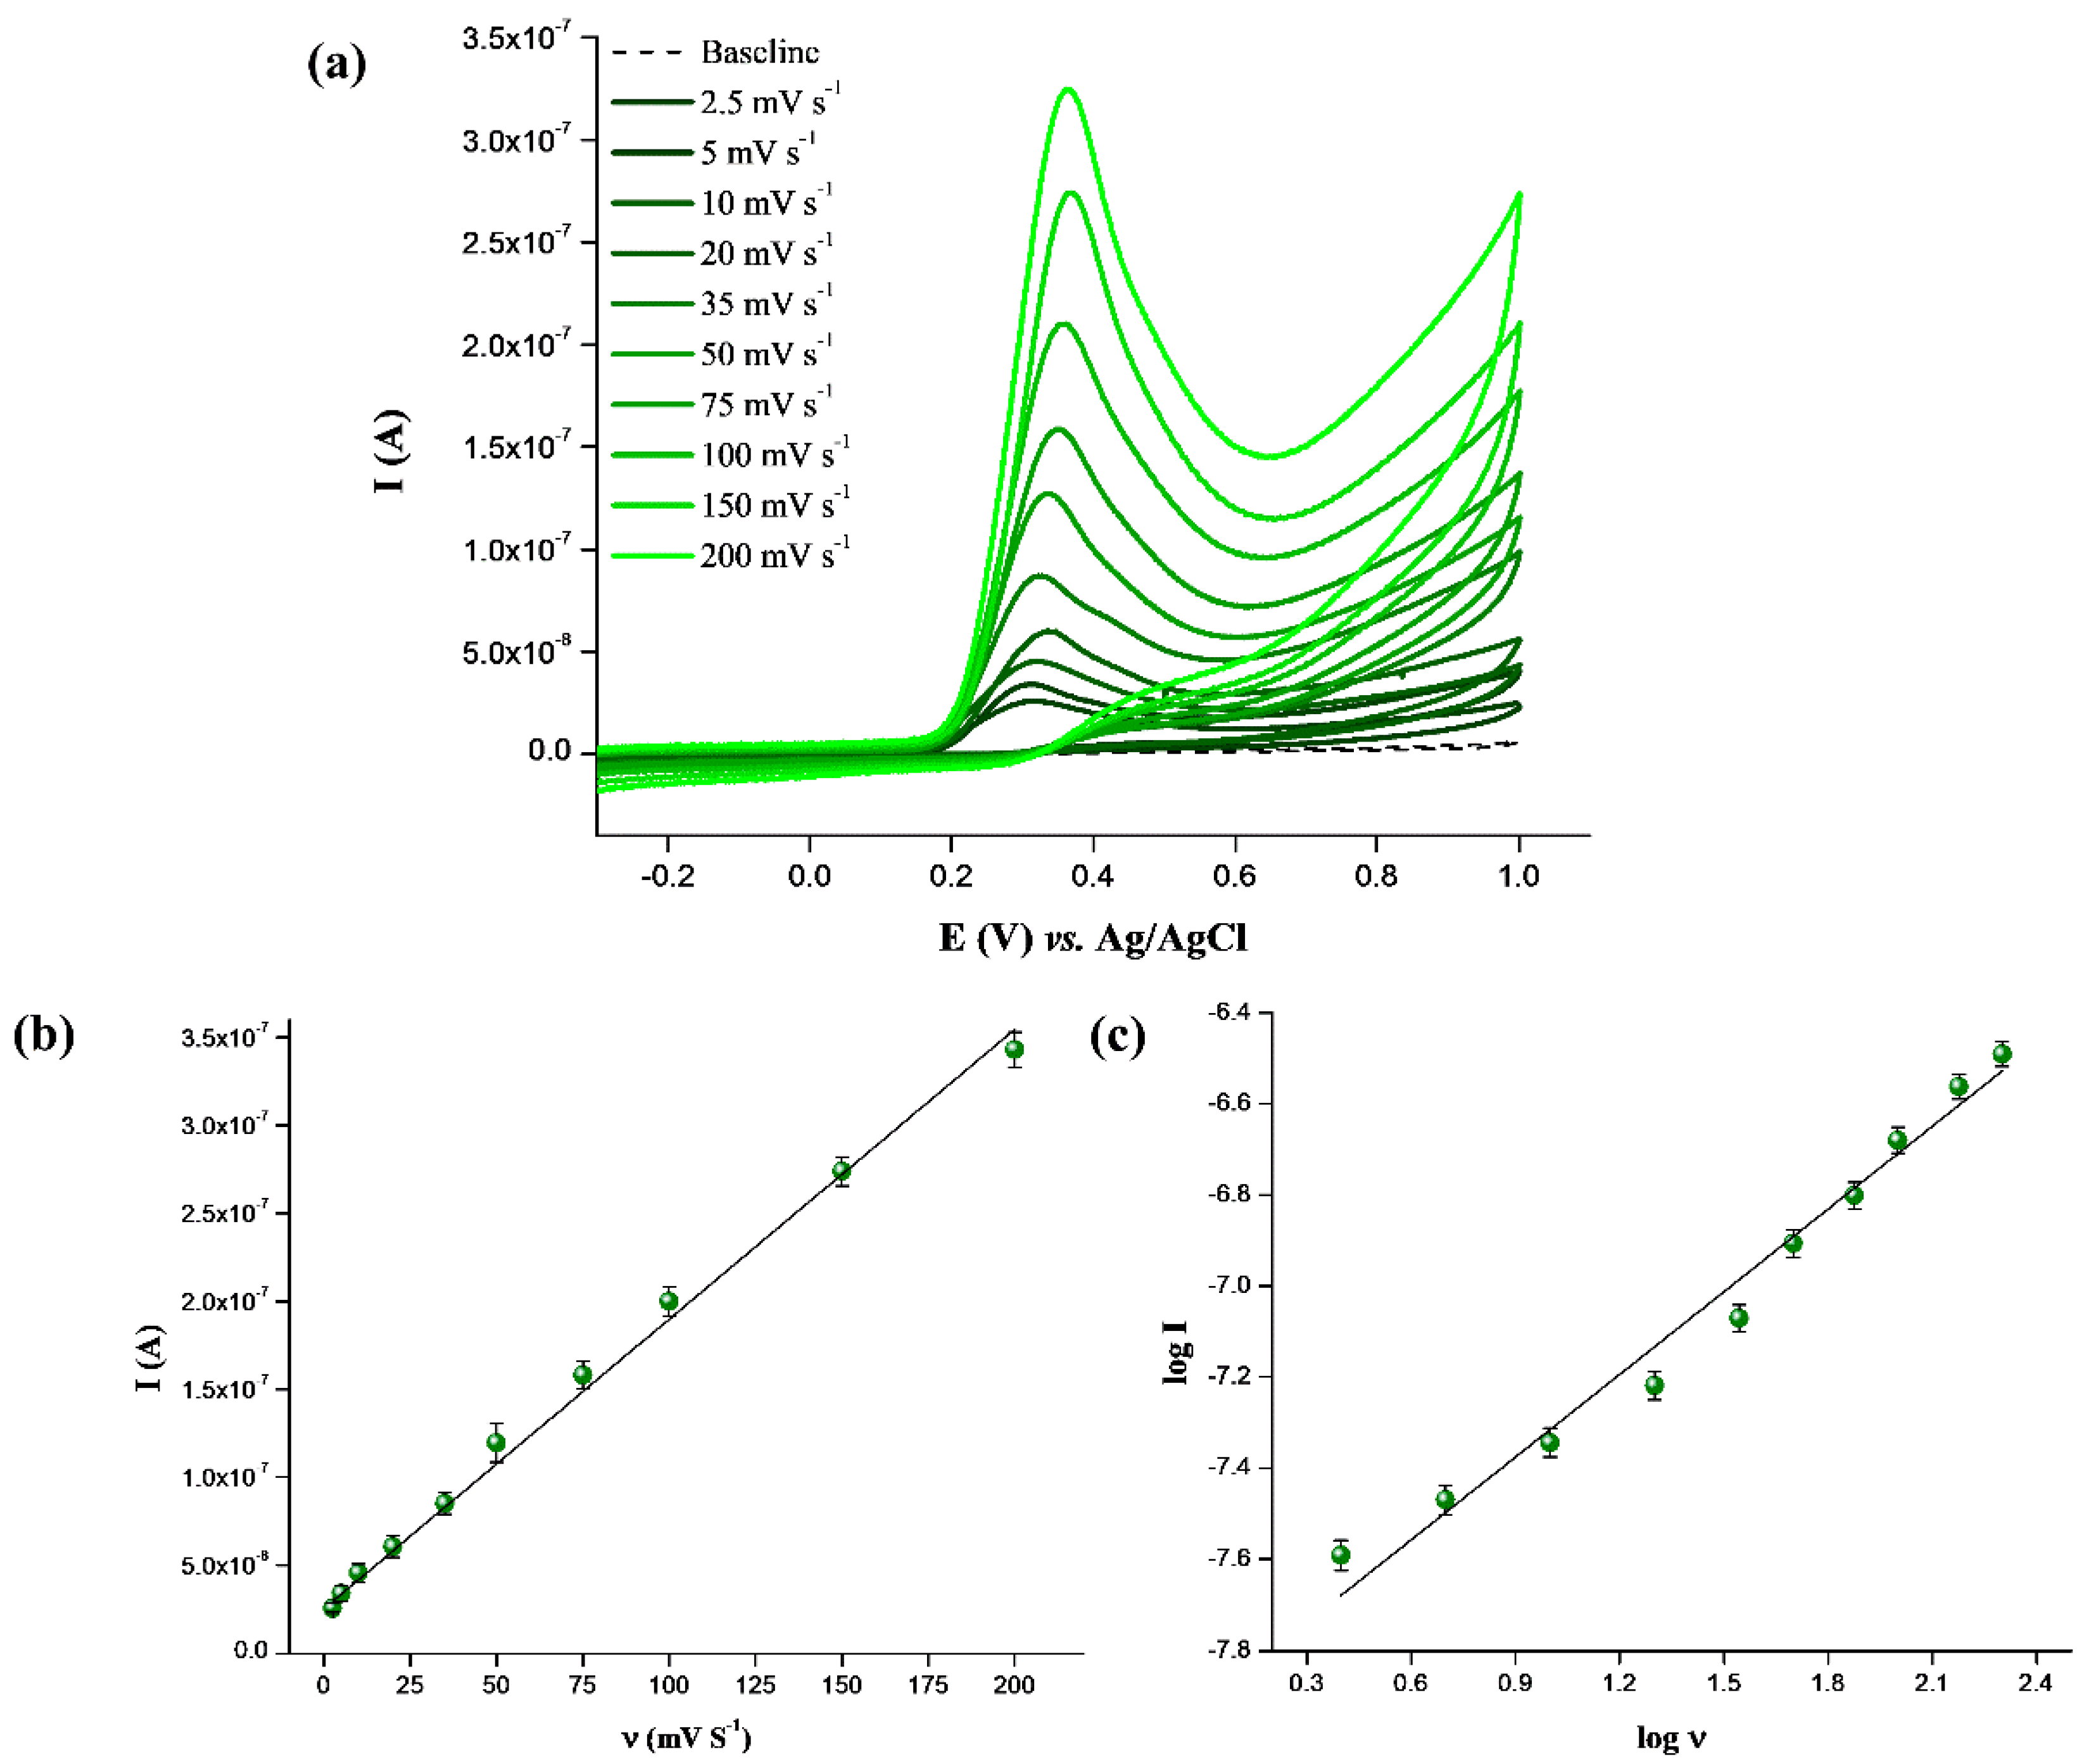
3.1.2. Effect of Scan Rate

In order to determine the nature of the oxidation process on the SPDE and mass transport in the diffusion layer, cyclic voltametric assays, at different scan rates, were applied. CV measurements were carried out three times. Figure 3a shows cyclic voltammograms of 6.5 µmol L−1 PTS in 0.1 mol L−1 BRBS (pH = 9) at scan rates ranging from 2.5 to 200 mV s−1. A slight shift of the peak to more positive potentials is noticeable and represents a typical indicator of irreversible processes on the electrode surface [18]. A similar behavior of PTS was also evidenced by Yigit et al. over a commercially available bulk BDD electrode [33]. Figure 3b shows a dependence of the peak current (I) of the scan rate (ν). This linear dependence is expressed by equation (2) and confirms that PTS oxidation on the SPDE is controlled by the adsorption rather than diffusion. In order to examine the nature of the occurring PTS oxidation process on the SPDE, the log I vs. log ν dependence was provided in Figure 3c. The regression line for the scan rate in the range from 2.5 to 200 mV s−1 (Figure 3c) is expressed by equation (3). The achieved slope of 0.60, for this dependence suggests the dual-controlled nature of PTS oxidation, where bot adsorption and diffusion processes have a significant contribution. These results are in accordance with the studies for structurally similar compounds [45,46]. A slight change in the peak potential, towards more positive values, with a change in the scan rate, is assumed to be caused by a fast redox electrode reaction, and also indicates the adsorption contribution in its nature.
I   ( A ) = 2.46 · 10 8 + 1.67 · 10 9   ν ( mV   s 1 ) ,   r = 0.998
log I   ( A ) = 7.92 + 0.60   log ν ( m V   s 1 ) ,   r = 0.990

3.2. Analytical Performance Evaluation

The DPV procedures have been developed to improve the sensitivity and selectivity of the method during PTS determination on the SPDE. The optimization of the DPV parameters is necessary in order to achieve a well-defined, sharp, and narrow oxidation peak of the analyte. This kind of voltammogram peak profile is particularly important in the complex matrices, since it ensures the separation of the analyte peak from potential interferences, and thus affects the resolution and selectivity. Certain DPV parameters were optimized in order to establish an electroanalytical method suitable for the quantification of PTS. Although the electrochemical behavior of PTS on the SPDE was also monitored using square wave voltammetry (SWV), the DPV method provided much better electrochemical response (Figure S1) (higher sensitivity and sharper oxidation peak for the identical PTS concentration).

3.2.1. Optimization of DPV Experimental Parameters

The optimization of the modulation amplitude and modulation time, as well as the interval time of DPV method, was carried out using 0.65 µmol L−1 of PTS in the BRBS (pH = 9). The electrochemical responses of PTS on the SPDE were followed in the potential range from −0.5 to 1.0 V. The modulation time and interval time were applied in the range from 10 to 80 ms and 300 to 700 ms, respectively. The modulation time and interval time were optimized at 50 ms and 500 ms, respectively (data not showed). These values of modulation and interval time provided a well-defined and narrow oxidation peak of PTS, with minimal background current. The modulation amplitude was applied in a range from 25 to 105 mV, while the modulation time and interval time were set at optimized values. As depicted in the DP voltammograms, shown in Figure S1, an alteration of the modulation amplitude in the range of 25 to 85 mV indicated the increase of the current responses of PTS with a slight shift of their peak maximums to the less positive potential values and negligible background current. Further, the modulation amplitudes of 95 and 105 mV did not lead to a significant change in the current response compared to the PTS oxidation peak at 85 mV (Figure S2). Therefore, the modulation amplitude of 85 mV was considered as the most suitable, providing the highest current response of PTS from the SPDE. Finally, the optimized modulation amplitude of 85 mV, modulation time of 50 ms, and interval time of 500 ms were used in all further DPV measurements.

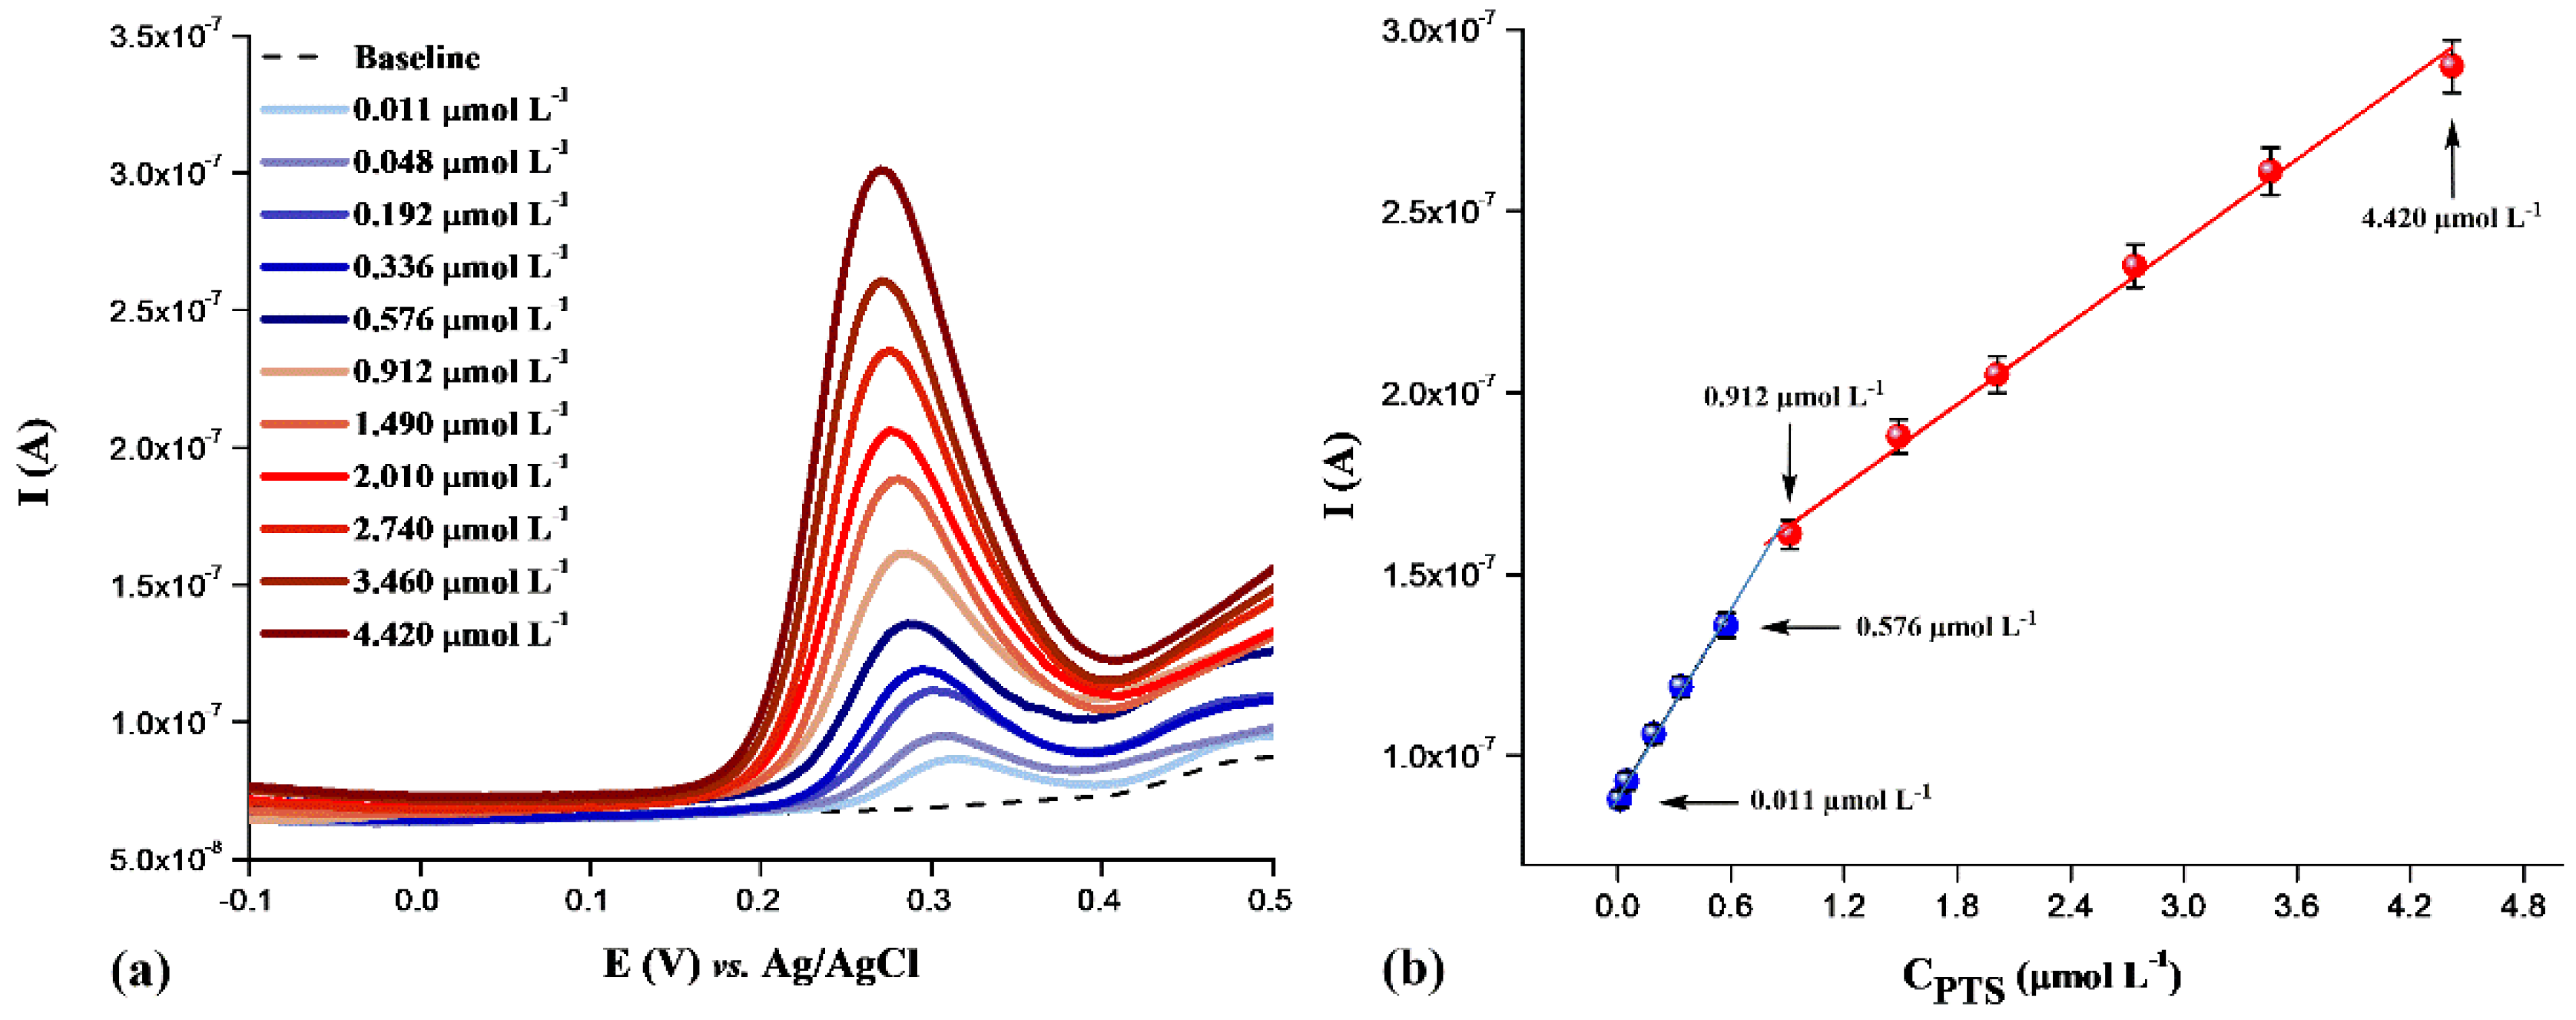
3.2.2. Calibration Curve and Analytical Parameters

The feasibility of the developed DPV procedure was investigated by the construction of a calibration curve. In this regard, the important electroanalytical parameters (linearity, limit of quantification (LOQ), and limit of detection (LOD)) were assessed by examining the oxidation peak current as a function of the PTS concentration, under the optimized experimental and instrumental conditions (BRBS (pH = 9), modulation amplitude of 85 mV, modulation time of 50 ms, and interval time of 500 ms). The volume of the analyzed solution was 30 µL. Figure 4a shows the respective DP voltammograms, where the SPDE recorded oxidation of PTS in a wide concentration range (from 0.011 to 4.420 µmol L−1). The PTS calibration was performed in triplicate. The calibration curves, with the corresponding error bars (SD between measurements, n = 3), are shown in the Figure 4b, where two linear ranges are clearly observed. In the first linear segment, the peak current increased proportionally with the PTS concentration from 0.011 to 0.912 µmol L−1 and yield a linear calibration plot described by Equation (4). The second linearity area was observed starting from 0.912 and going to 4.420 µmol L−1, and is described by Equation (5). It is assumed that the appearance of the two segments originates from the differences in the electrode surface coverage of PTS in the low and high concentrations of the analyte. In the first segment of linearity, where the calibration curve is constructed from the values of lower concentrations, the PTS oxidation takes place via a PTS monolayer. On the other hand, in the second linear segment multilayer, adsorption of PTS occurs due to accumulation process of PTS onto the SPDE, causing a trapping effect, where the further oxidation of the analyte takes place via the adsorbed layer [47,48]. The LOD and LOQ of the proposed electroanalytical method (calculated from first linear segment) were 3.1 nmol L−1 and 10.0 nmol L−1, respectively.
I ( A ) = 8.84 · 10 8 + 8.60 · 10 8   C ( µ mol   L 1 ) ,   r = 0.9970
I ( A ) = 1.29 · 10 7 + 3.75 · 10 8   C ( µ mol   L 1 ) ,   r = 0.9981
In order to gain data about the intra-day repeatability, three PTS concentrations were followed in five replicates under DPV-optimized conditions using a disposable SPDE. The relative standard deviation (RSD) for PTS concentrations of 0.011 µmol L−1, 0.912 µmol L−1 and 4.420 µmol L−1 (lowest, middle, and highest concentration of the working concentration range) were 5.75%, 2.93%, and 1.80%, respectively. Then, the PTS concentration of 0.912 µmol L−1 was analyzed under optimized conditions using five independent electrodes to evaluate the precision of the SPDE; the RSD between measurement was 5.70%. In addition, the PTS concentration of 0.912 µmol L−1 was followed within five consecutive days to the examined lifetime of the SPDE. The lifetime of the SPDE after the selected period was not below 76%. These results indicated good precision of PTS determination with the SPDE in an examined period. Therefore, the SPDE, with “point-of-care” methodology and single-drop-detection approach, has proven to be the appropriate electrochemical platform for the sensitive and precise determination of PTS under the selected experimental and instrumental conditions.
As mentioned above, there is only one paper related to the electrochemical determination of PTS [33]. The comparison of the important electroanalytical parameters of published research with our results is given in Table 1, where similar values can be observed. This was expected, considering that the similar active type of surface (boron-doped diamond electrode) was used. However, under optimized instrumental and experimental conditions, the SPDE shows a lower sensitivity than a commercially available bulk BDD, which is the main drawback of our method. On the other hand, the applied “point-of-care” platform and single-drop-detection approach (drop of 30 µL) in this study ensures simplicity, equipment miniaturization, and a minimum requirement for solvents and other chemicals.

3.2.3. Examination of Selectivity

In order to investigate the potential of the developed electroanalytical method for the application in the quantification of PTS in food, food supplements, and pharmaceutical products, the effect of different sugars, vitamins, metabolites, alkaloids, drugs, and certain cations/anions as interferences was examined. For this purpose, we used glucose (Glu), dopamine (Dop), ascorbic acid (AA), caffeic acid (CA), uric acid (UA), paracetamol (Par), sodium (Na+), calcium (Ca2+), potassium (K+), chloride (Cl), and nitrite (NO2) ions. The Glu, Dop, AA, Ca, UA, and Par were applied in the concentration of 2.4 µmol L−1, while each cation/anion was applied in a concentration of 40 µmol L−1. The DPV behavior of the 0.208 µmol L−1 of PTS in BRBS (pH = 9.0), in presence of listed interferences, was followed by the SPDE, under optimized instrumental conditions. Figure S3 represents the effects of the selected compounds at the determination of PTS. As it can be seen, the overall response of PTS changes by a maximum of 7% after the introduction of interference in a concentration ten times higher than the analyte. Considered together, the presented results are an indication of the high selectivity of the SPDE and the proposed DPV method, in a complex matrix application, with negligible or no matrix effect.

3.2.4. Application on Real Samples. Validation of Developed Method

After the testing of analytical performances and selectivity, the practical application of the developed DPV method and “point-of-care” methodology was investigated in PTS capsules (dietary supplements). As mentioned, the PTS content of each capsule was declared to be 50 mg.
For the determination of the PTS content in real samples, the standard addition method was used. The 30 µL of solution A (see Section 2.3) was applied on the surface of the SPDE and directly analyzed under the optimized experimental and instrumental parameters. Then, 30 µL of solution B, solution C, solution D, and solution E were analyzed using an identical approach (see Section 2.3). The experiments were performed in triplicate, and the results are summarized in Table 2. Excellent agreement between the declared value and the obtained PTS content indicates a high accuracy and precision during PTS determination, i.e., the developed method with a “point-of-care” platform can be successfully applied for the estimation of the PTS content in dietary supplements.

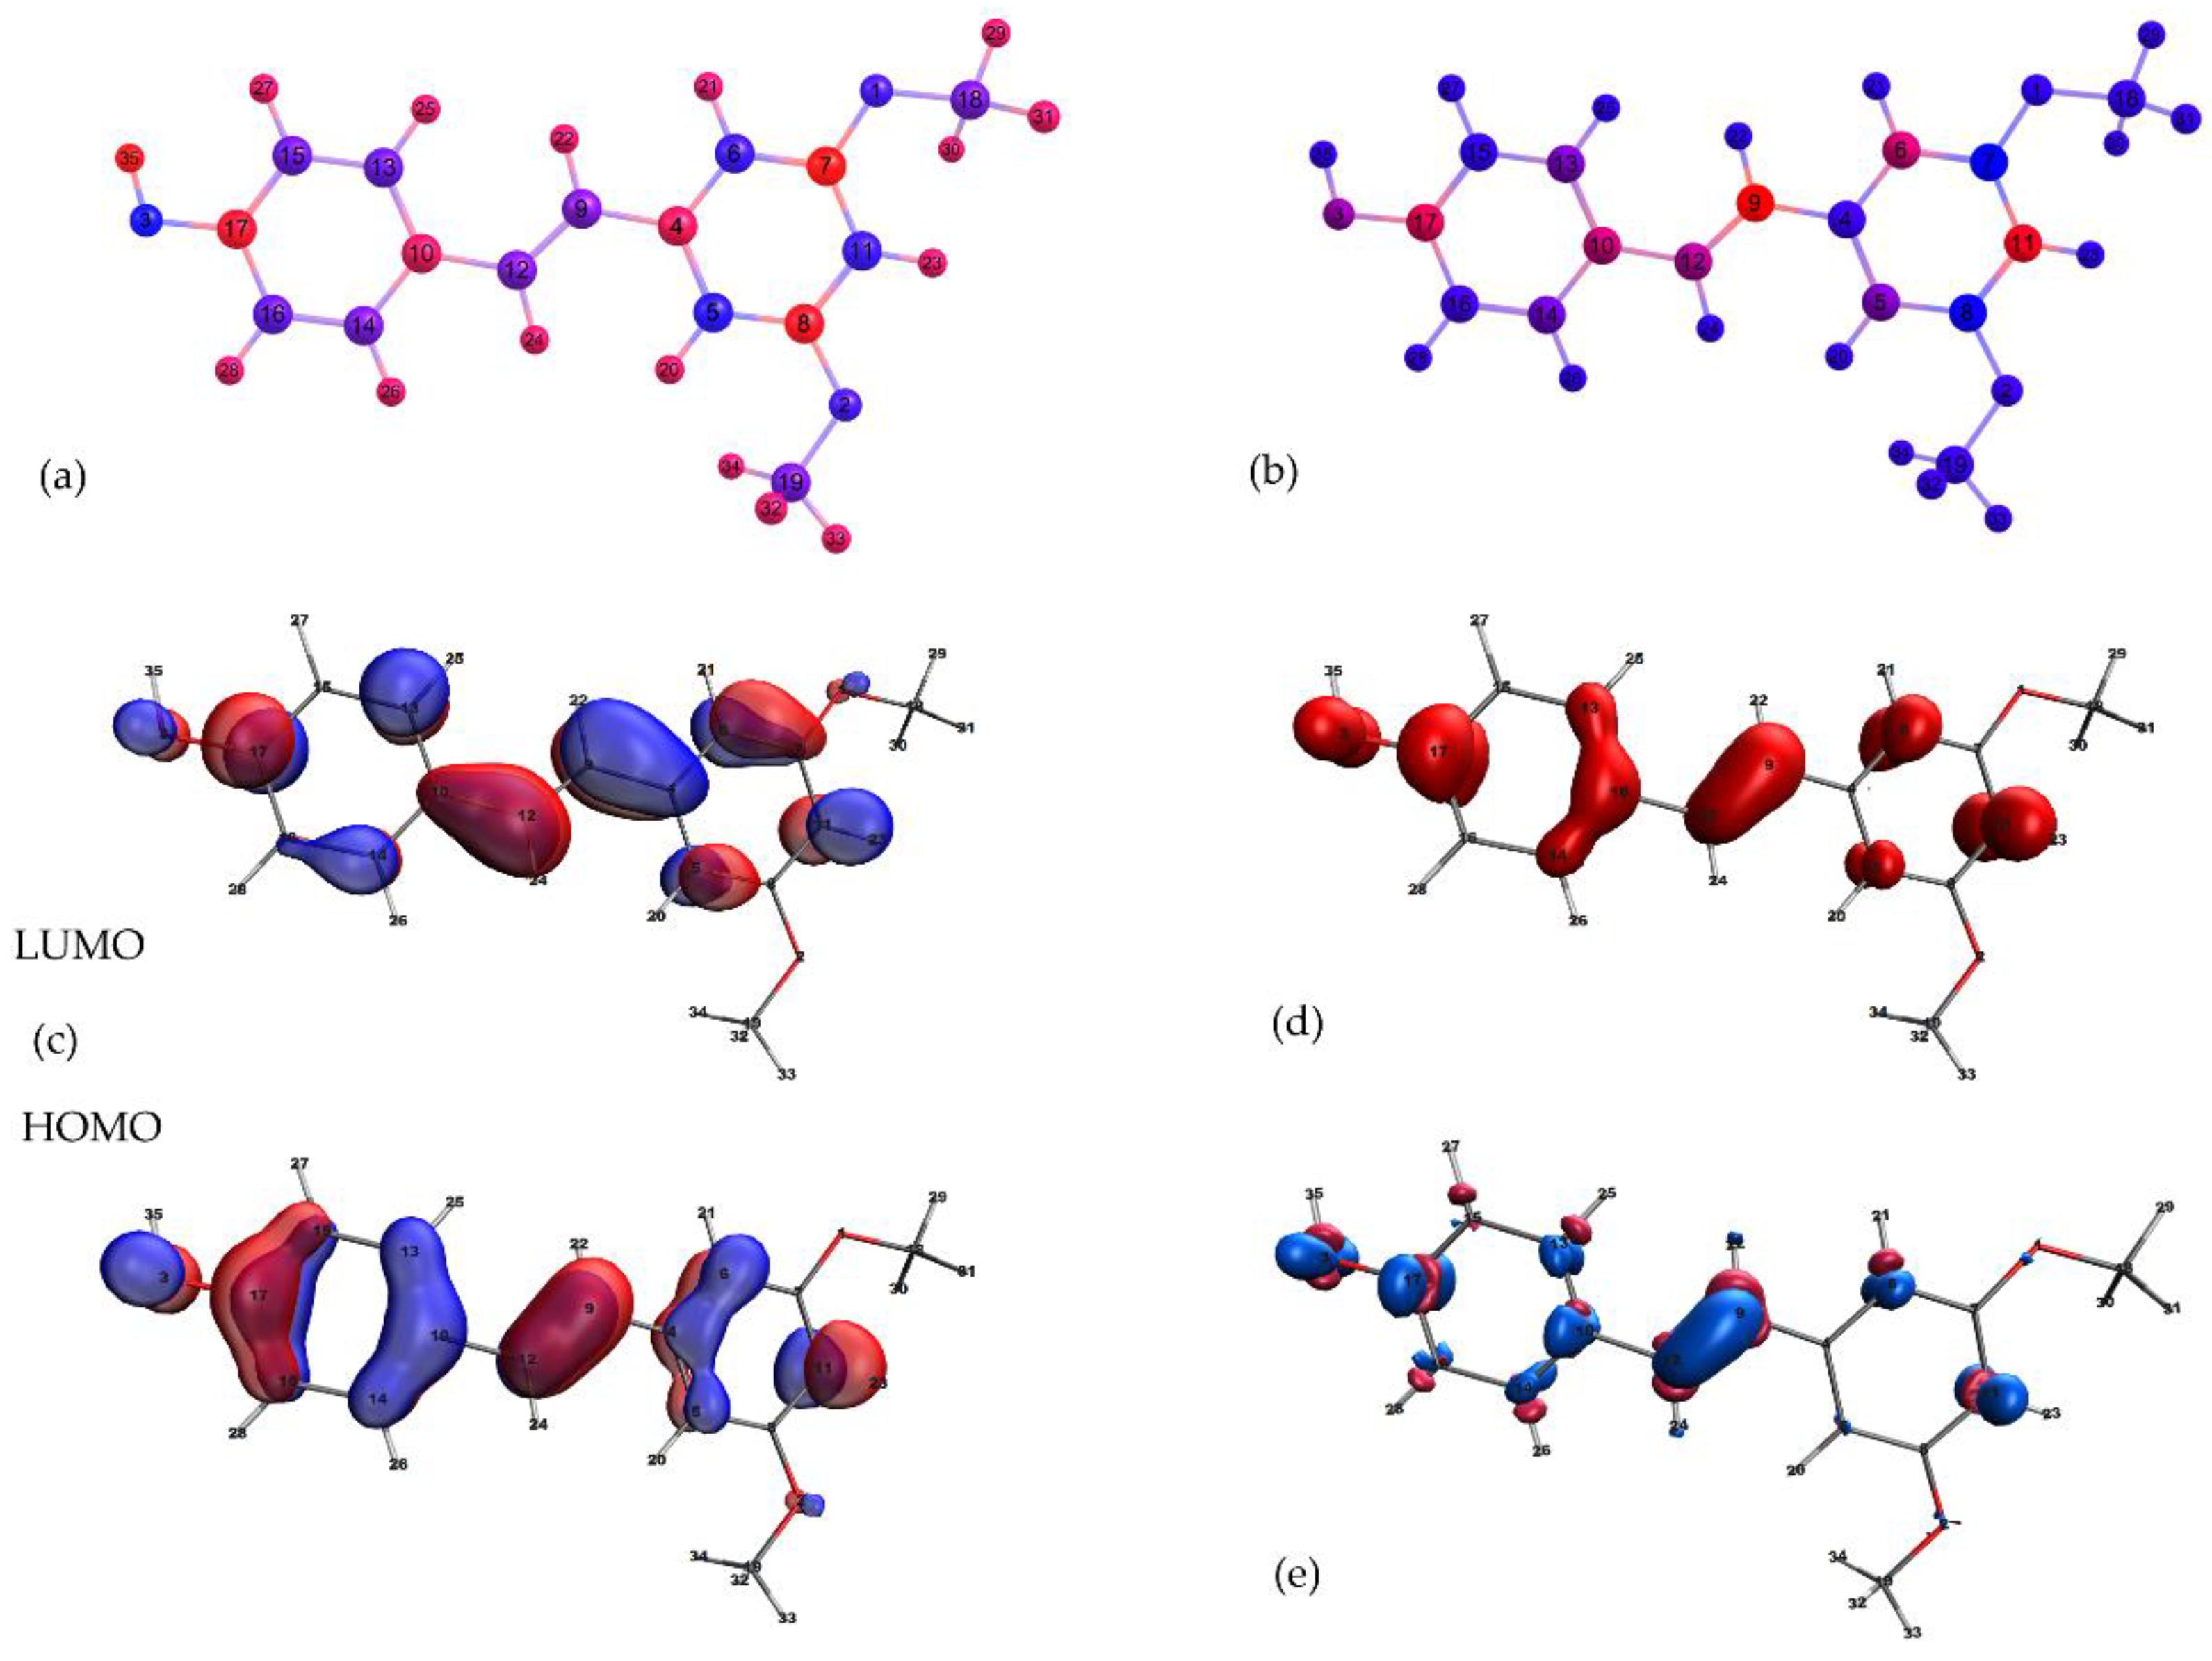
3.3. Quantum Chemical Calculations and Theoretical Modeling of the Experiment

Based on the nature of the electrochemical process, in which the removal/addition of electrons is involved, we initially aimed to shed a light upon the experimental response of PTS by theoretically determining its electronic structure. Our goal is also to investigate and understand the changes in the ground-state electronic structure caused by our experiments. After the B3LYP- level of theory optimization of the PTS geometry, Mulliken’s [49,50] atomic charges analysis is utilized to analyze the electronic character of the molecular regions. As can be seen from Figure 5a, the most intense electronic effect is the activation of the ortho and para positions (carbon atoms 5, 6, and 11) of the PTS aromatic core, caused by the electron-donating character of the periphery substituents. We continue our examination by inspecting the highest occupied molecular orbital (HOMO) and lowest unoccupied molecular orbital (LUMO). We are focusing on these orbitals due to the fact that their shape and positioning (distribution) correlate directly with the electrochemical events. We can expect the removal of an electron to take place within the HOMO orbital (whereby a spin-density-based cloud is forming in that region), whereas the addition of an electron or an electron pair from a donor should have their main impact on the LUMO orbital. As already mentioned, our electrochemical measurements showed an oxidation peak (Figure 5a), corresponding to a single-electro oxidation of the phenol moieties [51], such as the structurally similar resveratrol [52]. The shape and distribution of the HOMO orbital of PTS (Figure 5c) clearly reveals a larger investment of the phenolic aromatic ring, and thus, we can expect this ring to be strongly affected by the oxidation process. The spin-density (generated after one-electron removal) isosurface plot, shown in the Figure 5d, proves our initial hypothesis. Most importantly, the major portion of the generated spin density is located in the region of the conjugated double bond, positioned between two aromatic rings. This takes us to the conclusion that beside the ortho and para positions of both aromatic rings, the conjugated double bond will probably become highly reactive after the oxidation process takes place. By looking at the color representation of the generated spin density, shown in Figure 5b (the numerical values provided in the Supplementary material, Table S1), two important conclusions can be drawn. First, one would be the resonant pattern (Figure S4), induced by the oxidation of the phenol OH- group, which goes through the conjugated double bond and terminates on the other far end of the molecule. The second would be the dominant accumulation of the density on the carbon atom 9.
Although many valuable insights can be collected from frontier orbitals, as well as the spin-density visualization, this information cannot tell us much about the reactivity of different sites within a specific molecule. For this reason, we further augment our research with the calculation of condensed local Fukui functions, as explained in the Supplementary material. Three Fukui functions represent reactivity towards electrophiles, nucleophiles, and radicals. Although the electron-rich skeleton of PTS will be generally susceptible to the attack of electrophiles, our analyte will be electrochemically oxidized, and as such, is prone to the nucleophilic attack of the water molecules present in the solution. Here, we shall not neglect the possibility for the formation of a hydroxyl radical, on the electrode surface, that will also act as a reactive (radical) species. Although we have calculated the Fukui functions, even for the neutral PTS (Table S1), we consider this molecular form as less reactive, and the corresponding oxidized (charged) adducts as reactive moiety. Our calculations clearly show that after the one-electron oxidation process takes place, PTS becomes susceptible to both nucleophilic and radical attack primarily on position 9 (Table S1). The less pronounced but almost evenly relevant position would be the attack of both reactive species on carbon atom 11. Interestingly, these two positions emerge as the most reactive centers towards electrophilic attack as well. If considered together, our results assign carbon atom 9 as the most reactive atomic center, of the mono-oxidized PTS. Finally, it is important to draw attention to a clear correlation between the spin density and the attack topology/affinity of the reactive species present in the matrix. In this regard, we also provide an isosurface plot of the Fukui function for a nucleophilic attack (Figure 5e).
The final part of our experimental research, urging for the theoretical assistance, is the change of PTS behavior relative to the changes in the pH of the working environment. This change can be observed in the obtained voltammograms (Figure 1), where a clear split of the oxidation peak appears in the acid medium (pH = 1–4). Namely, according to the pKa = 9.9 [53] value of phenol, we can expect the protonation of PTS to take place at the approximate value of pH~4. For this reason, we have fully optimized the monoprotonated PTS, in order to investigate our hypothesis. According to the molecular orbital theory [54], the HOMO orbital energy represents the electron donating ability of one molecule when it interacts with others. On the contrary, the LUMO orbital energy denotes the electron-accepting ability. Taken together, the energy HOMO–LUMO gap represents the energy which an electron requires in order to move from HOMO to populate the LUMO orbital. As a result, ELUMO–EHOMO reflects the chemical stability of a molecule, with a higher value showing more stability. In this regard, we compared the HOMO–LUMO gap energy for both neutral and protonated PTS (Table S2). As it can be clearly seen, the protonated adduct PTSH+ (ELUMO − EHOMO = 93.7 Kcal/mol) is energetically more stable than the neutral PTS (ELUMO − EHOMO = 91.7 Kcal/mol), which can explain the shoulder on the initial oxidation peak, occurring on the slightly higher potential value of pH = 4. At all values below this pH equilibrium (50:50 of both species), we can expect the increase of the protonated adduct concentration, and thus our experiment shows the elevation of the shoulder relative to the decrease in the pH (Figure 1).

4. Conclusions

The “point-of-care” platform and the single-drop-detection approach (30 µL), coupled with the SPDE, were successfully applied for the development of the DPV method, utilized for quantification of PTS. Our miniaturized system detects PTS in a wide concentration range (0.011 to 4.420 µmol L−1), with nanomolar levels of LOD and LOQ and a high selectivity in the presence of certain interfering sugars, vitamins, metabolites, alkaloids, drugs, and certain cations/anions. In addition, “point-of-care” tasting with the SPDE showed the possibility of replacing bulky instrumentation with miniaturized ones and thus reducing the use of solution/analyte/real sample volume. In addition, the developed DPV method provided accurate and precise determination of PTS in dietary supplements with a high potential for commercial application in these pharmaceutical products.
Finally, guided by our experiments and encouraged with theoretically collected insight, we proposed the most reactive center of oxidized PTS moiety and opened a window for a new chemical point of view. Most importantly, our work resembles a basis for the further experimental and theoretical examination of PTS, which will hopefully lead to new breakthroughs related with the chemistry of this extraordinary molecule. It is also important to mention that this research aimed and successfully created a bridge between the experimentally observed signals and fundamentally based origin of chemical behavior. By defining the changes in the electronic structure, caused by the change of the working environment, we are able to understand the experiment, and hopefully in the future, predict the result.

Supplementary Materials

The following are available online at https://www.mdpi.com/article/10.3390/chemosensors11010015/s1. Figure S1. Electrochemical response of 6 µmol L−1 PTS in BRBS (pH = 9) at SPDE recorder by DPV (modulation amplitude 25 mV; modulation time 0.05 s; interval time 0.5 s) and SWV (modulation amplitude 20 mV; frequency 25 Hz). Figure S2. DP voltammograms for 0.65 µmol L−1 of PTS in BRBS (pH = 9) recorder at different modulation amplitudes (modulation time of 50 ms; interval time of 500 ms). Figure S3. Effect of possible interfering compounds for the detection of PTS by SPDE. All experiments were done under previously optimized experimental conditions (the optimized DPV parameters: modulation amplitude of 85 mV; modulation time of 50 ms; interval time of 500 ms). Figure S4. Possible resonance hybrid-structures, generated after the oxidation of phenol OH- group. Table S1. Mulliken charge analysis and calculated Fukui functions for PTS and corresponding oxidized adduct. Table S2. HOMO LUMO energy of PTS and PTSH+ and corresponding HOMO-LUMO gap. Refs. [55,56] in Supplementary Materials.

Author Contributions

Conceptualization, investigation, methodology, supervision, writing-original draft preparation, visualization, S.Đ.; investigation, writing-original draft preparation, visualization, F.V.; investigation, formal analysis, M.M.; validation, J.M.; formal analysis, D.M.; investigation, validation, V.S.; writing-review and editing, visualization, Ľ.Š.; investigation, methodology writing-review and editing, visualization, supervision, project administration, funding acquisition, D.S. All authors have read and agreed to the published version of the manuscript.

Funding

This work was supported by the Ministry of Education, Science and Technological Development of Republic of Serbia (contract number: 451-03-68/2020-14/200168 and Grant no. 200026 (University of Belgrade, Institute of Chemistry, Technology and Metallurgy-IChTM, RS-200026) and Eureka project E! 13303 MED-BIO-TEST (supported by the Ministry of Education, Science and Technological Development of Republic of Serbia (contract number 451-03-00053/2020-09/2/2). Moreover, this study has been supported by the Grant Agency of the Slovak Republic (VEGA No. 1/0159/20) and the bilateral Slovak-Serbian cooperation within the Slovak Research and Development Agency (SK-SRB-21-0019).

Data Availability Statement

The study did not report any data.

Conflicts of Interest

The authors declare no conflict of interest.

References

  1. Amarnath Satheesh, M.; Pari, L. The antioxidant role of pterostilbene in streptozotocin-nicotinamide-induced type 2 diabetes mellitus in Wistar rats. J. Pharm. Pharmacol. 2006, 58, 1483–1490. [Google Scholar] [CrossRef] [PubMed]
  2. Chang, J.; Rimando, A.; Pallas, M.; Camins, A.; Porquet, D.; Reeves, J.; Shukitt-Hale, B.; Smith, M.A.; Joseph, J.A.; Casadesus, G. Low-dose pterostilbene, but not resveratrol, is a potent neuromodulator in aging and Alzheimer’s disease. Neurobiol. Aging 2012, 33, 2062–2071. [Google Scholar] [CrossRef] [PubMed]
  3. Liu, J.; Fan, C.; Yu, L.; Yang, Y.; Jiang, S.; Ma, Z.; Hu, W.; Li, T.; Yang, Z.; Tian, T.; et al. Pterostilbene exerts an anti-inflammatory effect via regulating endoplasmic reticulum stress in endothelial cells. Cytokine 2016, 77, 88–97. [Google Scholar] [CrossRef] [PubMed]
  4. Ma, Z.; Zhang, X.; Xu, L.; Liu, D.; Di, S.; Li, W.; Zhang, J.; Zhang, H.; Li, X.; Han, J.; et al. Pterostilbene: Mechanisms of its action as oncostatic agent in cell models and in vivo studies. Pharmacol. Res. 2019, 145, 104265. [Google Scholar] [CrossRef]
  5. Moustafa, E.M.; Rashed, E.R.; Rashed, R.R. Pterostilbene Inhibits Dyslipidemia-Induced Activation of Progenitor Adipose Gene Under High-Fat Diet and Radiation Stressor. Nat. Prod. Commun. 2021, 16, 1–12. [Google Scholar] [CrossRef]
  6. Liu, Y.; You, Y.; Lu, J.; Chen, X.; Yang, Z. Recent Advances in Synthesis, Bioactivity, and Pharmacokinetics of Pterostilbene, an Important Analog of Resveratrol. Molecules 2020, 25, 5166. [Google Scholar] [CrossRef]
  7. Alosi, J.A.; McDonald, D.E.; Schneider, J.S.; Privette, A.R.; McFadden, D.W. Pterostilbene inhibits breast cancer in vitro through mitochondrial depolarization and induction of caspase-dependent apoptosis. J. Surg. Res. 2010, 161, 195–201. [Google Scholar] [CrossRef]
  8. McCormack, D.; McFadden, D. A review of pterostilbene antioxidant activity and disease modification. Oxid. Med. Cell. Longev. 2013, 2013, 575482. [Google Scholar] [CrossRef] [Green Version]
  9. Price, N.L.; Gomes, A.P.; Ling, A.J.Y.; Duarte, F.V.; Martin-Montalvo, A.; North, B.J.; Agarwal, B.; Ye, L.; Ramadori, G.; Teodoro, J.S.; et al. SIRT1 is required for AMPK activation and the beneficial effects of resveratrol on mitochondrial function. Cell Metab. 2012, 15, 675–690. [Google Scholar] [CrossRef] [Green Version]
  10. Rodríguez-Cabo, T.; Rodríguez, I.; López, P.; Ramil, M.; Cela, R. Investigation of liquid chromatography quadrupole time-of-flight mass spectrometry performance for identification and determination of hydroxylated stilbene antioxidants in wine. J. Chromatogr. A 2014, 1337, 162–170. [Google Scholar] [CrossRef]
  11. Waszczuk, M.; Bianchi, S.E.; Martiny, S.; Pittol, V.; Lacerda, D.S.; Araújo, A.S.d.R.; Bassani, V.L. Development and validation of a specific-stability indicating liquid chromatography method for quantitative analysis of pterostilbene: Application in food and pharmaceutical products. Anal. Methods 2020, 12, 4310–4318. [Google Scholar] [CrossRef] [PubMed]
  12. Kaur, J.; Dhiman, V.; Bhadada, S.; Katare, O.P.; Ghoshal, G. LC/MS guided identification of metabolites of different extracts of Cissus quadrangularis. Food Chem. Adv. 2022, 1, 100084. [Google Scholar] [CrossRef]
  13. Sirerol, J.A.; Feddi, F.; Mena, S.; Rodriguez, M.L.; Sirera, P.; Aupí, M.; Pérez, S.; Asensi, M.; Ortega, A.; Estrela, J.M. Topical treatment with pterostilbene, a natural phytoalexin, effectively protects hairless mice against UVB radiation-induced skin damage and carcinogenesis. Free Radic. Biol. Med. 2015, 85, 1–11. [Google Scholar] [CrossRef] [PubMed]
  14. Lin, H.-S.; Yue, B.-D.; Ho, P.C. Determination of pterostilbene in rat plasma by a simple HPLC-UV method and its application in pre-clinical pharmacokinetic study. Biomed. Chromatogr. 2009, 23, 1308–1315. [Google Scholar] [CrossRef] [PubMed]
  15. Deng, L.; Li, Y.; Zhang, X.; Chen, B.; Deng, Y.; Li, Y. UPLC-MS method for quantification of pterostilbene and its application to comparative study of bioavailability and tissue distribution in normal and Lewis lung carcinoma bearing mice. J. Pharm. Biomed. Anal. 2015, 114, 200–207. [Google Scholar] [CrossRef]
  16. Rodríguez-Bonilla, P.; Méndez-Cazorla, L.; López-Nicolás, J.M.; García-Carmona, F. Kinetic mechanism and product characterization of the enzymatic peroxidation of pterostilbene as model of the detoxification process of stilbene-type phytoalexins. Phytochemistry 2011, 72, 100–108. [Google Scholar] [CrossRef]
  17. Đurđić, S.; Stanković, V.; Vlahović, F.; Ognjanović, M.; Kalcher, K.; Manojlović, D.; Mutić, J.; Stanković, D.M. Carboxylated single-wall carbon nanotubes decorated with SiO2 coated-Nd2O3 nanoparticles as an electrochemical sensor for L-DOPA detection. Microchem. J. 2021, 168, 106416. [Google Scholar] [CrossRef]
  18. Švorc, Ľ.; Borovská, K.; Cinková, K.; Stanković, D.M.; Planková, A. Advanced electrochemical platform for determination of cytostatic drug flutamide in various matrices using a boron-doped diamond electrode. Electrochim. Acta 2017, 251, 621–630. [Google Scholar] [CrossRef] [Green Version]
  19. Anupriya, J.; Karuppusamy, N.; Chen, S.-M.; Lin, K.-Y. Synergistically improved electrochemical performance by the assembly of nanosized praseodymium tungstate on reduced graphene oxide for the detection of dimetridazole in biological and aquatic samples. J. Environ. Chem. Eng. 2022, 10, 108800. [Google Scholar] [CrossRef]
  20. Kondo, T.; Sakamoto, H.; Kato, T.; Horitani, M.; Shitanda, I.; Itagaki, M.; Yuasa, M. Screen-printed diamond electrode: A disposable sensitive electrochemical electrode. Electrochem. Commun. 2011, 13, 1546–1549. [Google Scholar] [CrossRef]
  21. Fabiani, L.; Saroglia, M.; Galatà, G.; de Santis, R.; Fillo, S.; Luca, V.; Faggioni, G.; D’Amore, N.; Regalbuto, E.; Salvatori, P.; et al. Magnetic beads combined with carbon black-based screen-printed electrodes for COVID-19: A reliable and miniaturized electrochemical immunosensor for SARS-CoV-2 detection in saliva. Biosens. Bioelectron. 2021, 171, 112686. [Google Scholar] [CrossRef] [PubMed]
  22. Tajik, S.; Beitollahi, H.; Shahsavari, S.; Nejad, F.G. Simultaneous and selective electrochemical sensing of methotrexate and folic acid in biological fluids and pharmaceutical samples using Fe3O4/ppy/Pd nanocomposite modified screen printed graphite electrode. Chemosphere 2022, 291, 132736. [Google Scholar] [CrossRef] [PubMed]
  23. Đurđić, S.; Ognjanović, M.; Krstić Ristivojević, M.; Antić, B.; Ćirković Veličković, T.; Mutić, J.; Kónya, Z.; Stanković, D. Voltammetric immunoassay based on MWCNTs@Nd(OH)3-BSA-antibody platform for sensitive BSA detection. Microchim. Acta 2022, 189, 422–433. [Google Scholar] [CrossRef] [PubMed]
  24. Knežević, S.; Ostojić, J.; Ognjanović, M.; Savić, S.; Kovačević, A.; Manojlović, D.; Stanković, V.; Stanković, D. The environmentally friendly approaches based on the heterojunction interface of the LaFeO3/Fe2O3@g-C3N4 composite for the disposable and laboratory sensing of triclosan. Sci. Total Environ. 2022, 857, 159250. [Google Scholar] [CrossRef]
  25. Kunpatee, K.; Kaewdorn, K.; Duangtong, J.; Chaiyo, S.; Chailapakul, O.; Kalcher, K.; Kerr, M.; Samphao, A. A new disposable electrochemical sensor for the individual and simultaneous determination of carbamate pesticides using a nanocomposite modified screen-printed electrode. Microchem. J. 2022, 177, 107318. [Google Scholar] [CrossRef]
  26. Clares, P.; Pérez-Ràfols, C.; Serrano, N.; Díaz-Cruz, J.M. Voltammetric Determination of Active Pharmaceutical Ingredients Using Screen-Printed Electrodes. Chemosensors 2022, 10, 95. [Google Scholar] [CrossRef]
  27. Stanković, D.M.; Milanović, Z.; Švorc, Ľ.; Stanković, V.; Janković, D.; Mirković, M.; Đurić, S.V. Screen printed diamond electrode as efficient “point-of-care” platform for submicromolar determination of cytostatic drug in biological fluids and pharmaceutical product. Diam. Relat. Mater. 2021, 113, 108277. [Google Scholar] [CrossRef]
  28. Kozak, J.; Tyszczuk-Rotko, K.; Wójciak, M.; Sowa, I.; Rotko, M. First Screen-Printed Sensor (Electrochemically Activated Screen-Printed Boron-Doped Diamond Electrode) for Quantitative Determination of Rifampicin by Adsorptive Stripping Voltammetry. Materials 2021, 14, 4231. [Google Scholar] [CrossRef]
  29. Kondo, T. Recent electroanalytical applications of boron-doped diamond electrodes. Curr. Opin. Electrochem. 2022, 32, 100891. [Google Scholar] [CrossRef]
  30. Muzyka, K.; Sun, J.; Fereja, T.H.; Lan, Y.; Zhang, W.; Xu, G. Boron-doped diamond: Current progress and challenges in view of electroanalytical applications. Anal. Methods 2019, 11, 397–414. [Google Scholar] [CrossRef]
  31. Matsunaga, T.; Kondo, T.; Shitanda, I.; Hoshi, Y.; Itagaki, M.; Tojo, T.; Yuasa, M. Sensitive electrochemical detection of l-Cysteine at a screen-printed diamond electrode. Carbon 2021, 173, 395–402. [Google Scholar] [CrossRef]
  32. Matvieiev, O.; Šelešovská, R.; Vojs, M.; Marton, M.; Michniak, P.; Hrdlička, V.; Hatala, M.; Janíková, L.; Chýlková, J.; Skopalová, J.; et al. Novel Screen-Printed Sensor with Chemically Deposited Boron-Doped Diamond Electrode: Preparation, Characterization, and Application. Biosensors 2022, 12, 241. [Google Scholar] [CrossRef]
  33. Yiğit, A.; Yardım, Y.; Selçuk Zorer, Ö.; Şentürk, Z. Electrochemical determination of pterostilbene at a cathodically pretreated boron-doped diamond electrode using square-wave adsorptive anodic stripping voltammetry in cationic surfactant media. Sens. Actuators B Chem. 2016, 231, 688–695. [Google Scholar] [CrossRef]
  34. Zhang, W.; Wang, R.; Luo, F.; Wang, P.; Lin, Z. Miniaturized electrochemical sensors and their point-of-care applications. Chin. Chem. Lett. 2020, 31, 589–600. [Google Scholar] [CrossRef]
  35. Campuzano, S.; Pedrero, M.; Yáñez-Sedeño, P.; Pingarrón, J.M. New challenges in point of care electrochemical detection of clinical biomarkers. Sens. Actuators B Chem. 2021, 345, 130349. [Google Scholar] [CrossRef]
  36. Parr, R.G.; Yang, W. Electron density, Kohnof Atoms and Molecules; Oxford University Press: Oxford, UK, 1989. [Google Scholar]
  37. Yang, W.; Parr, R.G.; Pucci, R. Electron density, Kohn–Sham frontier orbitals, and Fukui functions. J. Chem. Phys. 1984, 81, 2862–2863. [Google Scholar] [CrossRef]
  38. Bruzzone, S.; Chiappe, C.; Focardi, S.E.; Pretti, C.; Renzi, M. Theoretical descriptor for the correlation of aquatic toxicity of ionic liquids by quantitative structure–toxicity relationships. Chem. Eng. J. 2011, 175, 17–23. [Google Scholar] [CrossRef]
  39. Dostanić, J.; Lončarević, D.; Zlatar, M.; Vlahović, F.; Jovanović, D.M. Quantitative structure-activity relationship analysis of substituted arylazo pyridone dyes in photocatalytic system: Experimental and theoretical study. J. Hazard. Mater. 2016, 316, 26–33. [Google Scholar] [CrossRef] [Green Version]
  40. Neese, F. The ORCA program system. WIREs Comput. Mol. Sci. 2012, 2, 73–78. [Google Scholar] [CrossRef]
  41. Lee, C.; Yang, W.; Parr, R.G. Development of the Colle-Salvetti correlation-energy formula into a functional of the electron density. Phys. Rev. B 1988, 37, 786–789. [Google Scholar] [CrossRef]
  42. Becke, A.D. A new mixing of Hartree–Fock and local density-functional theories. J. Chem. Phys. 1993, 98, 1372–1377. [Google Scholar] [CrossRef]
  43. Kruse, H.; Grimme, S. A geometrical correction for the inter- and intra-molecular basis set superposition error in Hartree-Fock and density functional theory calculations for large systems. J. Chem. Phys. 2012, 136, 154101. [Google Scholar] [CrossRef] [PubMed] [Green Version]
  44. Barone, V.; Cossi, M. Quantum Calculation of Molecular Energies and Energy Gradients in Solution by a Conductor Solvent. Model. J. Phys. Chem. A 1998, 102, 1995–2001. [Google Scholar] [CrossRef]
  45. Chokkareddy, R.; Redhi, G.G.; Karthick, T. A lignin polymer nanocomposite based electrochemical sensor for the sensitive detection of chlorogenic acid in coffee samples. Heliyon 2019, 5, e01457. [Google Scholar] [CrossRef] [Green Version]
  46. Ngamchuea, K.; Tharat, B.; Hirunsit, P.; Suthirakun, S. Electrochemical oxidation of resorcinol: Mechanistic insights from experimental and computational studies. RSC Adv. 2020, 10, 28454–28463. [Google Scholar] [CrossRef]
  47. Filik, H.; Çetintaş, G.; Avan, A.A.; Aydar, S.; Koç, S.N.; Boz, İ. Square-wave stripping voltammetric determination of caffeic acid on electrochemically reduced graphene oxide-Nafion composite film. Talanta 2013, 116, 245–250. [Google Scholar] [CrossRef]
  48. Patra, S.; Munichandraiah, N. Electrochemical reduction of hydrogen peroxide on stainless steel. J. Chem. Sci. 2009, 121, 675–683. [Google Scholar] [CrossRef] [Green Version]
  49. Mulliken, R.S. Electronic Population Analysis on LCAO-MO Molecular Wave Functions. IV. Bonding and Antibonding in LCAO and Valence-Bond Theories. J. Chem. Phys. 1955, 23, 2343–2346. [Google Scholar] [CrossRef]
  50. Mulliken, R.S. Electronic Population Analysis on LCAO–MO Molecular Wave Functions. II. Overlap Populations, Bond Orders, and Covalent Bond Energies. J. Chem. Phys. 1955, 23, 1841–1846. [Google Scholar] [CrossRef]
  51. Uskova, I.K.; Bulgakova, O.N. Cyclic voltammetry of phenol. J. Anal. Chem. 2014, 69, 542–547. [Google Scholar] [CrossRef]
  52. Corduneanu, O.; Janeiro, P.; Brett, A.M.O. On the Electrochemical Oxidation of Resveratrol. Electroanalysis 2006, 18, 757–762. [Google Scholar] [CrossRef] [Green Version]
  53. Lide, D.R. CRC Handbook of Chemistry and Physics, 83 rd ed.; CRC Press Inc.: Boca Raton, FL, USA, 2002–2003; pp. 8–49. [Google Scholar]
  54. Miessler, G.L.; Fischer, P.J.; Tarr, D.A. Inorganic Chemistry, 5th ed.; Pearson Education Inc: London, UK, 2013; pp. 117–165, 475–534. [Google Scholar]
  55. Stanton, J.F. A Chemist’s Guide to Density Functional Theory By Wolfram Koch (German Chemical Society, Frankfurt am Main) and Max C. Holthausen (Humbolt University Berlin). J. Am. Chem. Soc. 2001, 123, 2701. [Google Scholar] [CrossRef]
  56. Ayers, P.W.; Levy, M. Perspective on Density functional approach to the frontier-electron theory of chemical reactivity. Theor. Chem. Acc. 2000, 103. [Google Scholar] [CrossRef]
Scheme 1. Schematic illustration of “point-of-care” methodology.
Chemosensors 11 00015 sch001
Figure 1. (a) Cyclic voltammograms of 13 µmol L−1 of PTS over SPDE in various pH of BRBS; (a1) from pH = 1 to pH = 4; (a2) from pH = 5 to pH = 8; (a3) from pH = 9 to pH = 11. Scan rate 25 mV s−1.
Chemosensors 11 00015 g001
Figure 2. Dependence of the peak current, I (with corresponding error bars, n = 3) and peak potential (E) against pH.
Chemosensors 11 00015 g002
Figure 3. (a) CV records for 6.5 µmol L−1 PTS in BRBS (pH = 9) over SPDE, after applying different scan rates. (b) The dependence of I vs. ν (error bars represent SD between three measurements). (c) log I vs. log ν graph with corresponding error bars (n = 3).
Chemosensors 11 00015 g003
Figure 4. (a) DPV records for the different concentrations of PTS in BRBS (pH = 9.0) on the the SPDE using “point-of-care” methodology and the single-drop-detection approach. The optimized DPV parameters are: modulation amplitude of 85 mV; modulation time of 50 ms; interval time of 500 ms. (b) Calibration plot with corresponding error bars.
Chemosensors 11 00015 g004
Figure 5. (a) Color representation of the Mulliken charges, obtained for PTS (calculated numeric values are given in the Supplementary material, Table S1). Red color represents positively charged atoms, whereas blue represents the negative centers of the molecule. (b) Color representation of the spin density, generated after one-electron oxidation process (calculated numeric values are given in the Supplementary material, Table S1). Red color represents the atomic centers with accumulated spin density. (c) HOMO and LUMO orbitals of PTS. (d) Isosurface plot of the spin- density, generated after the one-electron oxidation process. (e) Isosurface plot of the Fukui function for a nucleophilic attack; calculations carried out on the B3LYP-D3BJ level of theory.
Chemosensors 11 00015 g005
Table 1. Comparison of electroanalytical performances of this study with the PTS sensor reported in the literature.
SensorMethodConc. Range *
(µmol L−1)
LOQ
(nmol L−1)
LOD
(nmol L−1)
Sensitivity
(µA (µmol L−1)−1)
Reference
CP-BDD **SWV ***0.02–3.90144.35.47[33]
SPDEDPV0.011–4.420103.10.09this study
* Conc. Range—concentration range; ** CP-BDD—cathodically pretreated boron-doped diamond electrode; *** SWV—square wave voltammetry.
Table 2. Recovery results of the proposed DVP method in the PTS dietary supplements.
Declared Value (mg)Found Value (mg)Recovery (%)
Probe 15050.9102
Probe 25048.196
Probe 35047.695
average ± SD * 49 ± 2
* SD—standard deviation between probes.
Disclaimer/Publisher’s Note: The statements, opinions and data contained in all publications are solely those of the individual author(s) and contributor(s) and not of MDPI and/or the editor(s). MDPI and/or the editor(s) disclaim responsibility for any injury to people or property resulting from any ideas, methods, instructions or products referred to in the content.

