1. Introduction
Over the past few years, the unique chemical and biological properties of nanomaterials (NMs) has led to their ubiquitous presence in daily life. Amid the varied types of NMs, the II–VI semiconducting NMs have attracted much attention due to their outstanding electronic and optoelectronic properties [
1,
2,
3]. In particular, one of the most widely used NMs of this type is cadmium selenide, as it has useful properties for biochemical sensors, biomedical imaging, photovoltaic applications, light-emitting diodes (LEDs), laser, thin-film transistors, or solar cells [
3,
4]. Another feature of this chalcogenide is its ability to form different nanostructures from simple nanoparticles to quantum dots (QDs), nanowires, nanobelts, or nanotubes, with dissimilar properties [
4].
However, a clear negative consequence of this extensive use is the discharge into the environment of such noxious material. The toxicity of CdSe NMs results from the release of their harmful elements in an acidic environment. While cadmium is a well-known toxic element, which can induce oxidative stress, DNA damage, and apoptosis, excessive selenium can also induce toxicity [
5,
6,
7,
8,
9], especially for aquatic life [
10,
11,
12,
13]. Therefore, the increasing concentrations of these NMs in the environment demands for reliable and affordable approaches for their detection.
Among the most suitable analytical methods useful for detecting NMs in aqueous samples, fluorescence-based sensing stands out. These methods involve simple solution assay processing, low cost, fast response, and high sensitivity, as well as high selectivity through molecular binding design. In this sense, some optical sensors have been developed for the detection of Ag NPs [
14,
15,
16], but investigation of fluorescent sensors to detect CdSe NMs remains virtually unexplored [
17].
Recently, we explored the chelating potential of two
N-tosyl imines for CuO NPs sensing at neutral pH [
18,
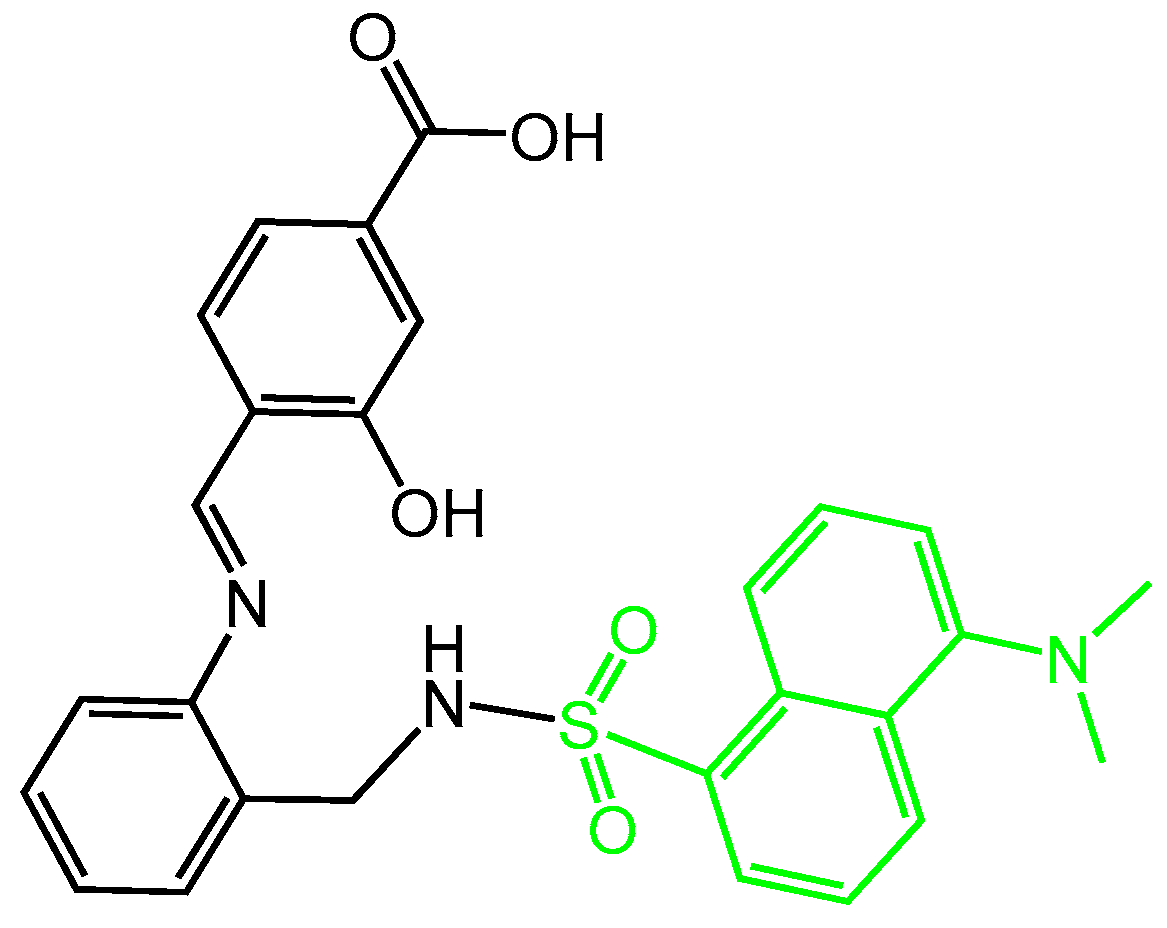
19]. Here, we investigate the dansyl-based fluorescent probe H
3L (
Scheme 1), which was easily synthesized by us [
20], with the aim of detecting CdSe NMs in aqueous solution with short response time and sensing at basic pH.
H3L displays an N,N,O donor set suitable to bind the Cd2+ ions present on the NM surface. In addition, both carboxylate and sulfonamide groups can contribute to the stabilization of the systems by interaction with the superficial ions of the NMs.
Herein, we are interested in studying the changes in the fluorescence emission spectra of H3L upon increasing addition of CdSe NPs and CdSe-Cys QDs. Interference of some common NMs, as well as of metal ions, in the determination of CdSe NMs in ethanol/water samples was studied. Binding constants were also determined since these constants characterize the affinity of H3L for NMs. Furthermore, interactions of H3L with CdSe NPs and CdSe-Cys QDs were experimentally and theoretically (DFT calculations) investigated.
2. Materials and Methods
All starting materials and reagents, except H
3L and CdSe-Cys QDs, were commercially available and were used without further purification. The synthesis and characterization of H
3L were previously reported [
20]. Fluorescence emission studies were performed on a Shimadzu RF-600 Spectro Fluorophotometer. Diffuse reflectance spectra were measured on a PerkinElmer LAMBDA 1050+ UV/Vis/NIR spectrophotometer equipped with an integrating sphere. Scanning electron microscopy (SEM) was applied to investigate the size and morphology, which was carried out under a ZEISS FESEM ULTRA, along with energy-dispersive X-ray (EDX) microanalysis. X-ray fluorescence was measured under vacuum (19.6 mbar) using a M4 TORNADO system (BRUKER), with an Rh tube, operating at 50 kV and 200 µA. The fluorescence maps were collected for a total time of 2 ms per pixel, with a pixel size of 20 µm.
1H-NMR spectra (400 MHz) were measured in deuterated solvents using a Varian Inova 400 Spectrometer.
J values are given in hertz. The infrared spectra were measured in the range 4000 to 400 cm
−1 wavenumber, using a Fourier-transform infrared (FTIR) spectrometer PerkinElmer Spectrum Two coupled with platinum diamond ATR, which consists of a diamond disc as an internal reflection element.
2.1. Sample Preparation
Samples for investigations on the interaction of H3L with CdSe NMs were obtained by stirring an ethanol solution of H3L at pH = 9 and a suspension of NMs in 2:1 molar ratio, at room temperature, for ca. 15 min. The sample was subsequently air-dried.
2.2. Computational Methods
Theoretical calculations on ligand–NMs models were performed employing density functional theory (DFT) methods, as implemented in Gaussian 09 [
21]. Thus, M062X/6-31G* geometrical optimization of different starting structures of H
3L was performed. For H
3L, we tested that the M062X/6-31G* level provided results of comparable quality to those obtained with a more extended basis set as 6-311++G** (not included for brevity), but with a lower computational cost.
Models of various sizes have been used to evaluate the interaction of the ligand with CdSe NPs. The geometry for the smallest model, comprising one H3L unit and a single CdSe unit, was optimized without restrictions. In the remaining cases, the geometries of the ligand over the surface were freely optimized, keeping a frozen structure for the metal selenide obtained from crystallographic data deposited with the Cambridge Structural Database (CSD).
Interaction energies, E
int, for these systems were evaluated as E
int = E
complex − (E
H3L + E
CdSe model), where E
complex is the total energy of the ligand–NM interaction; E
H3L is the total energy of the monoanionic or dianionic form of the H
3L ligand, and E
CdSe model is the energy of the different CdSe models indicated above. These interaction energies were evaluated by means of the natural energy decomposition analysis (NEDA) method included in the NBO7.0 program [
22], such that the basis set superposition error was corrected by means of the counterpoise method.
2.3. Synthesis and Characterization of CdSe-Cys QDs
CdSe-Cys QDs were synthesized and characterized according to a method previously reported [
23,
24], which was slightly modified by us.
Firstly, 0.4 mmol (31.6 mg) of selenium and 1 mmol (38.6 mg) of sodium borohydride were dissolved in 10 mL of deionized water in a three-neck round-bottom flask, under argon atmosphere and constant stirring. The reduction of the selenium was kept in an ice bath for 2 h. In a second reaction flask, 0.4 mmol (123 mg) of cadmium nitrate tetrahydrate and 2 mmol (358 mg) of L-cysteine hydrochloride monohydrate were dissolved in 80 mL of deionized water. The pH of this solution was adjusted to 10 with a sodium hydroxide solution of 0.1 M. After this, the first solution was added to this second reaction flask, and the color of the resulting solution instantaneously changed from colorless to yellow. This solution was stirred and heated up to 100 °C. Monitoring of the QD size was performed every 10 min by both fluorescence emission [
23] and UV/Vis absorption [
25] spectrometry. After 1 h, the solution was red (λ
abs = 451 nm and λ
em = 650 nm, size of about 2.0 nm), and the reaction flask was subsequently kept in an ice bath to stop the reaction. Evaporation of the solution under reduced pressure led to one-fifth of its volume. Then, small portions of acetone were added to the solution, until it became cloudy, resulting in the precipitation of the CdSe-Cys QDs. The resulting supernatant was separated by centrifugation. Small portions of acetone were added again to this supernatant. This procedure was repeated three times. The precipitated QDs were dried at 40 °C, in an oven. Spectroscopy and microscopy characterizations are shown in
Figures S1–S4.
Yield = 0.07 g. 1H-NMR (400 MHz, D2O, δ in ppm): 3.66 (t, 1H), 3.17 (dd, 1H), 2.96 (dd, 1H). ATR-IR (ν in cm−1): ν(HNH) 3222, νas(COO−) 1557, νs(COO−) 1393, ν(CO) 1302. UV/Vis (water, λ in nm): 451. Fluorescence λ/nm: λem = 632 (λex = 400, bandwidth of 15 nm).
2.4. Immobilization of H3L onto Amine-Modified Cellulose Paper
For the immobilization of H
3L on cellulose paper (Whatman
® qualitative filter paper, grade 2), we followed a previously reported method [
26], which was slightly modified by us. Cellulose filter paper with a diameter of 55 mm was soaked in an ethanolic 3-aminopropyl)trimethoxysilane solution (1 wt.%) for 1 h, at room temperature. The amine-modified cellulose paper was washed with copious ethanol, and dried under vacuum at 40 °C.
N-Hydroxysuccinimide (NHS) and
N-(3-dimethylaminopropyl)-
N’-ethylcarbodiimide hydrochloride (EDCHCl) were added in equimolar ratio (0.1 mmol) to a dimethylformamide solution (20 mL) of H
3L (0.1 mmol) to activate it. After stirring at room temperature for 3 h, triethylamine (0.3 mmol) was added to the reaction mixture, and the amine-modified cellulose paper was soaked in it overnight. Then, the immobilized H
3L onto amine-modified cellulose paper was washed with water and copious ethanol, and then dried under vacuum at 40 °C.
3. Results and Discussion
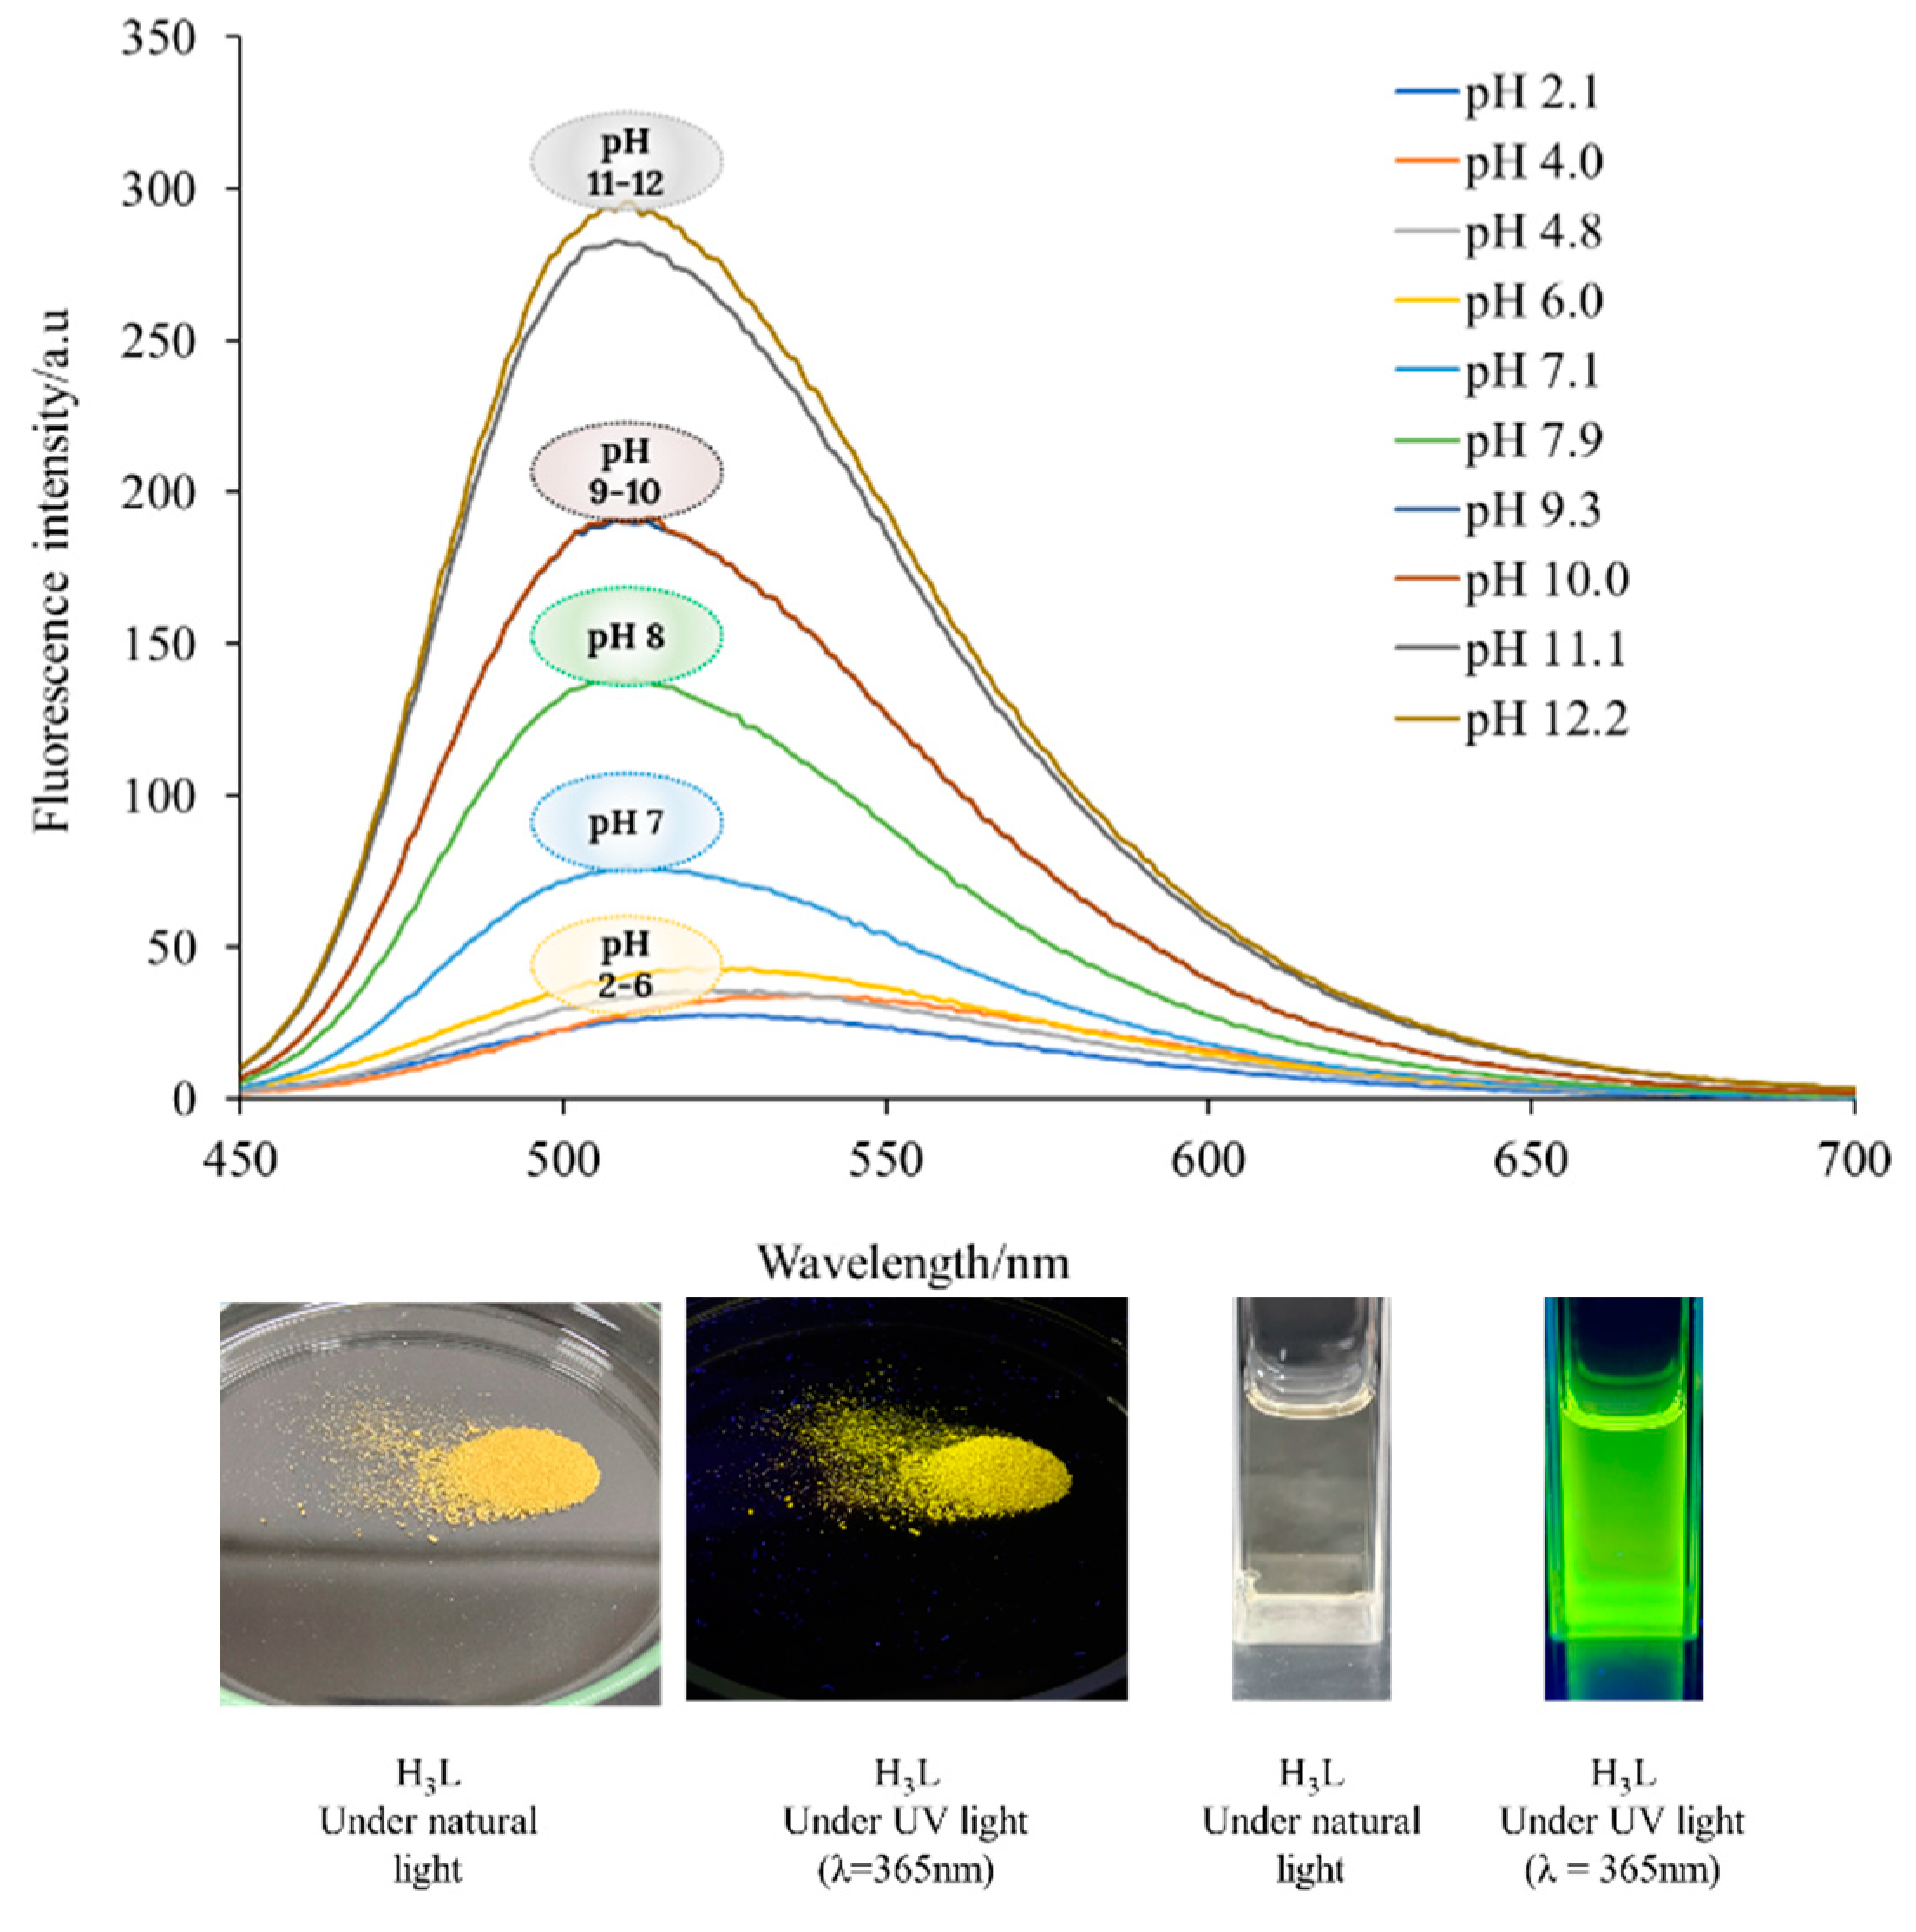
H
3L, in powder form, emits a yellow fluorescence under a UV light source at 365 nm (
Figure 1, left bottom). An ethanol solution of H
3L at neutral pH emitted a maximal green fluorescence at about 510 nm, when it was exposed to visible light with a wavelength of 400 nm (
Figure 1, at the bottom right). The use of polar solvents affords better emission and justified the use of ethanol to yield high green emission intensities, with Stokes shifts of about 110 nm. The study of the influence of pH on the fluorescence spectrum of H
3L (
Figure 1, top) showed an increase in fluorescence intensity with increasing pH, which is consistent with the deprotonation of H
3L. Monodeprotonation of H
3L is expected at pH values below 7, since the pKa value of the carboxylic group is around 4. Deprotonation of the phenol and sulfonamide groups requires higher pH values, since the pKa of these groups is around 9. Moreover, pH values of about 6 (and lower ones) result in the protonation of the dimethylamino group, which is accompanied by a redshifted of λ
em to a wavelength of 520 nm (bathochromic shift). This can be due to the increase in the electron-withdrawing power of the sulfonyl group upon protonation of the amine nitrogen atom.
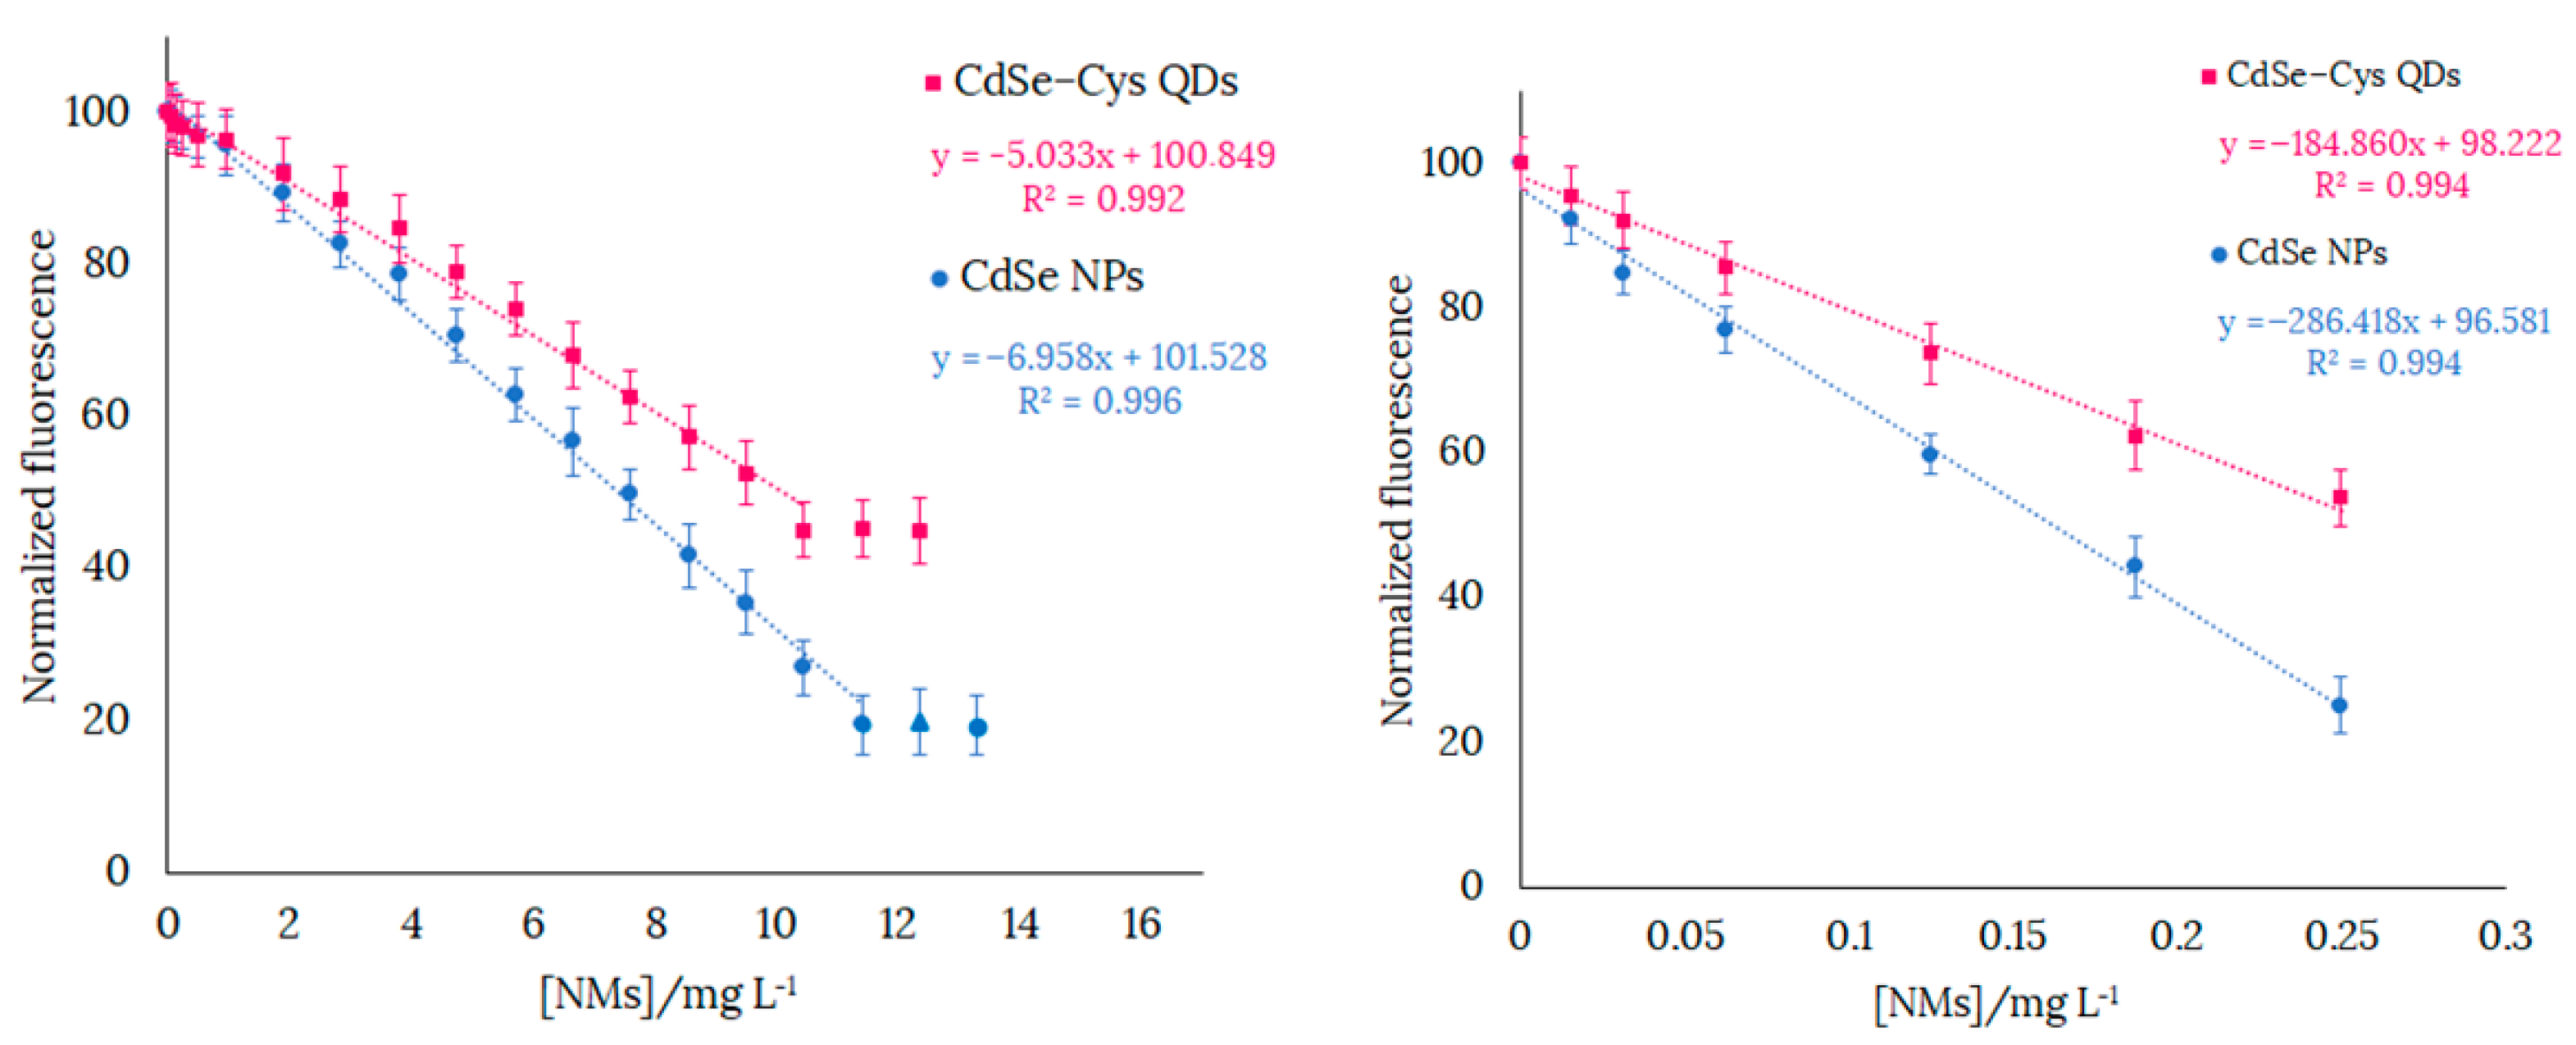
3.1. Fluorescence Emission Studies on H3L Solution upon Addition of CdSe NMs
The fluorescence intensity of an ethanol/water (80:20) solution of H
3L varied linearly with the concentrations of nonfluorescent CdSe NPs, as well as with weakly fluorescent CdSe-Cys QDs (λ
em = 632 nm), as shown in
Figure S2 of the ESI.
In order to check the usefulness of H
3L as a chemosensor for the detection of CdSe nanomaterials at concentration ranges of ppm and ppb, we selected concentrations of H
3L of 126 ppb and 1.26 ppb. With [H
3L] = 126 ppb, fluorescent emission varied linearly in the range 0–11.5 ppm of CdSe NPs and 0–10.5 ppm of CdSe-Cys QDs. The decrease by over 80% and 55% in the fluorescence emission of ethanol/water solutions (in 80:20
v/
v) of H
3L (λ
em = 540 nm) upon addition of CdSe NPs (λ
em = 536 nm) and CdSe-Cys QDs (λ
em = 536 nm), respectively, are shown in
Figure 2.
The limit of detection (LOD) and limit of quantification (LOQ) of H
3L are expressed as LOD = 3SD/M and LOQ = 10SD/M, where SD is the standard deviation of the response, and M is the slope of the calibration curve [
27]. LODs of CdSe NPs and CdSe-Cys QDs with [H
3L] = 126 ppb were 460 and 630 ppb, respectively. LOQs of CdSe NPs and CdSe-Cys with [H
3L] = 126 ppb were 1.52 and 2.11 ppm, respectively. LODs of CdSe NPs and CdSe-Cys QDs with [H
3L] = 1.26 ppb were 40 and 62 ppb, respectively. LOQs of CdSe NPs and CdSe-Cys with [H
3L] = 1.26 ppb were 134 and 207 ppb, respectively. The working range of H
3L was obtained using the LOQ as the minimum value that can be measured, with the highest value of [NMs] at which linearity is still maintained as the maximum value. Therefore, the working ranges for detection of CdSe NPs and CdSe-Cys with [H
3L] = 126 ppb were 1.5–11.5 and 2.1–10.5 ppm, respectively.
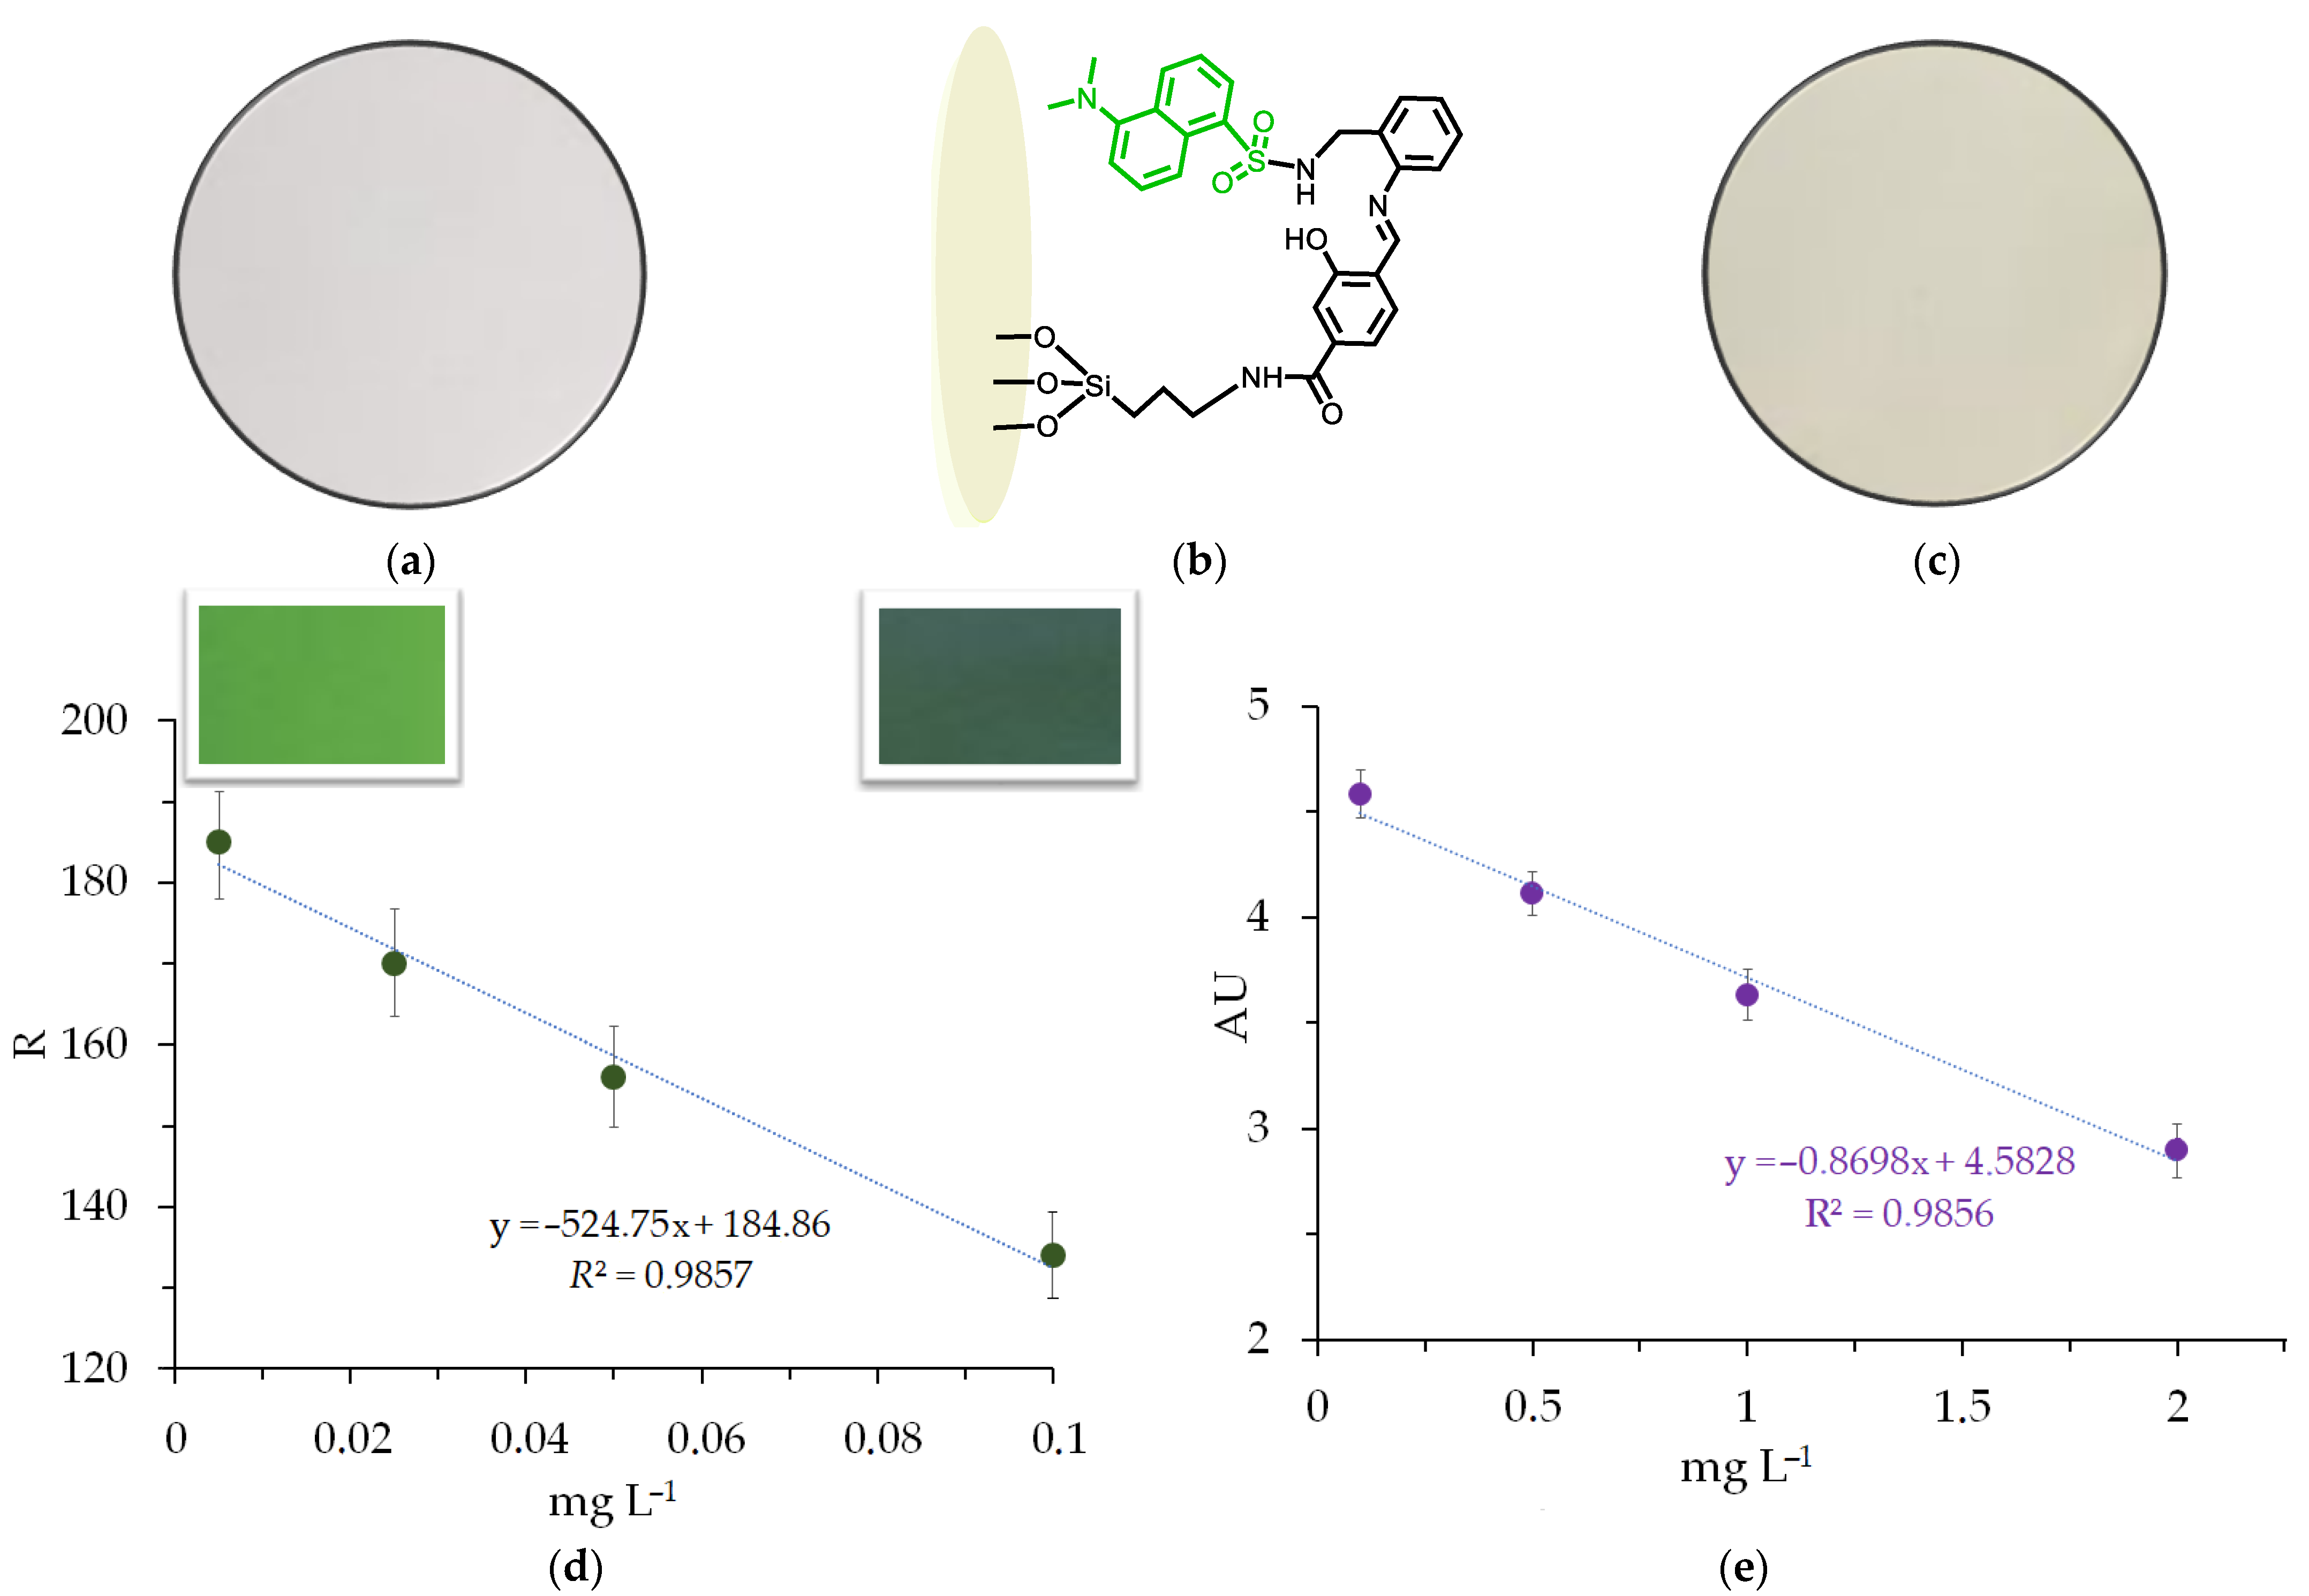
3.2. Fluorescent Paper Detection of H3L toward CdSe-Cys QDs
To facilitate detection of CdSe-Cys QDs, without the need to use a spectrofluorometer, we immobilized H
3L onto cellulose paper. The immobilization results in a slight color change of the paper, from white to pale yellow, which is visible with the naked eye. The ligand-modified cellulose paper upon soaking in CdSe-Cys QDs water solutions for 15 min exhibited a continuous color change from light green to bluish green under 365 nm ultraviolet light, when the CdSe-Cys QDs concentration increased from 5 to 100 ppb (
Figure 3).
Since slight color changes cannot be easily observed with the naked eye, we digitized the color information (RGB value) of photographs corresponding to the paper under UV exciting radiation for analysis through the color recognizer application of a smartphone [
28,
29]. A series of photos were taken for three replicates of each assay with a smartphone under 365 nm ultraviolet light. The red–green–blue (RGB) values corresponding to these photos were obtained through the color recognizer application (RGB Color Detector) for further statistical analysis [
30,
31]. The RGB coordinates of five points on distinct parts of the paper for three replicas were obtained. Since the R coordinate shows sensitive response to CdSe-Cys QDs, the fluorescence intensity response, as an average of values for the measurements made, was recorded on the red channel. As
Figure 3 shows, there was a good linear relationship between the red coordinate and the CdSe-Cys QDs concentration (
R2 = 0.9857). The LOD and LOQ calculation results were 15 and 50 ppb, respectively.
We also explored the use of UV/Vis/NIR spectrophotometry to discern the color change of the ligand-modified cellulose paper with the increase in the concentration of CdSe-Cys QDs. The ligand-modified cellulose paper upon soaking in CdSe-Cys QDs water solutions for 2 h exhibited a continuous decrease in the absorbance of each band of the diffuse reflectance spectrum, which showed three dominant signals located around 420, 330, and 270 nm. As the decrease in the absorbance was clearest in the band at 270 nm, we used this wavelength to study the response of the ligand-modified cellulose paper to the CdSe-Cys QDs concentration.
Figure 3 (right) shows the linear decrease in the absorbance of the band at 270 mm, when the CdSe-Cys QDs concentration increased from 100 ppb to 2 ppm. The LOD and LOQ calculation results were 245 and 815 ppb, respectively.
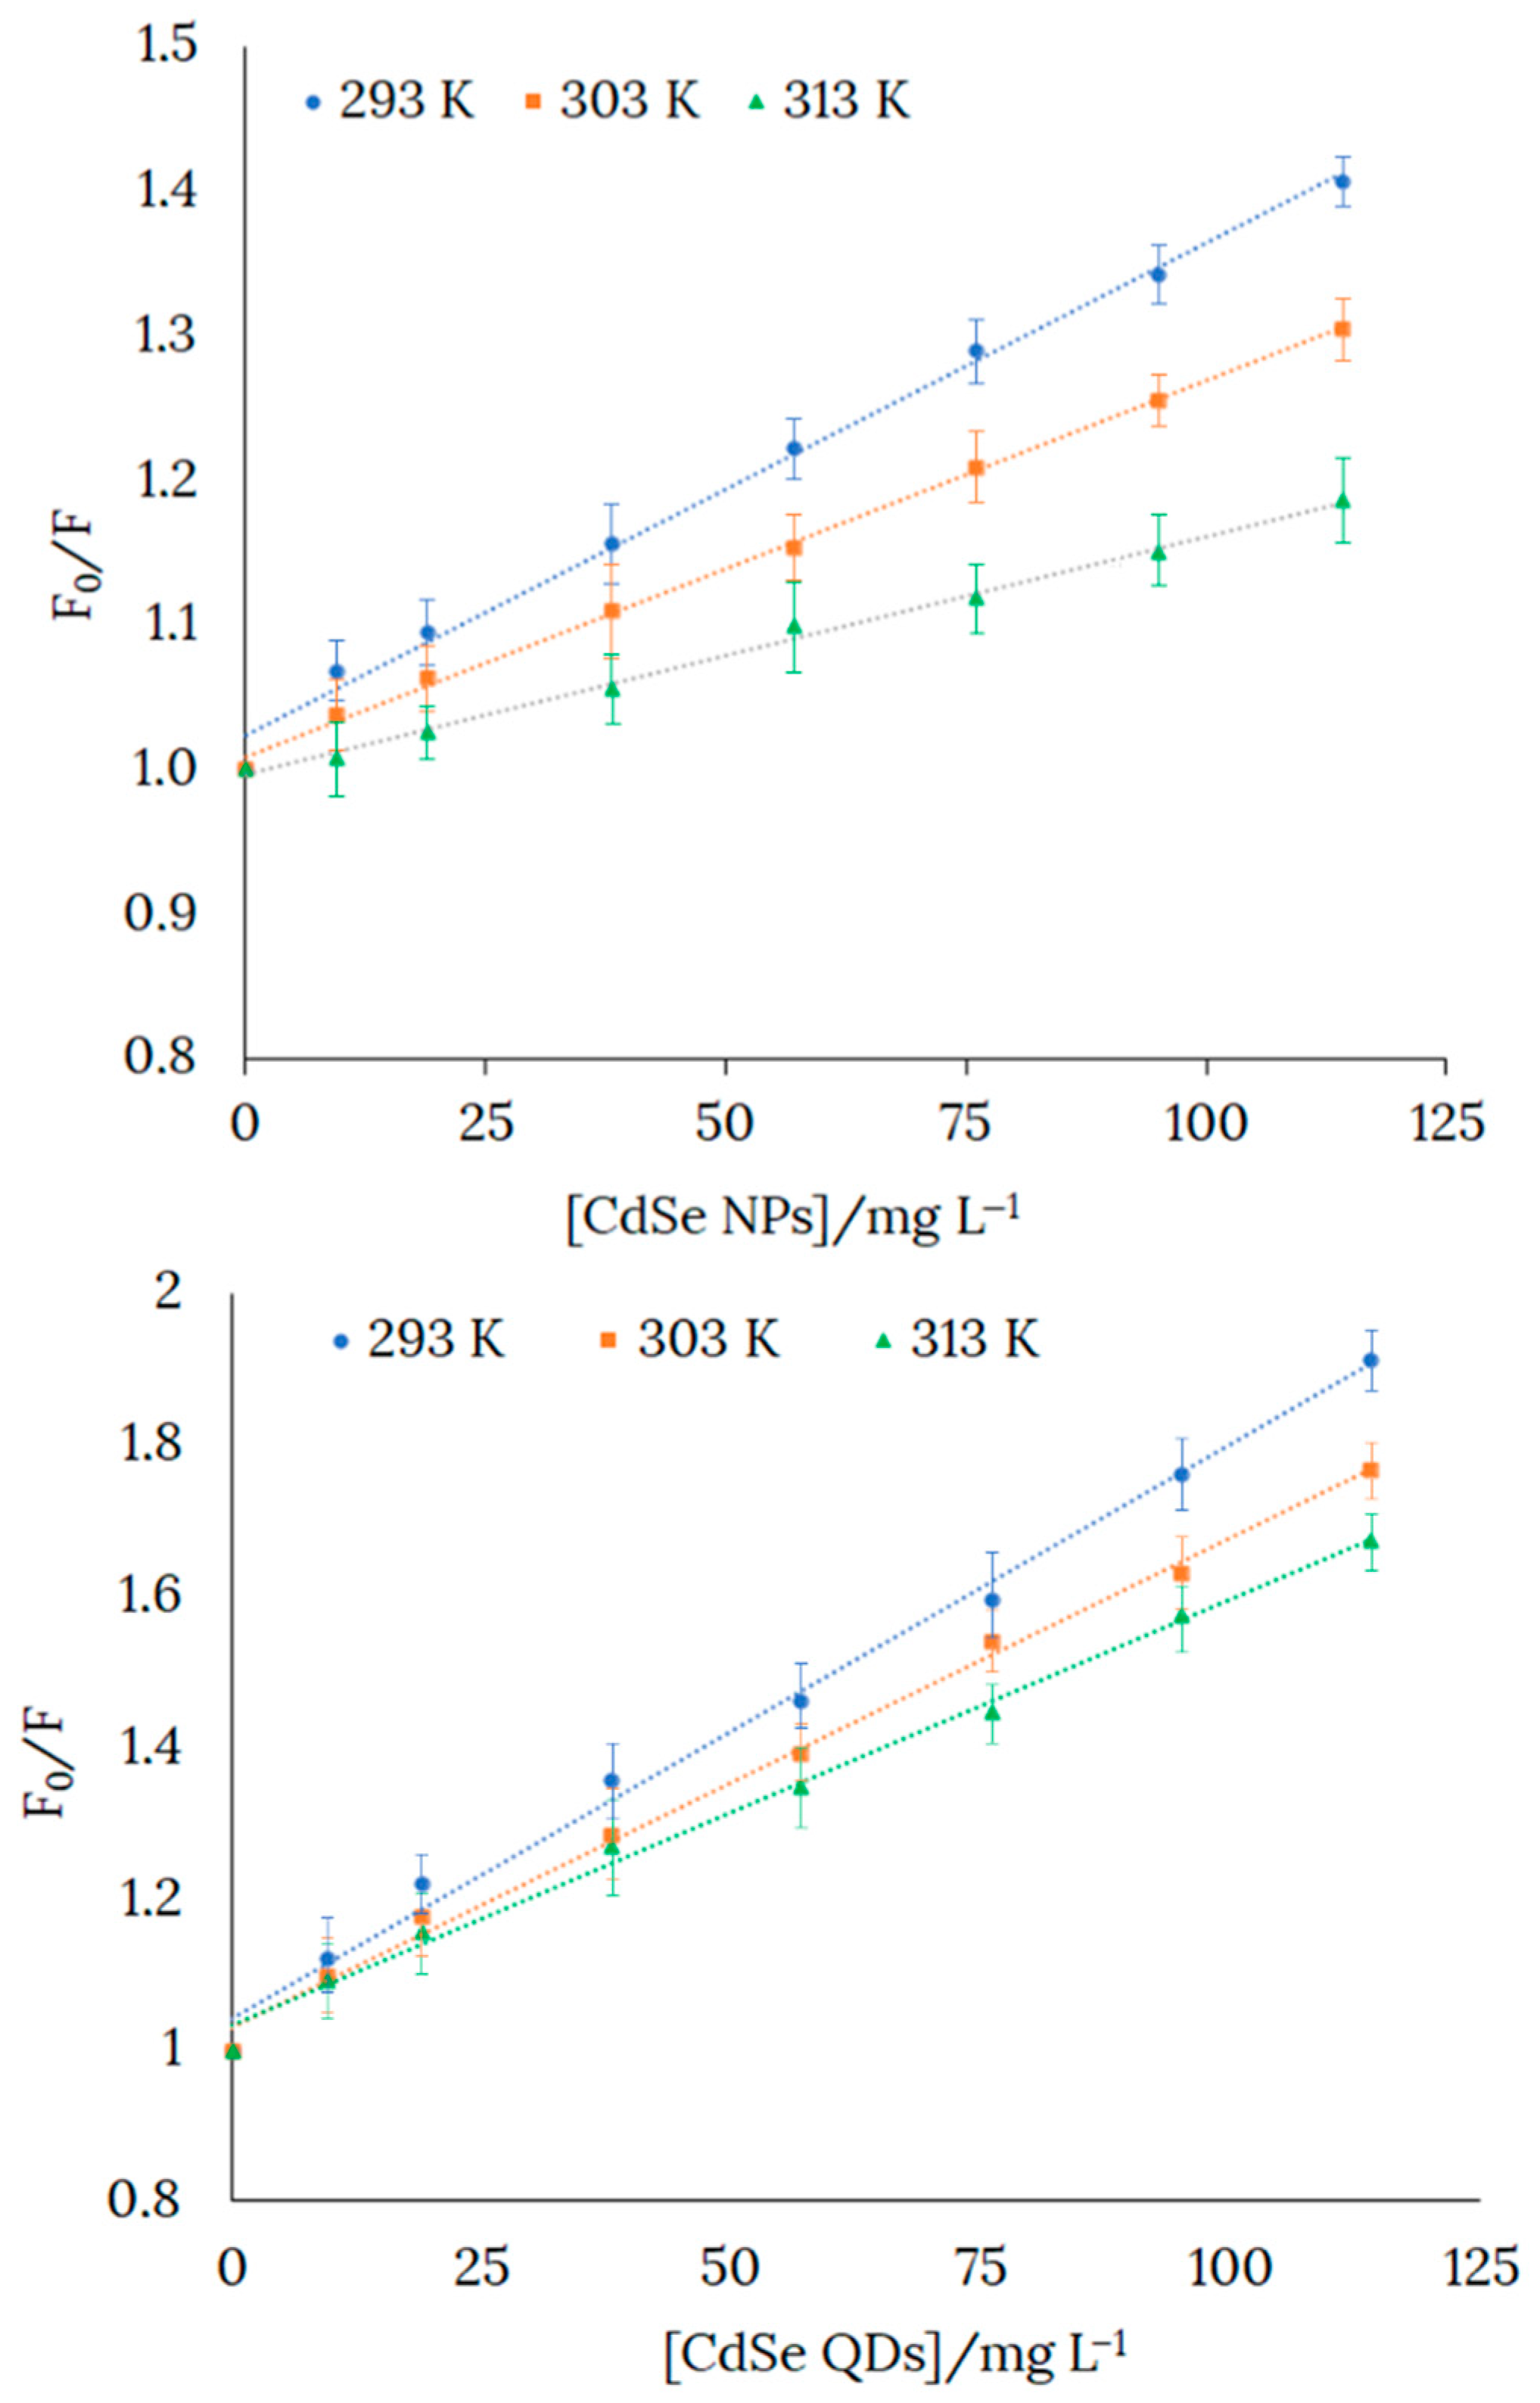
3.3. Affinity of H3L to CdSe NMs
Since the reaction of H
3L with both CdSe NPs and CdSe-Cys QDs resulted in a decrease in its fluorescence emission, we investigated the quenching mechanism using Stern–Volmer plots (
F0/
F = 1 +
KSV[NMs]).
Figure 4 shows that the value of the quenching constant (
KSV = slope) decreased with increasing temperature, which is a sign of static quenching [
32]. It must be noted that, for static quenching (τ
0/τ = 1), the
KSV value matched that of the binding constant (K
B) for the interaction under study. Thus, we found that the affinity of H
3L to the NMs studied at room temperature was as follows: CdSe NPs (K
B = 4.42 × 10
3 L·mg
−1) > CdSe-Cys QDs (K
B = 2.30 × 10
3 L·mg
−1). Values of Gibbs free energy (
Table 1), which were determined from K
B, indicate that CdSe-H
3L NPs (−20.46 kJ·mg
−1) were more stable than CdSe-Cys-H
3L QDs (−18.87 kJ·mg
−1).
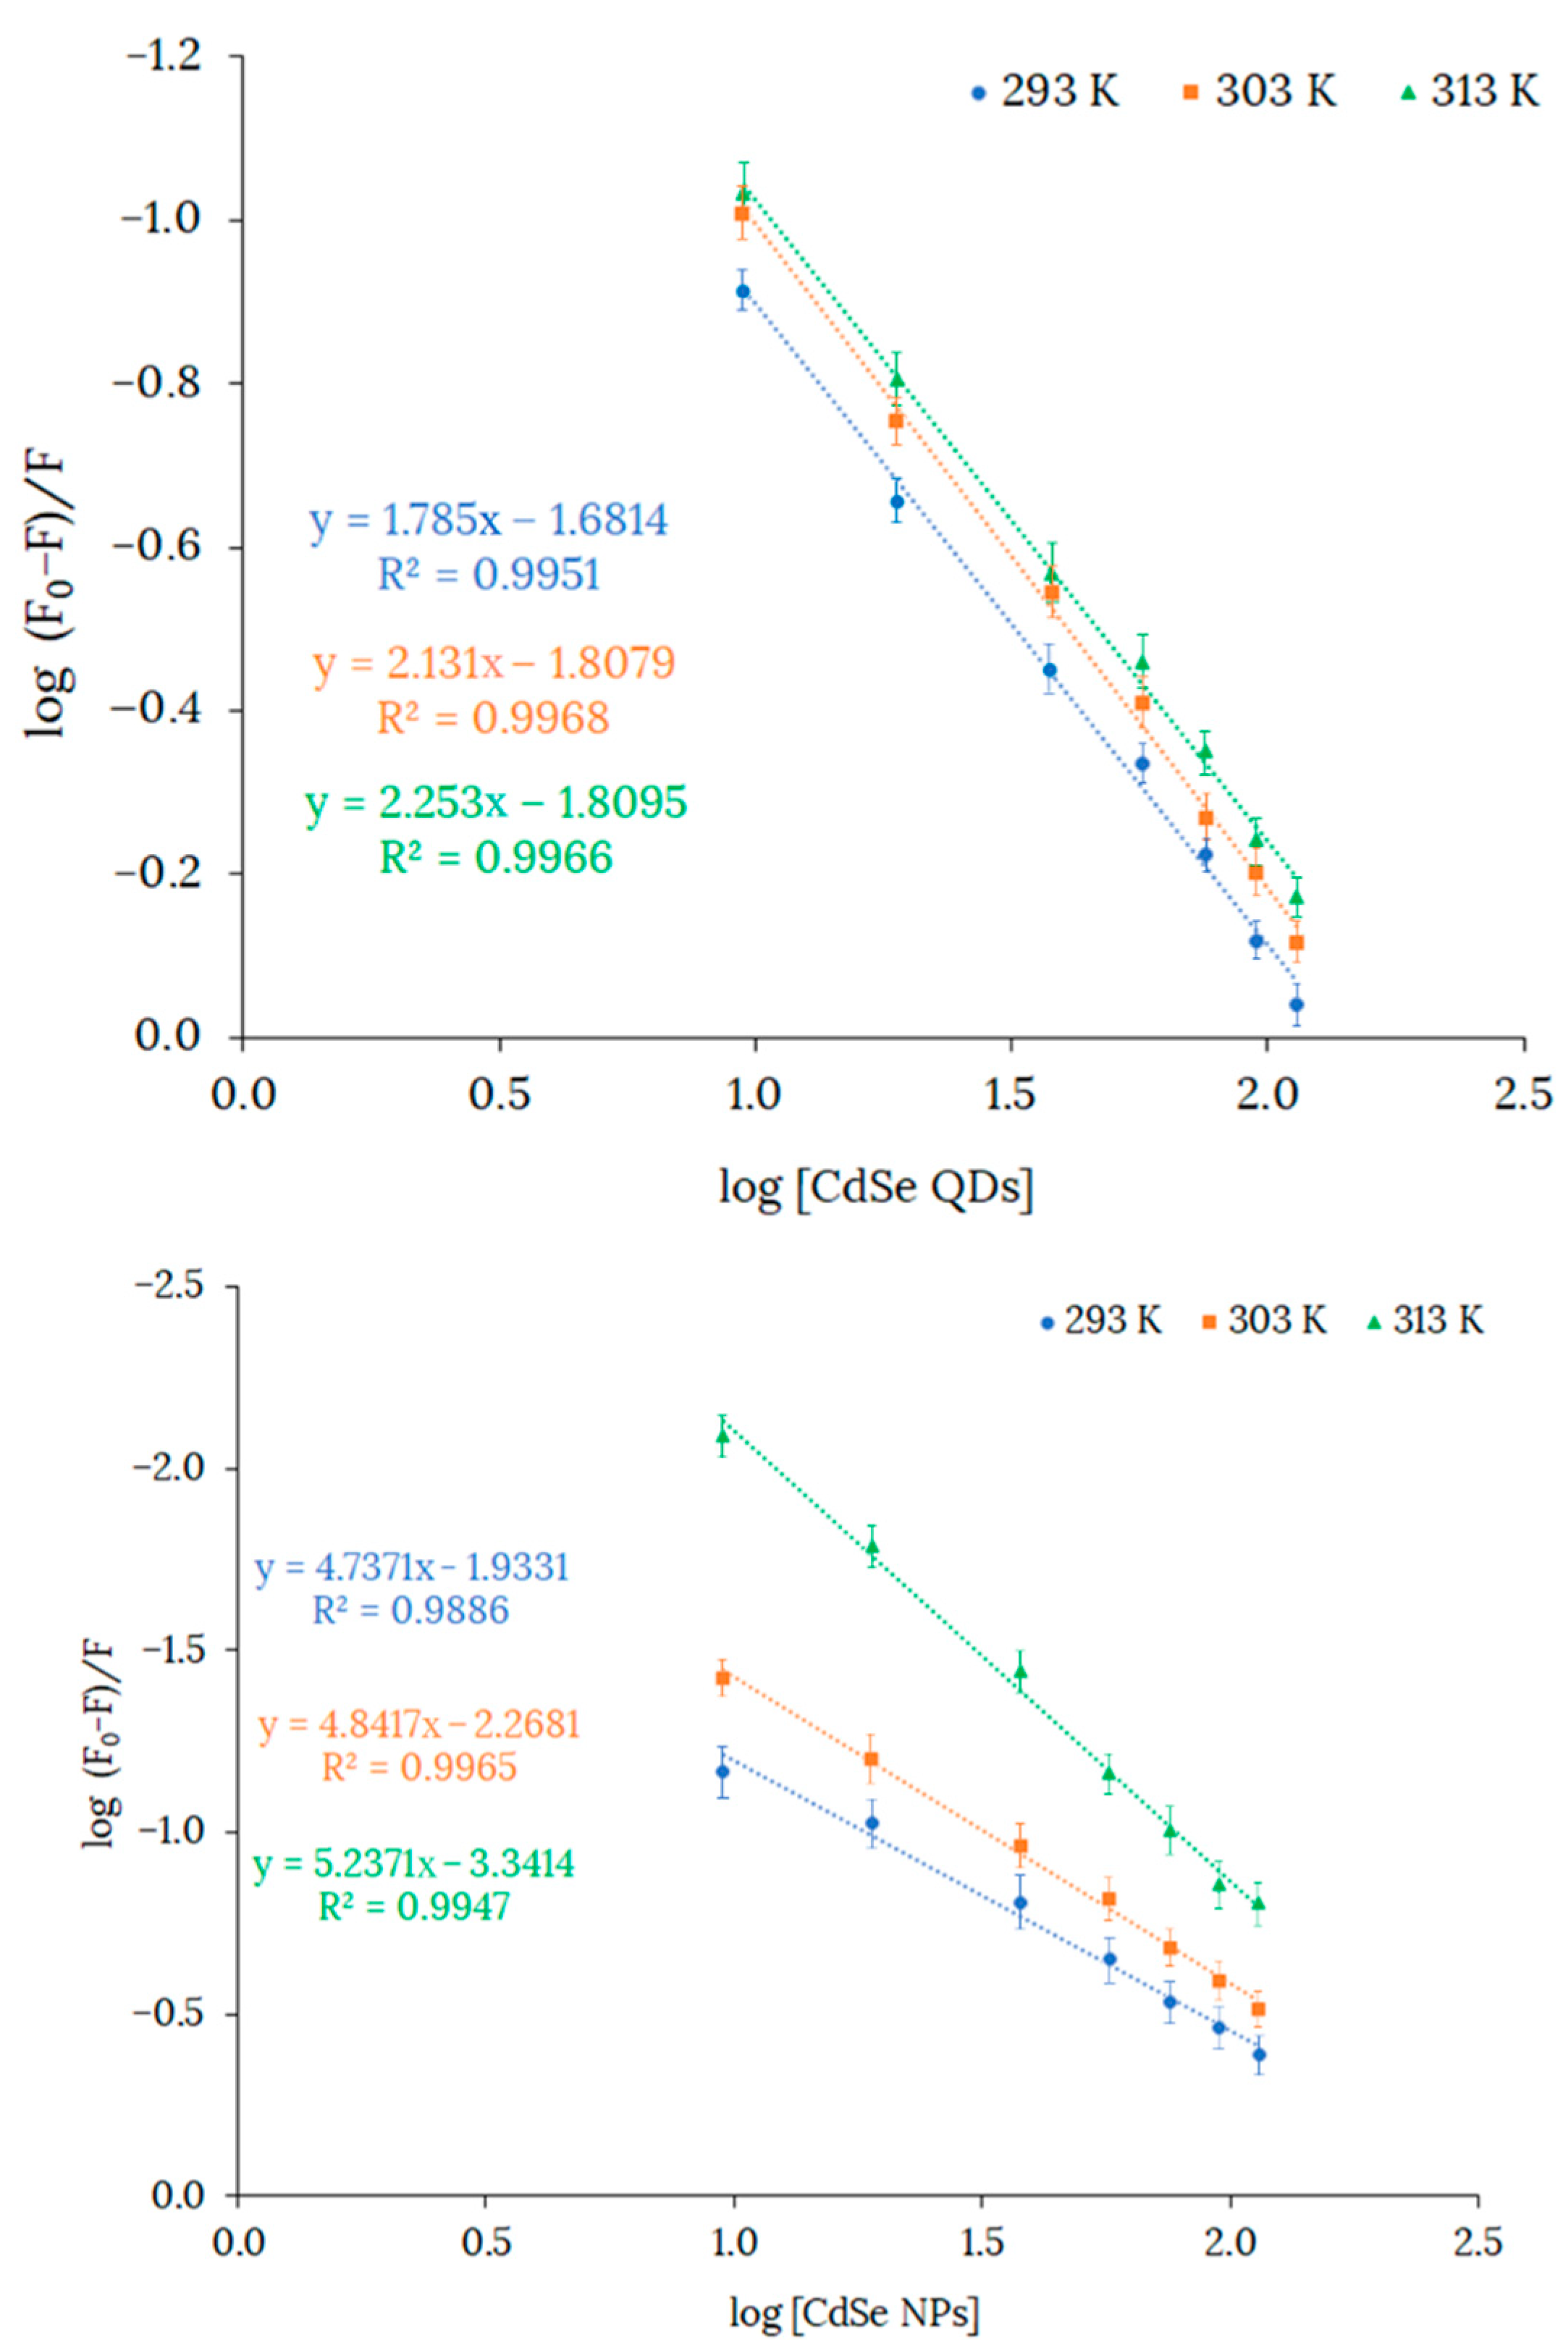
Considering the higher affinity of H
3L for CdSe NPs compared to CdSe-Cys QDs, we studied the number of binding sites for H
3L on the surfaces of both CdSe NPs and CdSe-Cys QDs. The number of interaction binding sites (
n) was determined using the Scatchard equation (Equation (1)), where
F0 and
F are the relative fluorescence of H
3L in the absence and presence of NMs, respectively,
KB is the binding constant, and [
Q] is the quencher concentration [
33]. The Scatchard equation linear graph of H
3L and NMs is shown in
Figure 5.
The number of binding sites (n) was around five at 293 K, suggesting five binding sites for H3L on the CdSe NP surface. However, the number of binding sites was about two for H3L on the CdSe-Cys QD surface. This is not surprising considering that many of the surface cadmium ions interact with cysteine through the sulfur atom. The interaction ratio slightly increased for all the interactions with rising temperature, probably because temperature favors the reactivity of surface metal ions.
3.4. Selectivity
In view of the higher affinity of H
3L to CdSe NPs, we studied the selectivity of H
3L as a probe for the cited NPs. As a criterion for interference, a ±10% variation of the average fluorescence intensity at the respective concentration of CdSe NPs was used. The selectivity of H
3L as a probe for CdSe NPs was tested in the presence of some common NMs such as Cu NPs, CuO NPs, ZnO NPs, and TiO
2 NPs, as well as some common metal ions in water, such as the following hard acids: Na
+, K
+, Mg
2+, Ca
2+, Fe
3+, and Al
3+ (
Figure 6).
Results of three replicas of each assay showed that H3L possessed selectivity toward CdSe NPs in the presence of Cu NPs, which could be tolerated in concentration of at least 8 ppm concentration, when the concentration of CdSe NPs was 8 ppm. Other common NMs such as CuO NPs, ZnO NPs, and TiO2 NPs could be tolerated in concentrations of at least 4 ppm without interference. Common metal ions in water such as Na+, K+, and Fe3+, in 8 ppm concentration, also did not interfere with the detection of CdSe NPs. Mg2+, Ca2+, and Al3+ ions could be tolerated in concentrations of at least 2 ppm without interference.
3.5. Investigations on the Interaction of H3L with CdSe NMs
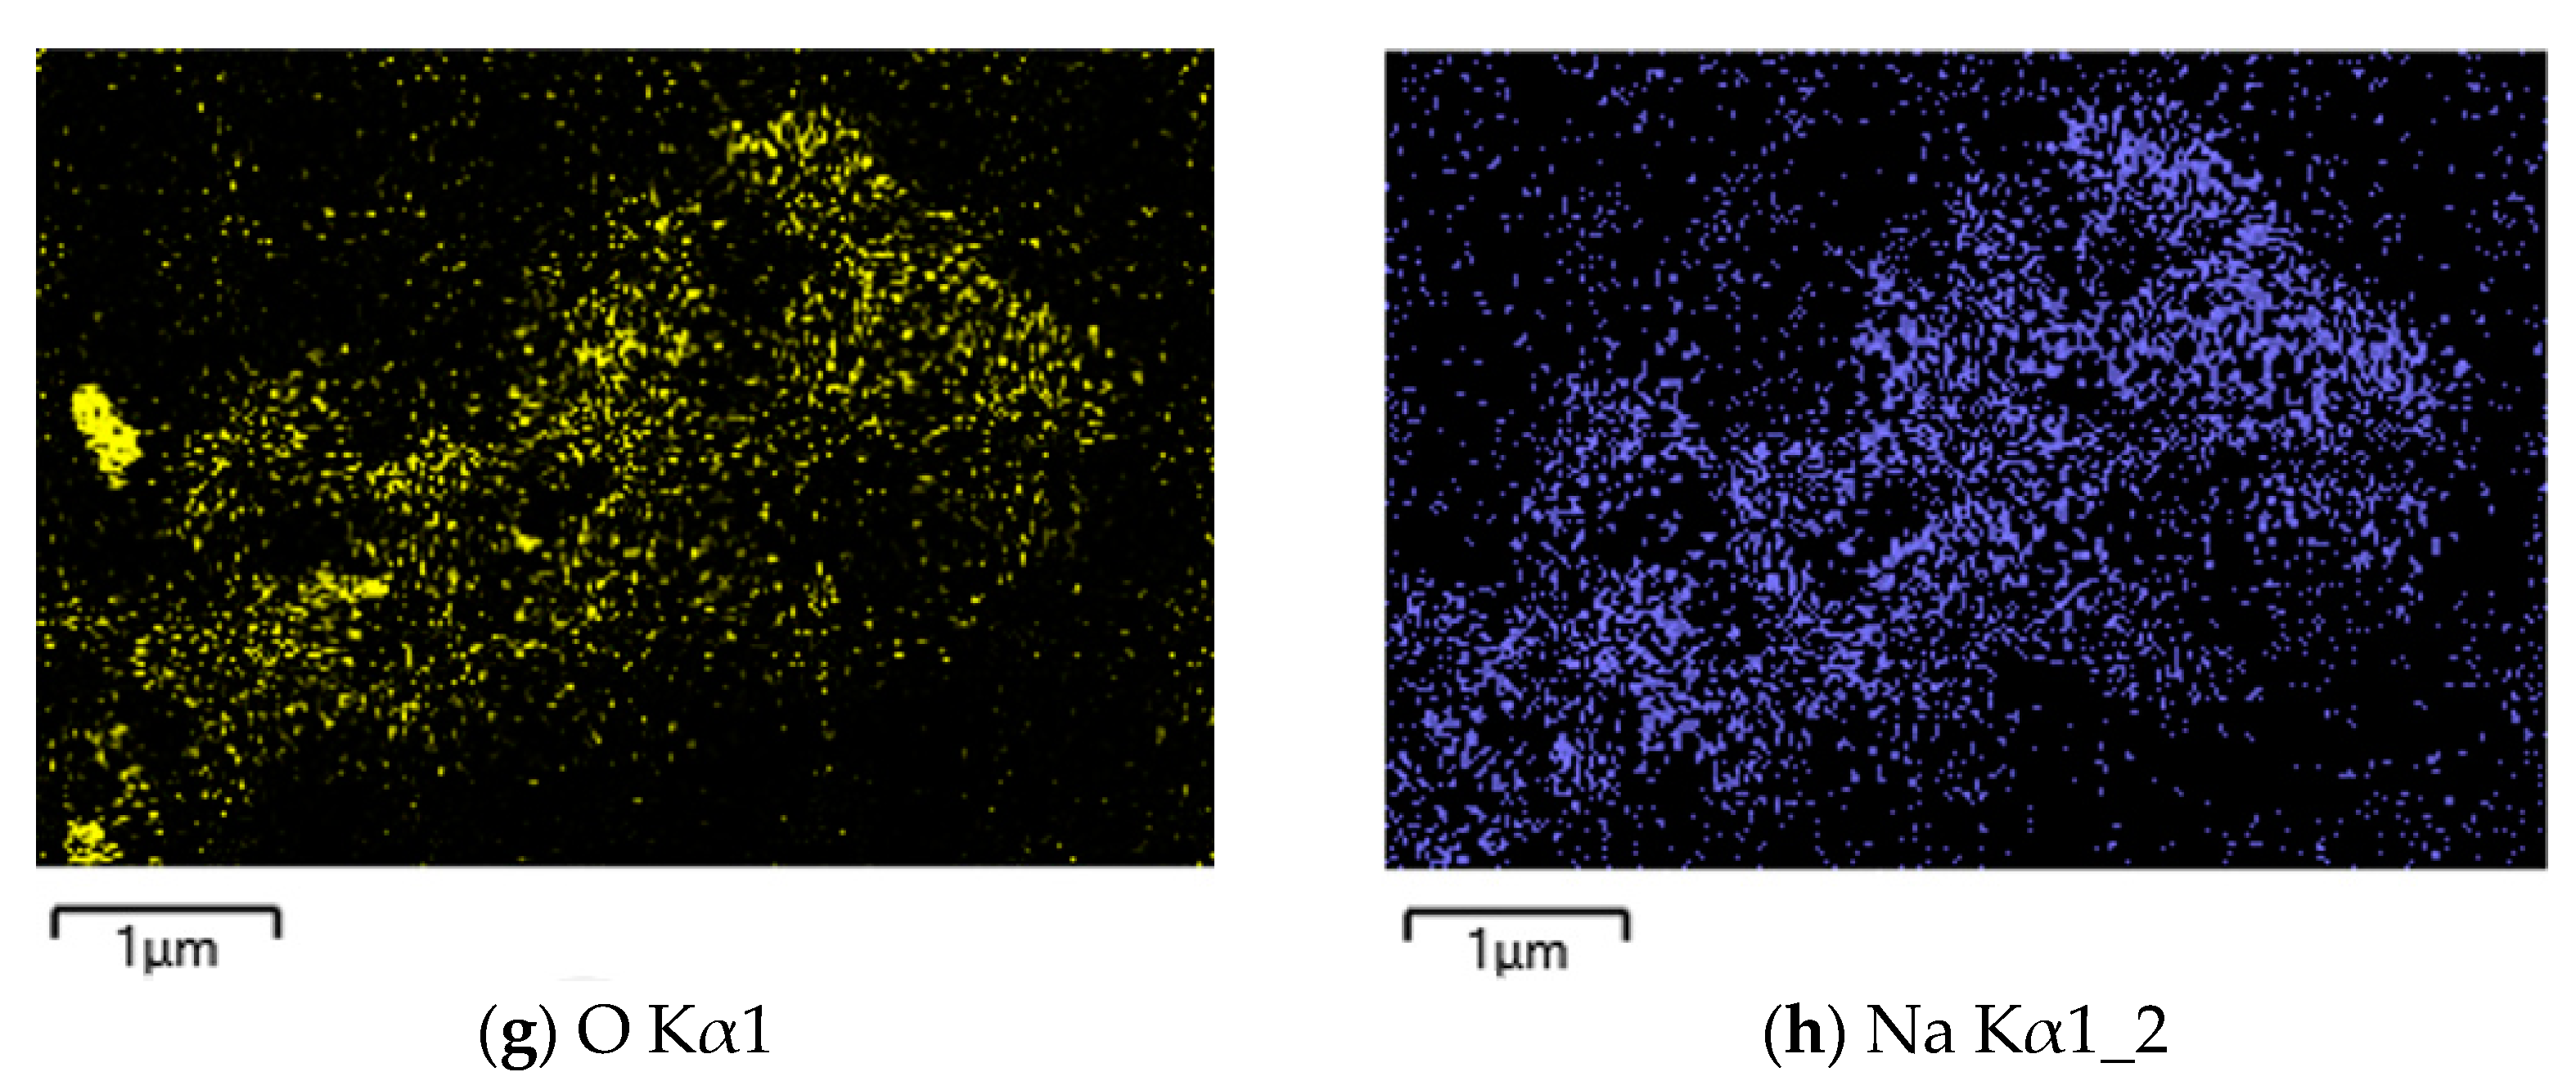
Scanning electron microscopy/energy-dispersive X-ray spectroscopy (SEM/EDX), micro-X-ray fluorescence (µ-XRF), nuclear magnetic resonance (1H-NMR), total reflection infrared spectroscopy (ATR-IR), and density functional theory (DFT) were used to investigate the reaction products of CdSe NPs and CdSe-Cys QDs with H3L.
3.5.1. Scanning Electron Microscopy/Energy-Dispersive X-ray Spectroscopy
The reaction products of CdSe NPs and CdSe-Cys QDs with H
3L were analyzed using SEM. As it can be seen in the SEM micrograph shown in
Figure 7a, the reaction product of CdSe NPs with H
3L agglomerated to form clusters. These were made up of irregular nanocrystals with a size below 100 nm.
A combination of SEM and EDX was used to generate a ‘map’ of element distributions in the raw sample. The EDX analysis showed the presence of Cd, Se, C, N, O, S, and Na elements with both uniform and similar spatial distribution patterns, supporting the existence of the interaction of H
3L (as carboxylate sodium salt) with CdSe NPs. Similarly, the EDX analysis of the reaction product of CdSe-Cys QDs with H
3L was in accordance with the formation of bonds between these species (
Figure S5).
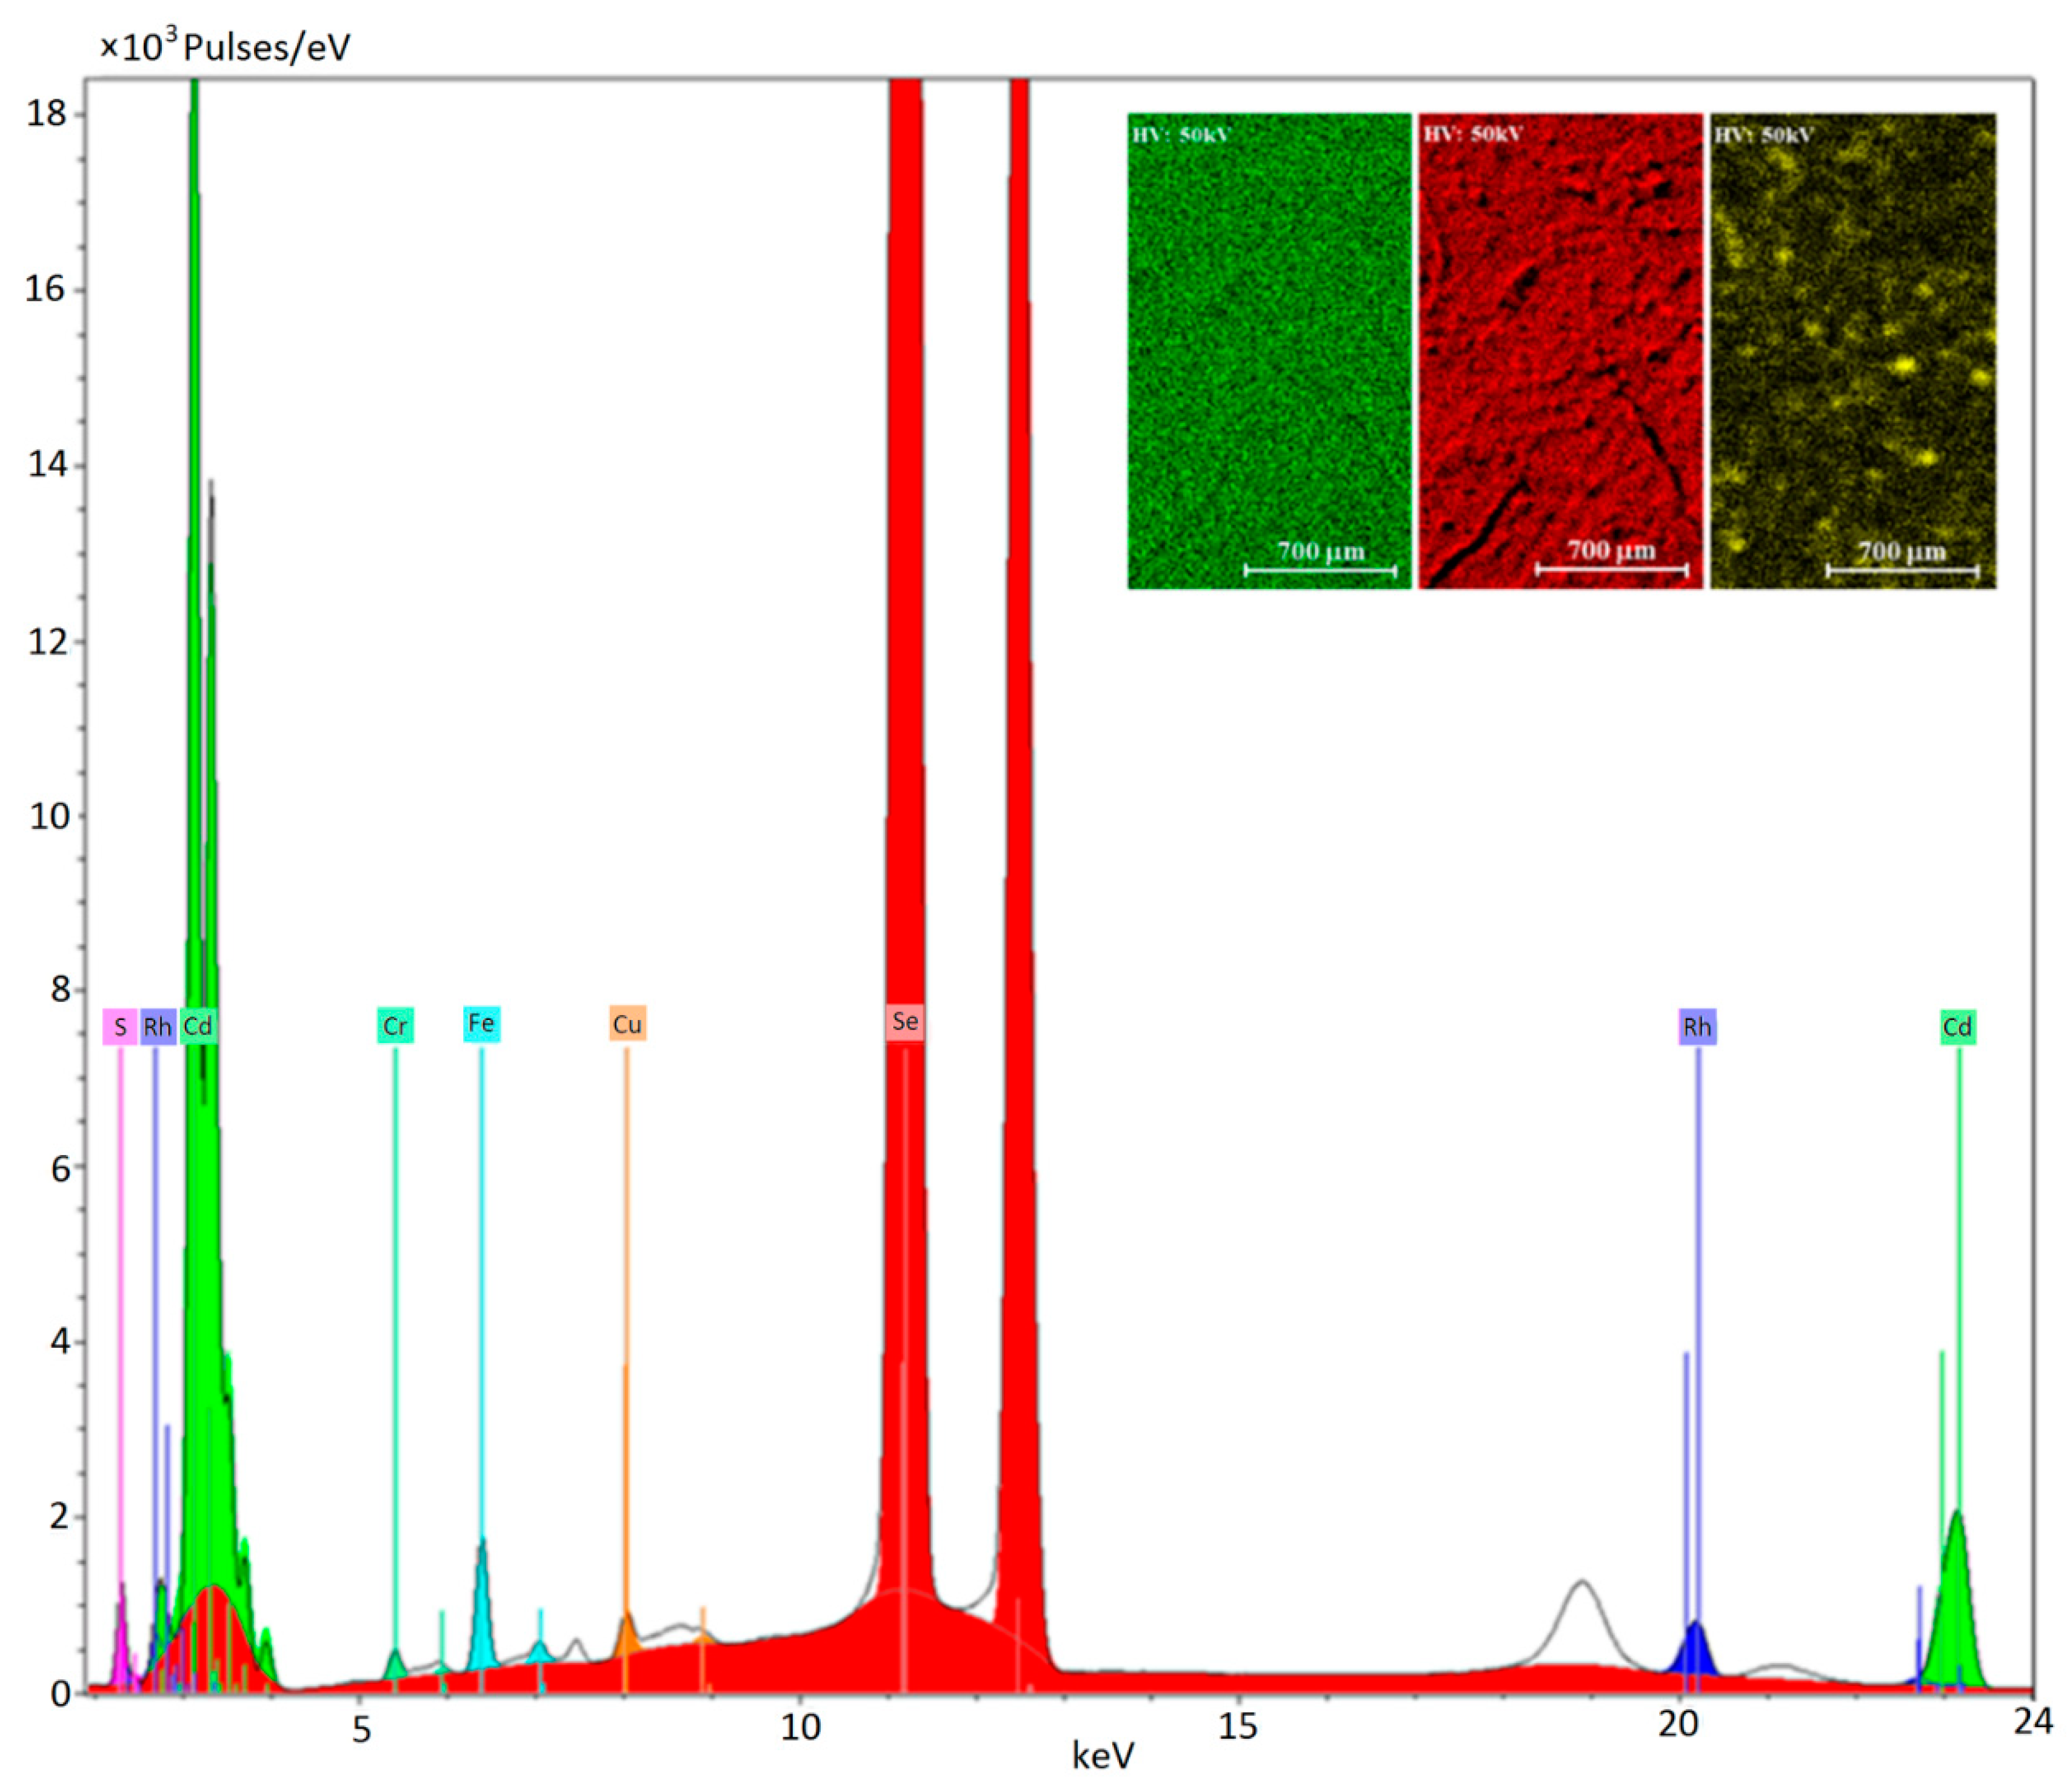
3.5.2. Micro-X-ray Fluorescence
Figure 8 shows the peaks corresponding to the characteristic X-ray fluorescence emission of the chemical elements in the reaction product of CdSe NPs with H
3L. The µ-XRF analysis indicates that the polycrystalline sample of the reaction product of CdSe NPs with H
3L (as carboxylate sodium salt) contained metal and sulfur in 53:1 ratio by weight, which was coherent with a 15:1 molar ratio (CdSe:H
3L) in the sample. µ-XRF mapping was used to probe the homogeneous distribution of cadmium and selenium within the sample, which supported the existence of bonding between CdSe NPs and H
3L.
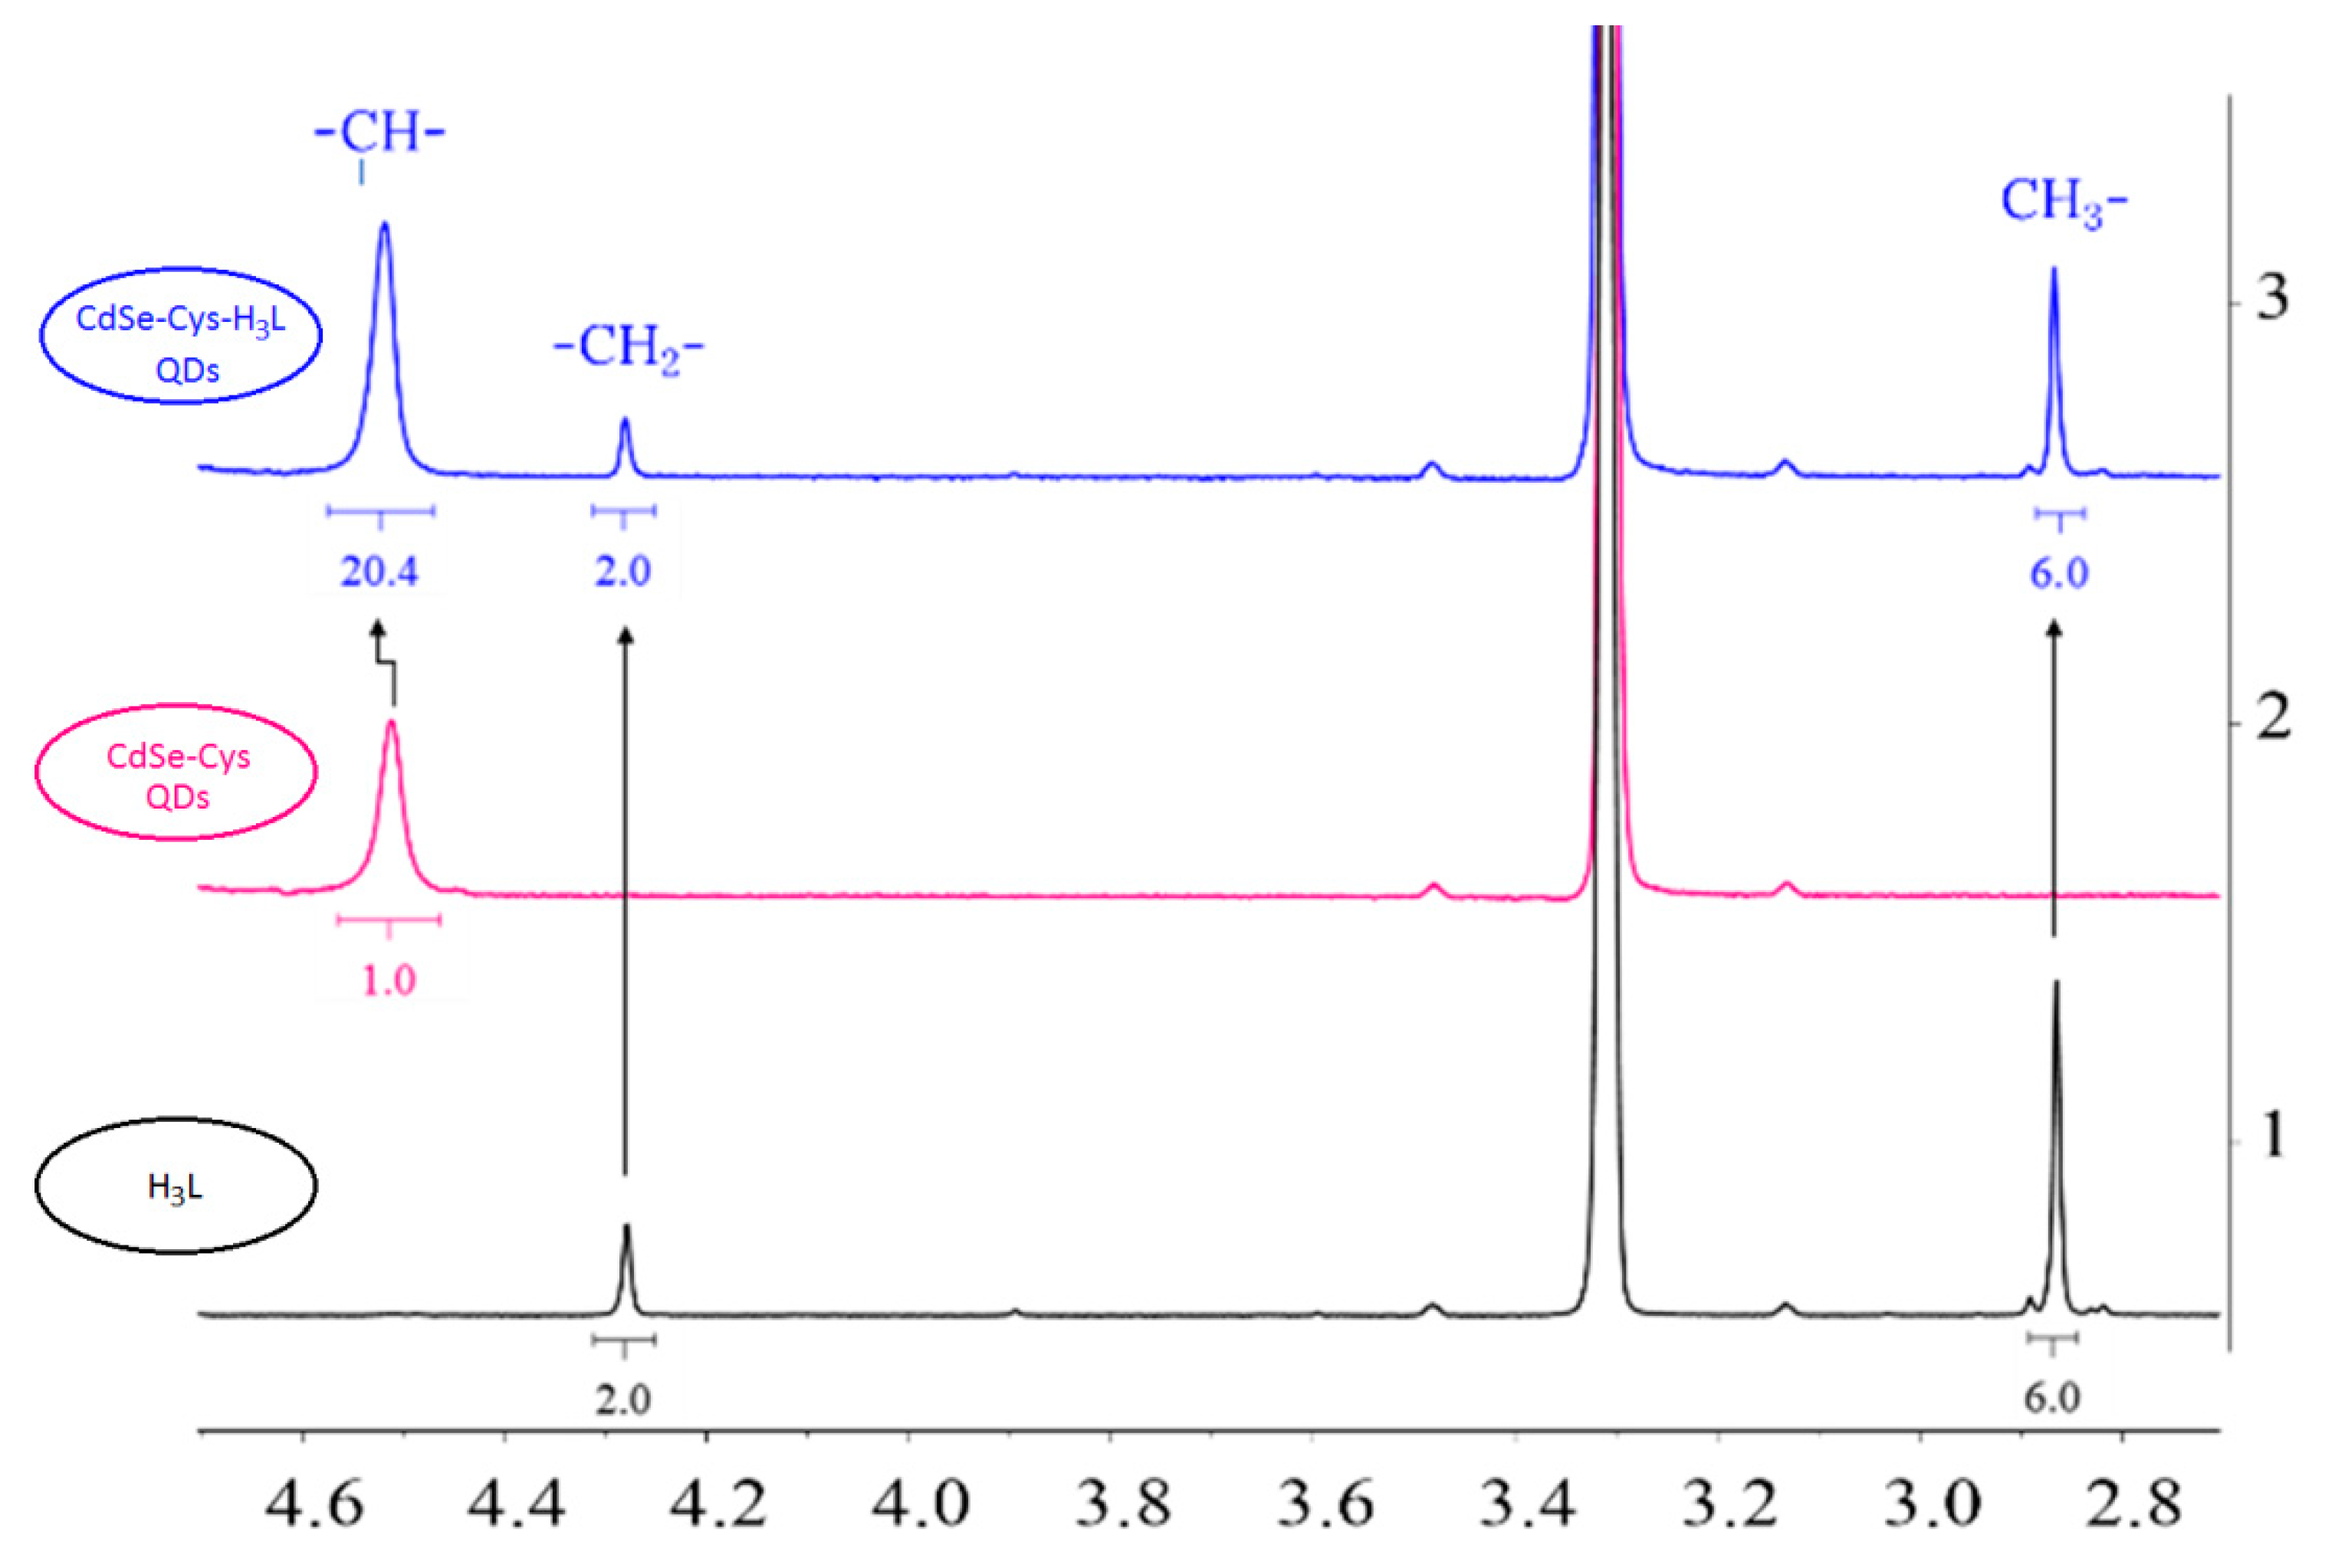
3.5.3. 1H Nuclear Magnetic Resonance
The
1H-NMR spectrum of the reaction product of CdSe-Cys QDs with H
3L showed the expected proton signals, in accordance with the observations in the spectra of CdSe-Cys QDs and H
3L, as free species (
Figure 9 and
Figure S6). The analysis of the region between 2.8 and 4.6 ppm clearly showed the characteristic signals of methyl and methylene protons of H
3L at 2.87 and 4.28 ppm, respectively, whereas the methanetriyl proton of L-Cys was observed at 4.52 ppm.
The interaction between CdSe-Cys QDs and H3L did not result in significant shifts of their signals. The only noteworthy shift corresponded to the methanetriyl proton, which was shifted 0.05 ppm toward the low field. The overlapping of the methylene signal of L-Cys with the methyl proton of the deuterated solvent (methanol-d4) prevented its observation at 3.31 ppm. On the basis of the corresponding integration values, it was possible to deduce that the cysteine:H3L molar ratio was about 20:1 on the QD surface.
3.5.4. Attenuated Total Reflection Infrared Spectroscopy
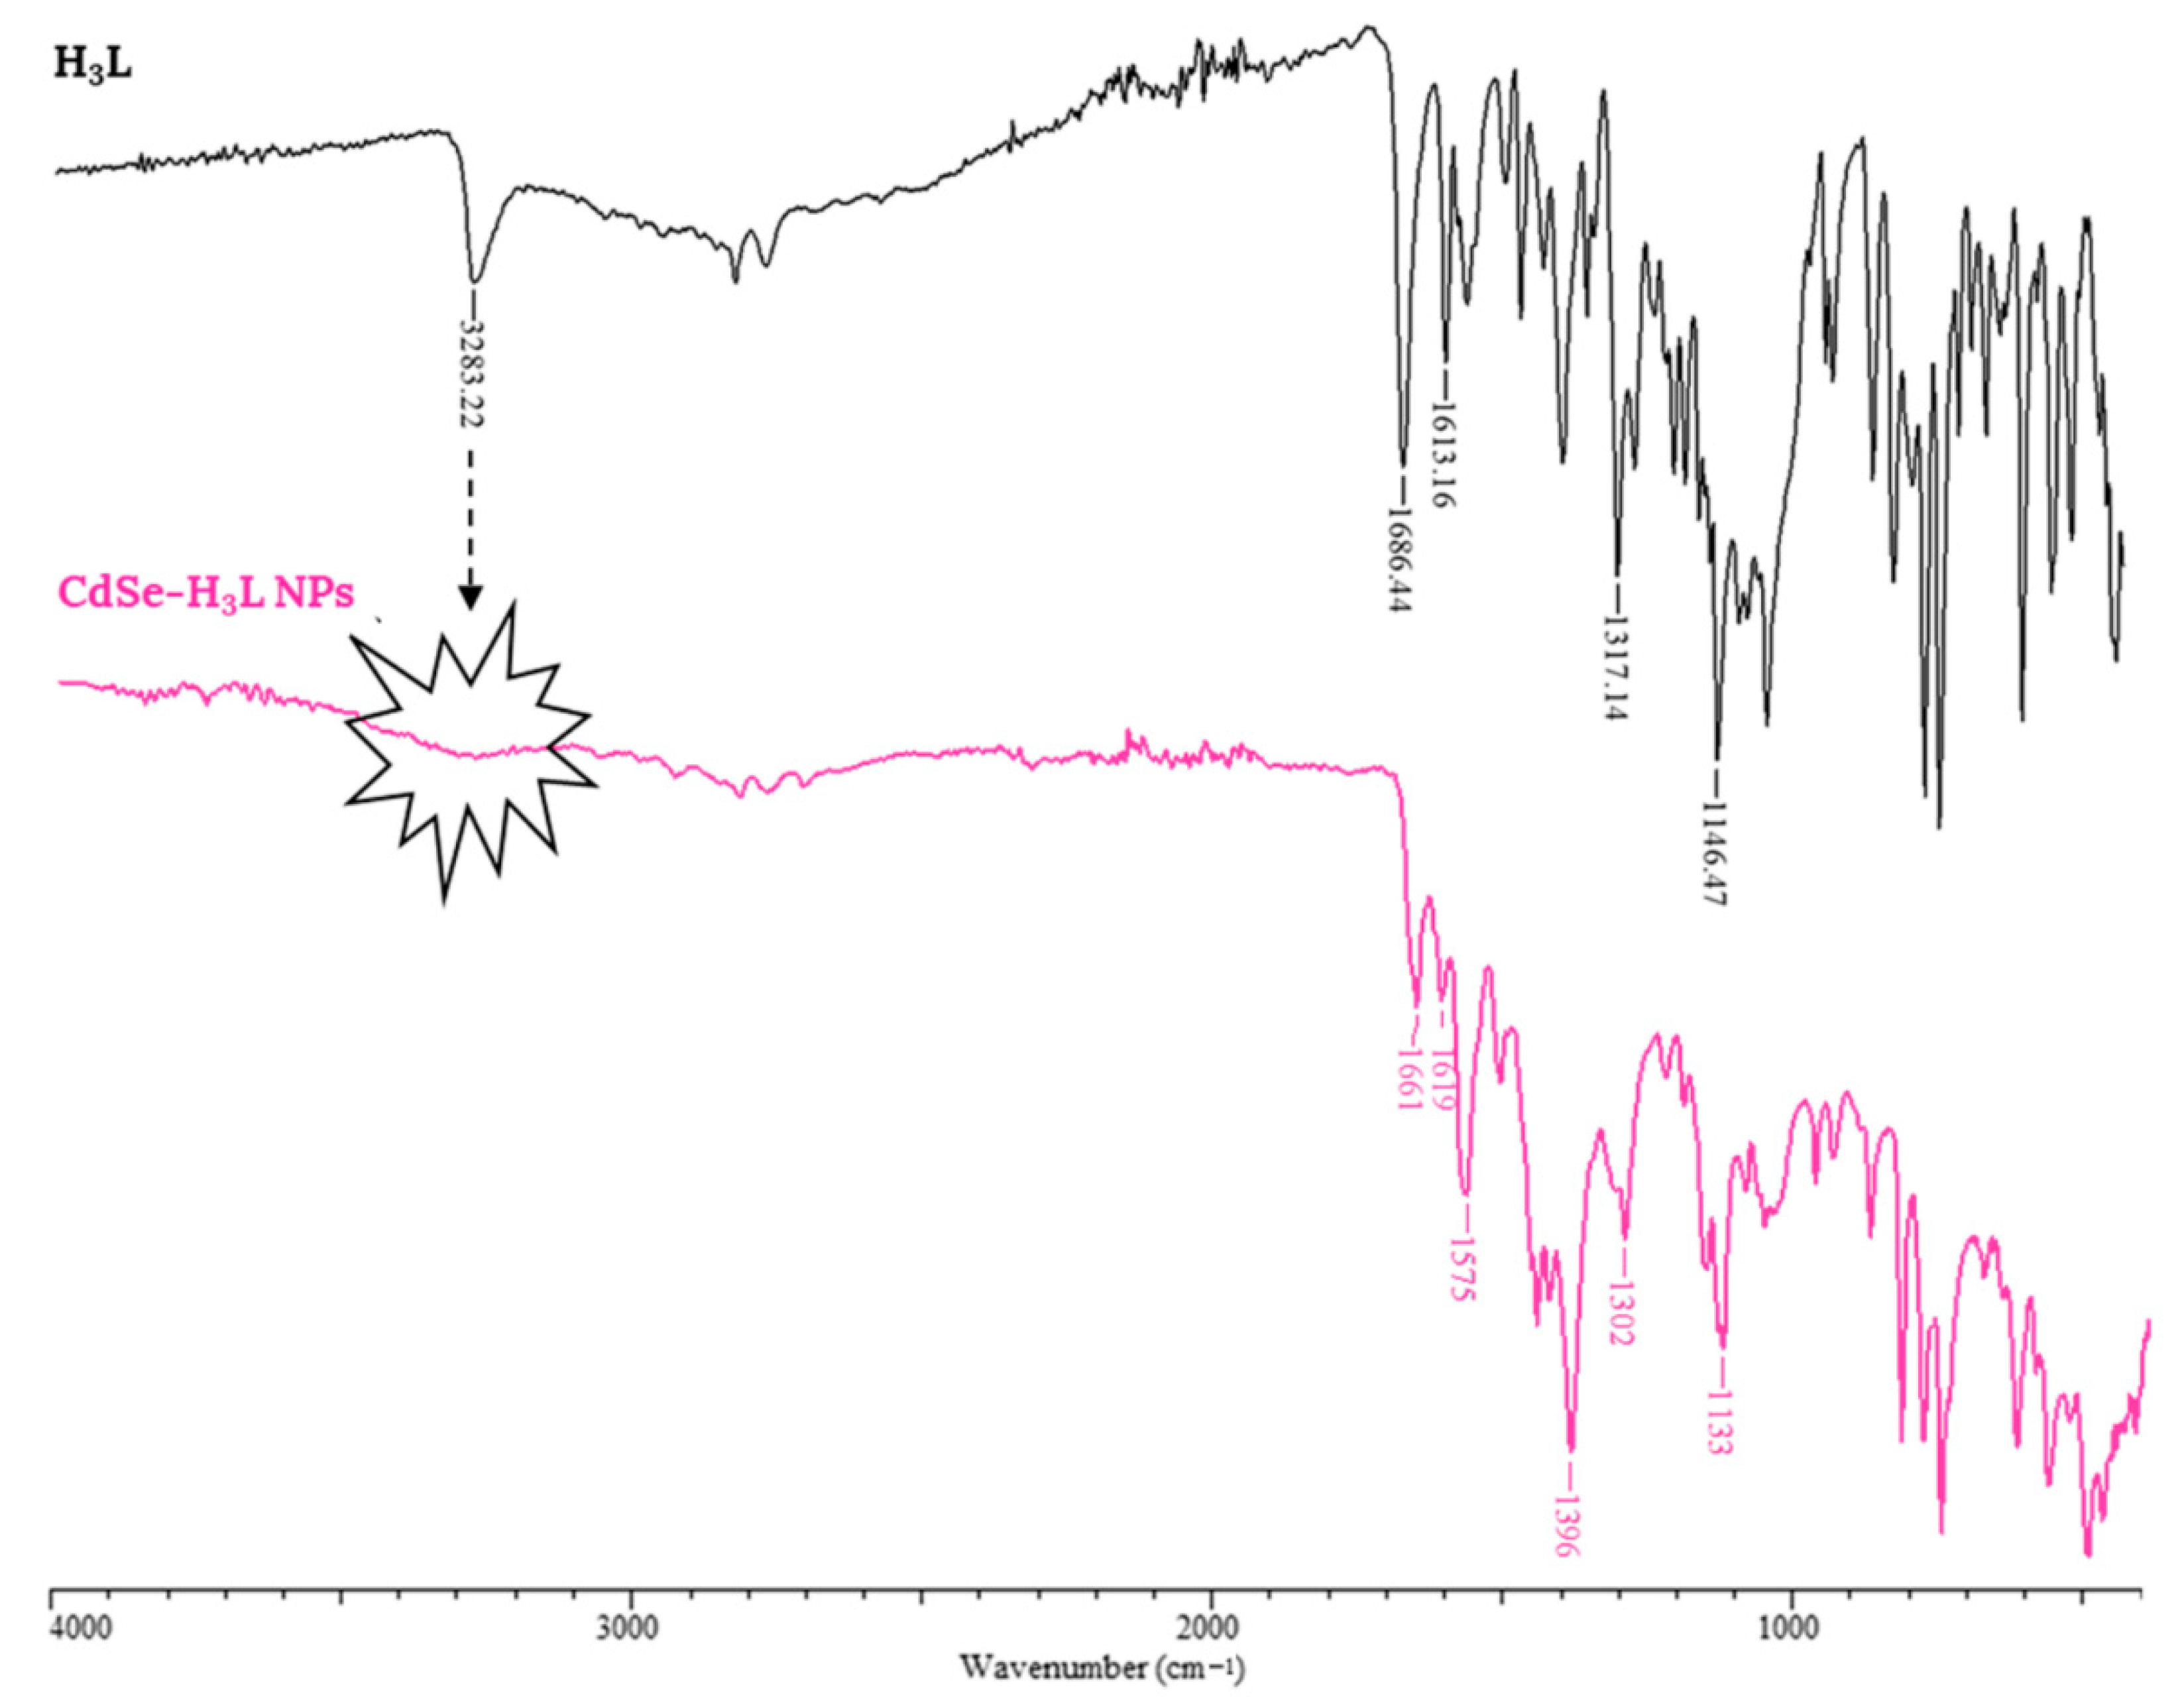
The IR spectra of the reaction products of CdSe NPs and CdSe-Cys QDs with H
3L clearly show the absence of the band at about 3283 cm
−1 attributable to ν OH/ν NH modes. This fact evidences the bideprotonation of the Schiff base ligand (
Figure 10 and
Figure S7). Furthermore, the presence of a medium-intensity narrow band at about 1616 cm
−1 is clear, which was attributable to the coordinate imino group of the ligand.
The bideprotonation and the shift of the narrow band of medium intensity seem to indicate that the interaction between H3L and the NMs surface took place through the Ophenol, Nimine, and Nsulfonamide atoms of the ligand.
In addition, the observation of two bands attributable to ν
as(COO
−) and ν
s(COO
−) at about 1575 and 1396 cm
−1, respectively, was a clear sign of deprotonation of the carboxyl group in the ligand [
34,
35], coherent with the formation of the carboxylate sodium salt.
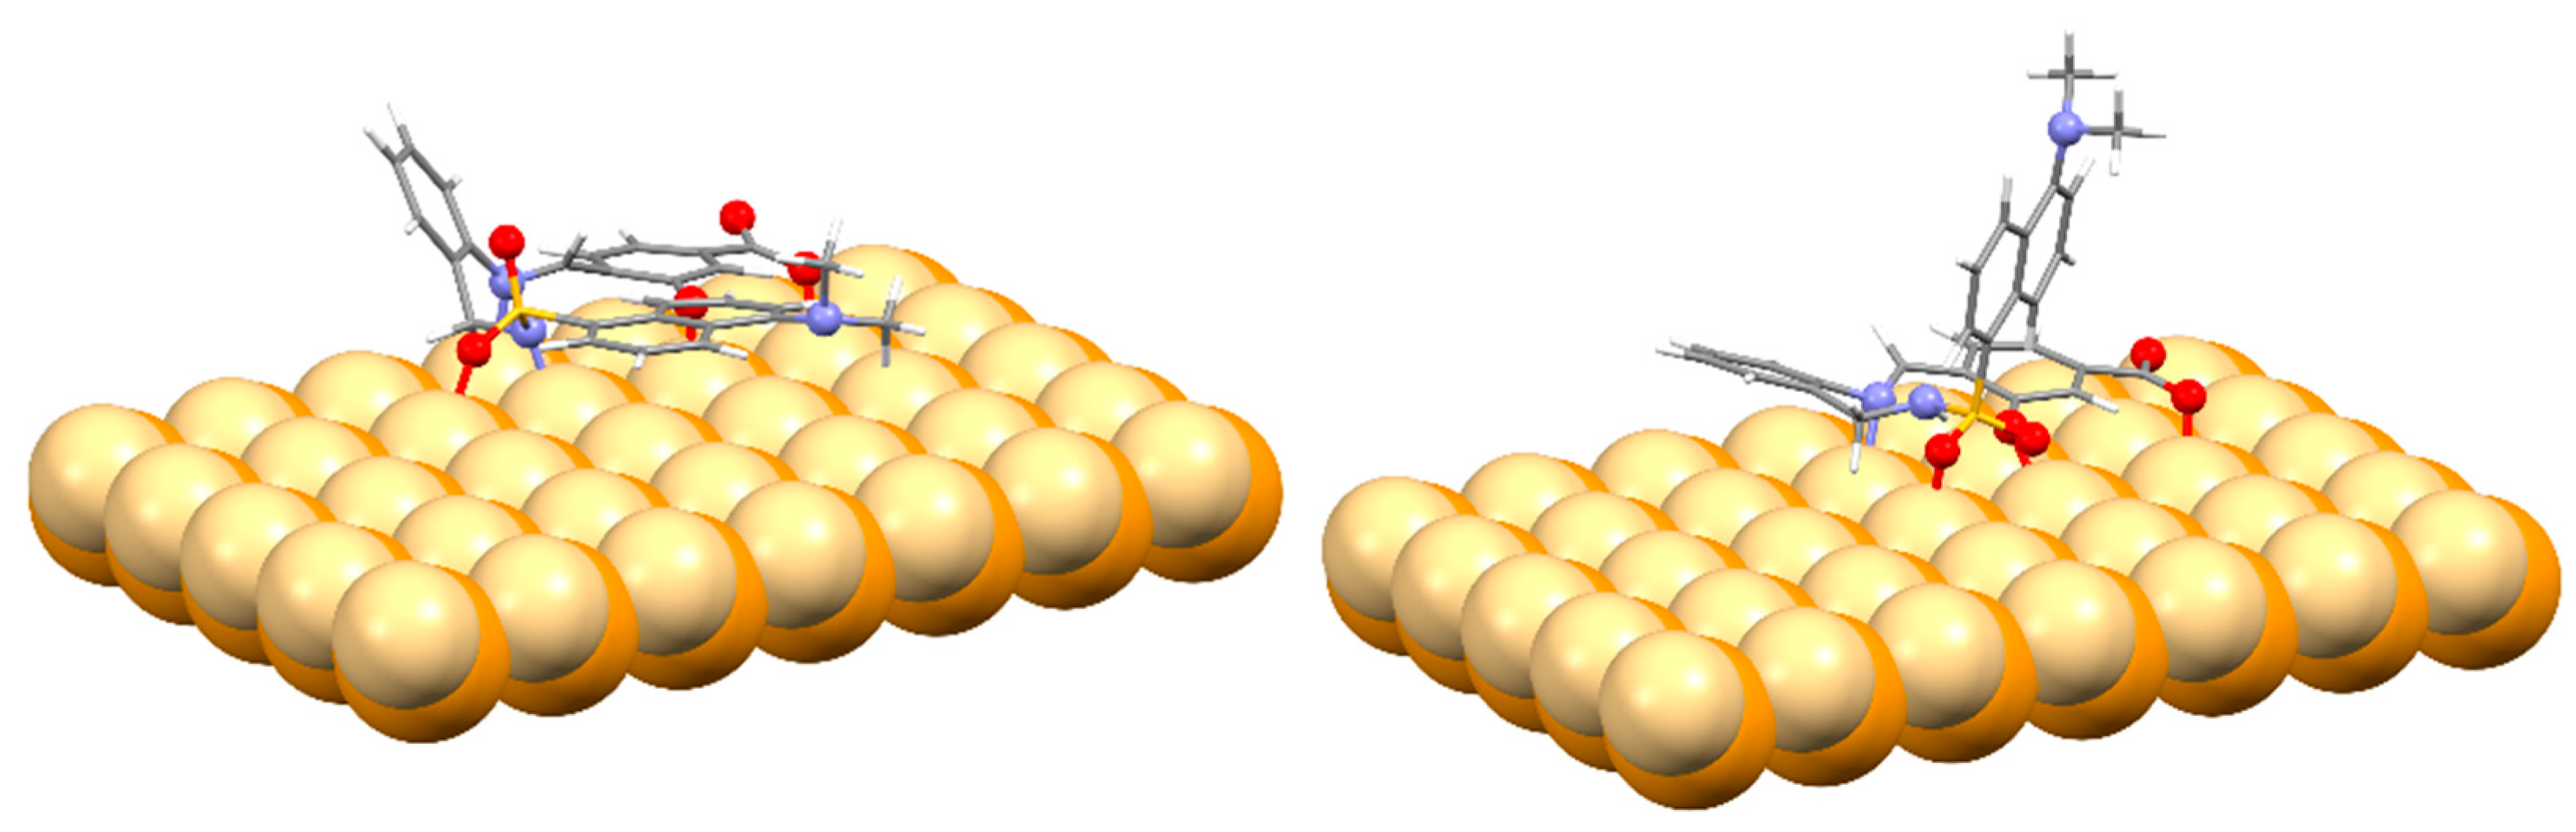
3.5.5. DFT Calculations
Several models of CdSe NPs were considered to mimic the interaction with H
3L using DFT calculations [
19] (
Table S1). The largest model studied comprised one unit of the ligand interacting with a sheet of 35 units of CdSe. This size was chosen to allow a complete interaction between H
3L and the CdSe surface. The geometry of this surface corresponds to the (0,0,1) facet from a crystal structure available from CSD, because it contains the maximum number of superficial cadmium atoms available to interact with the ligand. Particular attention was devoted to establishing the preference of a dianionic (as a phenolate and sulfonamide anion) or a monoanionic (as only phenolate) form of the ligand to interact with the metal ions on the CdSe NP surface.
Figure 11 shows the DFT models obtained for the interaction of CdSe NPs with a dianionic ligand, as well as CdSe NPs with a monodeprotonated ligand.
For these models, interactions of the dianionic form of the ligand showed higher stabilization energies (−197.6 kcal/mol) than those of the monoanionic ones (−110.2 kcal/mol). The same trend was observed for all the diverse models considered, even with the smaller models employed here, which considered the interaction between the ligand and a single CdSe unit (
Table S1). These theoretical results confirm that the interaction between H
3L and CdSe NPs surface took place through the O
phenol, N
imine, and N
sulfonamide atoms of the dianionic ligand (as phenolate and sulfonamide anion). In addition, the interactions of the surface metal ions with the oxygen atoms of the carboxylate and the sulfonamide groups could contribute to the stabilization of these systems.
The models also showed that the ligand changed its conformation, with respect to that of the isolated ligand, to maximize the interaction with the CdSe NP surface. Thus, a less folded ligand overlapped on the surface, giving rise to additional interactions, such as S=O···Cd, which also contributed to the stabilization of the interaction.
4. Conclusions
We probed that, at room temperature, CdSe NPs and CdSe-Cys QDs quickly interact with H3L, especially at basic pH. The fluorescence intensity of H3L in aqueous solution linearly decreased with increasing concentration of CdSe NMs. The working ranges for detection of CdSe NPs, and CdSe-Cys could be fine-tuned by varying the concentration of H3L. A solution of H3L (1.26 ppb) showed sensitive responses to CdSe NPs and CdSe-Cys QDs, with detection limits as low as 40 and 62 ppb, respectively. The limits of detection of CdSe NPs and CdSe-Cys QDs with [H3L] = 126 ppb were 460 and 630 ppb, respectively. Moreover, using a smartphone color recognizer application, the fluorescence intensity response of H3L-modified cellulose paper to CdSe-Cys QDs was recorded in the red channel (R), which allowed us to detect CdSe-Cys QDs with LOD = 15 ppb. Diffuse reflectance spectrophotometry also allowed detecting CdSe-Cys QDs using H3L-modified cellulose paper (LOD = 245 ppb and LOQ = 815 ppb). H3L possessed selectivity toward CdSe NPs in the presence of Cu NPs, which could be tolerated in concentration of at least 8 ppm concentration, when the concentration of CdSe NPs was 8 ppm. Other common NMs such as CuO NPs, ZnO NPs, and TiO2 NPs could be tolerated in concentrations of at least 4 ppm without interference. Common metal ions in water such as Na+, K+, and Fe3+, in 8 ppm concentration, did not interfere with the detection of CdSe NPs. Mg2+, Ca2+, and Al3+ ions could be tolerated in concentrations of 2 ppm without interference.
We found that the affinity of H3L to the NMs studied was as follows: CdSe NPs > CdSe-Cys QDs, and that H3L used five binding sites on the surface of CdSe NPs, whereas it used only two binding sites on the CdSe-Cys QD surface. Moreover, we determined a 15:1 molar ratio (CdSe:H3L) in the reaction product of CdSe NPs with H3L, and a cysteine:H3L molar ratio of about 20:1 on the CdSe-Cys QD surface. Lastly, theoretical results support that the interaction between H3L and CdSe NPs took place through the Ophenol, Nimine, and Nsulfonamide atoms of the dianionic ligand (as a phenolate and sulfonamide anion), and that O atoms of the carboxylate and the sulfonamide groups contributed to the stabilization of the systems.
Supplementary Materials
The following supporting information can be downloaded at
https://www.mdpi.com/article/10.3390/chemosensors10100394/s1: Figure S1:
1H NMR spectrum of cysteine-capped CdSe QDs; Figure S2: UV-Vis spectrum of CdSe-Cys QDs; Figure S3: ATR-FTIR spectrum of CdSe-Cys QDs; Figure S4: SEM-EDX images of CdSe-Cys QDs; Figure S5: XRF spectrum and mapping of CdSe-H
3L NPs; Figure S6:
1H NMR spectrum of CdSe-Cys-H
3L QDs; Figure S7: ATR-IR spectra of CdSe-Cys-H
3L QDs; Table S1: DFT models for the interaction H
3L-NMs.
Author Contributions
Conceptualization, J.S.-M. and P.B.-B.; methodology, Y.A.-I. and I.P.-J.; software, I.P.-J. and Y.A.-I.; validation, J.S.-M., I.P.-J. and P.B.-B.; formal analysis, I.P.-J., M.F. and Y.A.-I.; investigation, I.P.-J. and Y.A.-I.; resources, J.S.-M. and P.B.-B.; data curation, I.P.-J. and M.F.; writing—original draft preparation, J.S.-M. and Y.A.-I.; writing—review and editing, A.M.G.-D.; visualization, M.F.; supervision, J.S.-M.; project administration, P.B.-B.; funding acquisition, P.B.-B. All authors have read and agreed to the published version of the manuscript.
Funding
This research was funded by the Ministerio de Ciencia, Innovación y Universidades (RTI2018-099222-B-I00) and Interreg Atlantic Area, Poctep (ACUINANO Project).
Institutional Review Board Statement
Not applicable.
Informed Consent Statement
Not applicable.
Data Availability Statement
Not applicable.
Acknowledgments
We would like to thank the “Area de Infraestructuras de Investigación da USC” for the support provided for this work.
Conflicts of Interest
The authors declare no conflict of interest.
References
- Divya; Kaur, G.; Asha, K.; Dass, S.; Shrivastav, R. Photoelectrochemical performance of Yb Co-doped BiV0.98Mo0.02O4 thin films for Photoelectrochemical water splitting. Mater. Today Proc. 2022, 49, 738–743. [Google Scholar] [CrossRef]
- Yu, Z.; Gong, H.; Xu, J.; Li, Y.; Zeng, Y.; Liu, X.; Tang, D. Exploiting Photoelectric Activities and Piezoelectric Properties of NaNbO3 Semiconductors for Point-of-Care Immunoassay. Anal. Chem. 2022, 94, 3418–3426. [Google Scholar] [CrossRef] [PubMed]
- Chopade, P.; Jagtap, S.; Gosavi, S. Material properties and potential applications of CdSe semiconductor nanocrystals. In Nanoscale Compound Semiconductors and Their Optoelectronics Applications; Pawade, V.B., Dhoble, S.J., Swart, H.C., Eds.; Woodhead Publishing: Cambridge, MA, USA, 2022; pp. 105–153. [Google Scholar] [CrossRef]
- Jin, W.; Hu, L. Review on quasi one-dimensional CdSe nanomaterials: Synthesis and application in photodetectors. Nanomaterials 2019, 9, 1359. [Google Scholar] [CrossRef] [PubMed]
- Derfus, A.M.; Chan, W.C.W.; Bhatia, S.N. Probing the Cytotoxicity of Semiconductor Quantum Dots. Nano Lett. 2004, 4, 11–18. [Google Scholar] [CrossRef]
- Mahendra, S.; Zhu, H.; Colvin, V.L.; Alvarez, P.J. Quantum dot weathering results in microbial toxicity. Environ. Sci. Technol. 2008, 42, 9424–9430. [Google Scholar] [CrossRef]
- Allocca, M.; Mattera, L.; Bauduin, A.; Miedziak, B.; Moros, M.; De Trizio, L.; Tino, A.; Reiss, P.; Ambrosone, A.; Tortiglione, C. An Integrated Multilevel Analysis Profiling Biosafety and Toxicity Induced by Indium- and Cadmium-Based Quantum Dots in Vivo. Environ. Sci. Technol. 2019, 53, 3938–3947. [Google Scholar] [CrossRef]
- Su, Y.; Hu, M.; Fan, C.; He, Y.; Li, Q.; Li, W.; Wang, L.-H.; Shen, P.; Huang, Q. The cytotoxicity of CdTe quantum dots and the relative contributions from released cadmium ions and nanoparticle properties. Biomaterials 2010, 31, 4829–4834. [Google Scholar] [CrossRef]
- Hu, L.; Zhong, H.; He, Z. The cytotoxicities in prokaryote and eukaryote varied for CdSe and CdSe/ZnS quantum dots and differed from cadmium ions. Ecotoxicol. Environ. Saf. 2019, 181, 336–344. [Google Scholar] [CrossRef]
- Tarrahi, R.; Movafeghi, A.; Khataee, A.; Rezanejad, F.; Gohari, G. Evaluating the Toxic Impacts of Cadmium Selenide Nanoparticles on the Aquatic Plant. Lemna minor. Molecules 2019, 24, 410. [Google Scholar] [CrossRef] [Green Version]
- Zhang, W.; Lin, K.; Sun, X.; Dong, Q.; Huang, C.; Wang, H.; Guo, M.; Cui, X. Toxicological effect of MPA-CdSe QDs exposure on zebrafish embryo and larvae. Chemosphere 2012, 89, 52–59. [Google Scholar] [CrossRef]
- Morelli, V.; Cioni, P.; Posarelli, M.; Gabellieri, E. Chemical stability of CdSe quantum dots in seawater and their effects on a marine microalga. Aquat. Toxicol. 2012, 122–123, 153–162. [Google Scholar] [CrossRef] [PubMed]
- Ambrosone, A.; Roopin, M.; Pelaz, B.; Abdelmonem, A.M.; Ackermann, L.-M.; Mattera, L.; Allocca, M.; Tino, A.; Klapper, M.; Parak, W.J.; et al. Dissecting common and divergent molecular pathways elicited by CdSe/ZnS quantum dots in freshwater and marine sentinel invertebrates. Nanotoxicology 2017, 11, 289–303. [Google Scholar] [CrossRef]
- Chatterjee, A.; Santra, M.; Won, N.; Kim, V.; Kim, J.K.; Kim, S.B.; Ahn, K.H. Selective Fluorogenic and Chromogenic Probe for Detection of Silver Ions and Silver Nanoparticles in Aqueous Media. J. Am. Chem. Soc. 2009, 131, 2040–2041. [Google Scholar] [CrossRef]
- Cayuela, A.; Soriano, M.L.; Valcárcel, M. Reusable sensor based on functionalized carbon dots for the detection of silver nanoparticles in cosmetics via inner filter effect. Anal. Chim. Acta 2015, 872, 70–76. [Google Scholar] [CrossRef] [PubMed]
- Raz, S.R.; Leontaridou, M.; Bremer, M.G.E.G.; Peters, R.; Weigel, S. Development of surface plasmon resonance-based sensor for detection of silver nanoparticles in food and the environment. Anal. Bioanal. Chem. 2012, 403, 2843–2850. [Google Scholar] [CrossRef]
- Sanmartín-Matalobos, J.; Bermejo-Barrera, P.; Aboal-Somoza, M.; Fondo, M.; García-Deibe, A.M.; Corredoira-Vázquez, J.; Alves-Iglesias, Y. Semiconductor Quantum Dots as Target Analytes: Properties, Surface Chemistry and Detection. Nanomaterials 2022, 12, 2501. [Google Scholar] [CrossRef] [PubMed]
- Sanmartín-Matalobos, J.; García-Deibe, A.M.; Fondo, M.; Zarepour-Jevinani, M.; Domínguez-González, M.R.; Bermejo-Barrera, P. Exploration of an easily synthesized fluorescent probe for detecting copper in aqueous samples. Dalton Trans. 2017, 46, 15827–15835. [Google Scholar] [CrossRef]
- Sanmartín-Matalobos, J.; García-Deibe, A.M.; Zarepour-Jevinani, M.; Aboal-Somoza, M.; Bermejo-Barrera, P.; Fondo, M. Exploring the Chelating Potential of an Easily Synthesized Schiff Base for Copper Sensing. Crystals 2020, 10, 235. [Google Scholar] [CrossRef]
- Sanmartín-Matalobos, J.; Bermejo-Barrera, P.; Alves-Iglesias, Y.; García-Deibe, A.M.; Fondo, M. Synthesis and Characterization of a Dansyl-Based Fluorescent Probe for Analytical Purposes. Chem. Proc. 2022, 8, 76. [Google Scholar] [CrossRef]
- Frisch, M.J.; Trucks, G.W.; Schlegel, H.B.; Scuseria, G.E.; Robb, M.A.; Cheeseman, J.R.; Scalmani, G.; Barone, V.; Petersson, G.A.; Nakatsuji, H.; et al. (Eds.) Gaussian 09, Revision A.02; Gaussian Inc.: Wallingford, CT, USA, 2016. [Google Scholar]
- Glendening, E.D.; Badenhoop, J.K.; Reed, A.E.; Carpenter, J.E.; Bohmann, J.A.; Morales, C.M.; Karafiloglou, P.; Landis, C.R.; Weinhold, F. (Eds.) NBO 7.0; Theoretical Chemistry Institute, University of Wisconsin: Madison, WI, USA, 2018. [Google Scholar]
- Santos, C.I.L.; Souza-Carvalho, M.; Raphael, E.; Dantas, C.; Ferrari, J.L.; Schiavon, M.A. Synthesis, Optical Characterization, and Size Distribution Determination by Curve Resolution Methods of Water-Soluble CdSe Quantum Dots. Mater. Res. 2016, 19, 1407–1416. [Google Scholar] [CrossRef]
- Liu, P.; Wang, Q.; Li, X. Studies on CdSe/L-cysteine Quantum Dots Synthesized in Aqueous Solution for Biological Labeling. J. Phys. Chem. C 2009, 113, 7670–7676. [Google Scholar] [CrossRef]
- Yu, W.W.; Qu, L.; Guo, W.; Peng, X. Experimental Determination of the Extinction Coefficient of CdTe, CdSe, and CdS Nanocrystals. Chem. Mater. 2003, 15, 2854–2860. [Google Scholar] [CrossRef]
- Jeon, C.H.; Park, C.S.; Lee, C.S.; Ha, T.H. Simple immobilization of mercury ion chemosensors to solid substrate. J. Ind. Eng. Chem. 2018, 57, 370–376. [Google Scholar] [CrossRef]
- Shrivastava, A.; Gupta, V. Methods for the determination of limit of detection and limit of quantitation of the analytical methods. Chron. Young Sci. 2011, 2, 1. [Google Scholar] [CrossRef]
- Yang, F.; Lin, D.; Pan, L.; Zhu, J.; Shen, J.; Yang, L.; Jiang, C. Portable Smartphone Platform Based on a Single Dual-Emissive Ratiometric Fluorescent Probe for Visual Detection of Isopropanol in Exhaled Breath. Anal. Chem. 2021, 93, 14506–14513. [Google Scholar] [CrossRef]
- Yan, F.; Hu, S.; Wang, Y.; Song, X.; Cao, C.; Wang, K.; Jing, C.; Zhang, G.; Liu, W. A multifunctional fluorescent probe for visualizing H2S in wastewater with portable smartphone via fluorescent paper strip and sensing GSH in vivo. J. Hazard. Mater. 2021, 406, 124523. [Google Scholar] [CrossRef]
- Verdugo-Naranjo, I.; Hamamura, A.C.; Arruda, G.V.; Cardoso, G.C.; Pavoni, J.F. Radiodermatitis grade estimation by RGB color imaging. Artif. Life Robot. 2022, 27, 58–63. [Google Scholar] [CrossRef]
- Brachmann, E.; Rother, C. Visual Camera Re-Localization From RGB and RGB-D Images Using DSAC. IEEE Trans. Pattern Anal. Mach. Intell. 2022, 44, 5847–5865. [Google Scholar] [CrossRef]
- Lakowicz, J.R. Principles of Fluorescence Spectroscopy, 3rd ed.; Springer Nature: Boston, MA, USA, 2006. [Google Scholar]
- Moeno, S.; Nyokong, T. Opposing responses elicited by positively charged phthalocyanines in the presence of CdTe quantum dots. J. Photochem. Photobiol. A 2009, 201, 228–236. [Google Scholar] [CrossRef]
- Oluwafemi, S.O.; Revaprasadu, N.; Ramirez, A.J. A novel one-pot route for the synthesis of water-soluble cadmium selenide nanoparticles. J. Cryst. Growth 2008, 310, 3230–3234. [Google Scholar] [CrossRef]
- Sakellari, G.I.; Hondow, N.; Gardiner, P.H.E. Factors Influencing the Surface Functionalization of Citrate Stabilized Gold Nanoparticles with Cysteamine, 3-Mercaptopropionic Acid or l-Selenocystine for Sensor Applications. Chemosensors 2020, 8, 80. [Google Scholar] [CrossRef]
Scheme 1.
Schematic representation of H3L, with the fluorophore highlighted in green.
Scheme 1.
Schematic representation of H3L, with the fluorophore highlighted in green.
Figure 1.
Top: Influence of pH on the fluorescence spectrum of H3L (4.44 × 10⁻⁴ M) measured in ethanol (pH 2.1–12.2) at room temperature. Bottom: The effect of UV light (365 nm) on an ethanol solution (right) and a powdery sample (left) of H3L.
Figure 1.
Top: Influence of pH on the fluorescence spectrum of H3L (4.44 × 10⁻⁴ M) measured in ethanol (pH 2.1–12.2) at room temperature. Bottom: The effect of UV light (365 nm) on an ethanol solution (right) and a powdery sample (left) of H3L.
Figure 2.
Calibration curve of fluorescence intensity of H3L in 80:20 ethanol/water solution at pH 11 with gradual addition of NMs (until the fluorescence intensity stops decreasing). Left: [H3L] = 126 ppb. Right: [H3L] = 1.26 ppb. NaOH 0.1 M was used to deprotonate H3L. Final volume of the solution = 4 mL. Each solution was sonicated for 1 min before being measured. λexc = 400 nm.
Figure 3.
(a) Commercial cellulose paper under visible light. (b) Schematic representation of the ligand-modified cellulose paper. (c) Ligand-modified cellulose paper under visible light. (d) Variation of red coordinate in the RGB space of fluorescent images (excitation at 365 nm) of the ligand-modified cellulose paper upon soaking in CdSe-Cys QDs solution (5–100 ppb) for 15 min. Images (under UV light) of the fluorescent paper are included to show the color change. (e) Decrease in the absorbance of the band at 270 mm, with the increase in CdSe-Cys QDs concentration from 100 ppb to 2 ppm.
Figure 4.
Plots of the intensities of the fluorescence spectra of H3L (10−4 M) vs. the concentration of the quenchers CdSe NPs (top) and CdSe-Cys QDs (bottom) in an 80:20 ethanol/water solution. Slopes of the curves at 293, 303, and 313 K are Stern–Volmer constants KSV (KSV = kqτ, where τ is the lifetime of the fluorophore) at the cited temperatures.
Figure 5.
The Scatchard plot for binding H3L to CdSe NPs (bottom) and CdSe-Cys QDs (top) at 293, 303, and 313 K and pH 11.
Figure 5.
The Scatchard plot for binding H3L to CdSe NPs (bottom) and CdSe-Cys QDs (top) at 293, 303, and 313 K and pH 11.
Figure 6.
Fluorescence responses of H3L (2.5 nM, 1.26 ppb) toward CdSe NPs (8 ppm) in the presence of various NPs (bottom) such as Cu NPs (8 ppm), CuO NPs (4 ppm), TiO2 NPs (4 ppm), and ZnO NPs (4 ppm) and some common metal ions (top) such as Na+ (8 ppm), K+ (8 ppm), Fe3+ (8 ppm), Mg2+ (2 ppm), Ca2+ (2 ppm), and Al3+ (2 ppm). All experiments were performed in 4 mL of an ethanol–water solution in 80:20 v/v (pH 11) under λexc = 400 nm.
Figure 7.
(a) SEM micrograph of the raw reaction product of CdSe NPs with H3L (as carboxylate sodium salt). (b–h) EDX mapping pattern of different elements: Cd, Se, C, N, O, S, and Na.
Figure 7.
(a) SEM micrograph of the raw reaction product of CdSe NPs with H3L (as carboxylate sodium salt). (b–h) EDX mapping pattern of different elements: Cd, Se, C, N, O, S, and Na.
Figure 8.
Bottom: XRF spectrum of the reaction product of CdSe NPs with H3L. X-axis: energy (keV), Y-axis: intensity. Top: XRF mapping of the reaction product between CdSe NPs and H3L with elemental distribution of sulfur (yellow), selenium (red), and cadmium (green) on the sample surface.
Figure 8.
Bottom: XRF spectrum of the reaction product of CdSe NPs with H3L. X-axis: energy (keV), Y-axis: intensity. Top: XRF mapping of the reaction product between CdSe NPs and H3L with elemental distribution of sulfur (yellow), selenium (red), and cadmium (green) on the sample surface.
Figure 9.
1H-NMR spectrum of the reaction product of CdSe-Cys QDs with H3L (range: 4.8 to 2.6 ppm) in methanol-d4. The spectra of CdSe-Cys QDs and H3L, as free species, are included for comparison. Integration values are under the corresponding signals.
Figure 9.
1H-NMR spectrum of the reaction product of CdSe-Cys QDs with H3L (range: 4.8 to 2.6 ppm) in methanol-d4. The spectra of CdSe-Cys QDs and H3L, as free species, are included for comparison. Integration values are under the corresponding signals.
Figure 10.
ATR-IR spectra of H3L (top) and CdSe-H3L NPs (bottom).
Figure 10.
ATR-IR spectra of H3L (top) and CdSe-H3L NPs (bottom).
Figure 11.
DFT models for the H3L–NMs interaction.
Figure 11.
DFT models for the H3L–NMs interaction.
Table 1.
Values of Gibbs free energy and quenching constant for the reaction of H3L with CdSe NPs and CdSe-Cys QDs.
Table 1.
Values of Gibbs free energy and quenching constant for the reaction of H3L with CdSe NPs and CdSe-Cys QDs.
| Species | ΔGKsv 293 K kJ·mol−1 (kJ·mg−1) | Ksv 293 K M−1 (L·mg−1) | Ksv 303 K M−1 (L·mg−1) | Ksv 313 K M−1 (L·mg−1) |
|---|
| CdSe NPs | −20.08
(−20.46) | 3790
(4420) | 3150
(3600) | 2610
(2750) |
| CdSe-Cys QDs | (−18.87) | (2300) | (1800) | (1230) |
| Publisher’s Note: MDPI stays neutral with regard to jurisdictional claims in published maps and institutional affiliations. |
© 2022 by the authors. Licensee MDPI, Basel, Switzerland. This article is an open access article distributed under the terms and conditions of the Creative Commons Attribution (CC BY) license (https://creativecommons.org/licenses/by/4.0/).


 ,
, 


