Review

Citius, Altius, Fortius—Advanced Mass Spectrometry in Service of Forensic Analysis

Faculty of Chemistry, University of Wroclaw, F. Joliot-Curie 14, 50-383 Wroclaw, Poland
*
Author to whom correspondence should be addressed.
Chemosensors 2022, 10(8), 324; https://doi.org/10.3390/chemosensors10080324
Submission received: 13 July 2022 / Revised: 2 August 2022 / Accepted: 9 August 2022 / Published: 11 August 2022

Abstract

:
This review presents numerous studies in which mass spectrometry has been used to assist forensic investigation. Due to its unique capabilities, mainly high-resolution mass data and structural information, high sensitivity, and cooperation with separation techniques, this method provides access to many tools streamlining and accelerating sample analysis. Low analyte consumption, advanced derivatization procedures and availability of isotopically labeled standards offer opportunities to study materials previously not considered viable evidence, opening new avenues in forensic investigations.

Graphical Abstract

1. Introduction

Mass spectrometry (MS), particularly when coupled with liquid chromatography (LCMS), has been gaining attention as the method of choice in forensic studies [1]. Since this method could be used to analyze many compounds in parallel, it could reduce the sample processing time, thus leading to a higher throughput for forensic laboratories. Mass spectrometry is particularly useful in toxicological studies and in analysis of falsified medicines, due to the ability to extract structural data from a very limited amount of material [2].
The sensitivity and selectivity of mass spectrometry could be further enhanced by derivatization of the analytes, even allowing the detection of substances which are practically impossible to detect at low concentrations in biological matrices, such as cyanides, which are of interest in forensic studies [3].
With new sample preparation protocols, non-traditional matrices, such as ear wax [4], hair [5] or meconium [6] could also be analyzed by mass spectrometry. Such matrices often provide long-term information on drug abuse, not normally available from blood samples. The high resolution of LCMS allows analysis of polydisperse materials, making unambiguous characterization of surfactants possible, which constitute both human-driven environmental pollution and a toxicological threat [7].
Isotopic level analysis by mass spectrometry provides data unavailable by other methods, for example the ratio of certain isotopes in a sample could be used to distinguish the geographic origin of two, otherwise chemically identical, materials [8]. The hydrogen–deuterium exchange, which is also easily analyzed by mass spectrometry, can provide internal standards for quantification of biologically active compounds [9].
The innovative mass spectrometry methods, usually developed for pharmaceutical and biomedical analysis, find further application in related areas. The answers are provided faster, with higher accuracy and powerful impact, fulfilling the Olympic motto “Citius, Altius, Fortius” in the struggle to find the truth. In this review we discuss how current developments in mass spectrometry, e.g., the access to new samples and previously overlooked substances, advanced chemical modifications for increased sensitivity and specificity, as well as unique information obtained at isotopic level change the scope of forensic studies.

2. Mass Spectrometry in Forensic Analysis

2.1. Mass Spectrometry and Analysis of Falsified Medicines

The high market value of pharmaceutical products results in various illegal actions in the production of such molecules, including low molecular weight compounds, as well as peptides, proteins and even monoclonal antibodies [10,11]. Countermeasures include development of analytical strategies for comprehensive characterization of suspicious samples [12,13,14,15,16,17]. Table 1 lists the main analytical methods used in qualitative and quantitative analysis of medicinal drugs, with their main benefits and drawbacks.
Mass spectrometry has achieved a leading role in characterization of falsified medicines, due to the specificity and sensitivity provided by current MS instruments, but its applications in forensic science include not only analysis of drugs, but also warfare agents [21], gun-shot residues [22,23], ink differentiation [24], and other forensically relevant samples [1]. Mass spectrometry offers the identification of unknown samples, while allowing both qualitative and quantitative analysis. Accuracy is enhanced by the use of different ionization sources and hyphenation with separation techniques [25,26,27]. The samples of potentially falsified drugs may or may not contain the actual active pharmaceutical ingredient (API), and if contained it is often adulterated or mixed with other substances. The effect of a matrix often creates a hurdle for rapid yet accurate analysis, making the combination of mass spectrometry with a separation method (GC, LC) a necessity [28].

2.1.1. Falsified Lifestyle Drugs as a Global Problem

World Health Organization (WHO) defines a counterfeit drug as one “which is deliberately and fraudulently mislabeled with respect to identity and/or source” [29]. In the developing world illegal actions concentrate on lifesaving medicines, such as anti-malaria drugs, whereas in high income countries, performance and image enhancing drugs (PIEDs), including lifestyle drugs, such as phosphodiesterase type–5 (PDE–5is) inhibitors for erectile dysfunction (ED), are targeted [30].
Counterfeit PDE-5 inhibitors, sold as dietary supplements or functional foods, are becoming a global problem because of the high demand, low cost, and simple manufacturing. Many methods for identifying PDE-5 inhibitors in complicated matrices have been developed (IMS; vibrational, X-ray, and NMR spectroscopy; immunological tests; HPLC-UV or LCMS) [31].
In one of the recent studies, 181 counterfeit and illicit sexual enhancement drugs were subjected to HPLC and LCMS/MS. It was found that 86.2% of all samples (156 out of 181) contained PDE–5is and/or their analogs, with 49.4% containing two or more components. Sildenafil, tadalafil, and other such drugs were detected at concentrations exceeding 2–7 times the recommended maximum doses, with multiple compounds frequently detected in single samples [32].
In another study, targeted, suspected-target, and non-targeted strategies based on liquid chromatography-high-resolution mass spectrometry (LCHRMS) were utilized to analyze erectile dysfunction (ED) drugs and their analogs in powdered drink mix, honey, jelly, hard candy, and sugar-coated chewing gum samples selected based on their brand names, label claims, images, herbal ingredients, or advertising materials with connotations to male sexual performance. The method was optimized and validated using 23 target analytes, representing structurally similar ED drugs. The modified QuEChERS extraction provided complete coverage of target analytes. Validation of the method covered 25 food samples that claimed to enhance male sexual performance. The LCHRMS analysis identified and detected 10 ED drugs from 24 adulterated food samples, with 11 of them quantified at supratherapeutic levels [33].
Recently, we have studied 21 dietary supplements available through online stores and marketed as sexual enhancement supplements containing only natural compounds (herbs and animal extracts). Even a simple visual inspection of the samples, in some cases, revealed that the chemical content of the pills was inconsistent with the declaration on the seller’s website and the description on the package. Instead of the expected greenish-brown extract, they contained a white solid or powder. Pills and capsules were extracted with 50:50 methanol:water mixture with the aid of an ultrasound bath, filtered and subjected to LCMS/MS analysis on the Shimadzu qTOF mass spectrometer working in a positive ion, DDA mode. Sildenafil, which was undeclared by neither manufacturer nor the seller, was found as the main ingredient in five of the analyzed products (Figure 1 and Figure 2). Two other samples contained undeclared icariin flavonoid glucoside derived from the Epimedium plant genus, used in traditional Chinese medicine to enhance erectile function. Figure 3 presents the results of LCMS/MS analysis of one of these supplements, performed in our research group. The results were in agreement with the theoretical fragmentation scheme and spectra published by Qian et al. [34].
The analysis of multiple isobaric peaks by LCMS QTOF proved to be highly efficient in prediction of the API origin and was suggested as a promising tool in tracing drug sources [35].

2.1.2. Technical Advances in Falsified Drug Analysis

Laser Desorption/Ionization-Mass Spectrometry Imaging (LDI-MSI) was used to study authentic and falsified sildenafil citrate containing tablets. This method does not require chromatographic separation and tangible results were obtained in less than three minutes per sample. The acquired mass data and multivariate analysis led to successful differentiation of pharmaceutical products with the same API, but in different formulations. Established quality markers were used to distinguish the reference drug from the generic and falsified versions. Given the sensitivity and specificity provided by the LDI-MSI and MS/MS, this approach is capable of identifying adulterants used in the falsification process [36].
Direct analysis in real-time mass spectrometry (DART-MS) is a relatively new technique for rapid ambient MS, including thermal-desorption-DART-MS, infrared-thermal-desorption-DART-MS, Joule-heating thermal-desorption-DART-MS, etc. The main benefit of this technique results from a transfer of the ionization process into the open air, with no sample preparation, no sample carryover and the ability to probe the surface of samples of any shape and size. Practically all types of forensic traces were successfully investigated, including drugs, explosives, gunshot residues, flammable liquid residues, inks, paints, polymers, lubricants, bank dyes, beverages, and insects. Samples can be rapidly and effortlessly screened and analyzed from various delicate surfaces like skin, glass and clothes. Recent reports suggest that DART-MS may be capable of providing quantitative or confirmatory results [25,37,38].

2.1.3. Falsification of Supplements in Doping Cases

Due to its stimulating properties, 3-dimethylamylamine (DMAA) has been used as an additive in dietary supplements. The World Anti-Doping Agency (WADA) prohibited its use in 2010, with several countries following with its complete removal from the market due to toxicity cases. Dietary supplements seized by the Brazilian Police were subjected to DART-MS/MS analysis, with the panel of DMAA, ephedrine, synephrine, caffeine, sibutramine, and methylphenidate. DMAA was detected in 20% of products, frequently in combination with sibutramine and caffeine. Sibutramine was found in 50% of the 108 seized samples, whereas methylphenidate was found in 10% of the material [39].
Several products (75 pharmaceuticals and 35 dietary supplements) were seized from on-line sales addressed to bodybuilders in France and submitted for identification and quantification of active compounds using GCMS and LCHRMS. Among the pharmaceuticals, 33% were substandard (wrong dosage), 32% were counterfeit (different formulation components) and only 19% were original, with remaining products acceptable only at qualitative stage. Fifty-four pharmaceuticals contained anabolic–androgenic steroids (AAS) with 80% AAS being non-original, whereas only 3% of dietary supplements were adulterated with a doping substance 1,3-dimethylbutylamine (DMBA) [40]. Anabolic androgenic steroid products were analyzed by UPLC-QTOF-MS/MS in a report presented by Smit et al. [41]. The expected components were detected in 50% of samples. However, other undeclared steroids were frequently detected.
The vast number of samples subjected to analysis in the case of falsified drugs inflicts a strain on analytical laboratories, with demand for methods offering fast and reliable results. In the case of mass spectrometry, coupled to chromatography, UHPLC methods have gained importance, although ambient methods (DART etc.) may be the procedures of choice in the near future [1].

2.2. Forensic Applications of IRMS

Isotope-Ratio Mass Spectrometry (IRMS) is the name of the branch of MS which is focused on determining the abundance of specific isotopes of the elements present in a given sample. This method is further subdivided into analysis of stable isotopes and radioisotopes. The latter is mainly used in radiometric dating. The former has found use in many areas, ranging from earth sciences, to archaeology, and to forensics. In particular, it has been utilized in food quality control and, by extension, in tracking food adulteration [42]. IRMS has been applied to a wide variety of food types, ranging from wine, vegetable oil, animal and cereal products, to organic food [43]. The two main kinds of tampering with food are introducing artificial additives or falsifying the origin of certain foods. For example, the EU has defined designations of Protected Designation of Origin (PDO), Protected Geographical Indication (PGI) and Traditional Speciality Guaranteed (TSG). The first two concern the place of production, while TSG designation guarantees the way of production, including the ingredients used.

2.2.1. The Origin of Isotopic Differences

The difference in isotopic contents of the same molecules stemming from various sources is caused by the difference of processes leading to their formation. For example, the 13C content in plants is lower than that of the atmospheric CO2, which they base their metabolism on. The difference is caused by a discrimination against 13C and preference for 12C of the enzymatic and physical processes occurring in the plants, such as membrane permeation. The variability between various species can be accounted for by the differences in their metabolic pathways. On the other hand, the changes between geographic places of origin within the same species can be explained by regional differences in availability of certain isotopes. For example, there is an isotopic effect observed when water is evaporated, so places with higher evaporation, and those with higher precipitation, will exhibit differences in the availability of hydrogen and oxygen isotopes. The level of discrimination, and, therefore, the difference in the isotopic ratios, is very small, but sufficient to be detected by a well-tuned mass spectrometer [44].
The instrument of choice for performing IRMS studies is the magnetic sector-type MS, also known as Nier-type MS. In this mass spectrometer, ions travel a circular path in a magnetic field, and the radius of their path depends on the intensity of the field and the m/z ratio of the ions. Such spectrometers can be equipped with several detectors, and, thus, detect ions of various m/z ratios simultaneously, since they are separated in space, not in time. This, in turn, makes measuring the intensity ratios more reliable and reproducible. The sample, before entering the magnetic sector, must be first ionized, and, before that, it needs to be converted into gas. For analyzing organic molecules, gases such as N2, CO2 and SO2 are normally used, and the samples are converted into them by burning, oxidation and/or reduction [45]. Due to low sample consumption and high accuracy, IRMS has been utilized extensively in forensic studies on foods, drugs and other products (Table 2) [8].
There are many examples showing the usefulness of the method for food analysis. In the case of wine, 13C content in ethanol is accepted as an EU-standard for validating that no extra alcohol has been added. In order to simplify the sample preparation step, the 13C content in volatile compounds, such as limonene or ethyl octanoate, can be measured as well [49]. Other isotopes, such as 85Rb, 24Mg and 18O, can be used to distinguish the geographical origin of the wine [46].

2.2.2. Food Authentication by IRMS

Olive oil belongs to the most falsified agricultural products. Therefore, EU regulations place very specific requirements on labeling Extra Virgin Olive Oil and Virgin Olive Oil, including precisely marking the area in which the oil is produced. The fats in olive oil are composed of four main types of fatty acids, and the exact content of each one depends on many factors, including weather conditions and the maturity of the olives [54]. Therefore, while the exact proportions of these fatty acids can be repeated year-to-year in a certain area, there is no guarantee they will [55]. However, the ratio of particular isotopes in the oil can be used as a fingerprint indicating the area of origin of the product [47]. In particular, since the four main kinds of fatty acids are generated by different metabolic pathways, the isotope ratios differ between them. Therefore, in addition to the IRMS of the bulk oil, IRMS of specific extracted fatty acids can be used to provide an additional degree of confirmation of the place of origin, and, thus, increase confidence in the results [54].
Similarly, in the case of cereals and products obtained from them, isotope ratios can be used to verify the identity as well as the place of origin. For example, in the case of buckwheat the contents of 13C, 15N and 34S can be used to determine not only what species it belongs to, but also whether it has been cultivated organically [56]. Similarly, isotope composition has been used to detect the geographic origin of wheat, while investigating both intact kernels and the products at various stages, up to cooked noodles. It was shown that the year-to-year variability is low enough for the region-to-region variability to be clearly detectable [48]. When it comes to the analysis of products obtained from cereals, IRMS has been used to detect adulteration of Polish vodka by the addition of maize-derived ethanol. The study concluded that the method is comparable to NMR in its precision [50]. In fact, the method can generally be used to distinguish between various plants, stemming from different geographical areas, which have been used for the production and distillation of spirits. In particular, it is relatively easy to differentiate between plants which conduct photosynthesis according to the C3 or C4 mechanisms. Moreover, alcohol synthesized chemically can be distinguished from that obtained from natural sources [57].

2.2.3. Endogenous and Exogenous Compounds Distinguished by IRMS

IRMS can also be used in other forensic applications, where it is necessary to detect the source of a certain molecule, not just its presence or absence. Anti-doping studies can serve as an example, since some of the doping strategies are based not on supplying the patient with drugs, but on providing higher amounts of molecules, which their bodies produce endogenously. Among others, testosterone and its derivatives can be supplied to patients in order to improve their performance. However, the sole presence of testosterone cannot be a doping marker, since it is naturally present in a human body. Still, due to variations in both carbon sources and the isotopic selectivity of the processes involved, the 13C to 12C ratio of endogenous and synthetic anabolic hormones is different [51]. A method for determining the origin (endo/exogenous) of prednisone and prednisolone has been developed and validated to WADA standards [58]. Similar methods have been developed for other doping agents [59] and could be also used to verify the origin of drugs of abuse, such as γ-hydroxybutyric acid [52].
Other areas in which IRMS can be used includes the tracing of illicit explosives. While regulated factories add tracing markers to the explosives they produce, it is much more difficult to find the source of illicitly-made explosives, such as triacetone triperoxide (TATP). Analysis of isotopic ratios can be used here, since acetone produced in different parts of the world differs slightly, and it is the sole source of carbon in TATP [53,60]. The method can also be utilized in post-conflict human identification, where it can help to find out which part of the world a certain person comes from, or whether a victim travelled before dying, or even how many peoples’ remains are collected in one place [61].

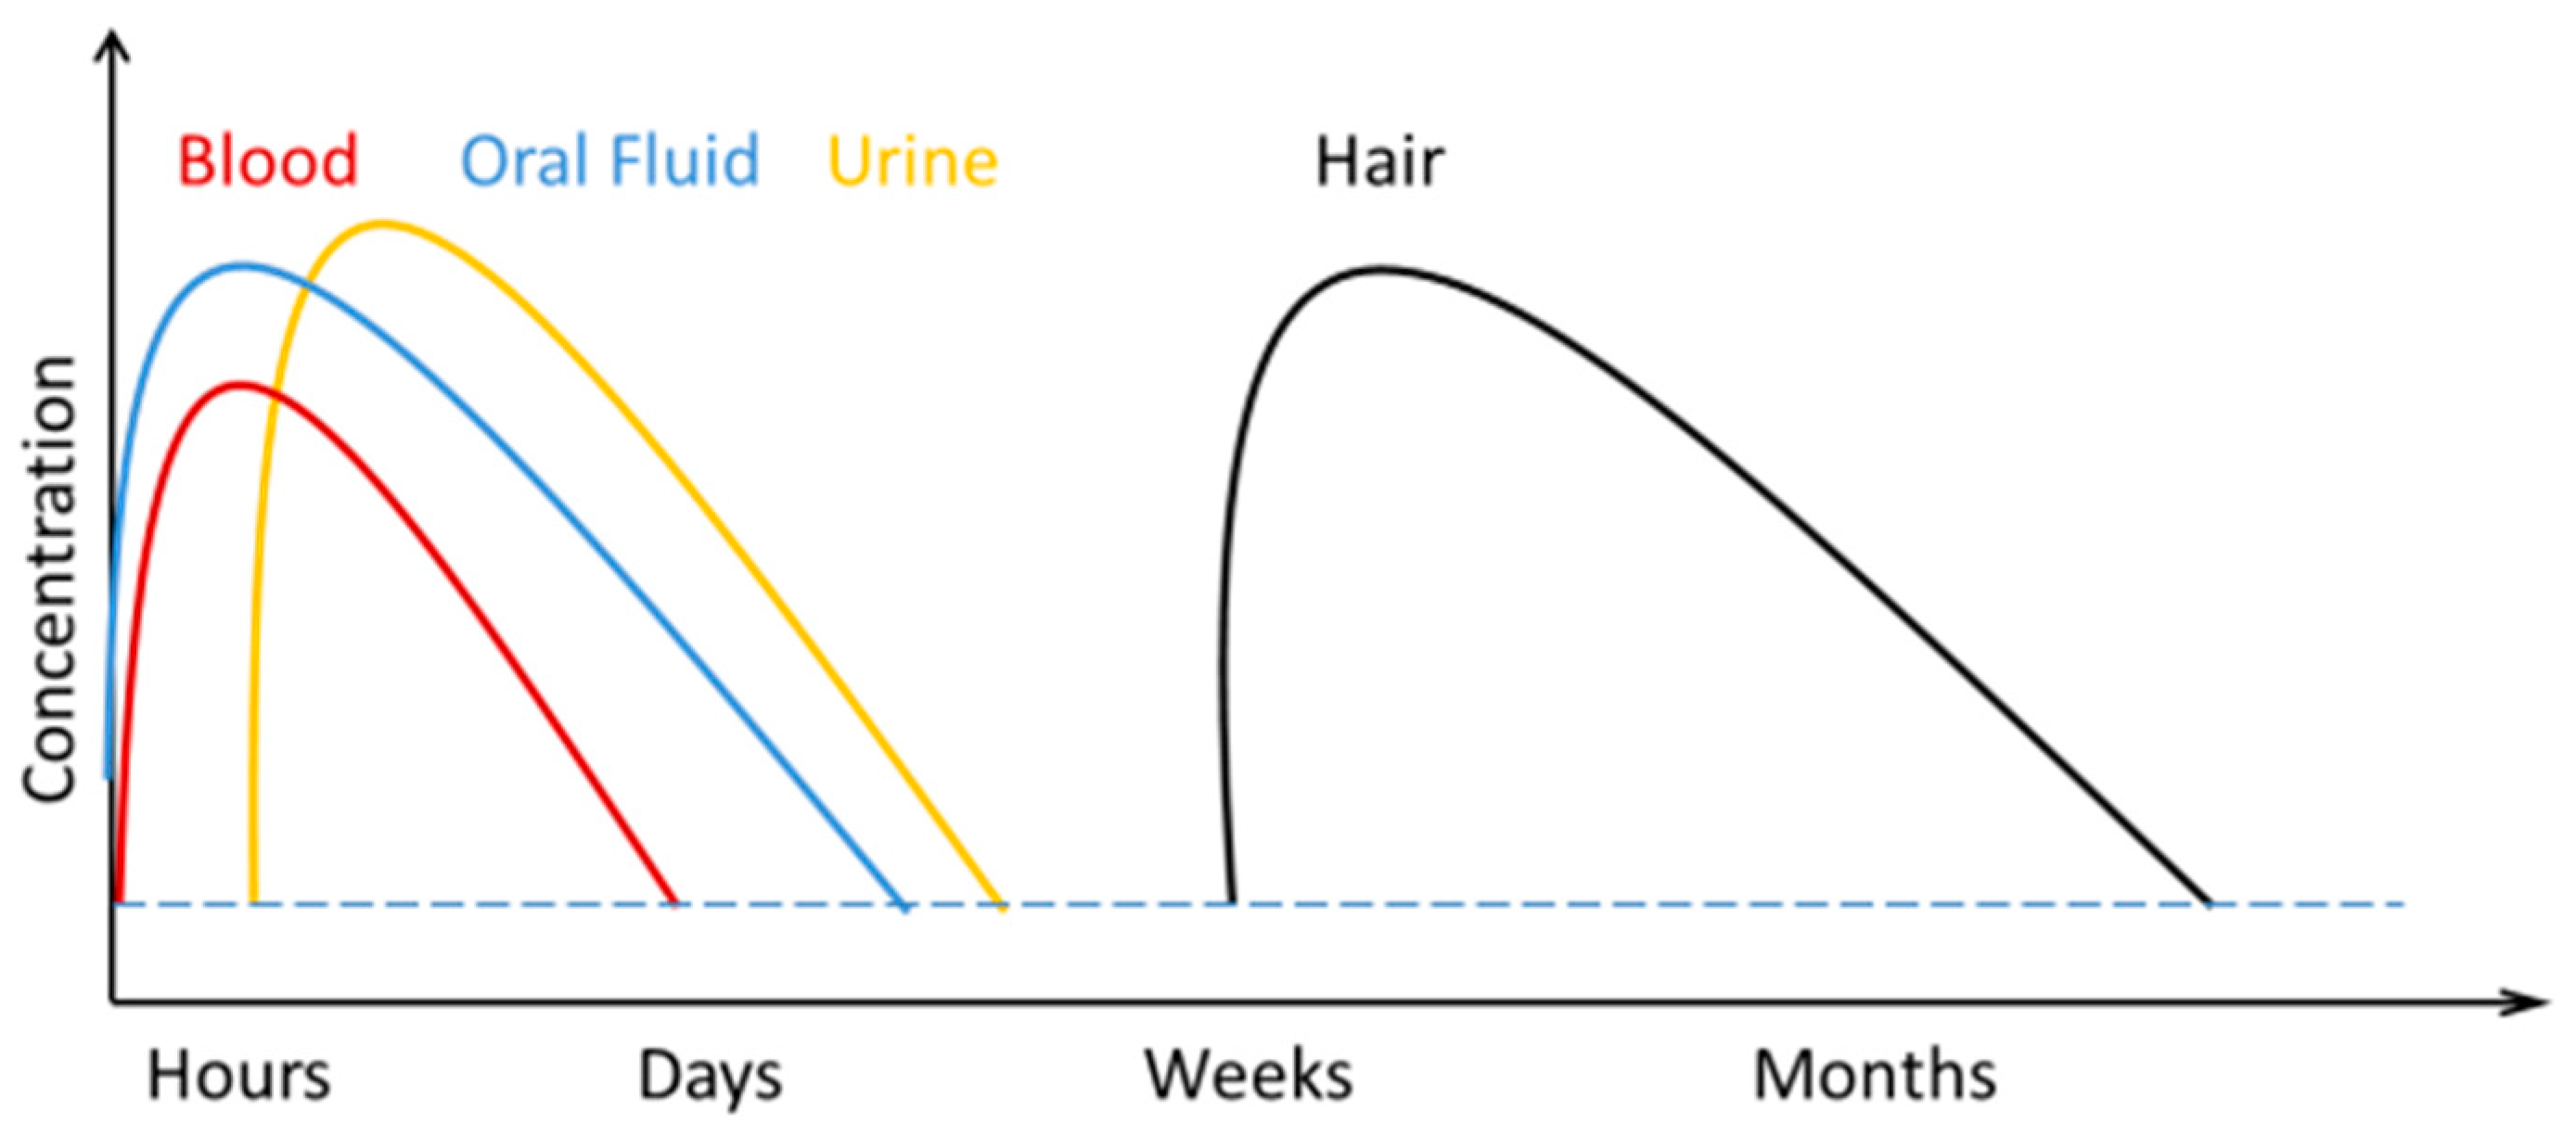
2.3. Alternative Matrices in Toxicological Analysis

The selection of samples in toxicology studies is a critical step in a forensic analysis. The most commonly tested biological matrices for the detection of drug use or exposure are blood and urine. These matrices are well understood and standard operating procedures exist. However, the Scientific Committees of Judicial Organizations (OSAC) recommends the search for alternative biological matrices to improve the results of forensic toxicology analyses [62].
Alternative biological matrices are fluids or biological tissues, which can provide additional information compared to blood and urine analysis. The choice of a matrix is often determined by easier and less invasive sampling, larger detection windows and the complexity of preparation of the analysis [63]. Occasionally, blood or urine samples are unavailable or degraded. In addition, some alternative matrices, such as hair and nail clippings, provide information that blood and urine cannot provide. This is because the hair and nails grow out of the body over time, which makes it possible, through segmental analysis, to detect substances introduced at different times [64].
When selecting a matrix, consideration should be given to the fact that the concentration of the analyzed compounds in such matrices is often significantly lower compared to blood or urine. Therefore, it is extremely important to select appropriate analytical methods. Sensitive analytical instruments and methods using derivatization of investigated compounds allow the detection of drug concentrations at the pg/mL level [62].
Some of these matrices, such as saliva and hair, are already well established and have been implemented in drug testing laboratories. Others, such as meconium, breast milk, and bone marrow, attract attention only in certain situations [65].

2.3.1. Forensic Hair Analysis by Mass Spectrometry

Hair analysis is now routinely used as a tool for detection of xenobiotics (drugs of abuse, pharmaceuticals, environmental contaminants, doping agents, etc.) in forensic science, traffic medicine, occupational medicine, and clinical toxicology. Hair analysis is a powerful tool for toxicological analysis due to the advantages of this type of sample, such as high stability (weeks to years), non-invasive sampling and easy storage [5]. Many drugs are metabolized and excreted in the urine within 2–3 days, whereas their presence in the blood is detectable for approximately 24 h (Figure 4). In chronic (daily) drug users, the expulsion of the metabolite may take up to several weeks. Therefore, even after quantification in urine, it is not possible to determine the amount of drug used and the duration of its use. In addition, the indicated amounts can be confusing due to the diluting effect of the urine. In such situations, hair is often the only way to detect retrospective drug and/or alcohol consumption.
Substances from blood are incorporated into the hair by melanocytes or keratinocytes and spread along the hair as it grows. Drug concentrations in hair have been shown to be related to the melanin content of the hair (dark hair tends to bind more drugs), ethnicity, and the lipophilicity, polarity, and alkalinity of the drug or its metabolites [67]. Melanin is acidic and hydrophobic and therefore has an affinity for alkaline drugs, such as cocaine, codeine, and ketamine.
The average rate of hair growth is about 1–1.5 cm per month, therefore hair analysis makes sense only after a few weeks of taking the drug, but at the same time, the hair makes it possible to identify drugs many months after administration (hair has a large detection window). Moreover, chronic drug use can be assessed by segmental analysis.
Cosmetic treatments, such as regular shampooing, dyeing or bleaching, can have a detrimental effect on the concentration of the drug in the hair. Intense bleaching changes the physical properties of the hair (e.g., higher porosity) and causes partial or complete degradation of melanin, resulting in a reduced drug concentration. Therefore, when analyzing the hair, cosmetic treatments should be considered that can lower the concentration of the drug below the detection limit and thus cause false negative results [68]. Dyed or bleached hair may still be used for drug detection and ethyl glucuronide (EtG) analyses, but it often requires comparison with another sample, e.g., hair from other anatomical areas like pubis, arms, armpits or face [69,70]. Body hair is also used if regular head hair is not available, due to baldness, haircut, and religious, cosmetic or aesthetic reasons [71,72].
The standard use for analyzing hair xenobiotics is gas chromatography and mass spectrometry (GCMS) or tandem liquid chromatography mass spectrometry (LCMS/MS). Such analyses are laborious and time-consuming as they require advanced sample preparation. Hair testing requires the use of sensitive analytical methods that make the cost of the analysis higher than that of other biological samples. All information on the collection, testing, cut-off and presentation of validated results can be found on the websites of the Society of Hair Analysis and The European Workplace Drug Testing Society [73,74].
Sensitive and specific analytical equipment enables the testing of samples in which a low concentration of analytes is expected. Hair analysis can reveal very small amounts of a drug of abuse (Table 3). For carboxy-THC these are pg values and the obtained result is the definitive evidence of marijuana consumption. On the other hand, the segmental hair analysis shows an increase in the dose of the drug or the frequency of use. The study described by Wang et al. [75] showed that the analysis of hair samples of chronic methamphetamine abusers (MA) identified which isomer of the drug was used and confirmed that all respondents used S-isomer of MA (S-MA) continuously. Another example is the detection of gamma-hydroxybutyrate (GHB). It is an endogenous compound that is present in small amounts in the body, but it is also a substance used in drug-facilitated sexual assault (DFSA). Since GHB is endogenous, it can be detected in the hair in low concentrations, which is not crime-related. Therefore, to distinguish endogenous and exogenous GHB, an increase in GHB concentration in the hair segment is required in accordance with the approximate time interval of the event [76]. The analysis of GHB concentration in other matrices is less reliable.
Despite their numerous advantages, the described techniques require a large number of samples and complex preparation processes, including rinsing, derivatization, pulverization, milling, filtration, liquid-liquid extraction, and solid-phase extraction [73]. The whole process is time-consuming and costly, so innovative techniques are sought that can analyze and detect drugs in a single hair.

2.3.2. Special MS Techniques in Hair Analysis

The new analytical approach is a method that uses thermal desorption and ionization mass spectrometry (TDI-MS) to analyze drugs directly in a single bristle. In this method, single hairs are placed on a heated metal ceramic heater, and then a high-voltage direct current and solvent are applied. The xenobiotics in the hair are thermally desorbed and then ionized, transferred to the MS inlet and detected. Typical hair analysis can be done in minutes [77].
Other studies have shown that the DI-SPME/LC-TOFMS method (Direct immersion-solid phase microextraction/LC-TOFMS) is just as fast and effective. It allows simplifying of the labor-intensive and usually complicated process of isolating analytes from a complex biological matrix. This method is suitable for quantitative analyses and SPME fibers can be used repeatedly as no damage is observed after cleaning and conditioning [78].
Another example of a single hair analysis is the laser desorption-assisted ionization mass spectrometry imaging technique (MALDI-MSI). This method proved to be a suitable tool for the analysis of drugs and their metabolites in biological samples [79]. Direct real-time analysis (DART) has also been shown to be a useful technique for rapid screening of drugs of abuse (DOA) in hair samples with minimal sample preparation [80].
Due to the emergence of innovative analytical methods, the amount of hair in the tested samples, as well as the analysis time, is significantly reduced.
Table 3. Recommended substances and maximum cut-off concentrations for confirmation tests in urine, oral fluid and hair. Guidelines for drug testing published by the Society for Toxicological and Forensic Chemistry [81].
Drug NameAbbreviationCut off Level
ng/mL
Approximate Urine Detection TimesApproximate Saliva Detection TimesCut off Level
in Hair
ng/mg
AmphetamineAMP10002–4 Days1–3 Days0.2
BarbituratesBAR3003–10 Days1–2 Days
BenzodiazepineBZO3001–14 Days1–2 Days0.05
BuprenorphineBUP103–5+ Days1–2 Days0.01
CocaineCOC1501–7 Days1–2 Days0.5
EcstasyMDMA5001–3 Days1–2 Days0.2
Ethyl GlucuronideEtG5001–3 Days6–24 h0.3
FentanylFEN50 or 1001–4 Days1–3 Days
Heroin metabolite6-MAM
6-AM
101–2 Days8 h0.2
Marijuana TetrahydrocannabinolTHC503–30 Days6–12 h0.0002
Methadone MetaboliteEDDP3001–7 Days1–2 Days0.05
MethadoneMTD3001–7 Days1–2 Days0.2
MethamphetaminemAMP, MET5001–4 Days1–3 Days0.2
MorphineMOP, MOR, MOP-3003001–3 Days1–2 Days0.2
Nicotine MetaboliteCOT2002–4 Days2–4 Days
OpiatesOPI
MOP
NOR
20001–3 Days1–2 Days0.2
OxycodoneOXY1001–3 Days1–2 Days
PhencyclidinePCP252–30 Days1–2 Days
PropoxyphenePPX3001–7 Days1–2 Days
TramadolTRA10013 Days1–2 Days
Tricyclic AntidepressantsTCA1000 ng/mL1–14 Days *1–2 Days
* detection times depend on specific substance, dose, frequency of use and body parameters.

2.3.3. Unusual Matrices for Special Toxicological Cases

Meconium is the first stool excreted by a newborn. Meconium begins to form around weeks 1–12 of pregnancy and is a very complex matrix whose contents mainly come from the amniotic fluid collected by the fetus. The main advantage of meconium as a biological matrix is a wide measuring window. In addition, the technique is non-invasive and easy, and provides a large amount of sample compared to the amount required for the analysis [6]. Nevertheless, like all complex matrices, meconium requires extensive preanalytical processing to minimize matrix interference and improve detection potential for interesting analytes [82]. The subject of toxicological studies is the assessment of fetal exposure to alcohol and drugs [83]. In meconium, alcohol metabolites EtG or FAEE (fatty acid ethyl esters) can be detected. FAEE do not cross the placenta and are, therefore, found in meconium only if produced by the fetus from ethanol that has passed through the placenta, which reflects the actual fetal alcohol exposure [84]. Other biomarkers are used to identify fetal exposure to harmful chemicals: tobacco (nicotine and cotinine), cocaine, cannabis (THC-COOH), amphetamine, p-hydroxyamphetamine, methamphetamine, heroin, morphine, and codeine [85]. Meconium is a very interesting matrix, but more research is still needed to be able to unambiguously relate the concentration of the drug from meconium to the degree of exposure.
In most cases, blood remains the reference matrix that provides the best toxicological profile of the victim at the time of death. However, blood samples may be limited, unavailable, or heavily denatured. In such cases, matrices alternative to blood, such as vitreous humor (VH), bile, liver tissue or bone marrow (BM), become particularly useful and important materials for toxicological analyses. Bone marrow analysis is especially important because the qualitative interpretation of BM analysis is well established for many xenobiotics [86]. Another alternative specimen recently studied is earwax. Literature reports show that cannabinoids, benzodiazepines, antiepileptic and antipsychotics drugs can be detected in earwax [4]. Its collection is minimally invasive and the detection window is longer than that of urine. Another example of an alternative matrix is synovial fluid obtained mainly from the knee joints. It has been proposed as an alternative matrix for drug/metabolite testing, such as morphine, codeine, cocaine, 6-MAM, benzoylecgonine and ecgonine methyl ester [87].

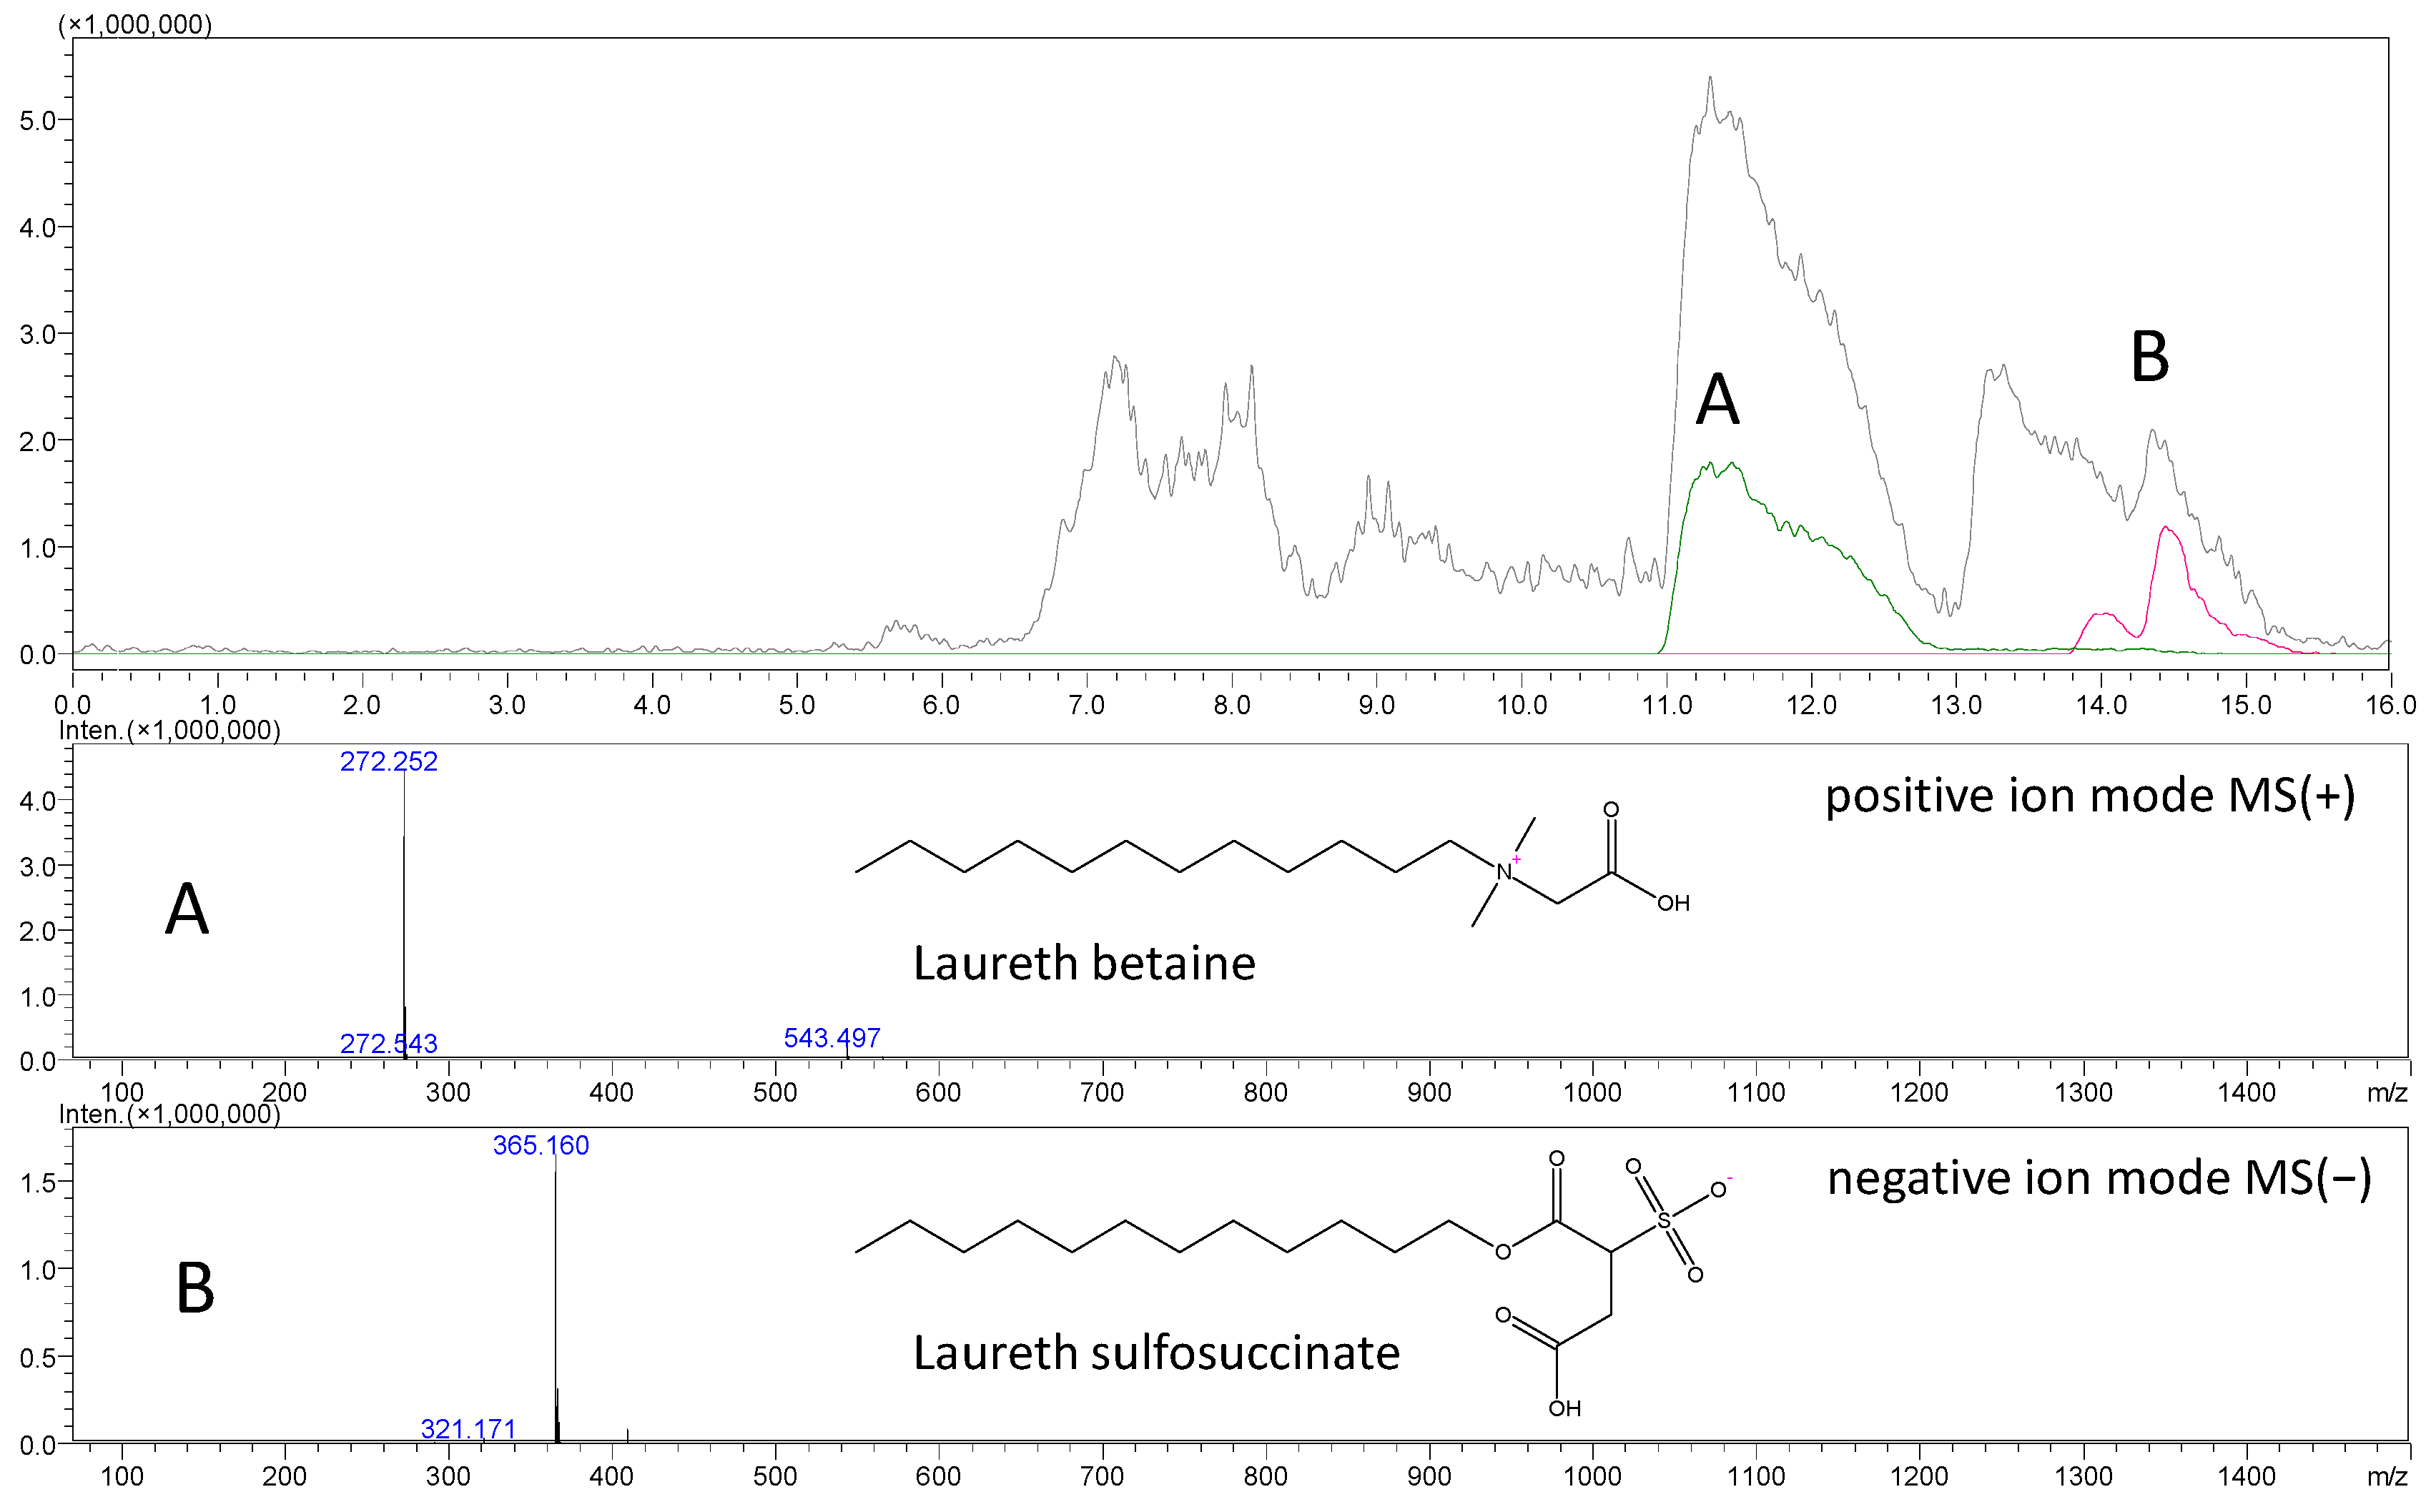
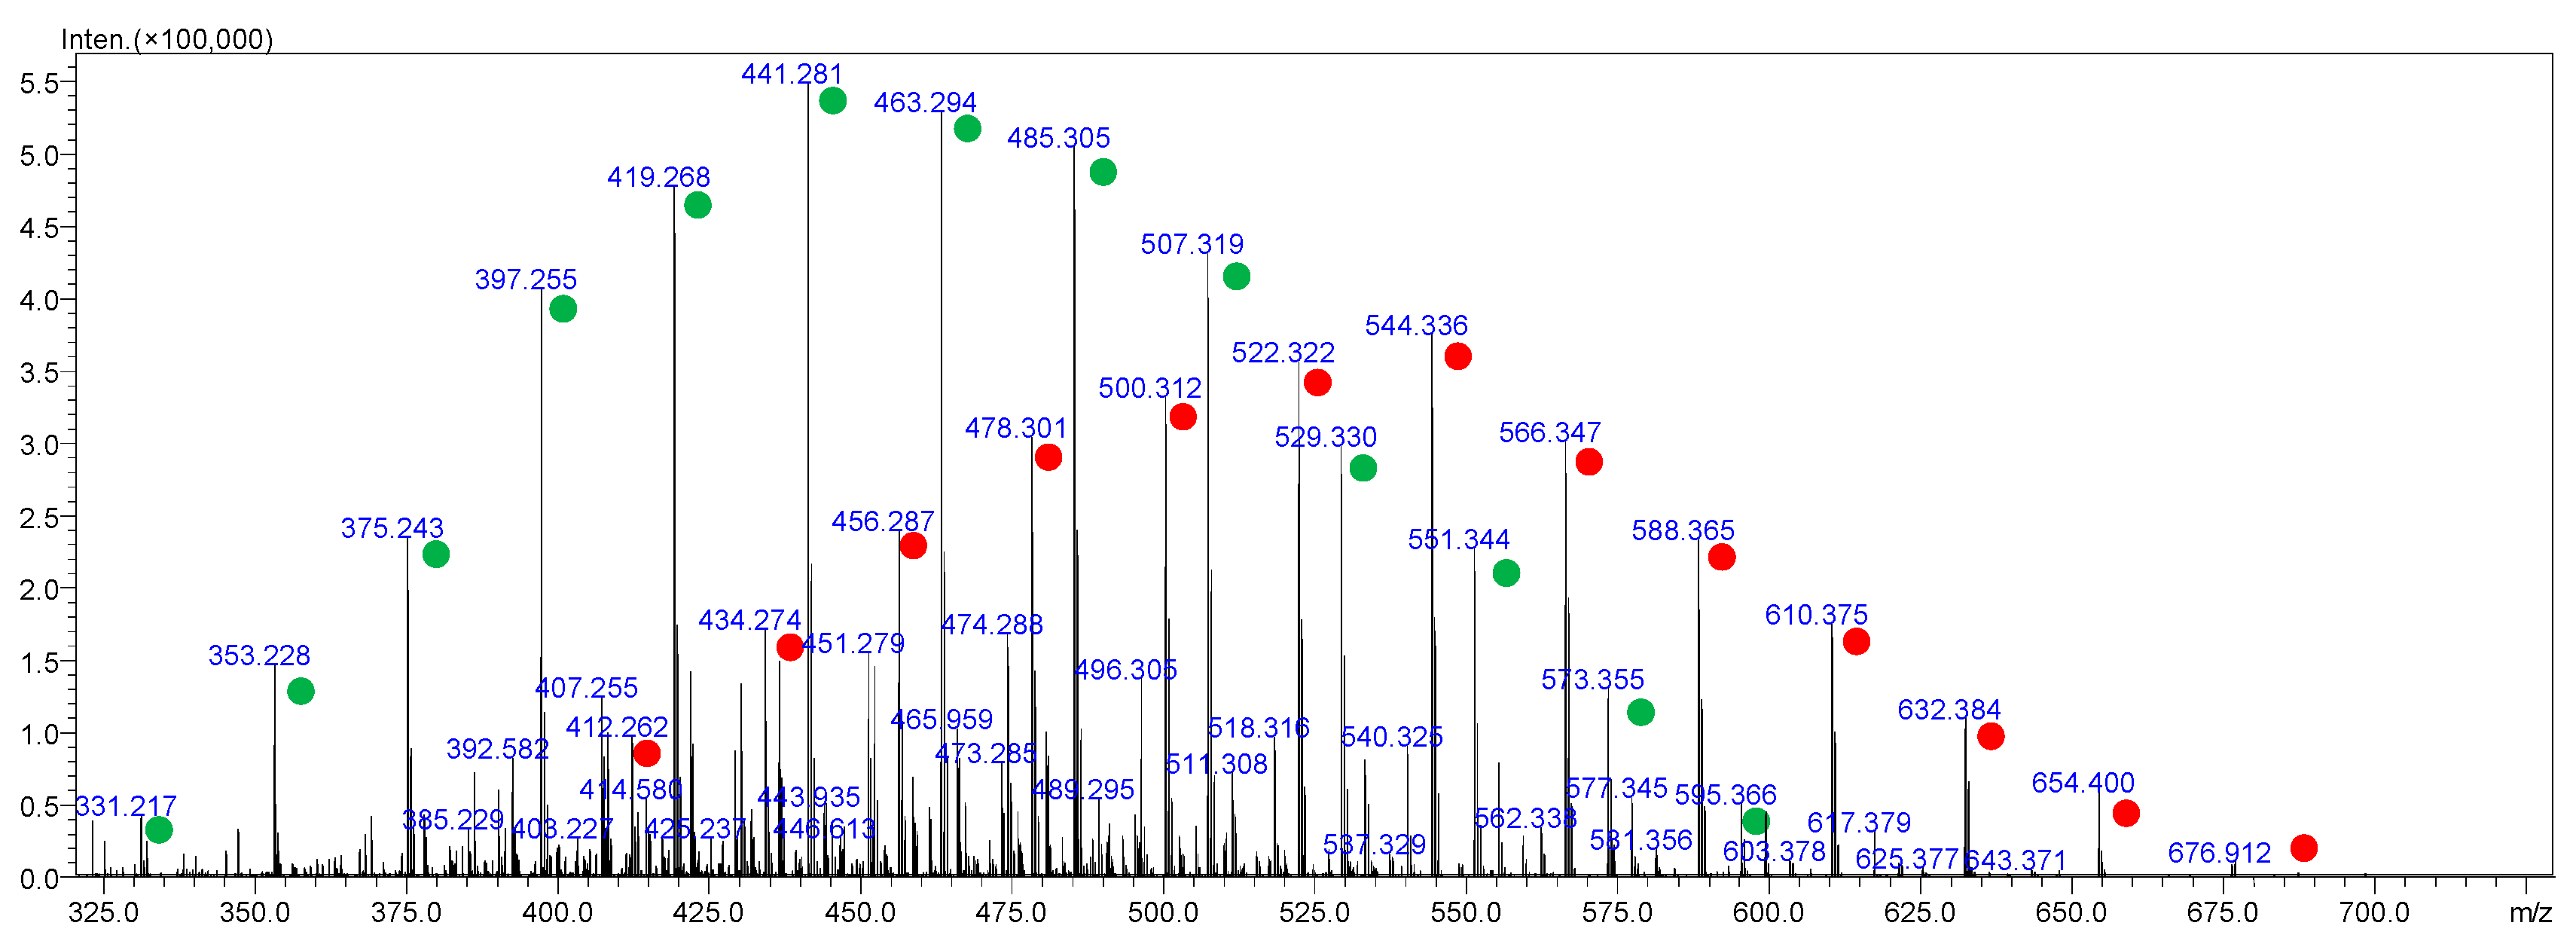
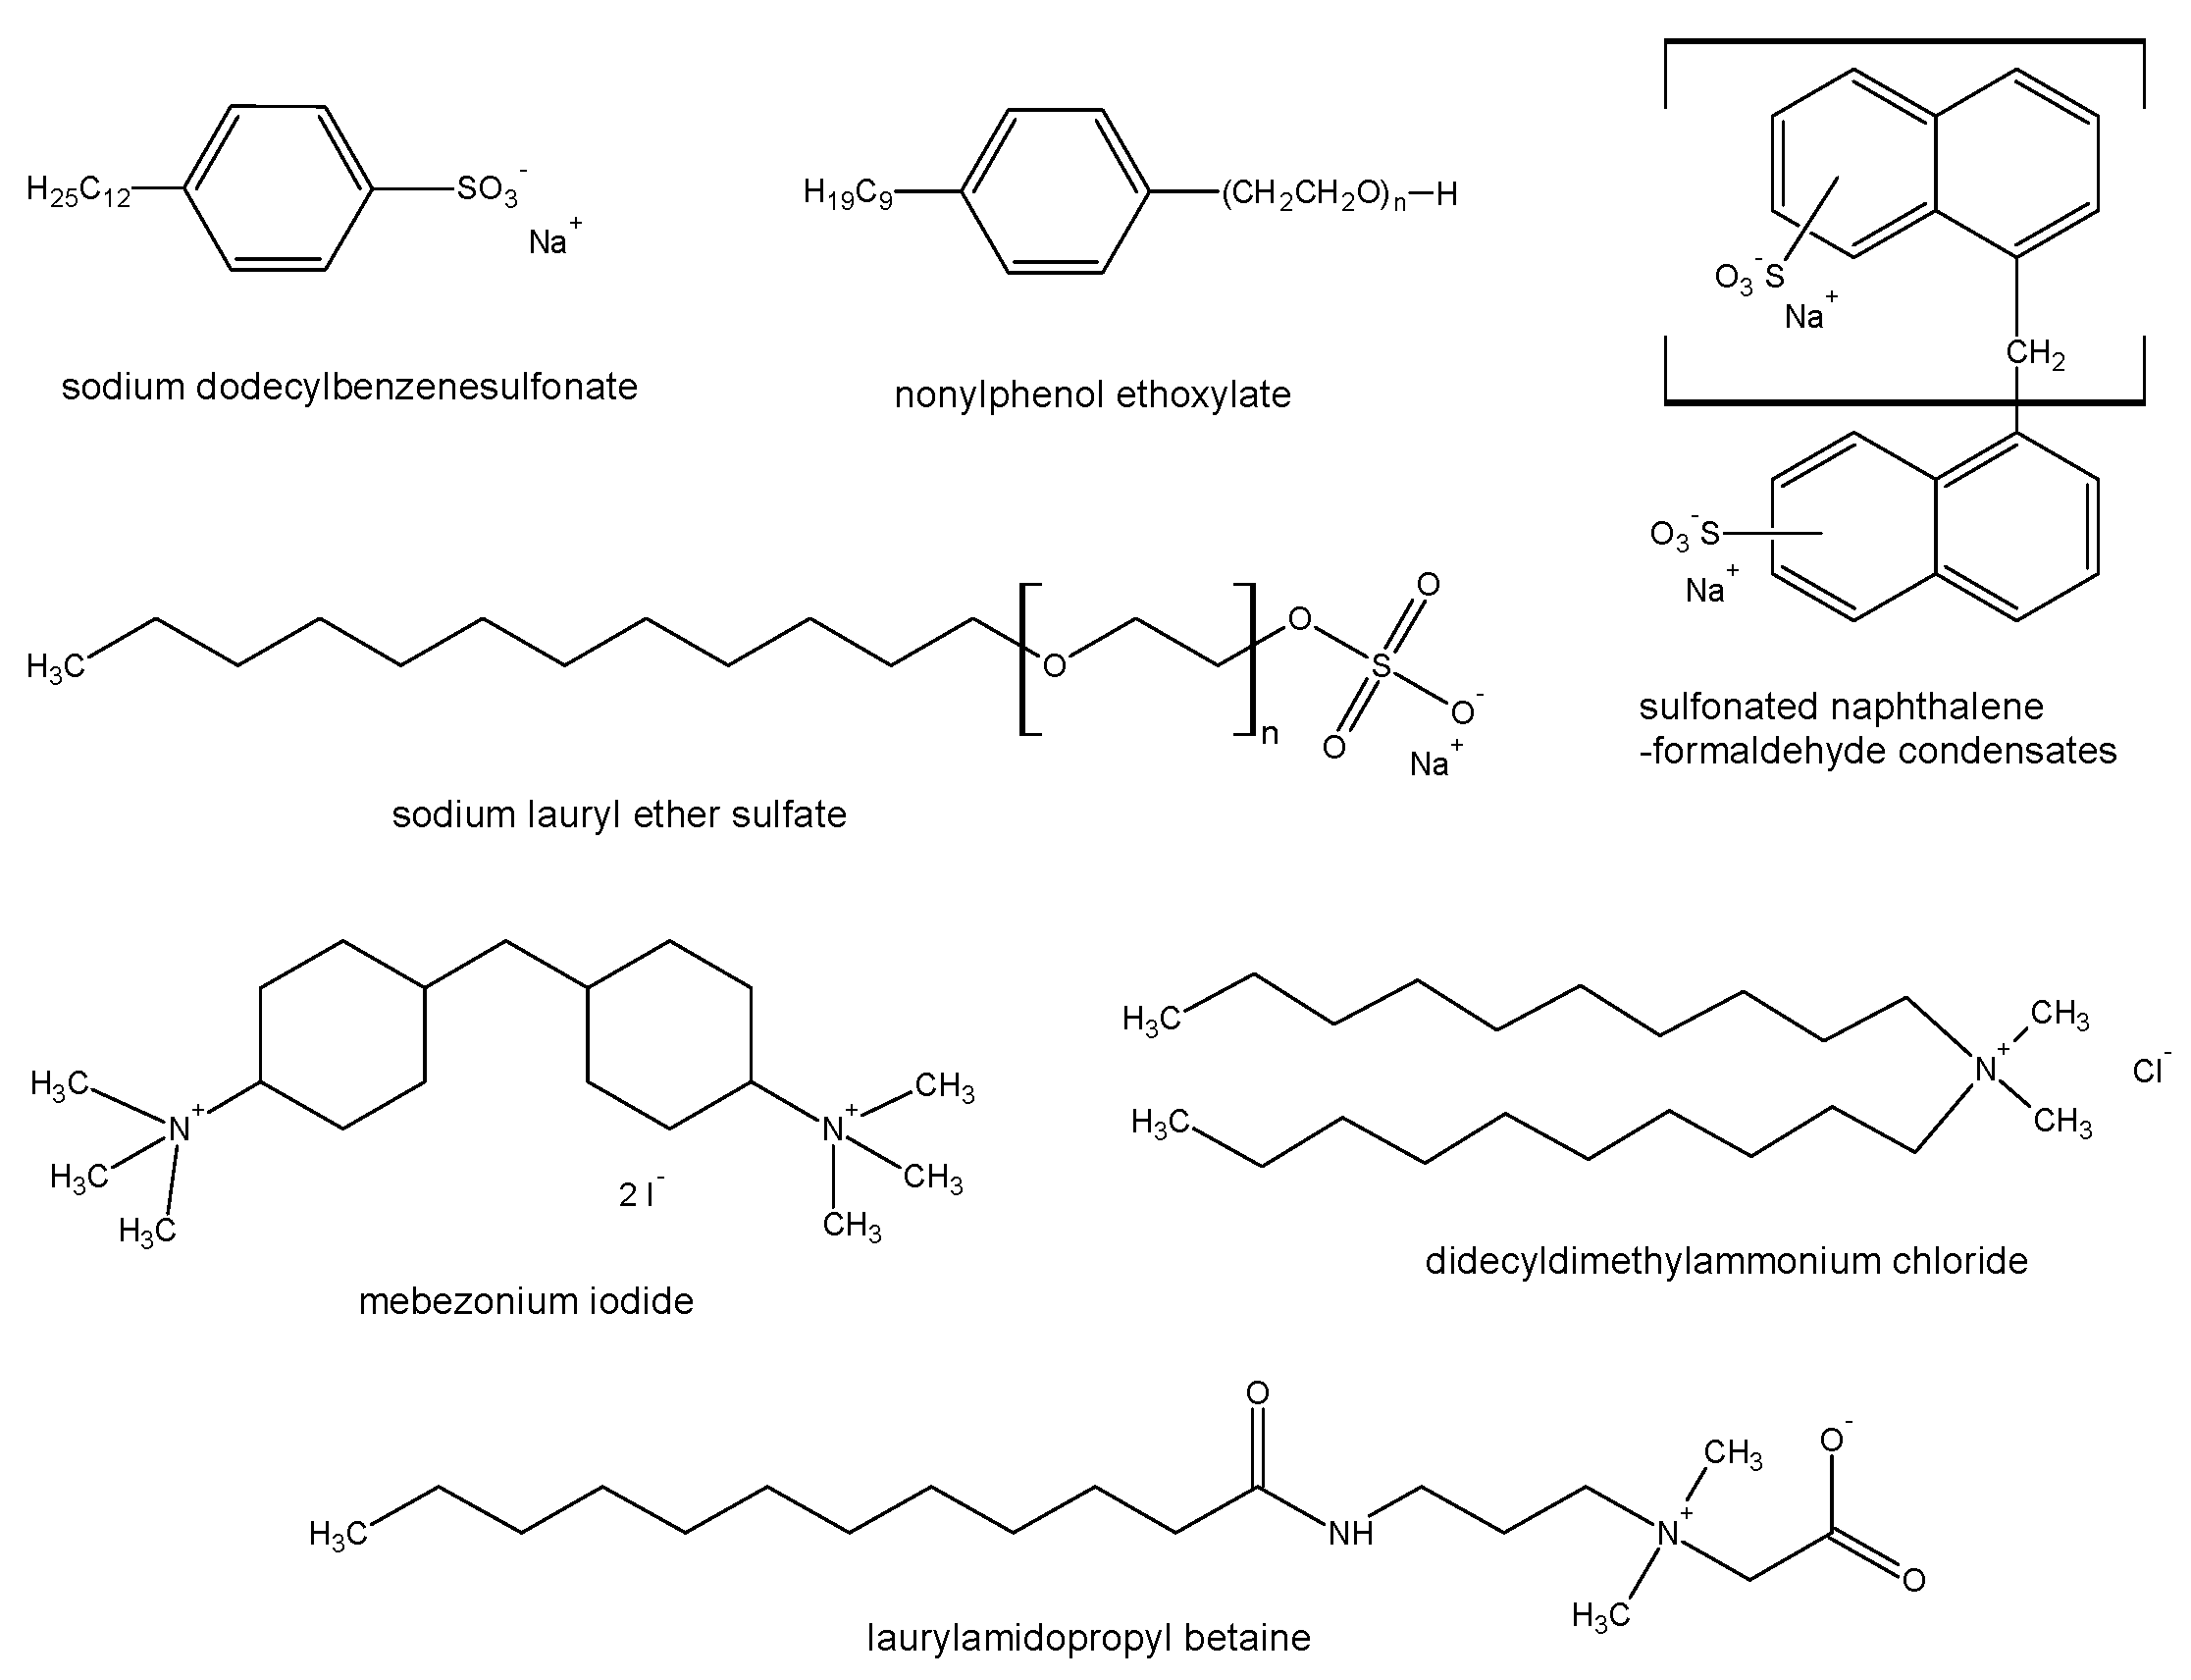
2.4. Surfactants in Forensic Toxicology—A New Analytical Challenge

The presence of permanent charge in a molecule makes it a preferred object for mass spectrometry analysis. If the charge is accompanied by more hydrophobic structural elements, certain physicochemical properties are expected for compounds consisting of polar and nonpolar fragments. Nowadays, surfactants are found in numerous products, from personal hygiene to industrial materials [88]. The broad distribution and structural verisimilitude of these compounds has resulted in the demand for efficient analytical methods for their identification and quantification. Surfactants have been studied as environmental pollutants of human origin [89]. However, toxicological cases of detergent poisoning have drawn attention to their biological activity.
Anionic surfactants, mostly alkyl- and alkylbenzene-sulfonates affect living organisms directly, for example, causing skin irritation (lauryl sulfates), but also increase the solubility of hydrophobic compounds, affecting their bioavailability and potential toxicity. The antimicrobial activity of quaternary ammonium compounds explains their frequent application as efficient disinfectants [90]. The increase in demand for strong cleaning products for both medical and domestic use has resulted in higher environmental impact of quaternary salts, growing bacterial resistance and increased risk of accidental contamination and consumption [91]. At the same time, the development of drug and gene nanocarriers with more biocompatible cationic surfactants requires adequate analytical methods [92].

2.4.1. Mass Spectrometry in Surfactant Analysis

The procedures used in surfactant analysis include electrochemical methods, involving ion-selective electrodes, infrared and UV-vis spectroscopy, and color tests and histochemical examination [93,94,95]. The complex matrices usually require sample preparation and analyte separation before detection. Capillary electrophoresis, as well as gas and liquid chromatography, are used in surfactant analysis [96,97], with a wide range of detectors reported for various applications, including mass spectrometry.
Mass spectrometry is frequently used to study surfactants and products of their degradation [7], due to characterization of molecules by high resolution m/z value (HRMS) and structural information from tandem methods, low detection limits and the benefit of analysis of polydisperse materials even with limited separation. Therefore, mass spectrometry is a method of choice in environmental studies and, with growing impact, in biological systems, especially clinical and forensic toxicology [98,99]. Anionic and cationic surfactants are ideally suited for soft ionization methods in mass spectrometry, with the analysis of [M]+ and [M] ions in positive or negative ion modes, respectively, whereas the non-ionic surfactants could be identified as [M + H]+, [M + NH4]+ or [M + Na]+ ions [100].
There are reports of technical problems associated with LCMS surfactant analysis. Clusters resembling micelles or reversed micelles may affect chromatographic separation, and moreover, studies on gas phase aggregation in ESI-MS and MALDI-MS indicate the formation of aggregates in vapor phase before the high vacuum stage of MS [101,102]. The application of supercritical fluid chromatography (SFC) may ameliorate some of the separation problems and environmental concerns related to HPLC [103,104].
In Figure 5 we present the example of LCMS analysis of ionic surfactants to visualize the discussed problems. The sample of a shampoo was separated using reversed phase HPLC column in water-acetonitrile gradient. The mobile phase was acidified with formic acid (0.1%), which facilitated the zwitterionic betaine detection (panel A) in positive ion mode, and simplified the charge of sulfosuccinate. Although mass spectra confirm the presence of the expected compounds, the chromatogram indicates unwelcome interactions with stationary phase.
Polydisperse materials create additional problems during analysis. The declared composition usually represents the average values of monomer numbers, affecting characterization procedures. Mass spectrometry, especially combined with adequate separation (liquid chromatography in normal or reversed phase mode, size exclusion chromatography) could resolve the series composition. A constant difference between MS signals usually suggests the polymeric nature of the substance, and in high resolution spectra the charge of ions could be calculated, pointing at the mer composition. However, the analysis of the spectra requires a combinatorial approach, as different charges and ionization schemes could be detected. Figure 6 shows an example of polyethylene and polypropylene glycol copolymer (PEG/PPG) analysis, performed in our research group. The mass spectrum was obtained by averaging scans from 0.1 min chromatogram time range. Two series of [M + 2H]2+ ions could be identified, as a combination of 5 PPG units with 8–20 PEG units (green) and 4 PPG units combined with 17–29 PEG units (red). It was interesting that the declared composition was PEG/PPG-17/6. To complicate the issue, in other scans different combinations of monomers as well as ions, formed by protonation and sodium ion capture, were observed.

2.4.2. Surfactants in Forensic Cases

Although the ingestion of anionic or non-ionic surfactants is not deemed dangerous, in certain cases the result could be fatal. According to a report by Hitosugi et al. [105], polyoxyethylene 9-lauryl ether from air freshener was detected in serum and stomach contents of an elderly person with a history of cardiac problems after acute death related to the product’s ingestion. The analysis was performed using LCMS and spectra typical for polydisperse materials were recorded, with the characteristic 44 difference between signals, typical for polyoxoethylene materials, detected.
Another reported fatality resulted from ingestion of an agrochemical spreading agent containing nonionic nonylphenol ethoxylates and anionic sulfonated naphthalene-formaldehyde condensates [106]. Attention was also drawn to adulteration of infant milk formula by household detergents [107]. The studies were directed at reducing the complexity of matrix by extraction and selection of representative surfactant dodecylbenzenesulfonate (C12-LAS) for screening of products. Selected structures of studied surfactants are presented in Figure 7.
Cationic surfactants cause more concern due to biological activity of several quaternary ammonium compounds. Mebezonium iodide is a competitive acetylcholine inhibitor, used in veterinary euthanasia drug T61. Analytical procedures developed for succinylcholine [108] were applied in the case of T61-related suicide [109]. The main problems including hydrophilicity and lack of UV absorbance were countered with SPE on C18 cartridges with heptafluorobutyric acid counterion (HFBA) and LCMS/MS detection. Didecyldimethylammonium chloride (DDAC), used in disinfectants for medical instruments and surfaces, was one of biocides studied in hospital sewage system in Poitiers (France) in 2016 and 2017, using UHPLC-ESI-MS [90].
The deposition of two common components of household washing products, sodium lauryl ether sulfate (SLES) and laurylamidopropyl betaine (LAPB) on human skin was studied using LC-ESI-MS/MS. These surfactants require different approaches for efficient detection in MS, i.e., highly acidic conditions for full protonation of amphotheric LAPB and higher pH for stable ammonium adduct of SLES [110].
The current methods for surfactant analysis and the problems resulting from poly-dispersion of commercial products were discussed in a study on fingerprinting of coceth sulfates in three commercial biodegradable detergents [111]. The direct MS analysis of these sulfate esters of the polyethylene glycol ethers of coconut alcohols confirmed differences in ionization preferences in homolog series.
It is worth adding that mass spectrometry imaging could be used in analysis of surfactants in tissues. The surfactant replacement therapy in lambs with Respiratory Distress Syndrome (RDS) was studied by MALDI imaging after administration of phospholipids and analogs of hydrophobic surfactant proteins (SPs). Both qualitative and quantitative results were obtained, correlating with pulmonary physiological outcomes [112].

2.5. Derivatization as a Tool in Mass Spectrometry Analysis in Forensic Chemistry

Liquid chromatography coupled with mass spectrometry (LCMS) is recognized as a “golden standard” for both qualitative and quantitative analysis [27]. It is capable of separating analytes (LC) and measuring mass-to-charge ratio with high selectivity and sensitivity (MS). The choice of a widely applicable ionization technique, such as electrospray ionization (ESI), also affects the versatility of this method [113]. However, poor ionizability, low ESI-MS response, and decomposition in the ion source or during the separation, can negatively impact LCMS analysis. Sometimes problems occur due to lack of an ionizable functional group, rigid structure or high polarity of compounds, as well as matrix effects that influence ionization efficiency [114].
It is possible to improve LCMS analysis performance by conducting chemical derivatization. The chemical labeling reaction relies on adding a derivatizing reagent to the analyte, which contains in its structure a marker part (chromophore, fluorophore or a charge tag) and an active fragment through which the connection with the analyte occurs. As a result of the performed reaction, a derivative is formed containing a group in its structure that gives an analytical signal compatible with the detector [115].
A good derivatizing reagent should be characterized by high selectivity, as it must produce derivatives only with one compound or compounds with a selected functional group. The reaction itself should be efficient and conducted in mild conditions, and the obtained product should produce a linear detector response with increase in concentration [115].
Although different analytical methods (HPLC, GC, MS) have different requirements towards derivatization, the reagents can be divided according to their properties [115]:
  • compounds absorbing light in the UV-Vis range, introducing chromophores into the molecule;
  • fluorogenic reagents, compounds which do not exhibit fluorescence on their own, but they acquire this ability under the influence of reactions with appropriate compounds;
  • fluorescent reagents introducing fluorophores;
  • reagents capable of redox reactions;
  • reagents that introduce a permanent charge to the molecule
The derivatization reaction may be performed before or during the analysis of the test sample. When discussing this process in relation to liquid chromatography, we can consider pre-column, column and post-column derivatization [115]. In forensic analysis and toxicology, low sample concentration and poor analyte ionizability are among the biggest obstacles, therefore many new derivatizing reagents are developed.

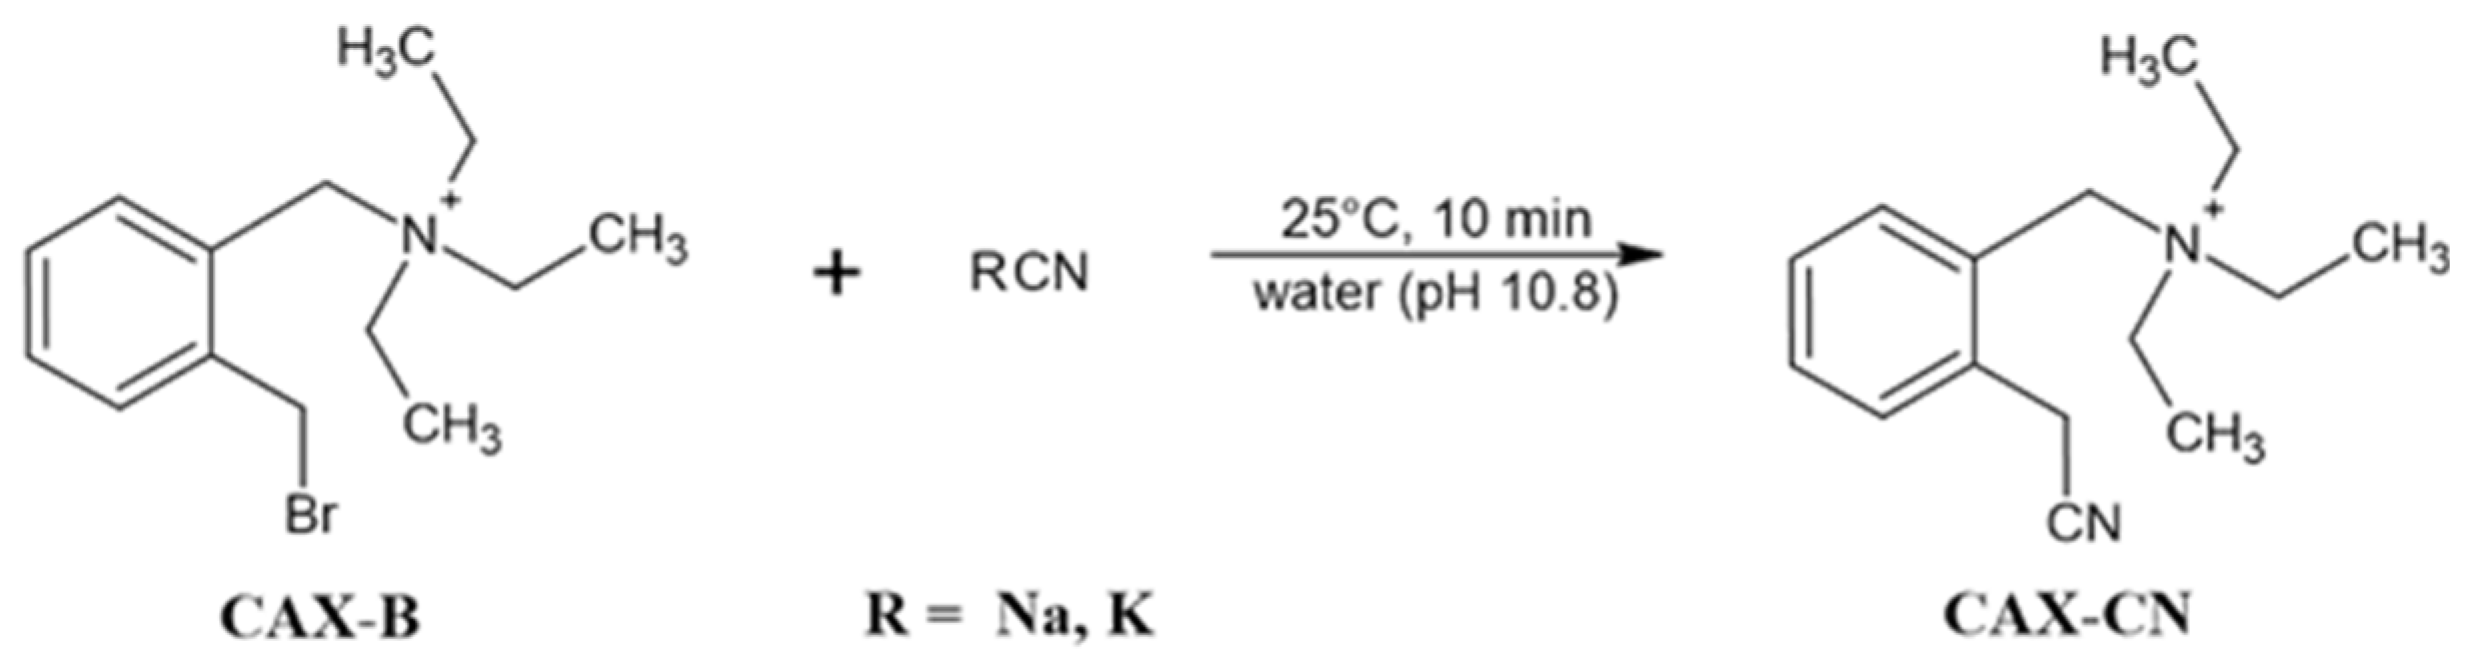
2.5.1. Derivatization in Cyanide Analysis

Cyanide is a well-known and highly toxic compound that is used as a poison and a chemical warfare agent. Nowadays, it is present in many industrial areas, for example smelting, mining or plastic production, which may result in environmental pollution. Whereas high dosage poisonings are relatively easy to detect, chronic poisoning resulting from trace level contamination can be more challenging. Additionally, poor retention in chromatography and low mass mean it is difficult to detect the cyanide ions directly [116]. Moreover, in the human body cyanide ions undergo various transformations and can be stored or dissolved in blood, at different concentrations in specific parts of the circulatory system. Derivatization can solve problems of cyanide detection [3].
Giebułtowicz et al. [3] took advantage of cyanide ion conversion into 2-aminothiazoline-4-carboxylic acid (ATCA) and used it as a marker of cyanide exposure. Unfortunately, the analysis of unmodified samples showed many interferences in proximity to ATCA signal. By derivatizing the matrix components with N-(4-nitrophenoxycarbonyl)-L-phenylalanine-2-methoxyethyl ester (S-NIFE) and 5-(dimethylamino)naphthalene-1-sulfonyl chloride (DNS) (Figure 8) they were able to purify the sample, and develop and validate a quantitative method of ATCA analysis in postmortem blood.
Another example of cyanide ion derivatization is presented by Madmon et al. [116]. They used N-(2-(bromomethyl)benzyl)-N,N-diethylethanaminium bromide (CAX-B) as a derivatizing reagent to develop a method for analysis of a low concentration of free cyanide ions in water. The reaction (Figure 9) was conducted without previous purification. The limit of detection (LOD) was reported at 0.02 ng/mL.

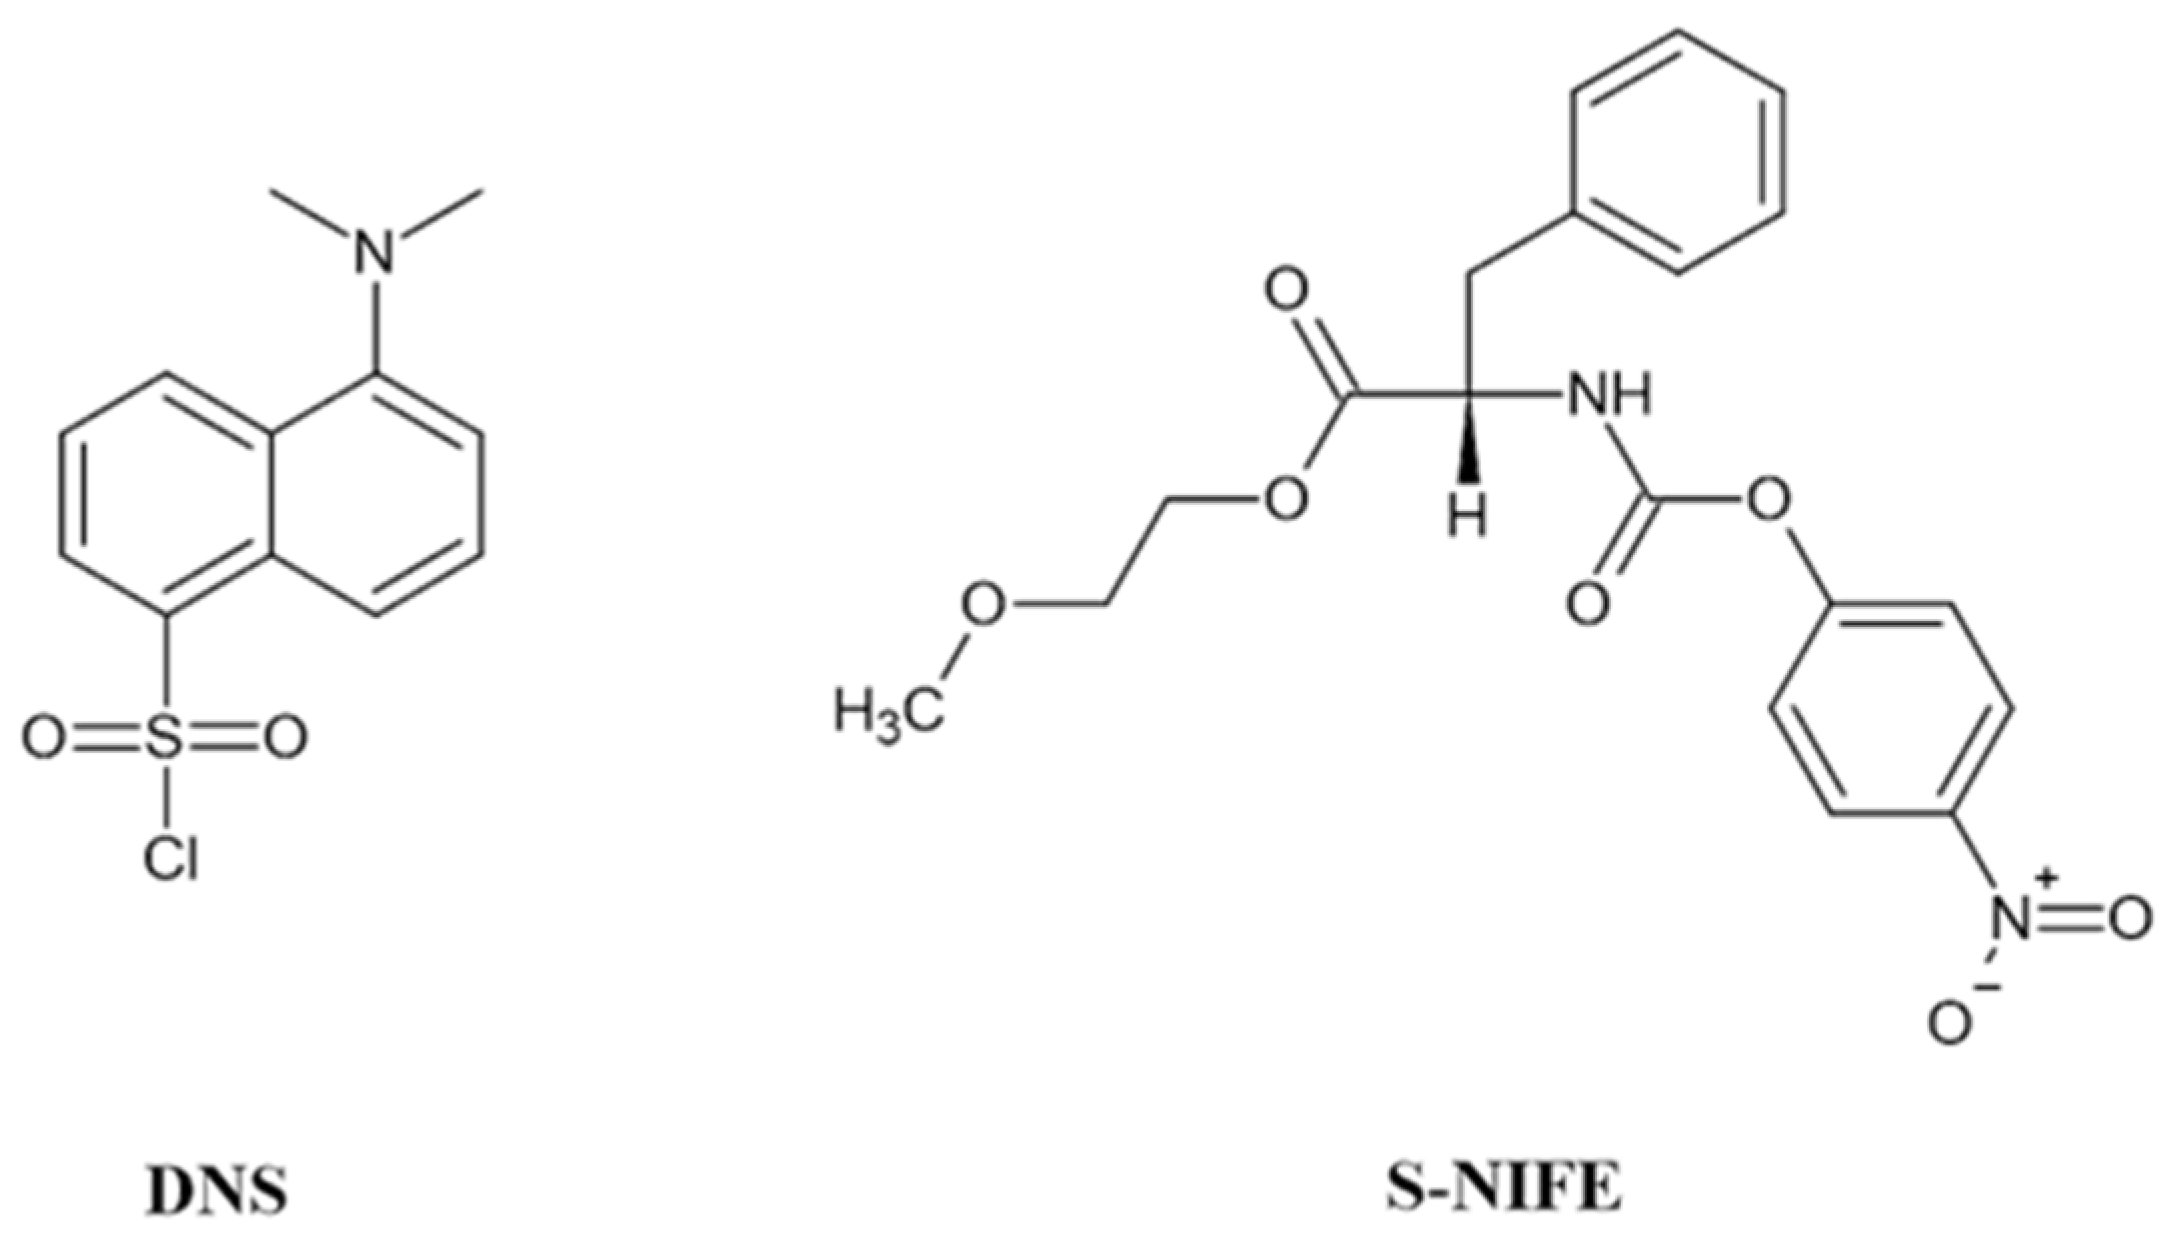
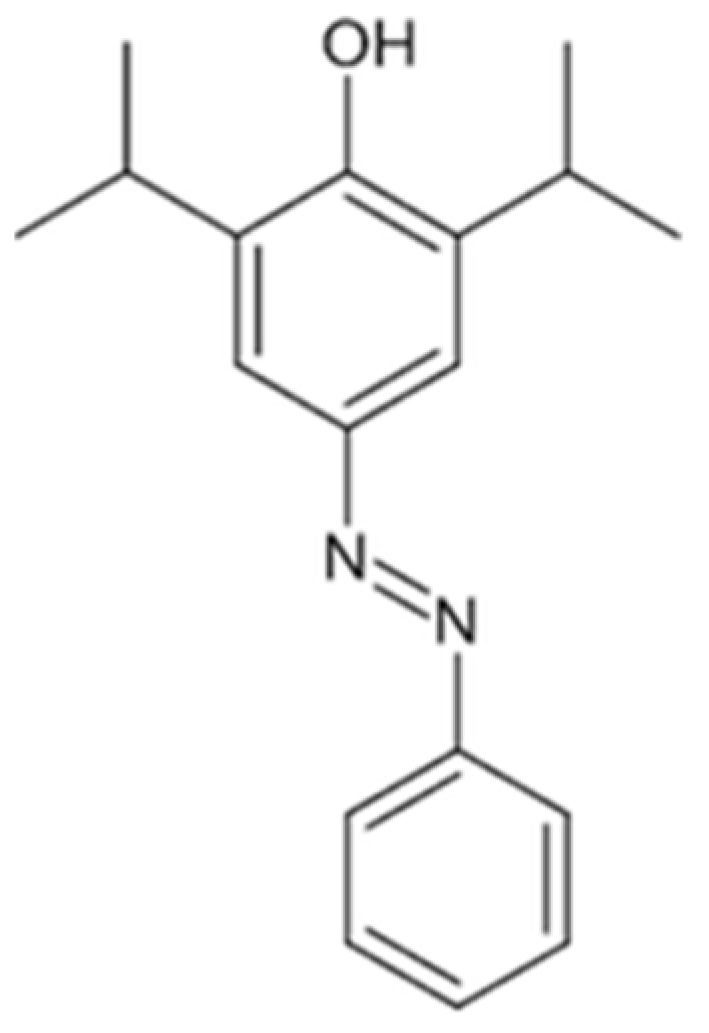
2.5.2. Derivatization of Propofol

Among hypnotic agents used in anesthesia, propofol is favorable, due to its mild side effects, causing lower induction of nausea, vomiting and postoperative drowsiness. However, usage of propofol can lead to developing dependence and nonmedical use, which can then lead to overdosing. Propofol influences the central nervous and respiratory systems and overdose can result in respiratory failure, cardiac arrythmia or death. Due to the ecstatic and euphoric feeling it provides, propofol can be consumed occasionally as a recreational drug, adding importance to development of a fast and selective analysis method [117].
Due to its chemical properties (low polarity and volatility) propofol is difficult to ionize in an electrospray ion source (ESI) in both positive and negative ion modes. Vaiano et al. [117] tried to improve ionization and detection of propofol by using a new type of derivatization agent–diazonium salts. They used azo coupling reaction to attach aniline based diazonium salt to propofol (Figure 10), which resulted in retention time shift and improvement in ionization yields, both for positive and negative MS ion mode. A quantitative method of propofol analysis was developed using this ionization yield improvement, with pg/mL concentrations in urine and ng/mL in blood. In 2017 Vaiano applied this derivatization method to detecting propofol in hair [118].

2.5.3. Derivatization of Carbonyl Compounds

Compounds containing a carbonyl group are widely present in organisms as metabolites of multiple pathways, such as the citric acid cycle, glycolysis and fatty acid oxidation, resulting in production of aldehydes, ketones, keto acids and other carbonyl compounds [119]. Ingestion of exogenous substances, including some performance-enhancing drugs [120], psychoactive substances, cathinone and cathinone derivatives, also delivers chemicals with carbonyl moiety into organisms [121]. Carbonyl compounds constitute a large group, highly diverse in their physical and chemical properties. The differences in their solubility, stability, volatility and concentrations pose a great challenge in quantitative analysis. Therefore, many new derivatizing agents have been developed [119]. Additionally, Sun et al. investigated differences between pre-column and post-column derivatization in LCMS analysis [119]. In Table 4, some examples of reagents used to derivatize carbonyl compounds are presented.

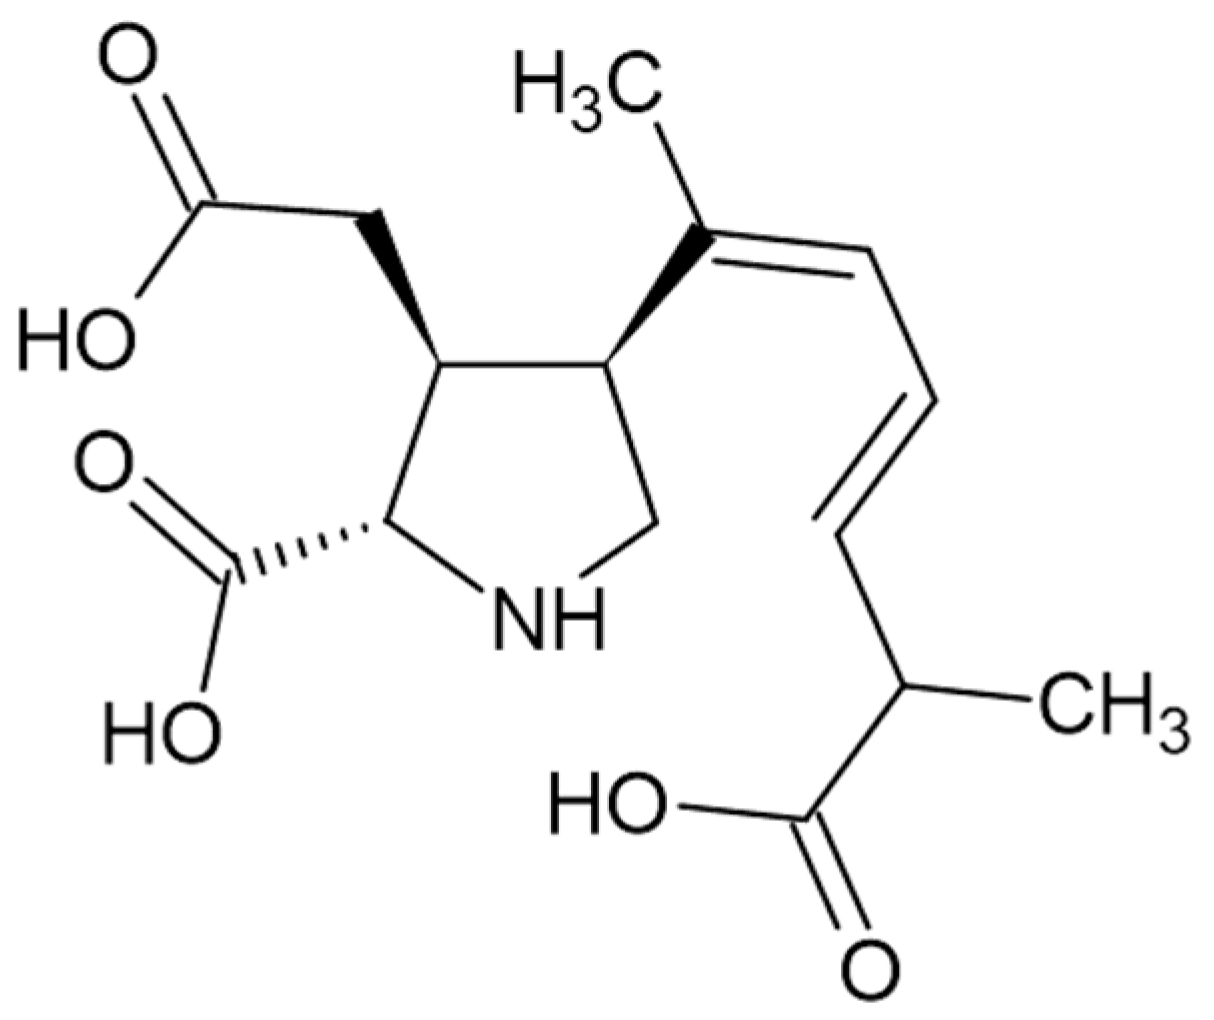
2.5.4. Derivatization in Analysis of Neurotoxins

Sarin, Soman, Cyclosarin and Tabun are G-type nerve chemical warfare agents. They are potent neurotoxins that bind to acetylcholinesterase (AChE) blocking its activity, manifesting in devastating SLUDGE syndrome, which can result in death. Sarin is the most frequently used, as well as the most reactive of all G-type nerve agents. In general, G-type nerve agents are highly unstable and bind to AChE and other proteins leaving only a small amount of non-bound molecules in blood. Aviram et al. [122] tried to develop a new method for the analysis of trace amounts of free G-type nerve agents from dried blood spots (DBS). The derivatization reaction was conducted directly on DBS and then product was extracted and analyzed by LCMS. The 2-((dimethylamine)methyl)phenol (2-DMAMP) was used as a derivatizing reagent (Figure 11). It was discovered that the best method of derivatization was to prime DBS paper with 2-DMAMP first and then apply the blood sample. That approach not only resulted in good yield of derivatized free G-type nerve agent, but also allowed storage of the sample for up to 19 days at room temperature.
2-DMAMP was also used for detection and identification of G-type nerve agent traces in environmental matrices. During their research, Weissberg et al. tested various solvents, obtaining the best results for water. This method was used to analyze environmental samples exposed to G-type nerve agents, such as asphalt, linoleum, cloth and concrete, which resulted in LOD between 0.8 and 20 pg/cm2. The other sample was earth, in which they detected nerve agents on a 4 pg/g level [123].
Shellfish and seafood are popular foods that can be contaminated by ingesting diatoms. The contamination may result in the presence of domoic acid–a natural neurotoxin found in Pseudo-nitzschia (of diatom genus) (Figure 12). Consumption of the contaminated food can cause acute intoxication or even death, therefore the upper limit of domoic acid in shellfish has been established at 20 mg/kg of edible tissue. Beach et al. [124] developed a method of qualitative analysis of domoic acid by derivatization with dansyl chloride, which resulted in a 5-fold increase in molar response in MS, as well as improved chromatographic behavior.

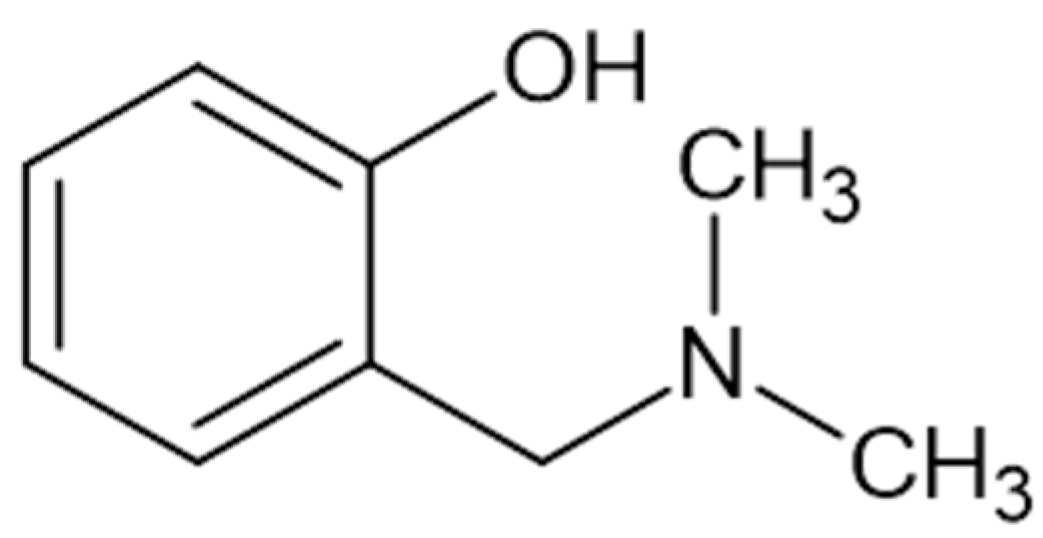
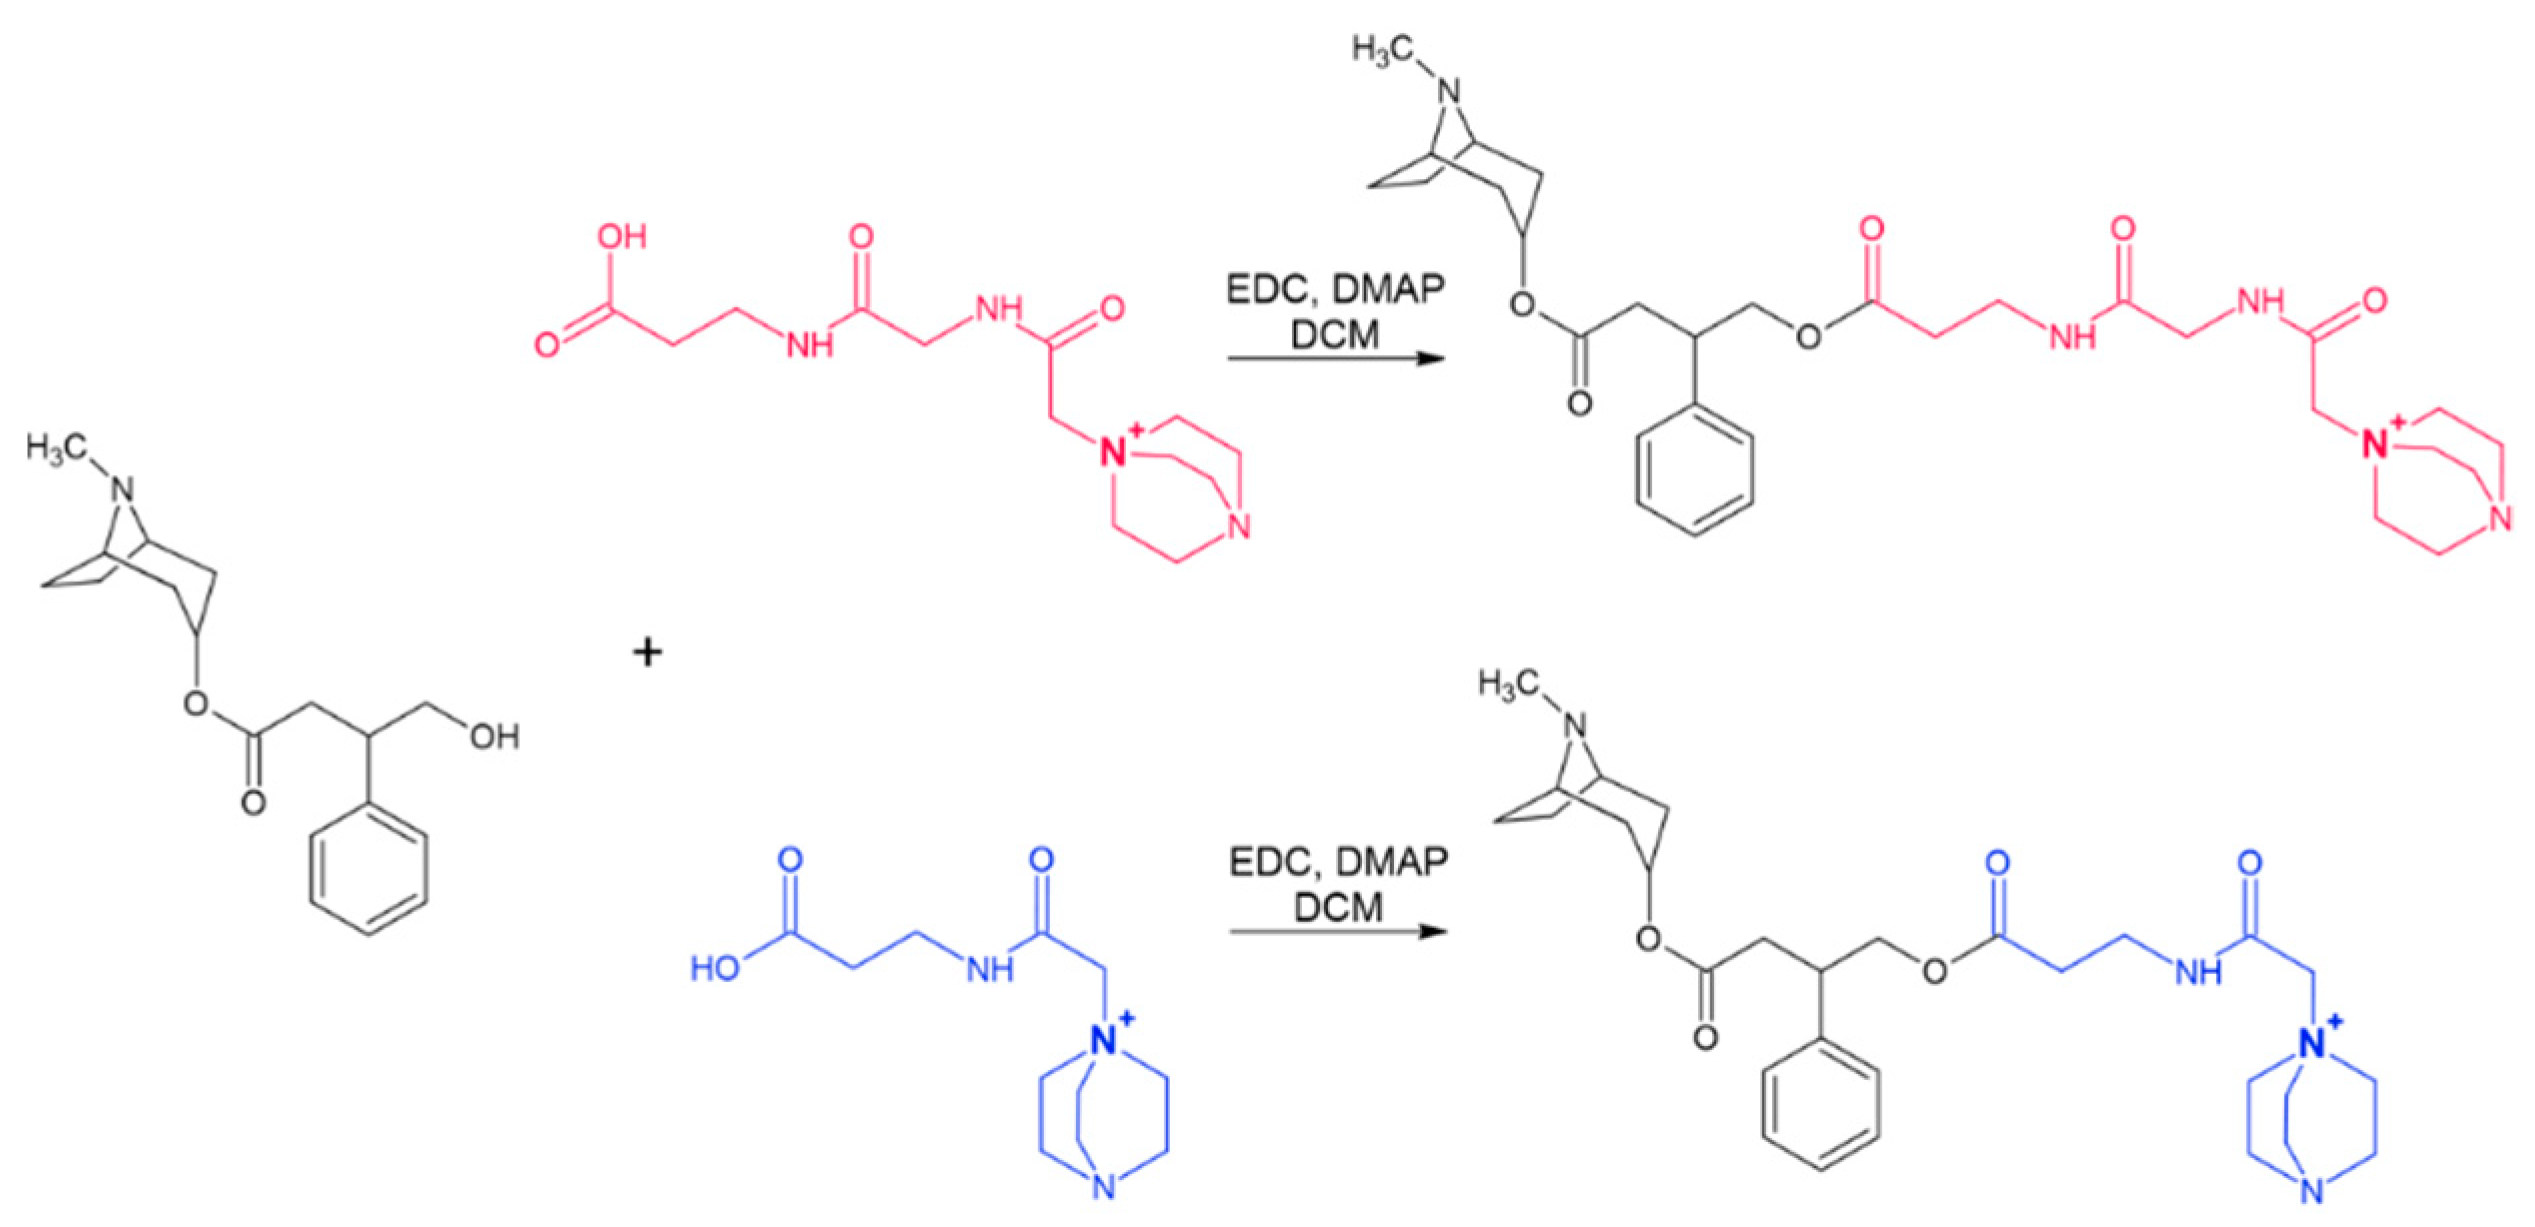
2.5.5. Derivatization of Alkaloids: Atropine

Atropine is a tropane alkaloid which occurs naturally in certain plants from the nightshade family (Solanaceae), such as belladonna (Atropa belladona), jimsonweed (Datura stramonium) and henbane (Hyoscyamus niger) [125]. It is used in medicine and is on the WHO Model List of Essential Medicines, the most important medications needed in a basic health-care system [126]. While atropine saves life, it is still a health and life-threatening alkaloid [127,128,129,130]. Moreover, the Report of the European Centre for Drugs and Drug Addiction (EMCDDA) for 2004–2005 showed that cocaine distributed on the European market contained 28–72% atropine and caused numerous deaths and acute intoxications [131]. For these reasons, atropine identification and quantitation are important in clinical and forensic toxicology.
Several analytical techniques were developed for quantification of atropine in a variety of matrices [132,133,134,135,136,137]. GCMS is a frequently used method for determination of atropine [137,138]. However, atropine is thermally unstable and could be overlooked due to its degradation, therefore other analytical methods which provide simple, sensitive and selective determination of atropine are needed [138].
Since it is not easy to analyze extremely small quantities of atropine, new tags for selective detection of this compound are required. Recently, we developed new ionization reagents based on quaternary ammonium salt (QAS) that can successfully be attached to the hydroxyl group of atropine [139].
Our previous study evidenced that the introduction of a tertiary amine, such as 1,4-diazabicyclo[2.2.2]octane (DABCO) or 1-azabicyclo[2.2.2]octane (ABCO), to peptides increases ionization efficiency in ESI-MS and lowers the detection limit to low attomole [140,141]. Moreover, our results indicated that QAS-peptides containing ABCO or DABCO groups were more stable during MS/MS experiments [140]. Therefore, we designed and synthesized new ionization tags based on 1,4-diazabicyclo[2.2.2]octane as an ionization enhancer group. Each of our new reagents consisted of 1,4-diazabicyclo[2.2.2]octane moiety combined with a dipeptide or tripeptide linker. As shown in Figure 13, the hydroxyl group of atropine could react with the carboxyl groups of the derivatization reagent to form a covalent compound with EDC and DMAP, used as the coupling agents. The obtained mass spectra revealed the characteristic signal corresponding to the molecular ion of the desired compound.
Our preliminary results clearly indicated the possibility of using the proposed ionization tags for the chemical derivatization of atropine.
The derivatization methods for the LCMS analysis of compounds important in forensic studies have been intensively studied, resulting in procedures for detection of GHB [142], cannabinoids [143,144], amphetamine, methamphetamine [145,146] and other drugs of abuse [147].

2.6. Internal Standards in Quantitative LCMS Analysis in Forensic Toxicology

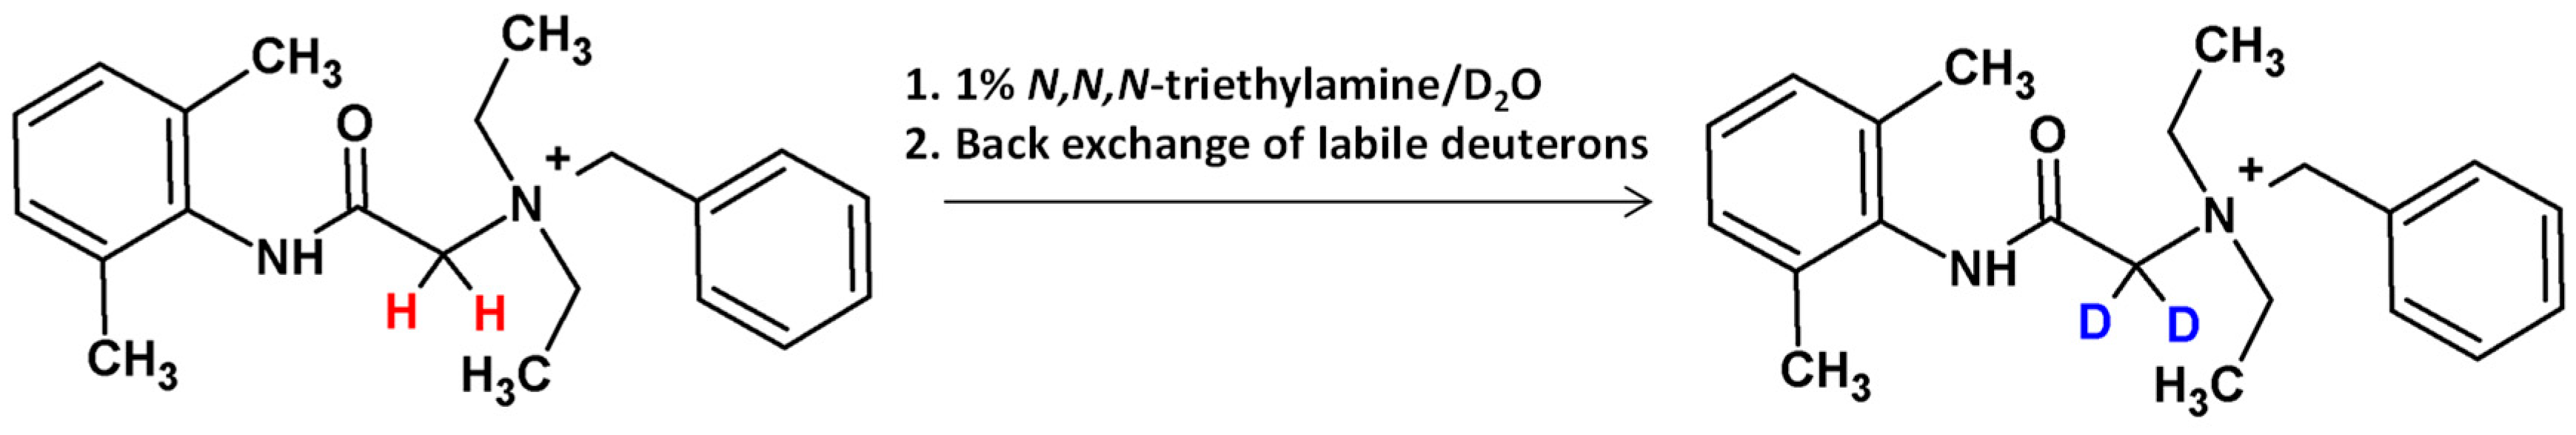
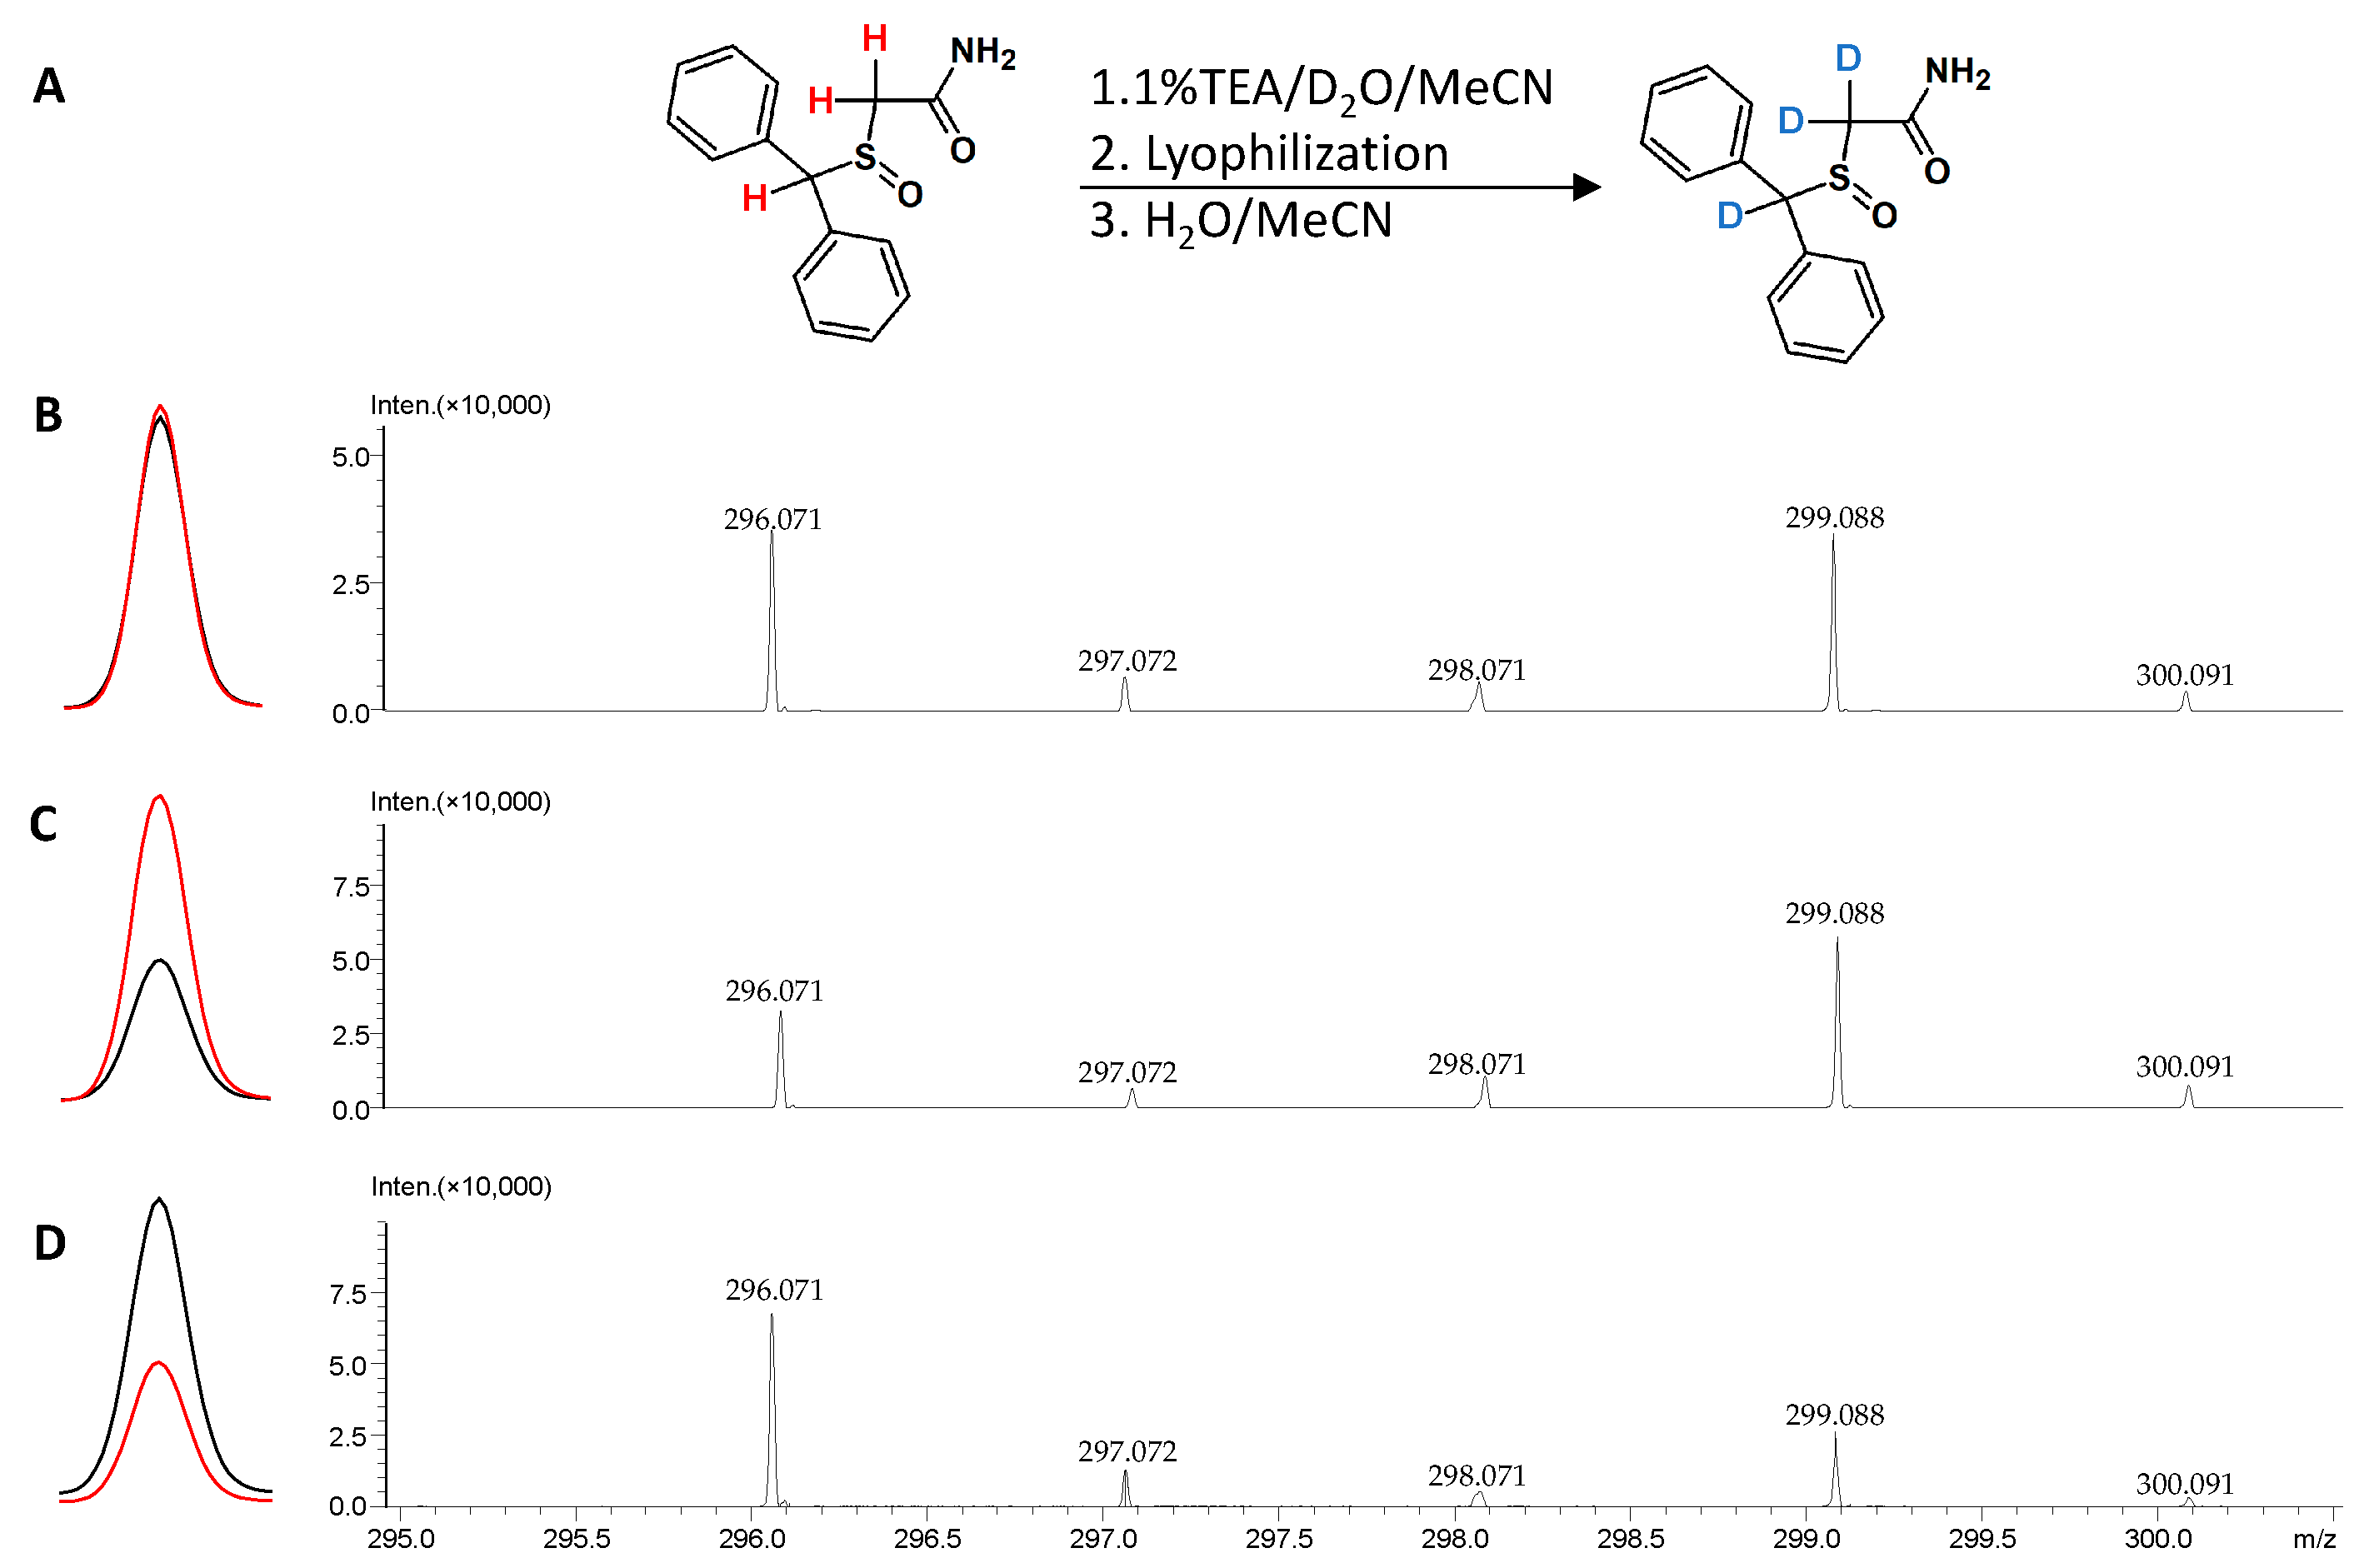
2.6.1. Isotope Labeling: Hydrogen-Deuterium Exchange

Hydrogen atoms located in the backbone and side-chain functional groups of chemical compounds are easily exchanged with protons from the solvent [148]. In the presence of a deuterating agent, the source of dissociating deuterons, i.e., deuterium oxide (D2O), these hydrogens can be replaced by a deuterium within a few minutes in a process called hydrogen–deuterium exchange (HDX) [149]. The basic mechanism of this process includes acid–base catalysis, where the reaction rate depends on the pH of the reaction mixture, with the characteristic increase observed with increasing pH. The acidity of the hydrogens subjected to the exchange, as a consequence of electronegativity differences between the hydrogen bounded to the heteroatom, is another factor affecting the HDX. The simplicity of isotopic exchange of heteroatom-bounded hydrogens serves as a tool in the conformation analysis of biologically active compounds. Additionally, the isotope exchange reactions enable the analysis of the mechanisms of chemical processes [150].
Carbon-bounded hydrogens, due to the low electronegativity difference, in most cases do not undergo acid- or base-catalyzed HDX. However, the specific molecular structure and appropriate reaction conditions may promote HDX [151,152,153,154]. Additionally, the deuterons connected with carbon centers usually do not undergo back exchange to hydrogens under neutral and slightly acidic conditions. Therefore, such isotopically labeled derivatives may serve as internal standards in quantitative liquid chromatography-mass spectrometry (LCMS) analysis. While the classical methods of deuterium introduction at the carbon atoms are expensive and time-consuming, new, rapid and cost-effective methods of HDX at the carbon atoms of specific groups of chemical compounds seem to be an important issue. Liquid chromatography-mass spectrometry (LCMS) in quantitative mode usually requires isotopically labeled standards which should fulfill certain criteria, including mass shift, chromatographic behavior practically identical to the analyzed compound (co-elution) and stability of the introduced isotopes during the experiment (lack of back-exchange) [155,156,157]. Quantitative analysis is performed by comparing the peak area of the labeled and non-labeled compound. Commonly used isotopically labeled standards contain 2H, 13C, 15N and/or 18O isotopes, which are introduced using de novo synthesis. The synthetic strategies used in the preparation of isotopically labeled standards are usually complicated and expensive, therefore the development of new strategies is required. Moreover, the commercially available popular deuterated standards may affect co-elution during LC-MS, due to the isotope effect depending on the number of introduced deuterons and part of the molecule where they are located [158,159,160,161]. The methods of deuterium incorporation into the target molecules, besides the de novo synthesis, may involve pH dependent and metal-catalyzed HDX reactions at the carbon centers. Although the incorporation of deuterium into the target molecules may present some drawbacks, nevertheless, the advantage of HDX procedure is its low cost and simple preparation procedure in comparison to the previously developed techniques. Therefore, deuterated standards have found numerous applications in quantitative LCMS analysis of different drugs in forensic toxicology (Table 5).

2.6.2. Isotopically Labeled Standards: Glycine Deerivatives

In our previous work, we described the possibility of hydrogen–deuterium exchange at the alpha carbon atom (α-C) in N-methylglycine (sarcosine) and N-benzylglycine residues in peptides under basic conditions at room temperature [173]. The obtained data confirmed that the rate of the observed exchange reaction was much slower compared to the HDX of heteroatom-bounded hydrogens. This work was a milestone in our research on the possibility of isotopically labeled standards preparation. In our further research we developed methods of deuterated standard preparation of cyclosporine A (cyclosporine A-d3) [174], creatinine (creatinine-d2) [175] and other N-substituted glycine derivatives [176].

2.6.3. Denatonium Benzoate

In 2015 we developed a method of denatonium benzoate (Bitrex) deuterium labeling [177]. Bitrex, (N,N-diethyl-N-[(2,6-dimethylphenylcarbamoyl)methyl]benzylammonium benzoate), is the most bitter compound, which found application in the denaturation of industrial alcohols and in making potentially harmful household products extremely unpalatable [178]. It is an important aversive agent used in prevention of accidental consumption of liquids, such as cleaning agents, windshield washer fluids, disinfectants and horticultural products. The European Union Regulations specify the level of Bitrex in several formulations of denatured alcohol to be 1 g per hectoliter of absolute ethanol. However, in some Member States, the amount of added Bitrex is even up to 2 g [179]. The procedure of deuterated Bitrex analog preparation, developed by us, is based on the H/D exchange process of hydrogen atoms in the CH2 group situated between the carbonyl group and the quaternary ammonium group. The complete deuteration occurs at room temperature under basic conditions (1% solution of N,N,N-triethylamine in D2O, Figure 14). We found that the introduced deuterons do not undergo back exchange under acidic and neutral conditions and that the isotopologues co-elute. The developed deuterated Bitrex standard was successfully applied in the quantitative LCMS analysis of Bitrex in several Bitrex-containing household products, including alcoholic thinner and winter/summer windscreen washer fluids.
The level of detected denatonium cations in the prepared samples was determined by the isotopic distribution observed in the ESI-MS spectra according to the algorithm described by Mirgorodskaya and co-workers [180]. In this algorithm, the relative concentrations of the non-deuterated sample and isotopically labeled standard can be determined by comparing the isotopic distributions of “natural” and labeled compounds with the isotopic pattern measured for an analyzed sample containing a known amount of deuterated standard. It should also be mentioned that the cost of preparation of 10 mg of the proposed deuterium labeled standard is about 10 EUR, taking into account the costs of the reagents needed for its preparation, which, compared to the price of commercially available denatonium d5 benzoate (480 € for 10 mg), allows a significant reduction in the costs of analysis.

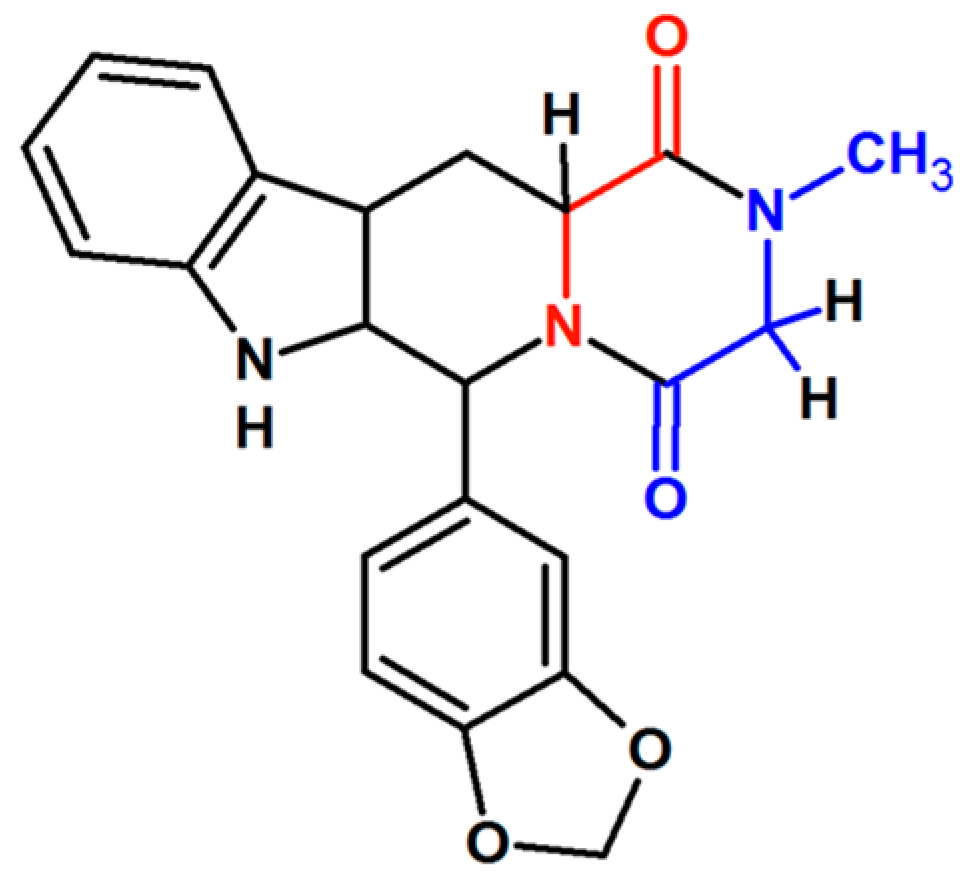
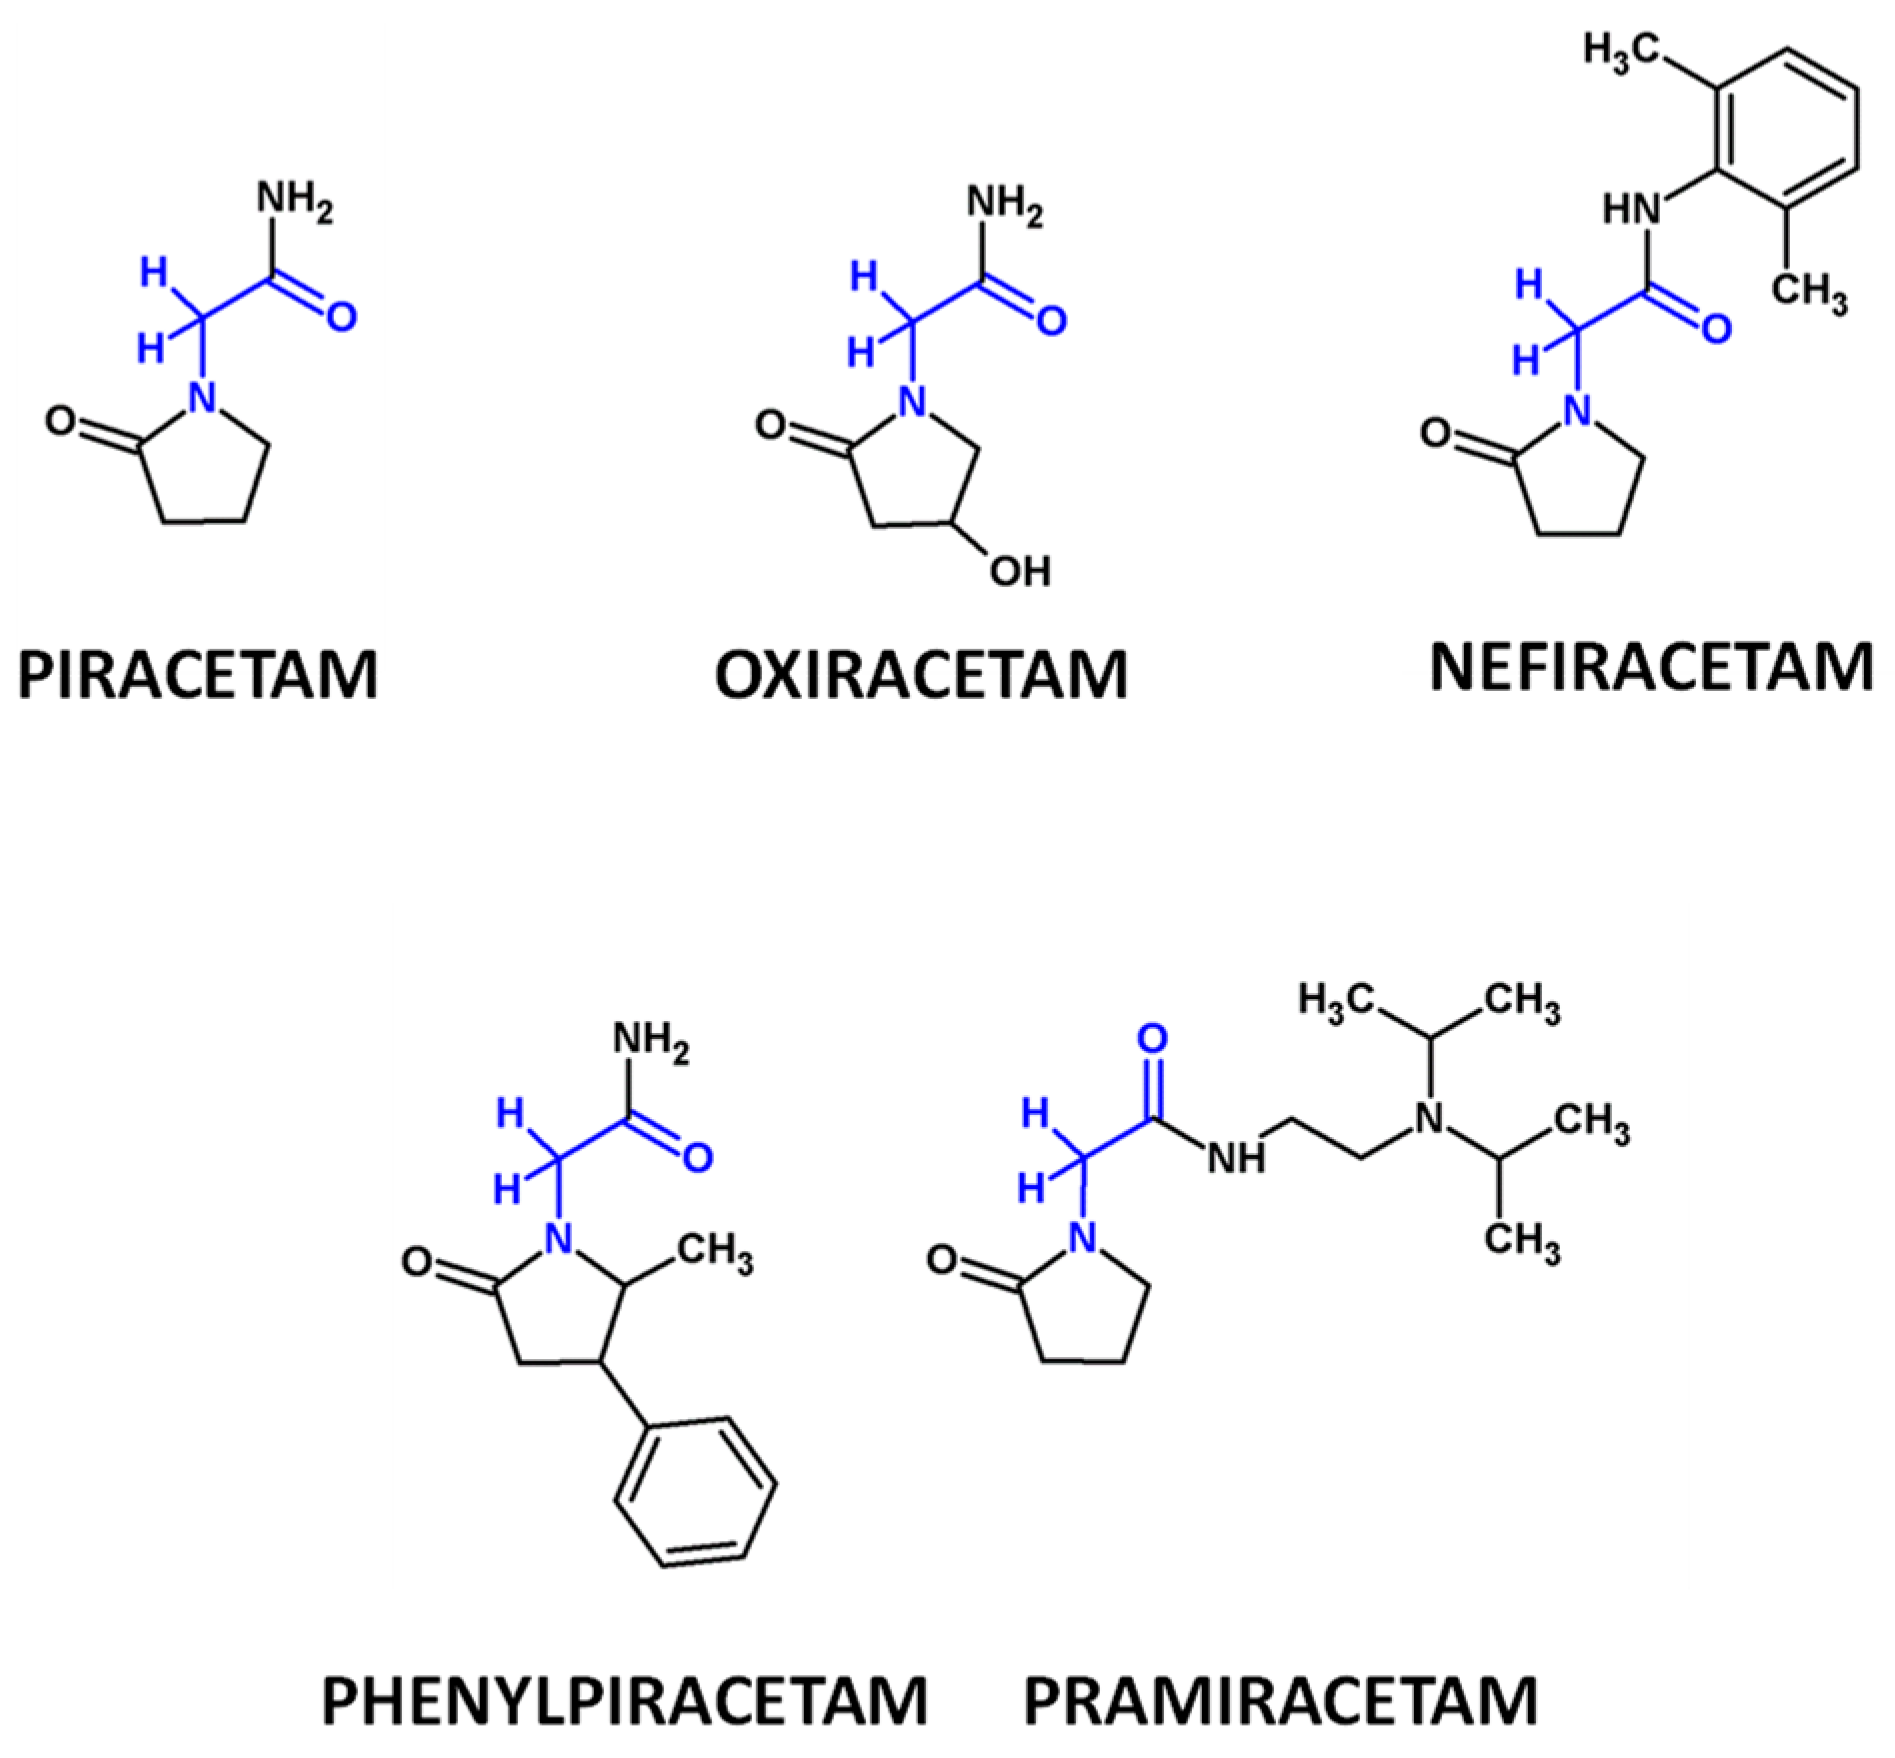
2.6.4. Tadalafil and Racetams

Nowadays, our investigations concentrate on the development of the preparation methods of deuterated analogs of compounds, including tadalafil, racetams, modafinil, omeprazole, and their metabolites and analogs. Tadalafil (Figure 15) presents several side effects, including cardiovascular disorders, headaches, dyspepsia, and retinal disturbance. Additionally, the toxicity or pharmacological safety profile of its analogs is less specified and poses a significant risk to the public health. They were found in some herbal dietary supplements for improved sexual performance [181,182]. As was mentioned in chapter 2.1, illicit products containing phosphodiesterase type 5 inhibitors and their analogs create social problems, such as increasing sexual crimes and black markets (both on the internet and offline), due to their high demand as an alternative to erectile dysfunction drugs that require prescriptions. Therefore, breakthrough analytical techniques that can detect potential tadalafil analogs with updated simultaneous analysis and identification are needed. Our preliminary results clearly indicated the possibility of exchange of three hydrogens to deuterons in the presence of the source of deuterium and a catalyst (Figure 15).
Racetams are a class of compounds belonging to the nootropic drugs, also known as cognitive enhancers, neuroenhancers or, only recently, ‘smart drugs’/They were initially designed to be used in the treatment of gerontopsychiatric patients, as their main function is memory improvement [183,184]. Over the years, several racetam derivatives have been developed, including piracetam [185], phenylpiracetam [186], methylphenylpiracetam, coluracetam [187], pramiracetam [188] and oxiracetam. Nowadays, racetams are misused by students as ‘brain doping’ substances. Hence, it is reported that their prevalence among European students was in the range of 1–16%, while in the United States it reached even up to 35% [183]. The media attention on racetams has increased within the last few years. The drugs have developed an underground following and are commonly sold online and in illicit supply chains. Most have not been approved or scheduled in the US and are therefore of concern to regulators, such as the Food and Drug Administration (FDA) and Drug Enforcement Administration (DEA). Some of them are also prohibited by the World Anti-Doping Agency (WADA), due to the presented side effects (i.e., nephrotoxicity, increase of creatinine level). Therefore, there is a strong need for the development of a method for their qualitative and quantitative analysis. Additionally, racetams are excreted in the urine mostly as I-phase metabolites containing sarcosine moiety. Our preliminary results clearly indicated the possibility of exchange of two hydrogens to deuterons in the presence of the source of deuterium and a catalyst (Figure 16).

2.6.5. Armodafinil

Armodafinil is the R-enantiomer of modafinil (diphenylmethylsulfinylacetamide), a wake promoting agent that is pharmacologically distinct from CNS stimulants, such as amphetamine, dexamphetamine and methylphenidate. It is approved for use in the US and certain European countries in patients with excessive sleepiness associated with obstructive sleep apnea/hypopnea syndrome (OSA) (despite treatment of the underlying condition), narcolepsy or shift work sleep disorder (SWSD) [189,190]. Armodafinil and/or its major metabolite, modafinil acid, may be quantified in plasma, serum or urine to monitor dosage in those receiving the drug therapeutically, to confirm a diagnosis of poisoning in hospitalized patients or to assist in the forensic investigation of a vehicular traffic violation. Instrumental techniques involving gas or liquid chromatography are usually employed for these purposes. As of 2011, it is not specifically tested for by common drug screens (except for anti-doping screens) and is unlikely to cause false positives for other chemically unrelated drugs, such as substituted amphetamines [191]. The regulation of modafinil as a doping agent has been controversial in the sporting world, with high profile cases attracting press coverage, since several prominent American athletes have tested positive for the substance. Some athletes who were found to have used modafinil protested that the drug was not on the prohibited list at the time of their offenses. However, WADA maintains that it was related to already banned substances. The Agency added modafinil to its list of prohibited substances on 3 August 2004 [192]. Armodafinil has been used non-medically as a “smart drug” by students, office workers, soldiers and transhumanists [193,194]. As a ‘smart drug’ it allegedly increases mental focus and helps evade sleep, properties which attract students, professionals in the corporate and technology fields, air force personnel, surgeons, truck drivers and call-center workers. In contrast, when more complex assessments are used, modafinil appears to consistently stimulate enhancement of attention, executive functions, and learning. Importantly, no preponderances for side effects or mood changes were observed [195]. A 2019 review of studies of a single dose of modafinil on mental function in healthy, non-sleep deprived people found a statistically significant but small effect and concluded that the drug has limited usefulness as a cognitive enhancer in non-sleep deprived persons [196]. A 2020 review concluded that users’ perceptions that modafinil is an effective cognitive enhancer is not supported by the evidence in healthy non-sleep deprived adults [197].
In our previous study [198] we demonstrated the possibility of deuterated armodafinil derivative preparation, based on the base-catalyzed hydrogen–deuterium exchange at the carbon atom (Figure 17). Applied reaction conditions allowed the introduction of three deuterons which did not undergo back-exchange under neutral and acidic conditions. Additionally, we found that deuterated and non-deuterated armodafinil isotopologues co-eluted during LCMS analysis. The prepared armodafinil-d3 was used in the LCMS quantification of armodafinil in human urine samples. The obtained data were in agreement with the known pharmacokinetic profile of armodafinil. The proposed method of armodafinil deuteration is simple, rapid and cost-efficient, which makes it a novel tool for researchers, clinicians and forensic scientists working on the improvement of diagnostic accuracy and quantitative forensic LCMS investigation of armodafinil.
It may be expected that HDX as a source of affordable references may provide new insights into the qualitative and quantitative analysis of these compounds, creating a novel tool for researchers, clinicians and forensic scientists working on improvement of diagnostic accuracy, evaluation of treatment efficacy, early diagnosis of disease and forensic investigation.

3. Conclusions

Our review clearly indicates that mass spectrometry is very useful in forensic studies. The full advantage of MS is revealed in its combination with separation methods. Both gas and liquid chromatography could be employed, providing fractionation of complex samples and benefits origination from retention time analysis. The requirements of separation methods include volatility and thermal stability for GC, and solubility and solution stability for LC. There are several reports discussing the preferences for a particular separation method in forensic cases, with LCMS with soft ionization methods gaining influence, due to the growing demand for analysis of biomolecules [19,20,27].
In general, the hyphenated methods (GCMS, LCMS) offer direct unambiguous information on analyte composition and structure, low sample consumption, reduced sample purity requirements, and the possibility of studying isotopic contents of various molecules for an additional level of characterization.
In this review, we concentrated on LCMS and LCMS/MS, presenting the specific features of these methods that make them versatile and innovative. The discussed methods indicate new possibilities in obtaining data on the presence of certain substances, their origin and concentration levels, and in providing answers to questions resulting from forensic investigations. It is the deep understanding of interaction between analytical instrument and the studied molecule that leads to the design of new solutions to forensic problems. The challenges resulting from low concentrations, complicated structures and metabolic transformations could be met by chemical modification of analyzed compounds, opening new venues for innovative derivatization, including isotopic labeling for structural studies and quantitative analysis. The progress in mass spectrometry, with ambient ionization methods and intelligent data analysis systems, is balanced by the cooperation of organic and bioorganic chemistry in molecular modification. The future forensic applications of mass spectrometry must provide faster, accurate and ingenious answers, following the Olympic motto “Citius, Altius, Fortius”.

Author Contributions

Writing—original draft preparation, P.G., R.B., M.B., M.K., M.M., D.P., M.W. and A.K.; writing—review and editing, M.C., M.M. and A.K.; conceptualization and project administration, A.K. The manuscript was written through the contributions of all authors. All authors have read and agreed to the published version of the manuscript.

Funding

This research was funded by National Science Centre Poland, grant number UMO-2021/41/N/ST4/00767.

Institutional Review Board Statement

Not applicable.

Informed Consent Statement

Not applicable.

Data Availability Statement

Not applicable.

Acknowledgments

The authors would like to thank Andrzej Reszka (Shim-Pol, Poland) for providing access to LCMS-9030 and LC-IT-TOF instruments.

Conflicts of Interest

The authors declare no conflict of interest.

References

  1. Brown, H.M.; McDaniel, T.J.; Fedick, P.W.; Mulligan, C.C. The current role of mass spectrometry in forensics and future prospects. Anal. Methods 2020, 12, 3974–3997. [Google Scholar] [CrossRef]
  2. Hamidi, S. Assessment of Undeclared Synthetic Drugs in Dietary Supplements in an Analytical View: A Comprehensive Review. Crit. Rev. Anal. Chem. 2021, 1–11. [Google Scholar] [CrossRef]
  3. Giebułtowicz, J.; Rużycka, M.; Fudalej, M.; Krajewski, P.; Wroczyński, P. LC-MS/MS method development and validation for quantitative analyses of 2-aminothiazoline-4-carboxylic acid—A new cyanide exposure marker in post mortem blood. Talanta 2016, 150, 586–592. [Google Scholar] [CrossRef] [PubMed]
  4. Shokry, E.; Marques, J.G.; Ragazzo, P.C.; Pereira, N.Z.; Filho, N.R.A. Earwax as an alternative specimen for forensic analysis. Forensic Toxicol. 2017, 35, 348–358. [Google Scholar] [CrossRef] [Green Version]
  5. Musshoff, F.; Schwarz, G.; Sachs, H.; Skopp, G.; Franz, T. Concentration distribution of more than 100 drugs and metabolites in forensic hair samples. Int. J. Leg. Med. 2020, 134, 989–995. [Google Scholar] [CrossRef]
  6. Woźniak, M.K.; Jaszczak, E.; Wiergowski, M.; Polkowska, Ż.; Namieśnik, J.; Biziuk, M. Meconium analysis as a promising diagnostic tool for monitoring fetal exposure to toxic substances: Recent trends and perspectives. TrAC Trends Anal. Chem. 2018, 109, 124–141. [Google Scholar] [CrossRef]
  7. Pascale, R.; Acquavia, M.A.; Onzo, A.; Cataldi, T.R.I.; Calvano, C.D.; Bianco, G. Analysis of surfactants by mass spectrometry: Coming to grips with their diversity. Mass Spectrom. Rev. 2021. [Google Scholar] [CrossRef] [PubMed]
  8. Matos, M.P.; Jackson, G.P. Isotope ratio mass spectrometry in forensic science applications. Forensic Chem. 2019, 13, 100154. [Google Scholar] [CrossRef]
  9. Damont, A.; Legrand, A.; Cao, C.; Fenaille, F.; Tabet, J. Hydrogen/deuterium exchange mass spectrometry in the world of small molecules. Mass Spectrom. Rev. 2021, e21765. [Google Scholar] [CrossRef]
  10. Legrand, P.; Dembele, O.; Alamil, H.; Lamoureux, C.; Mignet, N.; Houzé, P.; Gahoual, R. Structural identification and absolute quantification of monoclonal antibodies in suspected counterfeits using capillary electrophoresis and liquid chromatography-tandem mass spectrometry. Anal. Bioanal. Chem. 2022, 414, 2699–2712. [Google Scholar] [CrossRef]
  11. Janvier, S.; De Spiegeleer, B.; Vanhee, C.; Deconinck, E. Falsification of biotechnology drugs: Current dangers and/or future disasters? J. Pharm. Biomed. Anal. 2018, 161, 175–191. [Google Scholar] [CrossRef]
  12. Deconinck, E. Trends in the analysis of falsified and illegal medicines. Talanta 2019, 203, 328–329. [Google Scholar] [CrossRef]
  13. Hart, I.M.B.; Ohana, D.; Venhuis, B.J. Current challenges in the detection and analysis of falsified medicines. J. Pharm. Biomed. Anal. 2021, 197, 113948. [Google Scholar] [CrossRef]
  14. Zhang, H.; Hua, D.; Huang, C.; Samal, S.K.; Xiong, R.; Sauvage, F.; Braeckmans, K.; Remaut, K.; De Smedt, S.C. Materials and Technologies to Combat Counterfeiting of Pharmaceuticals: Current and Future Problem Tackling. Adv. Mater. 2020, 32, e1905486. [Google Scholar] [CrossRef]
  15. Muschietti, L.; Redko, F.; Ulloa, J. Adulterants in selected dietary supplements and their detection methods. Drug Test. Anal. 2020, 12, 861–886. [Google Scholar] [CrossRef]
  16. Zou, W.-B.; Yin, L.-H.; Jin, S.-H. Advances in rapid drug detection technology. J. Pharm. Biomed. Anal. 2018, 147, 81–88. [Google Scholar] [CrossRef]
  17. Rebiere, H.; Guinot, P.; Chauvey, D.; Brenier, C. Fighting falsified medicines: The analytical approach. J. Pharm. Biomed. Anal. 2017, 142, 286–306. [Google Scholar] [CrossRef]
  18. Bottoni, P.; Caroli, S. Fake pharmaceuticals: A review of current analytical approaches. Microchem. J. 2019, 149, 104053. [Google Scholar] [CrossRef]
  19. Deconinck, E.; Sacré, P.-Y.; Courselle, P.; De Beer, J.O. Chromatography in the Detection and Characterization of Illegal Pharmaceutical Preparations. J. Chromatogr. Sci. 2013, 51, 791–806. [Google Scholar] [CrossRef] [Green Version]
  20. Bolla, A.S.; Patel, A.R.; Priefer, R. The silent development of counterfeit medications in developing countries—A systematic review of detection technologies. Int. J. Pharm. 2020, 587, 119702. [Google Scholar] [CrossRef]
  21. Evans-Nguyen, K.; Stelmack, A.R.; Clowser, P.C.; Holtz, J.M.; Mulligan, C.C. Fieldable mass spectrometry for forensic science, homeland security, and defense applications. Mass Spectrom. Rev. 2020, 40, 628–646. [Google Scholar] [CrossRef] [PubMed]
  22. Forbes, T.P.; Sisco, E. Recent advances in ambient mass spectrometry of trace explosives. Analyst 2018, 143, 1948–1969. [Google Scholar] [CrossRef]
  23. Minzière, V.R.; Werner, D.; Schneider, D.; Manganelli, M.; Jung, B.; Weyermann, C.; Gassner, A. Combined Collection and Analysis of Inorganic and Organic Gunshot Residues. J. Forensic Sci. 2020, 65, 1102–1113. [Google Scholar] [CrossRef] [PubMed]
  24. Sun, Q.; Luo, Y.; Wang, Y.; Zhang, Q.; Yang, X. Comparative analysis of aged documents by desorption electrospray ionization–Mass spectrometry (DESI-MS) imaging. J. Forensic Sci. 2022. [Google Scholar] [CrossRef]
  25. Gupta, S.; Samal, N. Application of direct analysis in real-time mass spectrometry (DART-MS) in forensic science: A comprehensive review. Egypt. J. Forensic Sci. 2022, 12, 17. [Google Scholar] [CrossRef]
  26. Mogollón, N.G.S.; Quiroz-Moreno, C.D.; Prata, P.S.; De Almeida, J.R.; Cevallos, A.S.; Torres-Guiérrez, R.; Augusto, F. New Advances in Toxicological Forensic Analysis Using Mass Spectrometry Techniques. J. Anal. Methods Chem. 2018, 2018, 4142527. [Google Scholar] [CrossRef] [Green Version]
  27. Maurer, H.H. Mass Spectrometry for Research and Application in Therapeutic Drug Monitoring or Clinical and Forensic Toxicology. Ther. Drug Monit. 2018, 40, 389–393. [Google Scholar] [CrossRef]
  28. Wu, A.H.; Gerona, R.; Armenian, P.; French, D.; Petrie, M.; Lynch, K.L. Role of liquid chromatography–high-resolution mass spectrometry (LC-HR/MS) in clinical toxicology. Clin. Toxicol. 2012, 50, 733–742. [Google Scholar] [CrossRef]
  29. Substandard and Falsified Medical Products. Available online: https://www.who.int/news-room/fact-sheets/detail/substandard-and-falsified-medical-products (accessed on 25 April 2022).
  30. Janvier, S.; Cheyns, K.; Canfyn, M.; Goscinny, S.; De Spiegeleer, B.; Vanhee, C.; Deconinck, E. Impurity profiling of the most frequently encountered falsified polypeptide drugs on the Belgian market. Talanta 2018, 188, 795–807. [Google Scholar] [CrossRef]
  31. Goryainov, S.V.; Ivlev, V.A.; Orlova, S.V.; Nikitina, E.A.; Sheremeta, A.V.; Vasil’Ev, V.G.; Kalabin, G.A. Modern Methods for Identification and Quantitative Analysis of Undeclared Phosphodiesterase-5 Inhibitors as Pharmaceutically Active Substances in Dietary Supplements (Review). Pharm. Chem. J. 2022, 55, 1395–1400. [Google Scholar] [CrossRef]
  32. Lee, J.H.; Han, J.H.; Kim, S.; Kim, N.S.; Yoon, C.-Y.; Kim, J.; Baek, S.Y. Screening sexual performance enhancing compounds and their analogues in counterfeit and illicit erectile dysfunction drugs by high-performance liquid chromatography and liquid chromatography-tandem mass spectrometry. J. Forensic Leg. Med. 2021, 82, 102224. [Google Scholar] [CrossRef]
  33. Yusop, A.Y.M.; Xiao, L.; Fu, S. Liquid chromatography-high-resolution mass spectrometry analysis of erectile dysfunction drugs and their analogues in food products. Forensic Sci. Int. 2021, 322, 110748. [Google Scholar] [CrossRef] [PubMed]
  34. Qian, Q.; Li, S.-L.; Sun, E.; Zhang, K.-R.; Tan, X.-B.; Wei, Y.-J.; Fan, H.-W.; Cui, L.; Jia, X.-B. Metabolite profiles of icariin in rat plasma by ultra-fast liquid chromatography coupled to triple-quadrupole/time-of-flight mass spectrometry. J. Pharm. Biomed. Anal. 2012, 66, 392–398. [Google Scholar] [CrossRef] [PubMed]
  35. Raimondo, M.; Borioni, A.; Prestinaci, F.; Sestili, I.; Gaudiano, M.C. A NIR, 1H-NMR, LC-MS and chemometrics pilot study on the origin of carvedilol drug substances: A tool for discovering falsified active pharmaceutical ingredients. Anal. Methods 2022, 14, 1396–1405. [Google Scholar] [CrossRef] [PubMed]
  36. Falco, L.F.G.; Melo, C.F.O.R.; de Oliveira, D.N.; Guerreiro, T.M.; Catharino, R.R. An LDI-MSI approach for targeted and untargeted differentiation and assessment of pharmaceutical formulations. Talanta 2018, 197, 92–97. [Google Scholar] [CrossRef]
  37. Sisco, E.; Forbes, T.P. Forensic applications of DART-MS: A review of recent literature. Forensic Chem. 2020, 22, 100294. [Google Scholar] [CrossRef]
  38. Lehmann, E.L.; Arruda, M.A.Z. Minimalist strategies applied to analysis of forensic samples using elemental and molecular analytical techniques—A review. Anal. Chim. Acta 2019, 1063, 9–17. [Google Scholar] [CrossRef]
  39. dos Santos, M.K.; Gleco, E.; Davidson, J.T.; Jackson, G.P.; Limberger, R.P.; Arroyo, L.E. DART-MS/MS screening for the determination of 1,3-dimethylamylamine and undeclared stimulants in seized dietary supplements from Brazil. Forensic Chem. 2018, 8, 134–145. [Google Scholar] [CrossRef]
  40. Fabresse, N.; Gheddar, L.; Kintz, P.; Knapp, A.; Larabi, I.A.; Alvarez, J.-C. Analysis of pharmaceutical products and dietary supplements seized from the black market among bodybuilders. Forensic Sci. Int. 2021, 322, 110771. [Google Scholar] [CrossRef]
  41. Smit, D.L.; Hon, O.; Venhuis, B.J.; Heijer, M.D.; Ronde, W. Baseline characteristics of the HAARLEM study: 100 male amateur athletes using anabolic androgenic steroids. Scand. J. Med. Sci. Sports 2019, 30, 531–539. [Google Scholar] [CrossRef]
  42. Kaklamanos, G.; Aprea, E.; Theodoridis, G. Mass spectrometry: Principles and instrumentation. In Chemical Analysis of Food. Techniques and Applications, 2nd ed.; Pico, Y., Ed.; Academic Press: London, UK, 2020; pp. 525–552. ISBN 9780128132661. [Google Scholar] [CrossRef]
  43. Aceto, M. Food Forensics. In Comprehensive Analytical Chemistry; Elsevier: Amsterdam, The Netherlands, 2015; Volume 68, pp. 441–514. ISBN 9780444633408. [Google Scholar] [CrossRef]
  44. Rodrigues, C.; Maia, R.; Lauteri, M.; Brugnoli, E.; Máguas, C. Stable Isotope Analysis. Compr. Anal. Chem. 2013, 60, 77–99. [Google Scholar] [CrossRef]
  45. Muccio, Z.; Jackson, G.P. Isotope ratio mass spectrometry. Analyst 2008, 134, 213–222. [Google Scholar] [CrossRef] [PubMed]
  46. Wu, H.; Tian, L.; Chen, B.; Jin, B.; Tian, B.; Xie, L.; Rogers, K.; Lin, G. Verification of imported red wine origin into China using multi isotope and elemental analyses. Food Chem. 2019, 301, 125137. [Google Scholar] [CrossRef] [PubMed]
  47. Voica, C.; Iordache, A.M.; Miricioiu, M.G.; Magdas, D.A.; Cristea, G. Preliminary Study on Characterization of Edible Oils Using Inductively Coupled Plasma Mass Spectrometry (ICP-MS) and Isotope Ratio Mass Spectrometry (IRMS). Rev. Chim. 2020, 71, 283–289. [Google Scholar] [CrossRef]
  48. Wadood, S.A.; Boli, G.; Yimin, W. Geographical traceability of wheat and its products using multielement light stable isotopes coupled with chemometrics. Biol. Mass Spectrom. 2018, 54, 178–188. [Google Scholar] [CrossRef]
  49. Jin, X.; Zhang, L.; Wu, S.; Huang, M.; Yu, W.; Zhang, S. Developing an authentication approach using SPME-GC-IRMS based on compound-specific δ 13C analysis of six typical volatiles in wine. Food Qual. Saf. 2020, 5, fyaa031. [Google Scholar] [CrossRef]
  50. Ciepielowski, G.; Pacholczyk-Sienicka, B.; Frączek, T.; Klajman, K.; Paneth, P.; Albrecht, Ł. Comparison of quantitative NMR and IRMS for the authentication of ‘Polish Vodka’. J. Sci. Food Agric. 2018, 99, 263–268. [Google Scholar] [CrossRef] [Green Version]
  51. Brailsford, A.D.; Majidin, W.N.M.; Wojek, N.; Cowan, D.A.; Walker, C. IRMS delta values (13C) of nandrolone and testosterone products available in the UK: Implications for anti-doping. Drug Test. Anal. 2018, 10, 1722–1727. [Google Scholar] [CrossRef] [Green Version]
  52. Kim, H.; Lee, D.-H.; Go, A.; Park, M.; Choe, S.; In, S.; Kim, E.; Lee, H.; Shin, K.-H.; Han, E. Differentiation of endogenous and exogenous γ-Hydroxybutyrate in rat and human urine by GC/C/IRMS. Int. J. Leg. Med. 2019, 133, 1785–1794. [Google Scholar] [CrossRef]
  53. Benson, S.J.; Lennard, C.J.; Maynard, P.; Hill, D.M.; Andrew, A.S.; Roux, C. Forensic analysis of explosives using isotope ratio mass spectrometry (IRMS)—Preliminary study on TATP and PETN. Sci. Justice 2009, 49, 81–86. [Google Scholar] [CrossRef]
  54. Bontempo, L.; Paolini, M.; Franceschi, P.; Ziller, L.; García-González, D.L.; Camin, F. Characterisation and attempted differentiation of European and extra-European olive oils using stable isotope ratio analysis. Food Chem. 2018, 276, 782–789. [Google Scholar] [CrossRef] [PubMed]
  55. Circi, S.; Ingallina, C.; Vista, S.; Capitani, D.; Di Vecchia, A.; Leonardi, G.; D’Achille, G.; Centauri, L.; Camin, F.; Mannina, L. A Multi-Methodological Protocol to Characterize PDO Olive Oils. Metabolites 2018, 8, 43. [Google Scholar] [CrossRef] [PubMed] [Green Version]
  56. Sinkovič, L.; Ogrinc, N.; Potočnik, D.; Meglič, V. Isotope Fingerprints of Common and Tartary Buckwheat Grains and Milling Fractions: A Preliminary Study. Foods 2022, 11, 1414. [Google Scholar] [CrossRef] [PubMed]
  57. Ishida-Fujii, K.; Goto, S.; Uemura, R.; Yamada, K.; Sato, M.; Yoshida, N. Botanical and Geographical Origin Identification of Industrial Ethanol by Stable Isotope Analyses of C, H, and O. Biosci. Biotechnol. Biochem. 2005, 69, 2193–2199. [Google Scholar] [CrossRef] [Green Version]
  58. Iannella, L.; Botrè, F.; Colamonici, C.; Curcio, D.; De La Torre, X. Development and validation of a method to confirm the exogenous origin of prednisone and prednisolone by GC-C-IRMS. Drug Test. Anal. 2019, 11, 1615–1628. [Google Scholar] [CrossRef]
  59. Tobias, H.J.; Brenna, J.T. Cryofocus fast gas chromatography combustion isotope ratio mass spectrometry for rapid detection of synthetic steroid use in sport doping. Analyst 2018, 143, 1124–1132. [Google Scholar] [CrossRef]
  60. Howa, J.D.; Barnette, J.E.; Chesson, L.A.; Lott, M.J.; Ehleringer, J.R. TATP isotope ratios as influenced by worldwide acetone variation. Talanta 2018, 181, 125–131. [Google Scholar] [CrossRef]
  61. Chesson, L.A.; Berg, G.E. The use of stable isotopes in postconflict forensic identification. WIREs Forensic Sci. 2021, 4, 1–28. [Google Scholar] [CrossRef]
  62. Frederick, D.L. Toxicology Testing in Alternative Specimen Matrices. Clin. Lab. Med. 2012, 32, 467–492. [Google Scholar] [CrossRef]
  63. Barbosa, J.; Faria, J.; Carvalho, F.; Pedro, M.; Queirós, O.; Moreira, R.; Dinis-Oliveira, R.J. Hair as an alternative matrix in bioanalysis. Bioanalysis 2013, 5, 895–914. [Google Scholar] [CrossRef]
  64. Gallardo, E.; Queiroz, J.A. The role of alternative specimens in toxicological analysis. Biomed. Chromatogr. 2008, 22, 795–821. [Google Scholar] [CrossRef] [PubMed]
  65. Nicolaou, A.G.; Christodoulou, M.C.; Stavrou, I.J.; Kapnissi-Christodoulou, C.P. Analysis of cannabinoids in conventional and alternative biological matrices by liquid chromatography: Applications and challenges. J. Chromatogr. A 2021, 1651, 462277. [Google Scholar] [CrossRef] [PubMed]
  66. Pirone, J. Drug Testing: An Overview of SAMHSA’s New Oral Fluid Testing Guidelines. Occupational Health & Safety Magazine. Available online: https://ohsonline.com/Articles/2020/03/01/An-Overview-of-SAMHSAs-New-Oral-Fluid-Testing-Guidelines.aspx?Page=1 (accessed on 15 June 2022).
  67. Ferreira, C.; Paulino, C.; Quintas, A. Extraction Procedures for Hair Forensic Toxicological Analysis: A Mini-Review. Chem. Res. Toxicol. 2019, 32, 2367–2381. [Google Scholar] [CrossRef] [PubMed]
  68. He, X.; Wang, J.F.; Wang, Y. Influence of cosmetic hair treatments on hair of methamphetamine abuser: Bleaching, perming and coloring. Ecotoxicol. Environ. Saf. 2021, 222, 112542. [Google Scholar] [CrossRef]
  69. Agius, R. Utility of coloured hair for the detection of drugs and alcohol. Drug Test. Anal. 2014, 6 (Suppl. 1), 110–119. [Google Scholar] [CrossRef] [Green Version]
  70. Sporkert, F.; Kharbouche, H.; Augsburger, M.P.; Klemm, C.; Baumgartner, M.R. Positive EtG findings in hair as a result of a cosmetic treatment. Forensic Sci. Int. 2012, 218, 97–100. [Google Scholar] [CrossRef]
  71. Kintz, P.; Gheddar, L.; Raul, J. Simultaneous testing for anabolic steroids in human hair specimens collected from various anatomic locations has several advantages when compared with the standard head hair analysis. Drug Test. Anal. 2021, 13, 1445–1451. [Google Scholar] [CrossRef]
  72. Fernández, M.D.M.R.; Wille, S.M.; Di Fazio, V.; Samyn, N. Time course detection of dihydrocodeine in body hair after a single dose. Forensic Sci. Int. 2019, 302, 109864. [Google Scholar] [CrossRef]
  73. Cooper, G.A.; Kronstrand, R.; Kintz, P. Society of Hair Testing guidelines for drug testing in hair. Forensic Sci. Int. 2012, 218, 20–24. [Google Scholar] [CrossRef]
  74. Available online: http://www.ewdts.org/ewdts-guidelines.html (accessed on 25 May 2022).
  75. Wang, T.; Shen, B.; Wu, H.; Gu, J.; Shen, M.; Xiang, P. Segmental Analysis of R/S-Methamphetamine and R/S-Amphetamine in Abusers’ Head Hair. J. Anal. Toxicol. 2020, 44, 596–600. [Google Scholar] [CrossRef]
  76. Busardò, F.P.; Pichini, S.; Zaami, S.; Pacifici, R.; Kintz, P. Hair testing of GHB: An everlasting issue in forensic toxicology. Clin. Chem. Lab. Med. 2017, 56, 198–208. [Google Scholar] [CrossRef]
  77. Kong, R.; Li, L.; Liu, W.; Xiang, P.; Zhao, J. Rapid Characterization of Drugs in a Single Hair using Thermal Desorption Ionization Mass Spectrometry. Anal. Methods 2022, 14, 806–812. [Google Scholar] [CrossRef] [PubMed]
  78. D’Ovidio, C.; Bonelli, M.; Rosato, E.; Tartaglia, A.; Ulusoy, H.I.; Samanidou, V.; Furton, K.G.; Kabir, A.; Ali, I.; Savini, F.; et al. Novel Applications of Microextraction Techniques Focused on Biological and Forensic Analyses. Separations 2022, 9, 18. [Google Scholar] [CrossRef]
  79. Kernalléguen, A.; Enjalbal, C.; Alvarez, J.-C.; Belgacem, O.; Léonetti, G.; Lafitte, D.; Pélissier-Alicot, A.-L. Synthetic cannabinoid isomers characterization by MALDI-MS3 imaging: Application to single scalp hair. Anal. Chim. Acta 2018, 1041, 87–93. [Google Scholar] [CrossRef] [PubMed]
  80. Duvivier, W.F.; van Beek, T.A.; Nielen, M.W.F. Critical comparison of mass analyzers for forensic hair analysis by ambient ionization mass spectrometry. Rapid Commun. Mass Spectrom. 2016, 30, 2331–2340. [Google Scholar] [CrossRef]
  81. Society of Toxicological and Forensic Chemistry (GTFCh). Available online: https://www.gtfch.org/cms/index.php/en/ (accessed on 14 May 2022).
  82. Wabuyele, S.L.; Colby, J.M.; McMillin, G.A. Detection of Drug-Exposed Newborns. Ther. Drug Monit. 2018, 40, 166–185. [Google Scholar] [CrossRef]
  83. Szeto, H.H. Kinetics of Drug Transfer to the Fetus. Clin. Obstet. Gynecol. 1993, 36, 246–254. [Google Scholar] [CrossRef]
  84. Joya, X.; Marchei, E.; Salat-Batlle, J.; García-Algar, O.; Calvaresi, V.; Pacifici, R.; Pichini, S. Fetal exposure to ethanol: Relationship between ethyl glucuronide in maternal hair during pregnancy and ethyl glucuronide in neonatal meconium. Clin. Chem. Lab. Med. 2016, 54, 427–435. [Google Scholar] [CrossRef]
  85. McMillin, G.A.; Wood, K.E.; Strathmann, F.G.; Krasowski, M.D. Patterns of Drugs and Drug Metabolites Observed in Meconium. Ther. Drug Monit. 2015, 37, 568–580. [Google Scholar] [CrossRef]
  86. Bévalot, F.; Gustin, M.P.; Cartiser, N.; Gaillard, Y.; Le Meur, C.; Fanton, L.; Guitton, J.; Malicier, D. Using bone marrow matrix to analyze meprobamate for forensic toxicological purposes. Int. J. Leg. Med. 2013, 127, 915–921. [Google Scholar] [CrossRef]
  87. Petrochilou, E.; Athanaselis, S.; Nikolaou, P.; Papadodima, S.; Panderi, I.; Spiliopoulou, C.; Papoutsis, I. Synovial fluid as an alternative specimen for quantification of drugs of abuse by GC–MS. Forensic Toxicol. 2019, 37, 496–503. [Google Scholar] [CrossRef]
  88. Badmus, S.O.; Amusa, H.K.; Oyehan, T.A.; A Saleh, T. Environmental risks and toxicity of surfactants: Overview of analysis, assessment, and remediation techniques. Environ. Sci. Pollut. Res. 2021, 28, 62085–62104. [Google Scholar] [CrossRef]
  89. Sasi, S.; Rayaroth, M.P.; Aravindakumar, C.T.; Aravind, U.K. Alcohol ethoxysulfates (AES) in environmental matrices. Environ. Sci. Pollut. Res. Int. 2021, 28, 34167–34186. [Google Scholar] [CrossRef] [PubMed]
  90. Lasek, F.; Leitner, N.K.V.; Rauwel, G.; Blanchier, L.; Castel, O.; Ayraud-Thevenot, S.; Deborde, M. Discharge of biocidal products from healthcare activities into a sewage system—A case study at a French university hospital. Environ. Sci. Pollut. Res. Int. 2018, 26, 4938–4951. [Google Scholar] [CrossRef] [PubMed]
  91. Jia, Y.; Lu, H.; Zhu, L. Molecular mechanism of antibiotic resistance induced by mono-and twin-chained quaternary ammonium compounds. Sci. Total Environ. 2022, 832, 155090. [Google Scholar] [CrossRef] [PubMed]
  92. Zakharova, L.Y.; Pashirova, T.N.; Doktorovova, S.; Fernandes, A.R.; Sanchez-Lopez, E.; Silva, A.M.; Souto, S.B.; Souto, E.B. Cationic Surfactants: Self-Assembly, Structure-Activity Correlation and Their Biological Applications. Int. J. Mol. Sci. 2019, 20, 5534. [Google Scholar] [CrossRef] [Green Version]
  93. Kawamoto, O.; Ishikawa, T.; Oritani, S.; Kuramoto, Y.; Michiue, T.; Maeda, H. Death following the ingestion of detergent: An autopsy case with special regard to the histochemical findings. Forensic Sci. Med. Pathol. 2012, 9, 208–213. [Google Scholar] [CrossRef]
  94. Kumar, M.; Bhatia, R.; Rawal, R.K. Applications of various analytical techniques in quality control of pharmaceutical excipients. J. Pharm. Biomed. Anal. 2018, 157, 122–136. [Google Scholar] [CrossRef]
  95. Bazel, Y.R.; Antal, I.P.; Lavra, V.M.; Kormosh, Z.A.; Bazel, Y. Methods for the determination of anionic surfactants. J. Anal. Chem. 2014, 69, 211–236. [Google Scholar] [CrossRef]
  96. Heinig, K.; Vogt, C.; Werner, G. Separation of ionic and neutral surfactants by capillary electrophoresis and high-performance liquid chromatography. J. Chromatogr. A 1996, 745, 281–292. [Google Scholar] [CrossRef]
  97. Villar, M.; Callejón, M.; Jiménez, J.; Alonso, E.; Guiraúm, A. New rapid methods for determination of total LAS in sewage sludge by high performance liquid chromatography (HPLC) and capillary electrophoresis (CE). Anal. Chim. Acta 2009, 634, 267–271. [Google Scholar] [CrossRef] [PubMed]
  98. Maurer, H.H. Current role of liquid chromatography–mass spectrometry in clinical and forensic toxicology. Anal. Bioanal. Chem. 2007, 388, 1315–1325. [Google Scholar] [CrossRef] [PubMed]
  99. Nishikawa, M.; Katagi, M.; Miki, A.; Tsuchihashi, H. Forensic Toxicological Determination of Surfactant by Liquid Chromatography/Electrospray lonization Mass Spectrometry and Liquid Chromatography/Electrospray lonization Tandem Mass Spectrometry. J. Health Sci. 2003, 49, 138–148. [Google Scholar] [CrossRef] [Green Version]
  100. Kudo, K.; Tsuchihashi, H.; Ikeda, N. Meeting challenges in forensic toxicology in Japan by liquid chromatography/mass spectrometry. Anal. Chim. Acta 2003, 492, 83–104. [Google Scholar] [CrossRef]
  101. Bongiorno, D.; Ceraulo, L.; Ruggirello, A.; Liveri, V.T.; Basso, E.; Seraglia, R.; Traldi, P. Surfactant self-assembling in gas phase: Electrospray ionization- and matrix-assisted laser desorption/ionization-mass spectrometry of singly charged AOT clusters. Biol. Mass Spectrom. 2005, 40, 1618–1625. [Google Scholar] [CrossRef]
  102. Ceraulo, L.; Giorgi, G.; Liveri, V.T.; Bongiorno, D.; Indelicato, S.; Di Gaudio, F.; Indelicato, S. Mass Spectrometry of Surfactant Aggregates. Eur. J. Mass Spectrom. 2011, 17, 525–541. [Google Scholar] [CrossRef] [Green Version]
  103. Ma, Q.; Zhang, Y.; Zhai, J.; Chen, X.; Du, Z.; Li, W.; Bai, H. Characterization and analysis of non-ionic surfactants by supercritical fluid chromatography combined with ion mobility spectrometry-mass spectrometry. Anal. Bioanal. Chem. 2019, 411, 2759–2765. [Google Scholar] [CrossRef]
  104. Pan, J.; Ji, Y.; Du, Z.; Zhang, J. Rapid characterization of commercial polysorbate 80 by ultra-high performance supercritical fluid chromatography combined with quadrupole time-of-flight mass spectrometry. J. Chromatogr. A 2016, 1465, 190–196. [Google Scholar] [CrossRef]
  105. Hitosugi, M.; Tsukada, C.; Yamauchi, S.; Matsushima, K.; Furukawa, S.; Morita, S.; Nagai, T. An autopsy case of fatal repellent air freshener poisoning. Leg. Med. 2015, 17, 360–363. [Google Scholar] [CrossRef]
  106. Usui, K.; Hayashizaki, Y.; Okubo, Y.; Hashiyada, M.; Funayama, M. A case of death after ingestion of an agrochemical spreading agent. Forensic Sci. Int. 2011, 210, 117–121. [Google Scholar] [CrossRef]
  107. Tay, M.; Fang, G.; Chia, P.L.; Li, S.F.Y. Rapid screening for detection and differentiation of detergent powder adulteration in infant milk formula by LC–MS. Forensic Sci. Int. 2013, 232, 32–39. [Google Scholar] [CrossRef] [PubMed]
  108. Kuepper, U.; Musshoff, F.; Madea, B. A fully validated isotope dilution HPLC-MS/MS method for the simultaneous determination of succinylcholine and succinylmonocholine in serum and urine samples. Biol. Mass Spectrom. 2008, 43, 1344–1352. [Google Scholar] [CrossRef] [PubMed]
  109. Kirschbaum, K.M.; Grellner, W.; Rochholz, G.; Musshoff, F.; Madea, B. Liquid chromatography-tandem mass spectrometry detection of the quaternary ammonium compound mebezonium as an active ingredient in t61. J. Anal. Toxicol. 2011, 35, 124–128. [Google Scholar] [CrossRef] [PubMed] [Green Version]
  110. Massey, K.A.; Snelling, A.M.; Nicolaou, A. Quantitative analysis of surfactant deposits on human skin by liquid chromatography/electrospray ionisation tandem mass spectrometry. Rapid Commun. Mass Spectrom. 2010, 24, 1371–1376. [Google Scholar] [CrossRef]
  111. Onzo, A.; Acquavia, M.A.; Cataldi, T.R.I.; Ligonzo, M.; Coviello, D.; Pascale, R.; Martelli, G.; Bondoni, M.; Scrano, L.; Bianco, G. Coceth sulfate characterization by electrospray ionization tandem mass spectrometry. Rapid Commun. Mass Spectrom. 2020, 34, e8884. [Google Scholar] [CrossRef]
  112. Zecchi, R.; Franceschi, P.; Tigli, L.; Ricci, F.; Boscaro, F.; Pioselli, B.; Mileo, V.; Murgia, X.; Bianco, F.; Salomone, F.; et al. Mass spectrometry imaging as a tool for evaluating the pulmonary distribution of exogenous surfactant in premature lambs. Respir. Res. 2019, 20, 175. [Google Scholar] [CrossRef] [PubMed] [Green Version]
  113. Hird, S.J.; Lau, B.P.-Y.; Schuhmacher, R.; Krska, R. Liquid chromatography-mass spectrometry for the determination of chemical contaminants in food. TrAC Trends Anal. Chem. 2014, 59, 59–72. [Google Scholar] [CrossRef] [Green Version]
  114. Zhang, T.-Y.; Li, S.; Zhu, Q.-F.; Wang, Q.; Hussain, D.; Feng, Y.-Q. Derivatization for liquid chromatography-electrospray ionization-mass spectrometry analysis of small-molecular weight compounds. TrAC Trends Anal. Chem. 2019, 119, 115608. [Google Scholar] [CrossRef]
  115. Kamińska, A.; Krawczyk, M.; Chwatko, G. Chemical derivatization in high-performance liquid chromatography. Wiad. Chem. 2016, 70, 833–834. [Google Scholar]
  116. Madmon, M.; Shifrovich, A.; Tamar, S.Y.; Weissberg, A. Simple and fast determination of free cyanide in drinking water by liquid chromatography electrospray ionization tandem mass spectrometry following “in vial” derivatization. Int. J. Mass Spectrom. 2021, 463, 116553. [Google Scholar] [CrossRef]
  117. Vaiano, F.; Mari, F.; Busardò, F.P.; Bertol, E. Enhancing the sensitivity of the LC-MS/MS detection of propofol in urine and blood by azo-coupling derivatization. Anal. Bioanal. Chem. 2014, 406, 3579–3587. [Google Scholar] [CrossRef] [PubMed]
  118. Vaiano, F.; Busardò, F.P.; Pascali, J.; Fioravanti, A.; Mortali, C.; Mari, F.; Bertol, E. Hair testing of propofol by liquid chromatography-tandem mass spectrometry and azo-coupling derivatization. Drug Test. Anal. 2017, 9, 1080–1084. [Google Scholar] [CrossRef] [PubMed]
  119. Sun, Y.; Tang, H.; Wang, Y. Progress and Challenges in Quantifying Carbonyl-Metabolomic Phenomes with LC-MS/MS. Molecules 2021, 26, 6147. [Google Scholar] [CrossRef] [PubMed]
  120. Athanasiadou, I.; Angelis, Y.S.; Lyris, E.; Georgakopoulos, C. Chemical derivatization to enhance ionization of anabolic steroids in LC-MS for doping-control analysis. TrAC Trends Anal. Chem. 2013, 42, 137–156. [Google Scholar] [CrossRef]
  121. Kowalska, M.; Popiel, D.; Walter, M.; Bąchor, R.; Biernat, M.; Cebrat, M.; Kijewska, M.; Kuczer, M.; Modzel, M.; Kluczyk, A. Veni, Vidi, Vici: Immobilized Peptide-Based Conjugates as Tools for Capture, Analysis, and Transformation. Chemosensors 2022, 10, 31. [Google Scholar] [CrossRef]
  122. Aviram, L.Y.; Loewenthal, D.; Weissberg, A.; Marder, D.; Gura, S.; Chapman, S.; Gez, R.; Lazar, S.; Dagan, S. Determination of free G-type nerve agents in blood: In situ derivatization on a dried blood spot (DBS) paper followed by LC–MS/MS analysis. Forensic Toxicol. 2020, 38, 327–339. [Google Scholar] [CrossRef]
  123. Weissberg, A.; Madmon, M.; Elgarisi, M.; Dagan, S. Aqueous extraction followed by derivatization and liquid chromatography–mass spectrometry analysis: A unique strategy for trace detection and identification of G-nerve agents in environmental matrices. J. Chromatogr. A 2018, 1577, 24–30. [Google Scholar] [CrossRef]
  124. Beach, D.G.; Liu, H.; Quilliam, M.A. Sensitive determination of domoic acid in mussel tissue using dansyl chloride derivatization and liquid chromatography-mass spectrometry. Anal. Methods 2014, 7, 1000–1007. [Google Scholar] [CrossRef] [Green Version]
  125. Patočka, J.; Jelínková, R. Atropine and atropine-like substances usable in warfare. Mil. Med Sci. Lett. 2017, 86, 58–69. [Google Scholar] [CrossRef]
  126. World Health Organization Model List of Essential Medicines—22nd List; Licence: CC BY-NC-SA 3.0 IGO; World Health Organization: Geneva, Switzerland, 2021.
  127. Carlier, J.; Escard, E.; Peoc’H, M.; Boyer, B.; Romeuf, L.; Faict, T.; Guitton, J.; Gaillard, Y. Atropine Eye Drops: An Unusual Homicidal Poisoning. J. Forensic Sci. 2014, 59, 859–864. [Google Scholar] [CrossRef]
  128. Le Garff, E.; Delannoy, Y.; Mesli, V.; Hédouin, V.; Tournel, G. Forensic features of a fatal Datura poisoning case during a robbery. Forensic Sci. Int. 2016, 261, e17–e21. [Google Scholar] [CrossRef] [PubMed]
  129. Mutebi, R.R.; Ario, A.R.; Nabatanzi, M.; Kyamwine, I.B.; Wibabara, Y.; Muwereza, P.; Eurien, D.; Kwesiga, B.; Bulage, L.; Kabwama, S.N.; et al. Large outbreak of Jimsonweed (Datura stramonium) poisoning due to consumption of contaminated humanitarian relief food: Uganda, March–April 2019. BMC Public Health 2022, 22, 623. [Google Scholar] [CrossRef] [PubMed]
  130. Skulska, A.; Kała, M. Consequences of medical and non-medical use of atropine and fentanyl analogues. Probl. Forensic Sci. 2007, LXXI, 303–331. [Google Scholar]
  131. National Report to the EMCDDA: France. New Development, Trends and In-Depth Information on Selected Issues. Available online: https://www.emcdda.europa.eu/system/files/publications/958/NR2005FranceEN.pdf (accessed on 8 May 2022).
  132. Koželj, G.; Perharič, L.; Stanovnik, L.; Prosen, H. Simple validated LC–MS/MS method for the determination of atropine and scopolamine in plasma for clinical and forensic toxicological purposes. J. Pharm. Biomed. Anal. 2014, 96, 197–206. [Google Scholar] [CrossRef]
  133. Moriyama, K.; Takami, Y.; Uozumi, N.; Okuda, A.; Yamashita, M.; Yokomizo, R.; Shimada, K.; Egawa, T.; Kamei, T.; Takayanagi, K. Assessment of drug content uniformity of atropine sulfate triturate by liquid chromatography-tandem mass spectrometry, X-ray powder diffraction, and Raman chemical imaging. J. Pharm. Health Care Sci. 2016, 2, 4. [Google Scholar] [CrossRef] [Green Version]
  134. Crapnell, R.D.; Banks, C.E. Electroanalytical overview: The detection of the molecule of murder atropine. Talanta Open 2021, 4, 100073. [Google Scholar] [CrossRef]
  135. Rbeida, O.; Christiaens, B.; Hubert, P.; Lubda, D.; Boos, K.-S.; Crommen, J.; Chiap, P. Integrated on-line sample clean-up using cation exchange restricted access sorbent for the LC determination of atropine in human plasma coupled to UV detection. J. Pharm. Biomed. Anal. 2005, 36, 947–954. [Google Scholar] [CrossRef]
  136. Namera, A.; Yashiki, M.; Hirose, Y.; Yamaji, S.; Tani, T.; Kojima, T. Quantitative analysis of tropane alkaloids in biological materials by gas chromatography–mass spectrometry. Forensic Sci. Int. 2002, 130, 34–43. [Google Scholar] [CrossRef]
  137. Aehle, E.; Dräger, B. Tropane alkaloid analysis by chromatographic and electrophoretic techniques: An update. J. Chromatogr. B 2010, 878, 1391–1406. [Google Scholar] [CrossRef] [PubMed]
  138. Koželj, G.; Prosen, H. Thermal (In) stability of Atropine and Scopolamine in the GC-MS Inlet. Toxics 2021, 9, 156. [Google Scholar] [CrossRef]
  139. Kuczer, M.; Kluczyk, A.; Bąchor, R.; Szewczuk, Z. Derywatyzacja jako metoda zwiększania czułości pomiarów w chromatografii cieczowej sprzężonej ze spektrometrią mas. In Proceedings of the IV Ogólnopolska Konferencja Fizykochemiczne Badania Śladów Kryminalistycznych, Bronisławów, Poland, 20–23 November 2018. [Google Scholar]
  140. Setner, B.; Rudowska, M.; Klem, E.; Cebrat, M.; Szewczuk, Z. Peptides derivatized with bicyclic quaternary ammonium ionization tags. Sequencing via tandem mass spectrometry. Biol. Mass Spectrom. 2014, 49, 995–1001. [Google Scholar] [CrossRef] [PubMed]
  141. Bąchor, R.; Mielczarek, P.; Rudowska, M.; Silberring, J.; Szewczuk, Z. Sensitive detection of charge derivatized peptides at the attomole level using nano-LC-ESI–MRM analysis. Int. J. Mass Spectrom. 2014, 362, 32–38. [Google Scholar] [CrossRef]
  142. Kim, S.; Lee, M.S.; Kim, M.; Ko, B.J.; Lee, H.S.; Lee, S. Derivatization-assisted LC-MS/MS method for simultaneous quantification of endogenous gamma-hydroxybutyric acid and its metabolic precursors and products in human urine. Anal. Chim. Acta 2021, 1194, 339401. [Google Scholar] [CrossRef] [PubMed]
  143. Hess, C.; Murach, J.; Krueger, L.; Scharrenbroch, L.; Unger, M.; Madea, B.; Sydow, K. Simultaneous detection of 93 synthetic cannabinoids by liquid chromatography-tandem mass spectrometry and retrospective application to real forensic samples. Drug Test. Anal. 2016, 9, 721–733. [Google Scholar] [CrossRef]
  144. Al-Zahrani, M.A.; Al-Asmari, A.I.; Al-Zahrani, F.F.; Torrance, H.J.; Watson, D.G. Quantification of cannabinoids in human hair using a modified derivatization procedure and liquid chromatography–tandem mass spectrometry. Drug Test. Anal. 2021, 13, 1095–1107. [Google Scholar] [CrossRef]
  145. Tsumura, Y.; Kiguchi, A.; Komatsuzaki, S.; Ieuji, K. A novel method to distinguish β-methylphenylethylamines from isomeric α-methylphenylethylamines by liquid chromatography coupled to electrospray ionization mass spectrometry. Forensic Toxicol. 2019, 38, 465–474. [Google Scholar] [CrossRef] [Green Version]
  146. Anselmo, C.D.S.; Silveira, C.M.D.V.; Sardela, V.F.; Pereira, H.M.G. Chiral Analysis of Amphetamine and Methamphetamine in Urine by Liquid Chromatography-Tandem Mass Spectrometry Applying Mosher Derivatization. Chromatographia 2020, 84, 47–52. [Google Scholar] [CrossRef]
  147. Borden, S.A.; Palaty, J.; Termopoli, V.; Famiglini, G.; Cappiello, A.; Gill, C.G.; Palma, P. Mass Spectrometry Analysis of Drugs of Abuse: Challenges and Emerging Strategies. Mass Spectrom. Rev. 2020, 37, 258–280. [Google Scholar] [CrossRef]
  148. Englander, S.W.; Sosnick, T.R.; Englander, J.J.; Mayne, L. Mechanisms and uses of hydrogen exchange. Curr. Opin. Struct. Biol. 1996, 6, 18–23. [Google Scholar] [CrossRef] [Green Version]
  149. Bai, Y.; Milne, J.S.; Mayne, L.; Englander, S.W. Primary structure effects on peptide group hydrogen exchange. Proteins Struct. Funct. Bioinform. 1993, 17, 75–86. [Google Scholar] [CrossRef] [Green Version]
  150. Junk, T.; Catallo, W.J. Hydrogen isotope exchange reactions involving C–H (D, T) bonds. Chem. Soc. Rev. 1997, 26, 401–406. [Google Scholar] [CrossRef]
  151. Ho, J.; Coote, M.L.; Easton, C.J. Validation of the Distal Effect of Electron-Withdrawing Groups on the Stability of Peptide Enolates and Its Exploitation in the Controlled Stereochemical Inversion of Amino Acid Derivatives. J. Org. Chem. 2011, 76, 5907–5914. [Google Scholar] [CrossRef] [PubMed]
  152. Lygo, B.; Humphreys, L.D. Enantioselective synthesis of α-carbon deuterium-labelled l-α-amino acids. Tetrahedron Lett. 2002, 43, 6677–6679. [Google Scholar] [CrossRef]
  153. Lankiewicz, L.; Nyassé, B.; Fransson, B.; Grehn, L.; Ragnarsson, U. Synthesis of amino acid derivatives substituted in the backbone with stable isotopes for application in peptide synthesis. J. Chem. Soc. Perkin Trans. 1 1994, 17, 2503–2510. [Google Scholar] [CrossRef]
  154. Rose, J.E.; Leeson, P.D.; Gani, D. Stereospecific synthesis of α-deuteriated α-amino acids: Regiospecific deuteriation of chiral 3-isopropyl-2,5-dimethoxy-3,6-dihydropyrazines. J. Chem. Soc. Perkin Trans. 1 1995, 2, 1563–1565. [Google Scholar] [CrossRef]
  155. Jung, P.G.; Kim, B.; Park, S.-R.; So, H.-Y.; Shi, L.H.; Kim, Y. Determination of serum cortisol using isotope dilution?liquid chromatography?mass spectrometry as a candidate reference method. Anal. Bioanal. Chem. 2004, 380, 782–788. [Google Scholar] [CrossRef]
  156. Gries, W.; Küpper, K.; Leng, G. Rapid and sensitive LC–MS–MS determination of 2-mercaptobenzothiazole, a rubber additive, in human urine. Anal. Bioanal. Chem. 2015, 407, 3417–3423. [Google Scholar] [CrossRef]
  157. Brun, V.; Masselon, C.; Garin, J.; Dupuis, A. Isotope dilution strategies for absolute quantitative proteomics. J. Proteom. 2009, 72, 740–749. [Google Scholar] [CrossRef]
  158. Guo, K.; Ji, C.; Li, L. Stable-Isotope Dimethylation Labeling Combined with LC−ESI MS for Quantification of Amine-Containing Metabolites in Biological Samples. Anal. Chem. 2007, 79, 8631–8638. [Google Scholar] [CrossRef]
  159. Di Palma, S.; Raijmakers, R.; Heck, A.J.R.; Mohammed, S. Evaluation of the Deuterium Isotope Effect in Zwitterionic Hydrophilic Interaction Liquid Chromatography Separations for Implementation in a Quantitative Proteomic Approach. Anal. Chem. 2011, 83, 8352–8356. [Google Scholar] [CrossRef]
  160. Turowski, M.; Yamakawa, N.; Meller, J.; Kimata, K.; Ikegami, T.; Hosoya, K.; Tanaka, N.; Thornton, E.R. Deuterium Isotope Effects on Hydrophobic Interactions: The Importance of Dispersion Interactions in the Hydrophobic Phase. J. Am. Chem. Soc. 2003, 125, 13836–13849. [Google Scholar] [CrossRef] [PubMed]
  161. Iyer, S.S.; Zhang, Z.-P.; Kellogg, G.; Karnes, H.T. Evaluation of Deuterium Isotope Effects in Normal-Phase LC-MS-MS Separations Using a Molecular Modeling Approach. J. Chromatogr. Sci. 2004, 42, 383–387. [Google Scholar] [CrossRef] [PubMed] [Green Version]
  162. Bogusz, M.J.; Maier, R.-D.; Driessen, S. Morphine, Morphine-3-Glucuronide, Morphine-6-Glucuronide, and 6-Monoacetylmorphine Determined by Means of Atmospheric Pressure Chemical Ionization-Mass Spectrometry-Liquid Chromatography in Body Fluids of Heroin Victims. J. Anal. Toxicol. 1997, 21, 346–355. [Google Scholar] [CrossRef] [PubMed] [Green Version]
  163. Bogusz, M.J.; Maier, R.-D.; Erkens, M.; Driessen, S. Determination of morphine and its 3-and 6-glucuronides, codeine, codeine-glucuronide and 6-monoacetylmorphine in body fluids by liquid chromatography atmospheric pressure chemical ionization mass spectrometry. J. Chromatogr. B Biomed. Sci. Appl. 1997, 703, 115–127. [Google Scholar] [CrossRef]
  164. Tai, S.S.-C.; Christensen, R.; Paule, R.; Sander, L.; Welch, M. The Certification of Morphine and Codeine in a Human Urine Standard Reference Material. J. Anal. Toxicol. 1994, 18, 7–12. [Google Scholar] [CrossRef]
  165. Slawson, M.H.; Crouch, D.J.; Andrenyak, D.M.; Rollins, U.E.; Lu, J.K.; Bailey, P.L. Determination of morphine, morphine-3-glucuronide, and morphine-6-glucuronide in plasma after intravenous and intrathecal morphine administration using HPLC with electrospray ionization and tandem mass spectrometry. J. Anal. Toxicol. 1999, 23, 468–473. [Google Scholar] [CrossRef] [Green Version]
  166. Wang, P.; Bartlett, M.G. Collision-induced dissociation mass spectra of cocaine, and its metabolites and pyrolysis products. Biol. Mass Spectrom. 1998, 33, 961–967. [Google Scholar] [CrossRef]
  167. Sosnoff, C.S.; Ann, Q.; Bernert, J.T.; Powell, M.K.; Miller, B.B.; Henderson, L.O.; Hannon, W.H.; Fernhoff, P.; Sampson, E.J. Analysis of Benzoylecgonine in Dried Blood Spots by Liquid Chromatography-Atmospheric Pressure Chemical Ionization Tandem Mass Spectrometry. J. Anal. Toxicol. 1996, 20, 179–184. [Google Scholar] [CrossRef] [Green Version]
  168. Singh, G.; Arora, V.; Fenn, P.T.; Mets, B.; Blair, I.A. A Validated Stable Isotope Dilution Liquid Chromatography Tandem Mass Spectrometry Assay for the Trace Analysis of Cocaine and Its Major Metabolites in Plasma. Anal. Chem. 1999, 71, 2021–2027. [Google Scholar] [CrossRef]
  169. Breindahl, T.; Andreasen, K. Determination of 11-nor-Δ9-tetrahydrocannabinol-9-carboxylic acid in urine using high-performance liquid chromatography and electrospray ionization mass spectrometry. J. Chromatogr. B 1999, 732, 155–164. [Google Scholar] [CrossRef]
  170. Bogusz, M.J.; Kruger, K.-D.; Maier, R.-D. Analysis of Underivatized Amphetamines and Related Phenethylamines with High-Performance Liquid Chromatography-Atmospheric Pressure Chemical Ionization Mass Spectrometry. J. Anal. Toxicol. 2000, 24, 77–84. [Google Scholar] [CrossRef] [PubMed] [Green Version]
  171. Goff, M.L.; Miller, M.L.; Paulson, J.D.; Lord, W.D.; Richards, E.; Omori, A.I. Effects of 3,4-Methylenedioxymethamphetamine in Decomposing Tissues on the Development of Parasarcophaga ruficornis (Diptera: Sarcophagidae) and Detection of the Drug in Postmortem Blood, Liver Tissue, Larvae, and Puparia. J. Forensic Sci. 1997, 42, 276–280. [Google Scholar] [CrossRef] [PubMed]
  172. Bogusz, M.J.; Maier, R.-D.; Krüger, K.-D.; Kohls, U. Determination of Common Drugs of Abuse in Body Fluids Using One Isolation Procedure and Liquid Chromatography-Atmospheric-Pressure Chemical-Ionization Mass Spectrometry*. J. Anal. Toxicol. 1998, 22, 549–558. [Google Scholar] [CrossRef] [PubMed] [Green Version]
  173. Bąchor, R.; Setner, B.; Kluczyk, A.; Stefanowicz, P.; Szewczuk, Z. The unusual hydrogen-deuterium exchange of α-carbon protons in N-substituted glycine-containing peptides. Biol. Mass Spectrom. 2014, 49, 43–49. [Google Scholar] [CrossRef]
  174. Bąchor, R.; Kluczyk, A.; Stefanowicz, P.; Szewczuk, Z. Preparation of novel deuterated cyclosporin A standards for quantitative LC-MS analysis. Biol. Mass Spectrom. 2017, 52, 817–822. [Google Scholar] [CrossRef]
  175. Bąchor, R.; Konieczny, A.; Szewczuk, Z. Preparation of Isotopically Labelled Standards of Creatinine Via H/D Exchange and Their Application in Quantitative Analysis by LC-MS. Molecules 2020, 25, 1514. [Google Scholar] [CrossRef] [Green Version]
  176. Bąchor, R.; Dębowski, D.; Łęgowska, A.; Stefanowicz, P.; Rolka, K.; Szewczuk, Z. Convenient preparation of deuterium-labeled analogs of peptides containing N -substituted glycines for a stable isotope dilution LC-MS quantitative analysis. J. Pept. Sci. 2015, 21, 819–825. [Google Scholar] [CrossRef]
  177. Bąchor, R.; Kluczyk, A.; Stefanowicz, P.; Szewczuk, Z. Facile synthesis of deuterium-labeled denatonium cation and its application in the quantitative analysis of Bitrex by liquid chromatography-mass spectrometry. Anal. Bioanal. Chem. 2015, 407, 6557–6561. [Google Scholar] [CrossRef] [Green Version]
  178. Ng, L.-K.; Hupé, M.; Harnois, J.; Lawrence, A.H. Direct Injection Gas Chromatographic/Mass Spectrometric Analysis for Denatonium Benzoate in Specific Denatured Alcohol Formulations. Anal. Chem. 1998, 70, 4389–4393. [Google Scholar] [CrossRef]
  179. Commission Implementing Regulation (EU) No 162/2013 of 21 February 2013 ammending the Annex to Regulation (EC) No 3199/93 on the mutual recognition of procedures for the complete denaturing of alcohol for the purposes of exemption from excise duty. Off. J. Eur. Union 2013, 56, 55–61. Available online: https://eur-lex.europa.eu/LexUriServ/LexUriServ.do?uri=OJ:L:2013:124:FULL:EN:PDF (accessed on 1 August 2022).
  180. Mirgorodskaya, O.A.; Kozmin, Y.P.; Titov, M.I.; Körner, R.; Sönksen, C.P.; Roepstorff, P. Quantitation of peptides and pro-teins by matrix assisted laser desorption/ionization mass spectrometry using 18O-labeled internal standards. Rapid Commun. Mass Spectrom. 2000, 14, 1226–1232. [Google Scholar] [CrossRef]
  181. Lee, J.H.; Na Park, H.; Park, S.; Lee, Y.-M.; Kang, H. Development of a specific fragment pattern-based quadrupole-Orbitrap mass spectrometry method to screen adulterated products of phosphodiesterase-5 inhibitors and their analogues. Sci. Justice 2019, 59, 433–441. [Google Scholar] [CrossRef] [PubMed]
  182. Lee, J.H.; Park, H.N.; Park, O.R.; Kim, N.S.; Park, S.-K.; Kang, H. Screening of illegal sexual enhancement supplements and counterfeit drugs sold in the online and offline markets between 2014 and 2017. Forensic Sci. Int. 2019, 298, 10–19. [Google Scholar] [CrossRef] [PubMed]
  183. Wilms, W.; Woźniak-Karczewska, M.; Corvini, P.F.-X.; Chrzanowski, Ł. Nootropic drugs: Methylphenidate, modafinil and piracetam—Population use trends, occurrence in the environment, ecotoxicity and removal methods—A review. Chemosphere 2019, 233, 771–785. [Google Scholar] [CrossRef]
  184. Löscher, W.; Richter, A. Piracetam and levetiracetam, two pyrrolidone derivatives, exert antidystonic activity in a hamster model of paroxysmal dystonia. Eur. J. Pharmacol. 2000, 391, 251–254. [Google Scholar] [CrossRef]
  185. Winblad, B. Piracetam: A Review of Pharmacological Properties and Clinical Uses. CNS Drug Rev. 2006, 11, 169–182. [Google Scholar] [CrossRef]
  186. Kim, S.; Park, J.-H.; Myung, S.-W.; Lho, D.-S. Determination of carphedon in human urine by solid-phase microextraction using capillary gas chromatography with nitrogen–phosphorus detection. Analyst 1999, 124, 1559–1562. [Google Scholar] [CrossRef]
  187. Shirayama, Y.; Yamamoto, A.; Nishimura, T.; Katayama, S.; Kawahara, R. Subsequent exposure to the choline uptake enhancer MKC-231 antagonizes phencyclidine-induced behavioral deficits and reduction in septal cholinergic neurons in rats. Eur. Neuropsychopharmacol. 2007, 17, 616–626. [Google Scholar] [CrossRef]
  188. Malykh, A.G.; Sadaie, M.R. Piracetam and Piracetam-Like Drugs: From basic science to novel clinical applications to CNS disorders. Drugs 2010, 70, 287–312. [Google Scholar] [CrossRef]
  189. Keating, G.M.; Raffin, M.J. Modafinil. a review of its use in excessive sleepiness associated with obstructive sleep apnoea/hypopnoea syndrome and shift work sleep disorder. CNS Drugs 2005, 19, 785–803. [Google Scholar] [CrossRef]
  190. Garnock-Jones, K.P.; Dhillon, S.; Scott, L.J. Armodafinil. CNS Drugs 2009, 23, 793–803. [Google Scholar] [CrossRef]
  191. Baselt, R.C. Dispositon of Toxic Drugs and Chemicals in Man; Biomedical Publications: Foster City, CA, USA, 1982; pp. 1152–1153. ISBN 978-0-9626523-7-0. [Google Scholar]
  192. Available online: https://www.wada-ama.org/sites/default/files/prohibited_list_2018_en.pdf (accessed on 23 May 2022).
  193. Moreno, J.D. Juicing the Brain. Sci. Am. Mind 2006, 17, 66–73. [Google Scholar] [CrossRef]
  194. Dance, A. Smart drugs: A dose of intelligence. Nature 2016, 531, S2–S3. [Google Scholar] [CrossRef]
  195. Battleday, R.; Brem, A.-K. Modafinil for cognitive neuroenhancement in healthy non-sleep-deprived subjects: A systematic review. Eur. Neuropsychopharmacol. 2015, 25, 1865–1881. [Google Scholar] [CrossRef]
  196. Kredlow, M.A.; Keshishian, A.; Oppenheimer, S.; Otto, M.W. The Efficacy of Modafinil as a Cognitive Enhancer: A Systematic Review and Meta-Analysis. J. Clin. Psychopharmacol. 2019, 39, 455–461. [Google Scholar] [CrossRef]
  197. Roberts, C.A.; Jones, A.; Sumnall, H.; Gage, S.H.; Montgomery, C. How effective are pharmaceuticals for cognitive enhancement in healthy adults? A series of meta-analyses of cognitive performance during acute administration of modafinil, methylphenidate and D-amphetamine. Eur. Neuropsychopharmacol. 2020, 38, 40–62. [Google Scholar] [CrossRef]
  198. Grocholska, P.; Wieczorek, R.; Bąchor, R. Preparation of Deuterium-Labeled Armodafinil by Hydrogen–Deuterium Exchange and Its Application in Quantitative Analysis by LC-MS. Metabolites 2022, 12, 578. [Google Scholar] [CrossRef]
Figure 1. LCMS chromatograms of (A) sildenafil standard and two dietary supplement samples: JT (B) and CKP (C). Inserts included in all three panels show MS spectra collected at 4.75/4.56/4.57 min. Peak m/z = 475.208 corresponds to the [M + H]+ ion for sildenafil, m/z = 497.193 and 513.167 to [M + Na]+ and [M + K]+, respectively.
Chemosensors 10 00324 g001
Figure 2. Comparison of the MS/MS spectra of (A) sildenafil standard and (B) dietary supplement sample JT. Precursor ion m/z = 475.210, CE = 40 ± 10 eV.
Chemosensors 10 00324 g002
Figure 3. (A) Extracted ion chromatogram of sample JD for m/z = 677.2406–677.2474 corresponding to icariin. (B) MS/MS spectrum for the precursor ion m/z 677.249, at retention time 5.356 min, CE = 30 ± 15 eV. Fragments m/z 313.071, 531.191and 369.136 confirm presence of icariin in the sample.
Chemosensors 10 00324 g003
Figure 4. General drug detection window (based on [66]).
Chemosensors 10 00324 g004
Figure 5. LCMS chromatogram of cosmetic hair product. Top panel: gray line indicates total ion current (TIC), whereas green line (A) represents extracted ion chromatogram (XIC) for laureth betaine [M]+ m/z = 272.252, red line (B) represents XIC for laureth sulfosuccinate [M − H] m/z = 365.163. Mass spectra corresponding to the indicated peaks are shown in the panels. LC-ESI-MS system (Shimadzu LC-IT-TOF) was used.
Chemosensors 10 00324 g005
Figure 6. Mass spectrum averaged for 0.1 min time period of LCMS chromatogram of facial moisturizing toner, containing PEG/PPG-17/6 copolymer. Green dots indicate a series of protonated ions [M + 2H]2+ consisting of 5 PPG units and 8–20 PEG units (PEG/PPG (8–20)/5), whereas red dots indicate PEG/PPG (17–29)/4. LC-ESI-MS system (Shimadzu LC-IT-TOF) was used.
Chemosensors 10 00324 g006
Figure 7. Structures of selected surfactants.
Chemosensors 10 00324 g007
Figure 8. Chemical structure of 5-(dimethylamino)naphthalene-1-sulfonyl chloride (DNS) and N-(4-nitrophenoxycarbonyl)-L-phenylalanine-2-methoxyethylester (S-NIFE).
Chemosensors 10 00324 g008
Figure 9. Reaction scheme of cyanide derivatization by N-(2-(bromomethyl)benzyl)-N,N-diethylethanaminium bromide (CAX-B).
Chemosensors 10 00324 g009
Figure 10. Chemical structure of the product of propofol derivatization using azo-coupling reaction.
Chemosensors 10 00324 g010
Figure 11. Chemical structure of 2-((dimethylamine)methyl)phenol (2-DMAMP).
Chemosensors 10 00324 g011
Figure 12. Chemical structure of domoic acid.
Chemosensors 10 00324 g012
Figure 13. Scheme of derivatization reactions of atropine (DCM, dichloromethane; DMAP, 4-dimethylaminopyridin; EDC, 1-ethyl-3-(3-dimethylaminopropyl)carbodiimide).
Chemosensors 10 00324 g013
Figure 14. Preparation of deuterated Bitrex standard for quantitative analysis by mass spectrometry.
Chemosensors 10 00324 g014
Figure 15. Schematic presentation of tadalafil. N-methylglycine moiety with α-C hydrogen atom marked in blue, N-substituted glycine moiety marked in red.
Chemosensors 10 00324 g015
Figure 16. Schematic presentation of different racetams. N-substituted glycine moiety with α-C hydrogen atoms able to undergo hydrogen-deuterium exchange under basic conditions is marked in blue.
Chemosensors 10 00324 g016
Figure 17. Schematic presentation of deuterated armodafinil preparation (A) and the extracted ion chromatograms with corresponding fragments of mass spectra of the analyzed samples containing armodafinil (black line) and armodafinil-d3 (red line) mixed in (B) 1:1 ratio (C) 1:2 ratio, (D) 2:1 ratio [198].
Chemosensors 10 00324 g017
Table 1. Modern analytical methods used in medicinal drug inspection (based on [2,13,18,19,20]).
Analytical MethodBenefitsDrawbacks
Colorimetryquick, low-costlimited sensitivity
Raman spectroscopyrapid, specific, portable,
fingerprint analysis
requires chemometry for complex samples
Nuclear magnetic resonance (NMR)direct structure elucidationsensitivity,
solvent interference
Separation methods
High-performance thin-layer chromatography (HPTLC)fingerprint of herbal medicinesresolution
Gas chromatography (GC)analysis of volatilesrequires thermal stability or derivatization
High-performance liquid chromatography (HPLC)analysis of biologicalssolvent consumption
Capillary electrophoresis (CE)charge diversificationlimited robustness
Separation methods with MS detection
Gas chromatography-mass spectrometry (GCMS)efficient, sensitive,
databases available
thermal artefacts
Liquid chromatography-mass spectrometry (LCMS)efficient, sensitive,
suitable for labile molecules
ion suppression, size
Table 2. Selected examples of IRMS applications in forensic analysis.
Area of ApplicationExampleReference
Wine[46]
Food originOlive oil[47]
Wheat[48]
Alcohol tamperingWine[49]
Vodka[50]
Drug analysisTestosterone doping[51]
Drugs of abuse[52]
ExplosivesTriacetone triperoxide[53]
Table 4. Derivatizing reagents, their structure and targets.
No.NameChemical StructureApplicationReference
12,4-Dinitrophenylhydrazine Chemosensors 10 00324 i001Carbonyl compounds[119]
2Girard P reagent Chemosensors 10 00324 i002Steroids[119]
3Girard T reagent Chemosensors 10 00324 i003Ketosteroids[120]
42-Hydrazino pyridin Chemosensors 10 00324 i004Ketosteroids[120]
52-Hydrazino-1-methyl pyridin Chemosensors 10 00324 i005Neurosteroids
Ketosteroids
[119,120]
6Methoxyamine Chemosensors 10 00324 i006Ketosteroids[119,120]
73-nitrophenylhydrazine Chemosensors 10 00324 i007Malondi-aldehyde[119]
8Picolinic acid Chemosensors 10 00324 i008Steroids hormones[120]
9Isonicotinoyl azide Chemosensors 10 00324 i009Dihydroxy-
steroids
[120]
10AOA-GRG-CMRR Chemosensors 10 00324 i010Steroids[121]
Table 5. Selected examples of deuterated internal standards used in forensic toxicology for quantitative LC-MS analysis of various drugs.
No.Internal StandardAnalyzed CompoundsSampleReference
1morphine-d3morphine, morphine-3-glucuronide, morphine-6-glucuronide, and 6-monoacetylmorphineurine[162,163]
2morphine-d3, codeine-d3morphine, codeineurine[164]
3morphine-d3, morphine-6-glucuronide-d3morphine, morphine-3-glucuronide, morphine-6-glucuronide, andplasma[165]
4cocaine-d3
benzoylecgonine-d3
ecgonine methyl ester-d3
cocaine and its metabolites-[166]
5benzoylecgonine-d3cocaine and its metabolitesblood spots[167]
6norcocaine-d5
cocaine-d5
benzoylecgonine-d3,
ecgonine methyl ester-d3
cocaine and its metabolitesplasma[168]
7THC-COOH-d3THC-COOHurine[169]
8methamphetamine-d10, amphetamine-d11,
3,4-methylenedioxyethyl-amphetamine-d5,
3,4-methylenedioxymethyl-amphetamine-d5
Amphetamine, methamphetamine,
illicit designer phenethylamines
serum[170,171]
9morphine-d3, morphine-3-glucuronide-d3, morphine-6-glucuronide-d6, codeine-d6, codeine-6-glucuronide-d3, cocaine-d8, benzoylecgonine-d8morphine,
morphine-3-glucuronide, morphine-6-glucuronide, 6-monoacetylmorphine, codeine,
codeine-6-glucuronide, dihydrocodeine, dihydromorphine, buprenorphine, methadone, tramadol, ibogaine,
cocaine, benzoylecgonine ecgonine methyl ester lysergic acid diethylamide
serum, blood, urine[172]
Publisher’s Note: MDPI stays neutral with regard to jurisdictional claims in published maps and institutional affiliations.

