Transmembrane BAX Inhibitor-1 Motif Containing Protein 5 (TMBIM5) Sustains Mitochondrial Structure, Shape, and Function by Impacting the Mitochondrial Protein Synthesis Machinery

 , , , , and
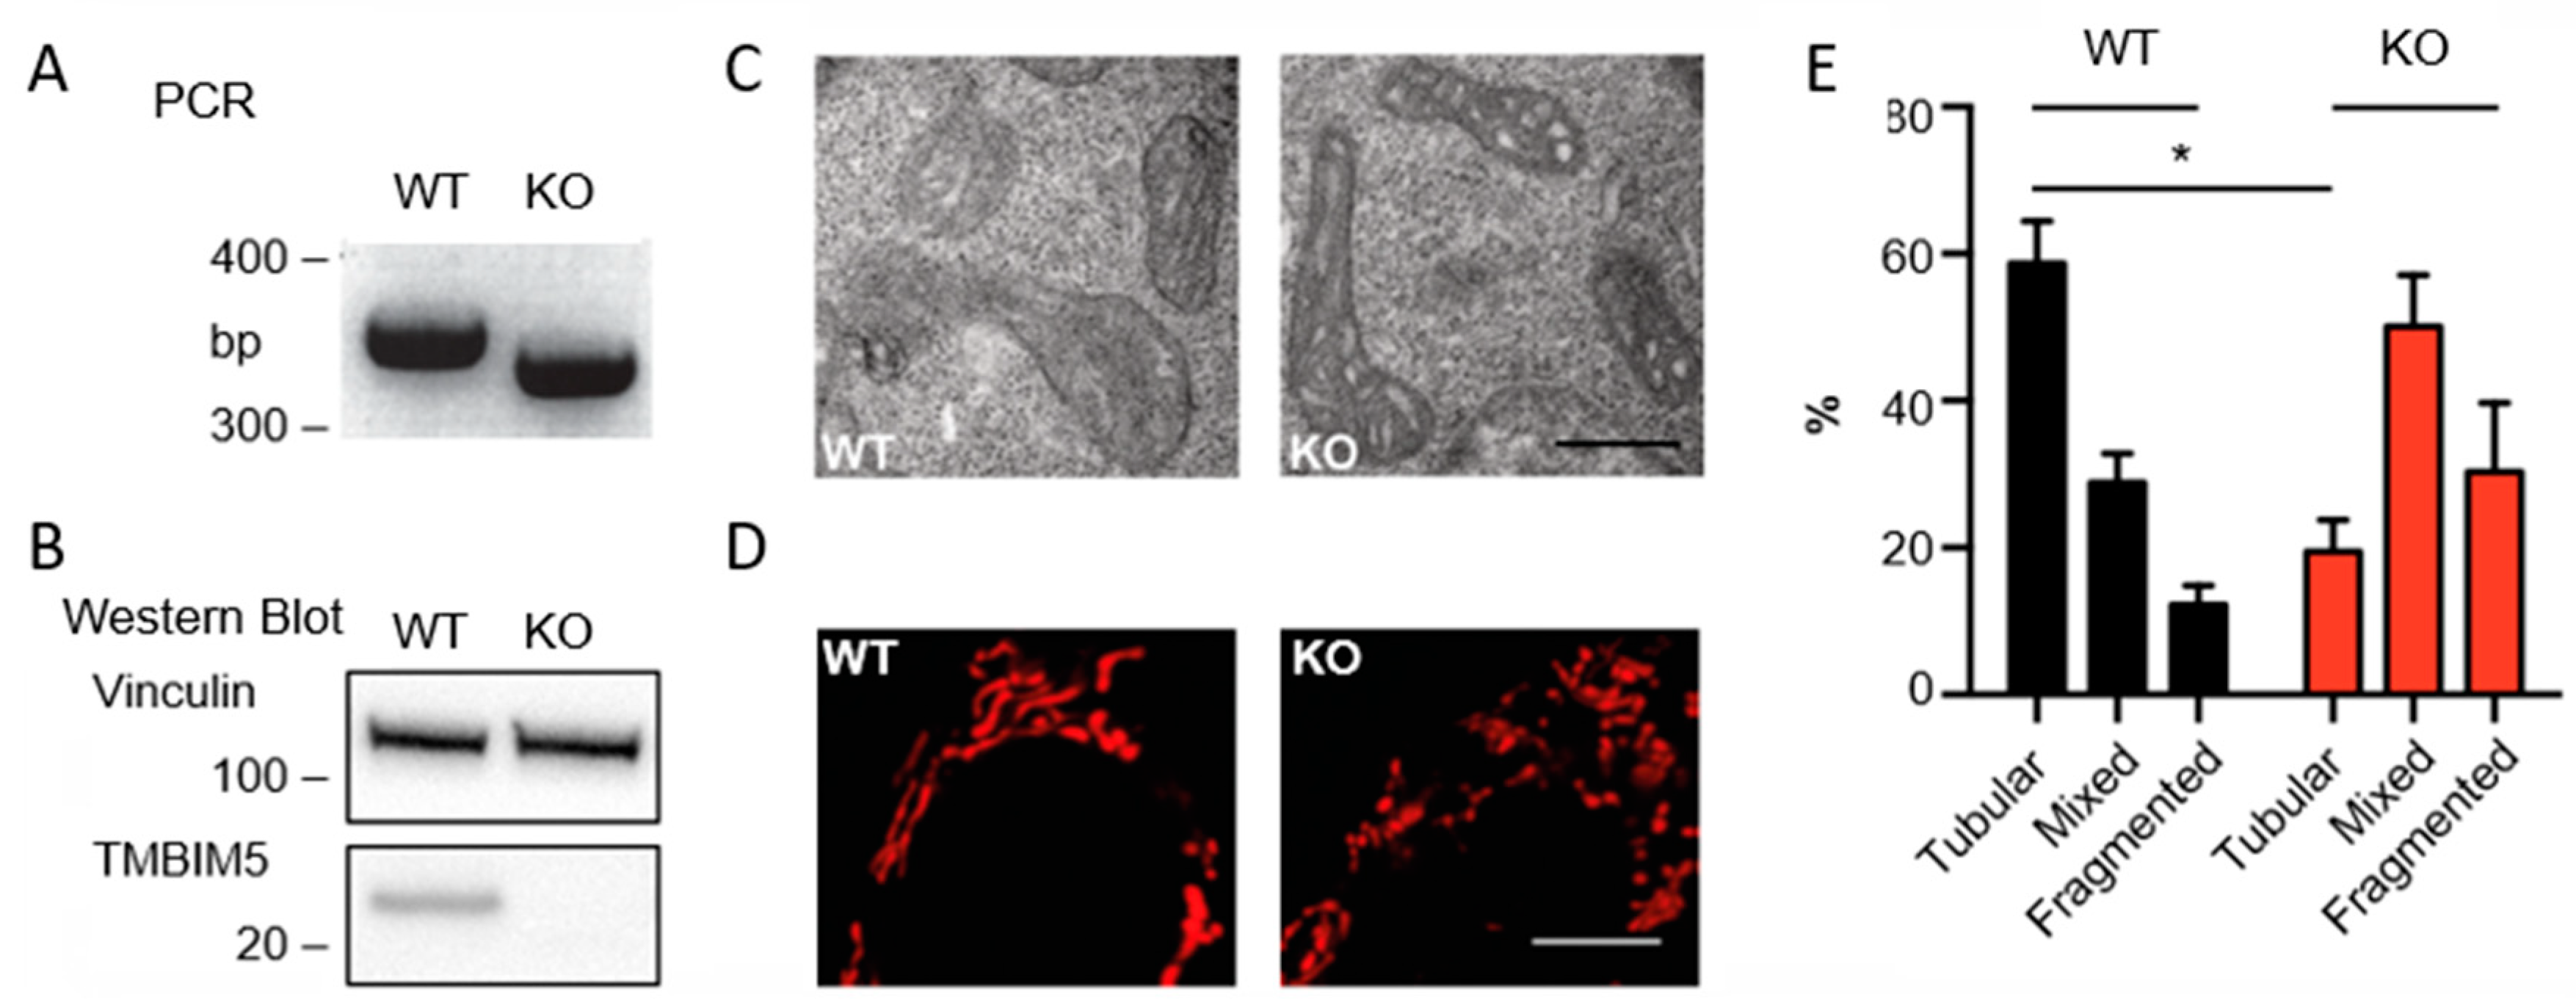
Abstract
:1. Introduction
2. Materials and Methods
2.1. Cell Lines and Cell Culture
2.2. Cell Size and Proliferation
2.3. PCR Verification of HAP1 WT and TMBIM5-KO Cells
2.4. Mitochondria Isolation
2.5. Immunoblotting
2.6. Blue Native PAGE
2.7. Mitochondrial Morphology Analyses
2.8. Mitochondrial Respiration
2.9. ATP Measurements
2.10. Mitochondria-Specific Stains
2.11. Crude Membrane Isolation
2.12. Cell Death Assay
2.13. Label-Free Quantitative Proteomic Analysis
2.14. Statistical Analysis
3. Results
3.1. TMBIM5 Knockout Impairs Cristae Structure and Results in More Fragmented Mitochondria
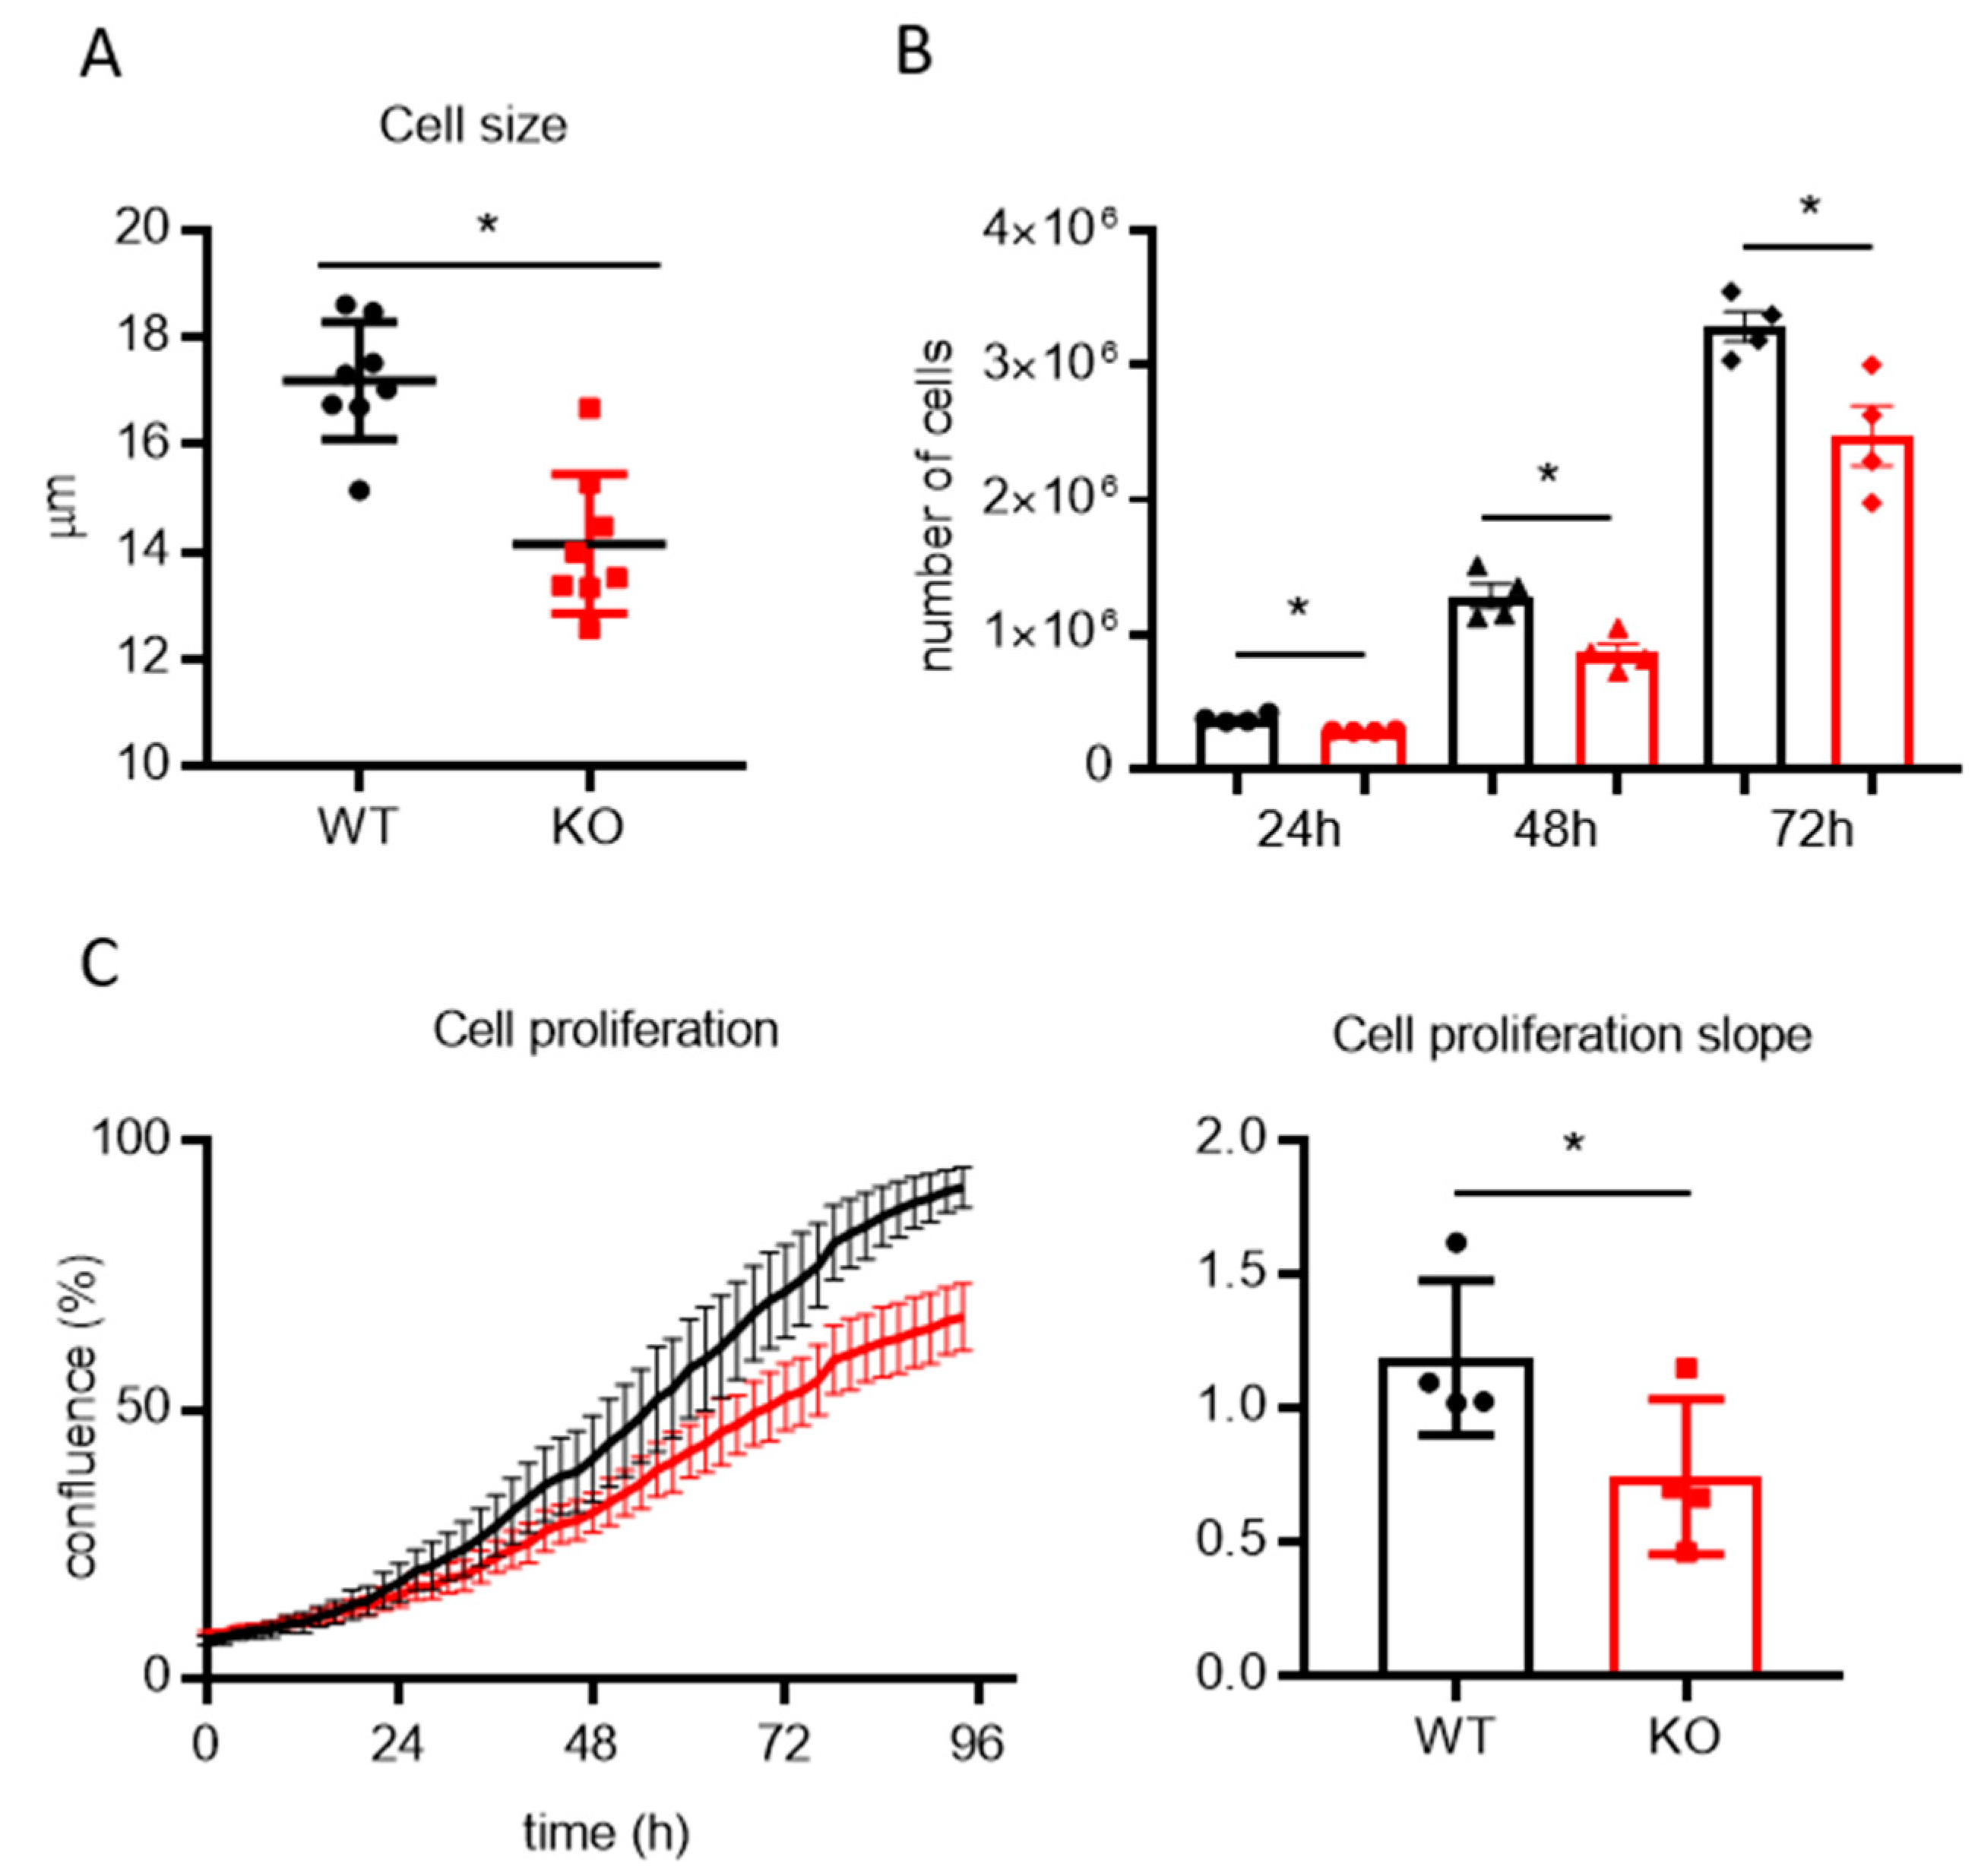
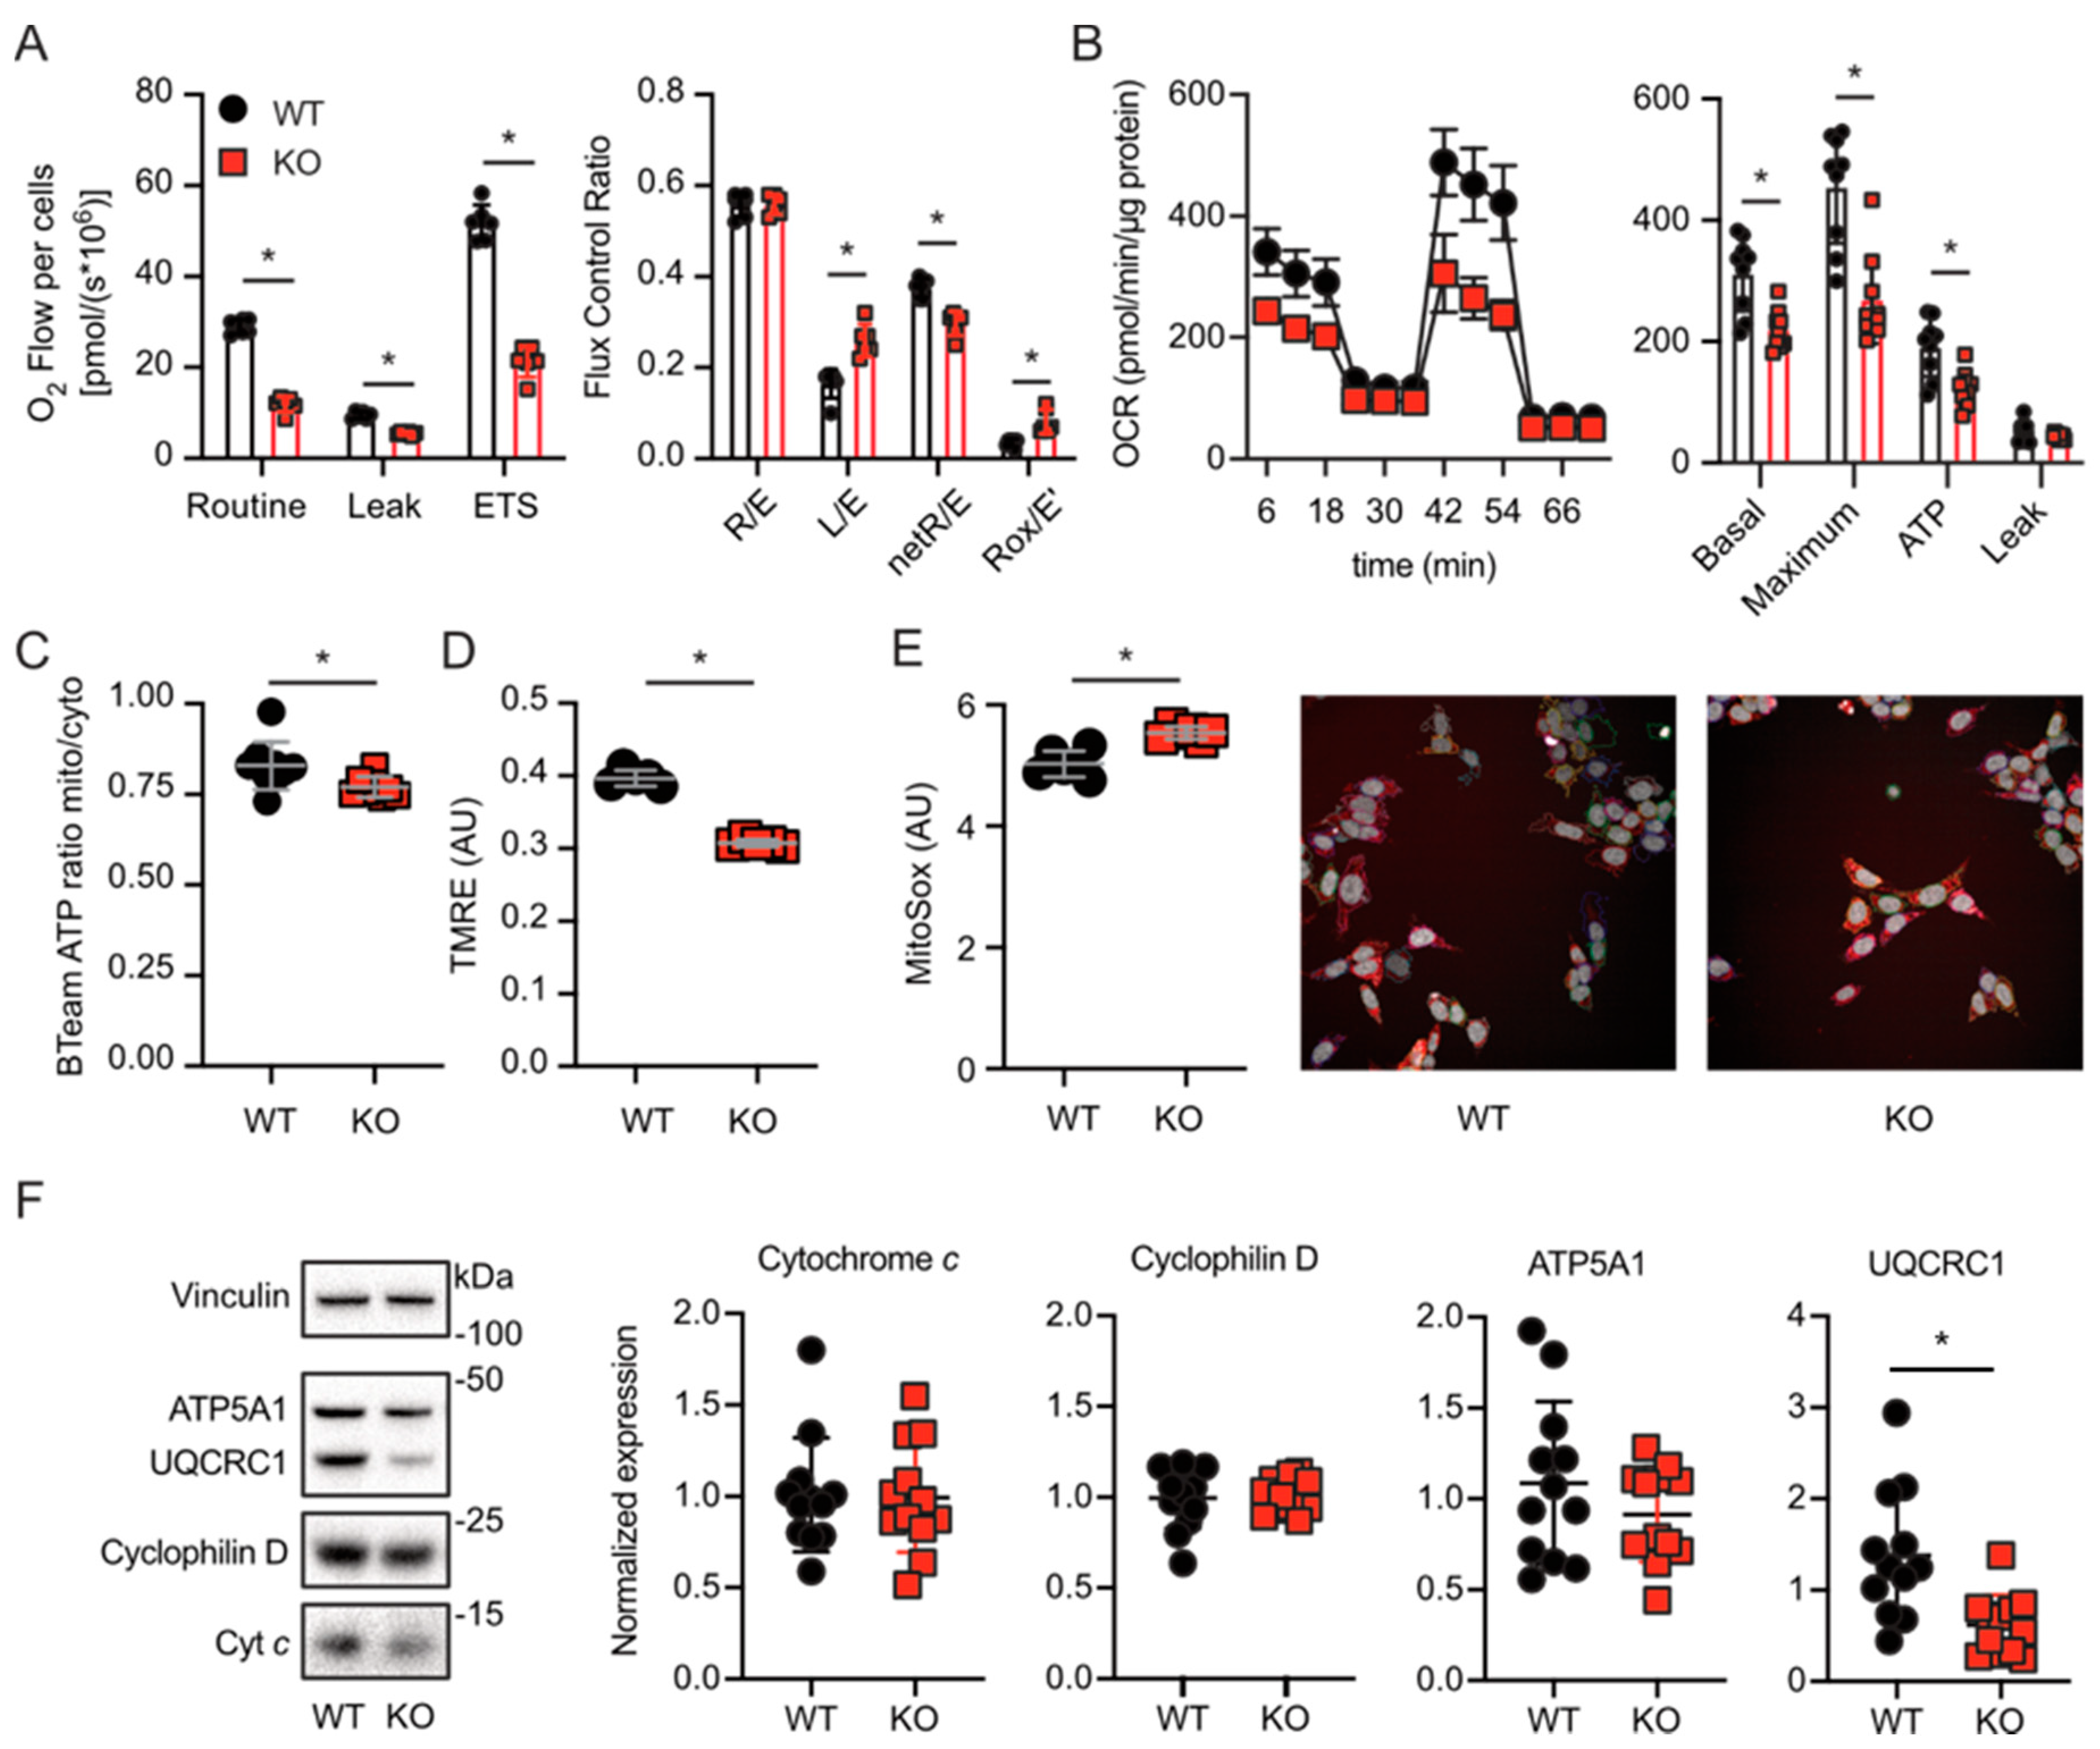
3.2. Lack of TMBIM5 Results in Smaller Cells and an Attenuated Proliferation Concomitant with Impaired Mitochondrial Respiration
3.3. Lack of TMBIM5 Lowers the Abundance of Complex III
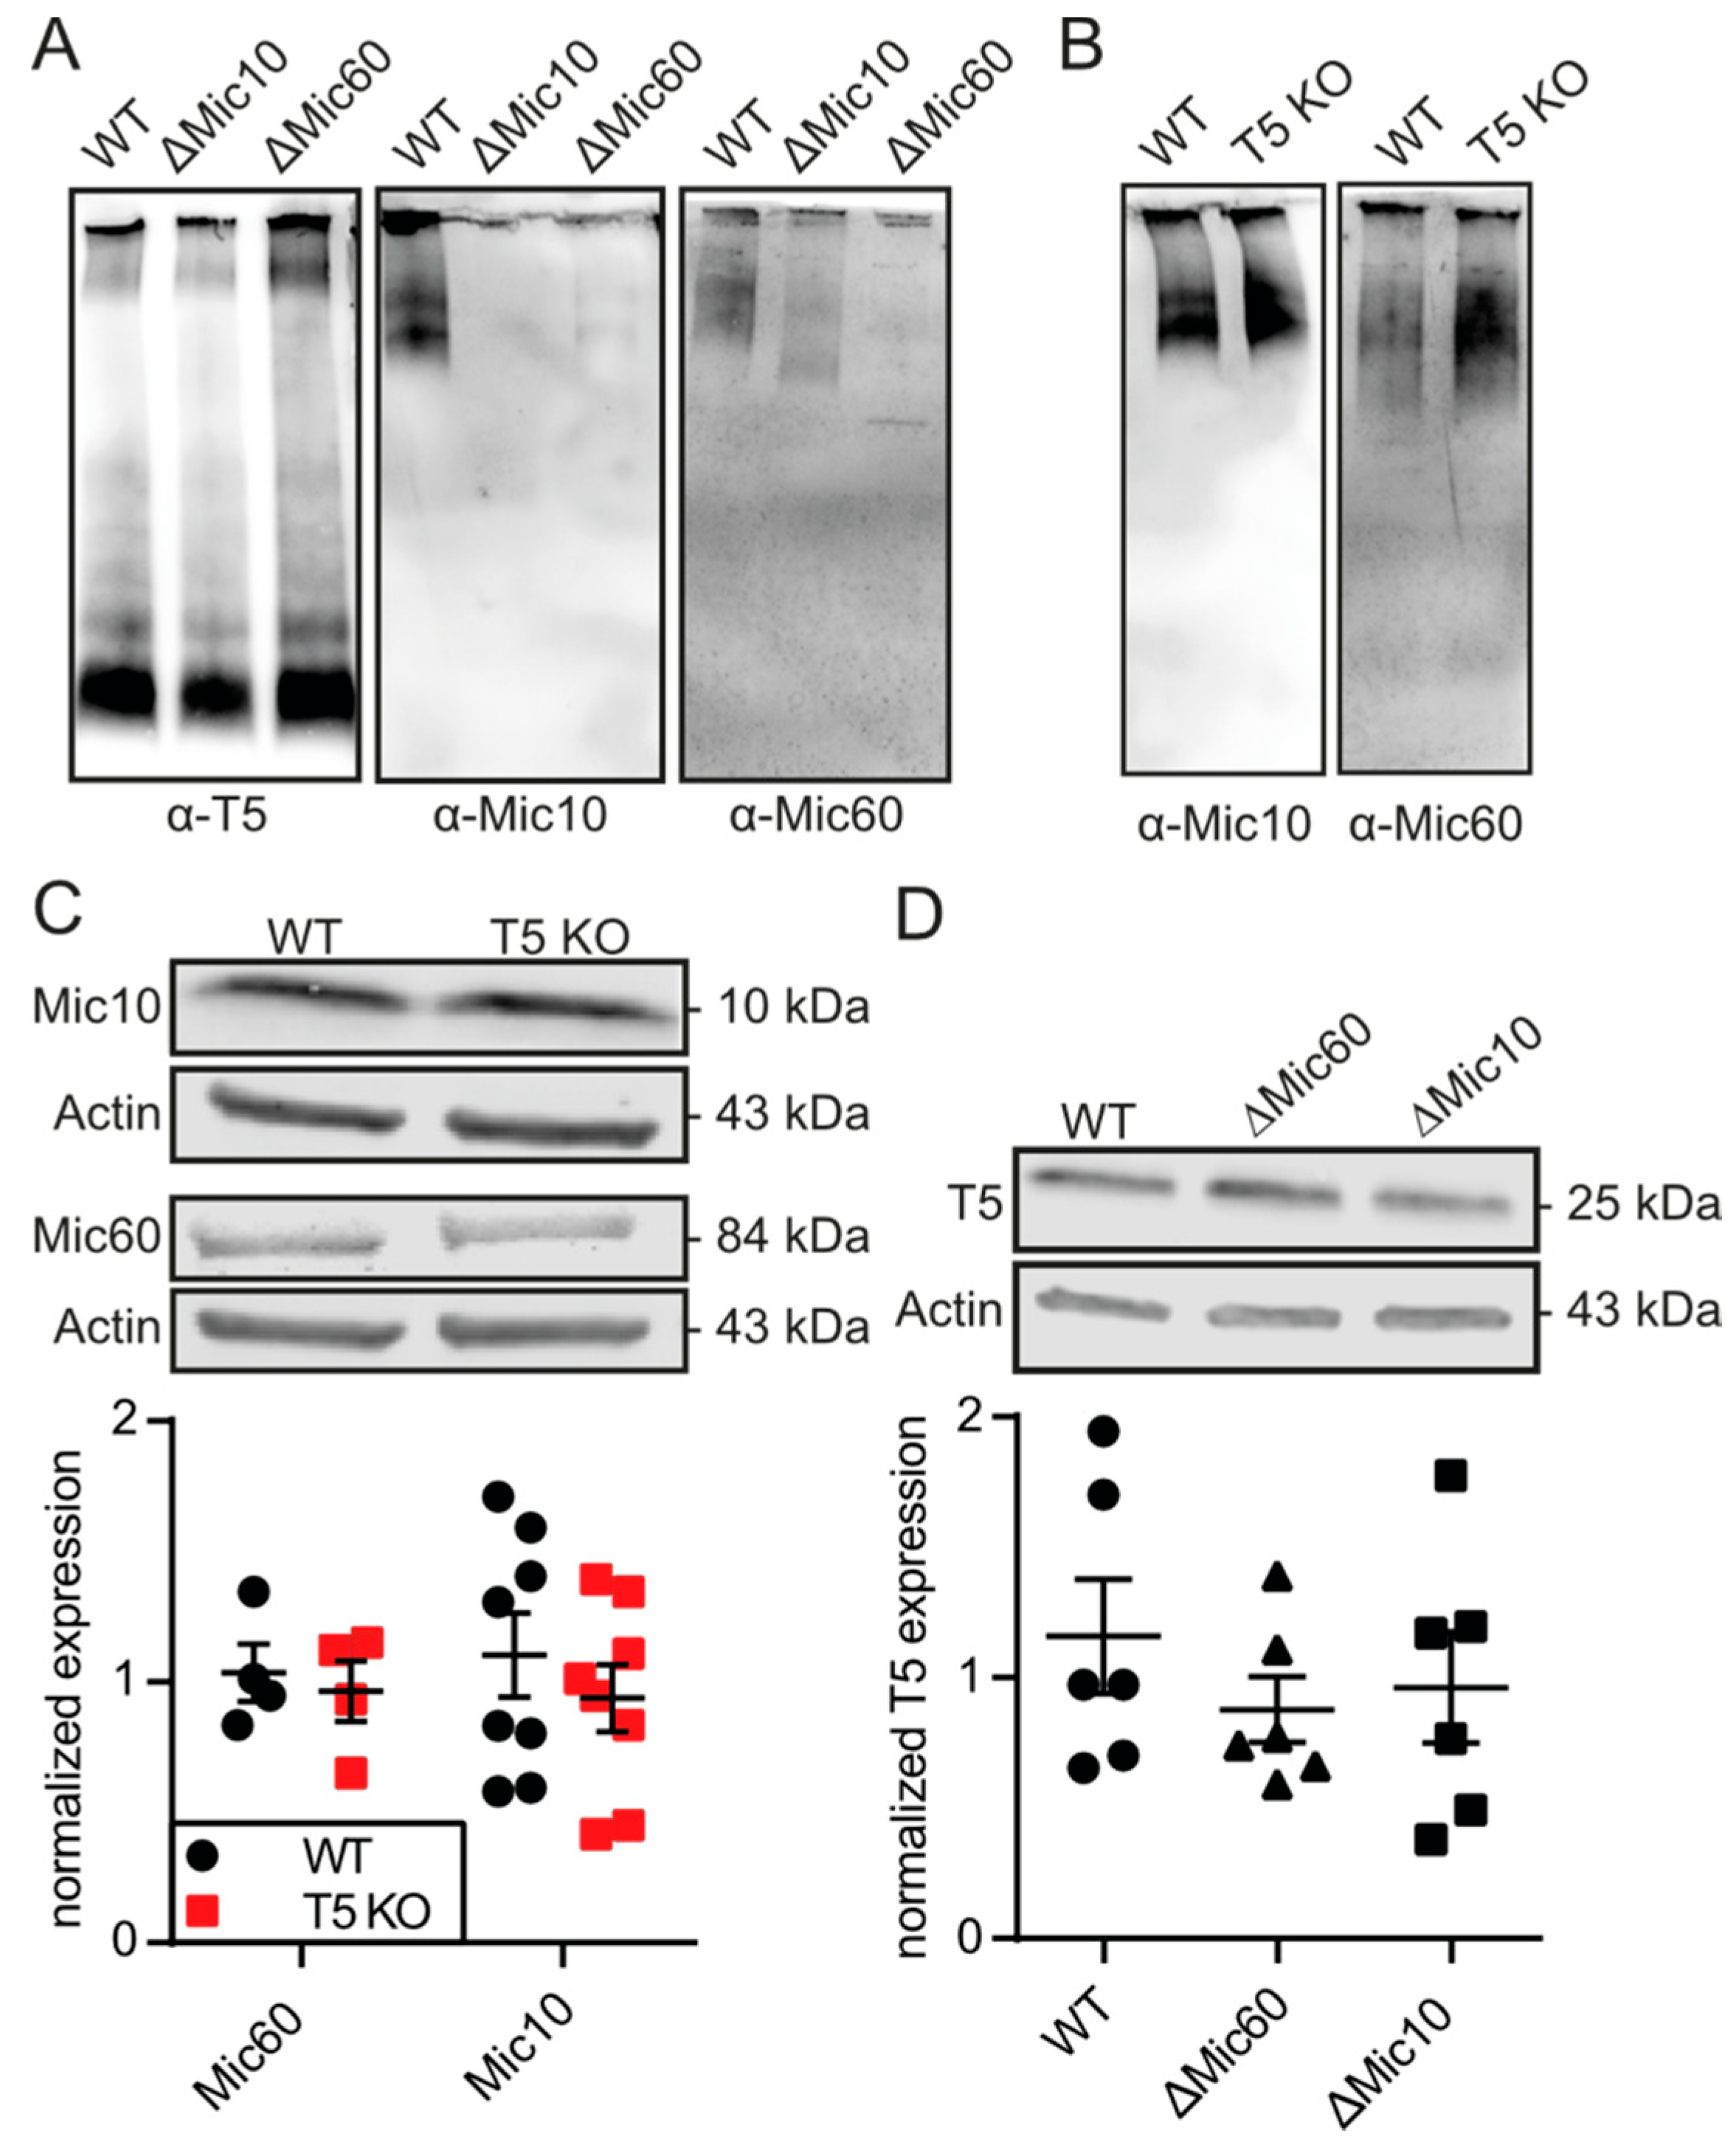
3.4. TMBIM5 Does Not Affect Proteins of the MICOS Complex
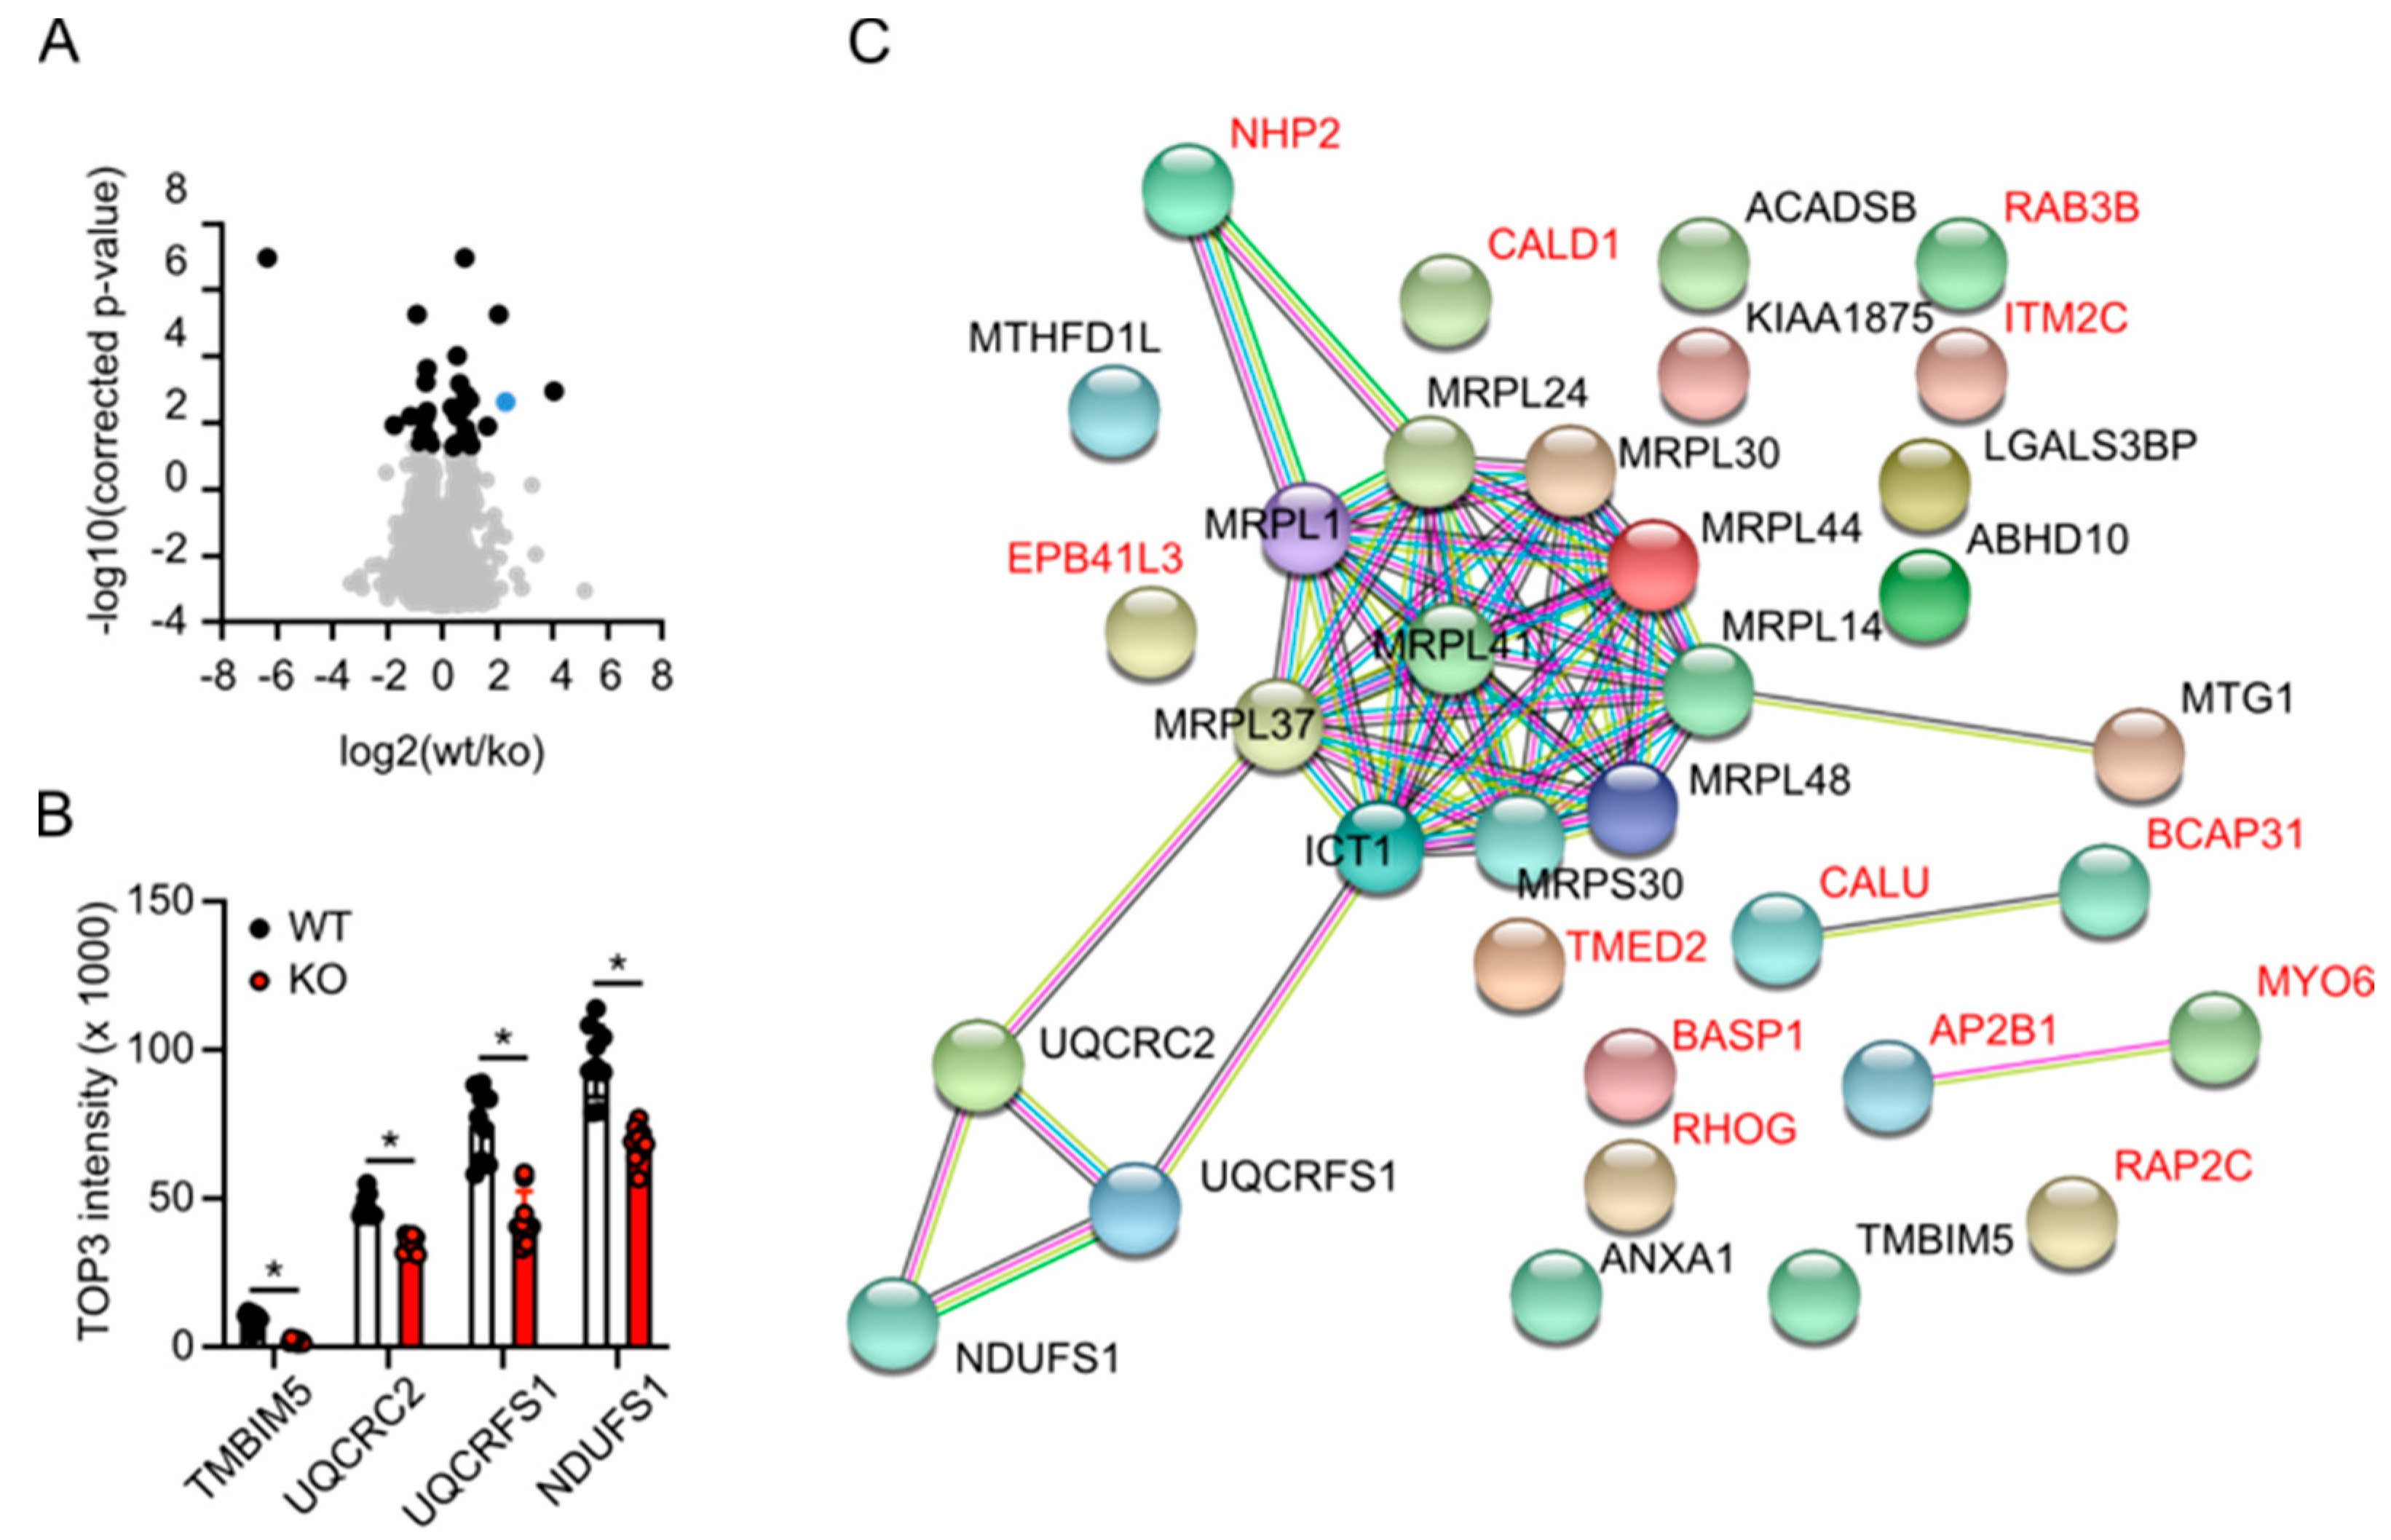
3.5. Label-Free Proteomics Corroborates Complex III Deficiency in TMBIM5-Knockout Cells and Identifies Dysfunctional Mitochondrial Translation as a Potential Phenotype
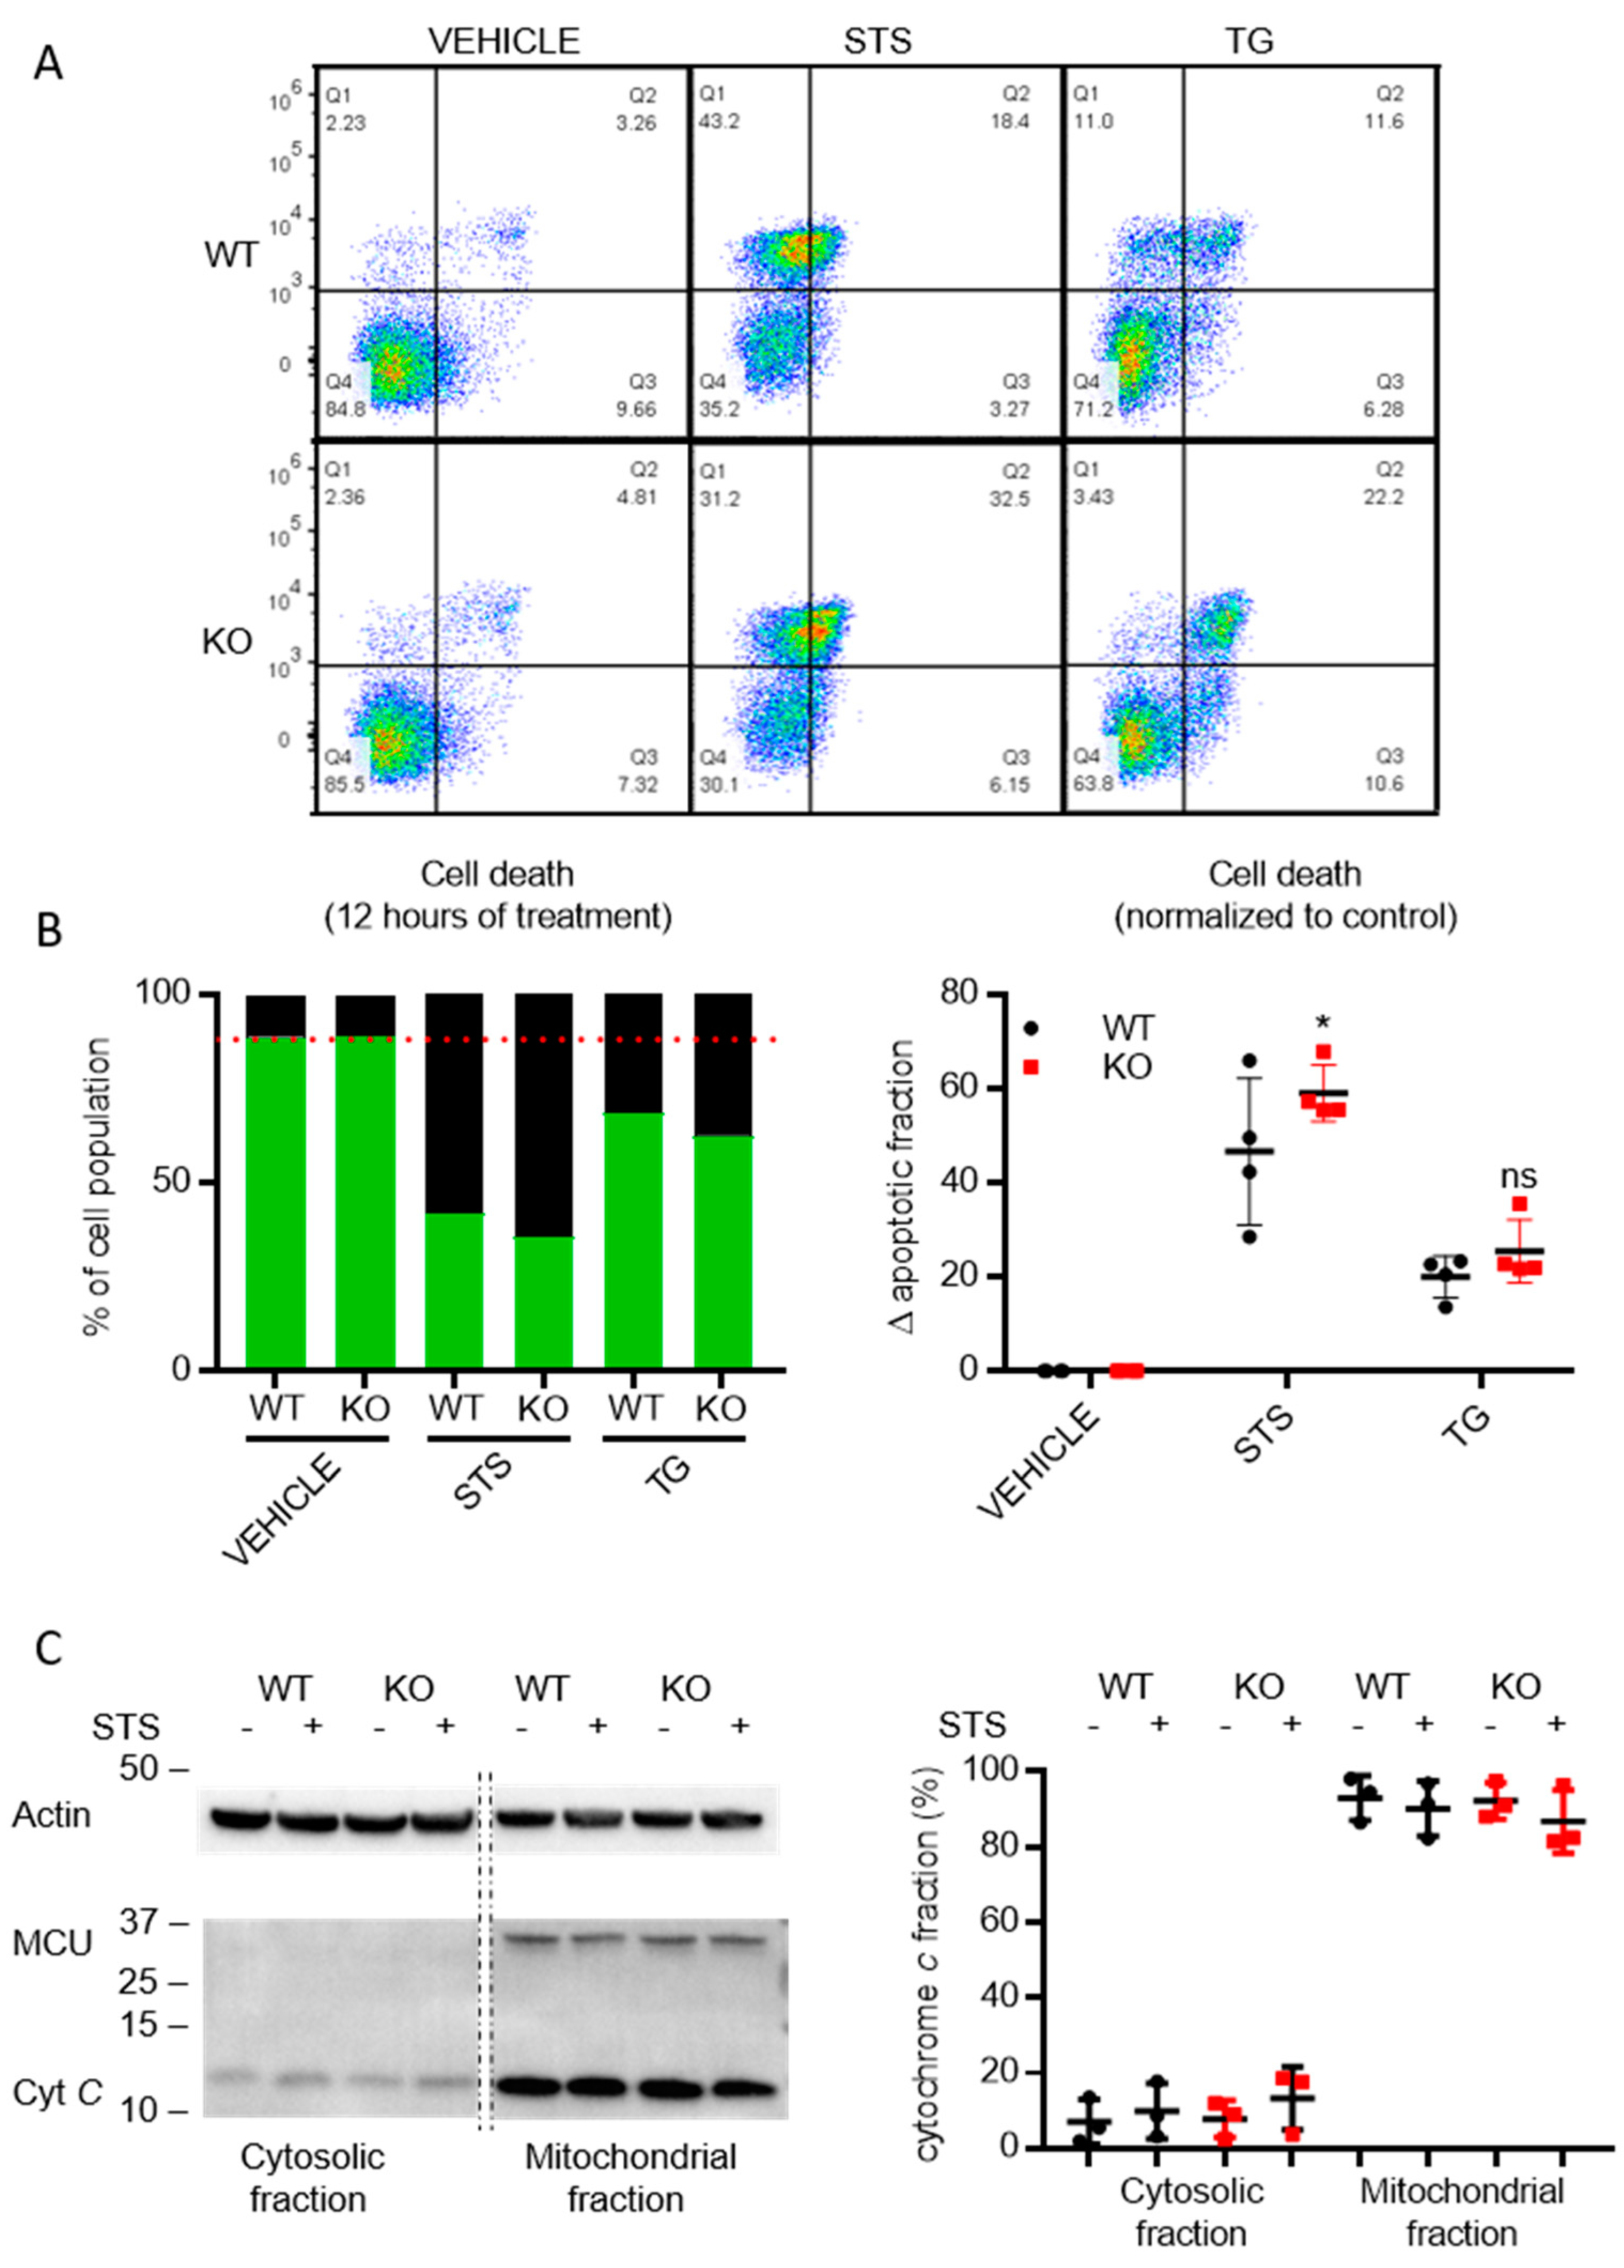
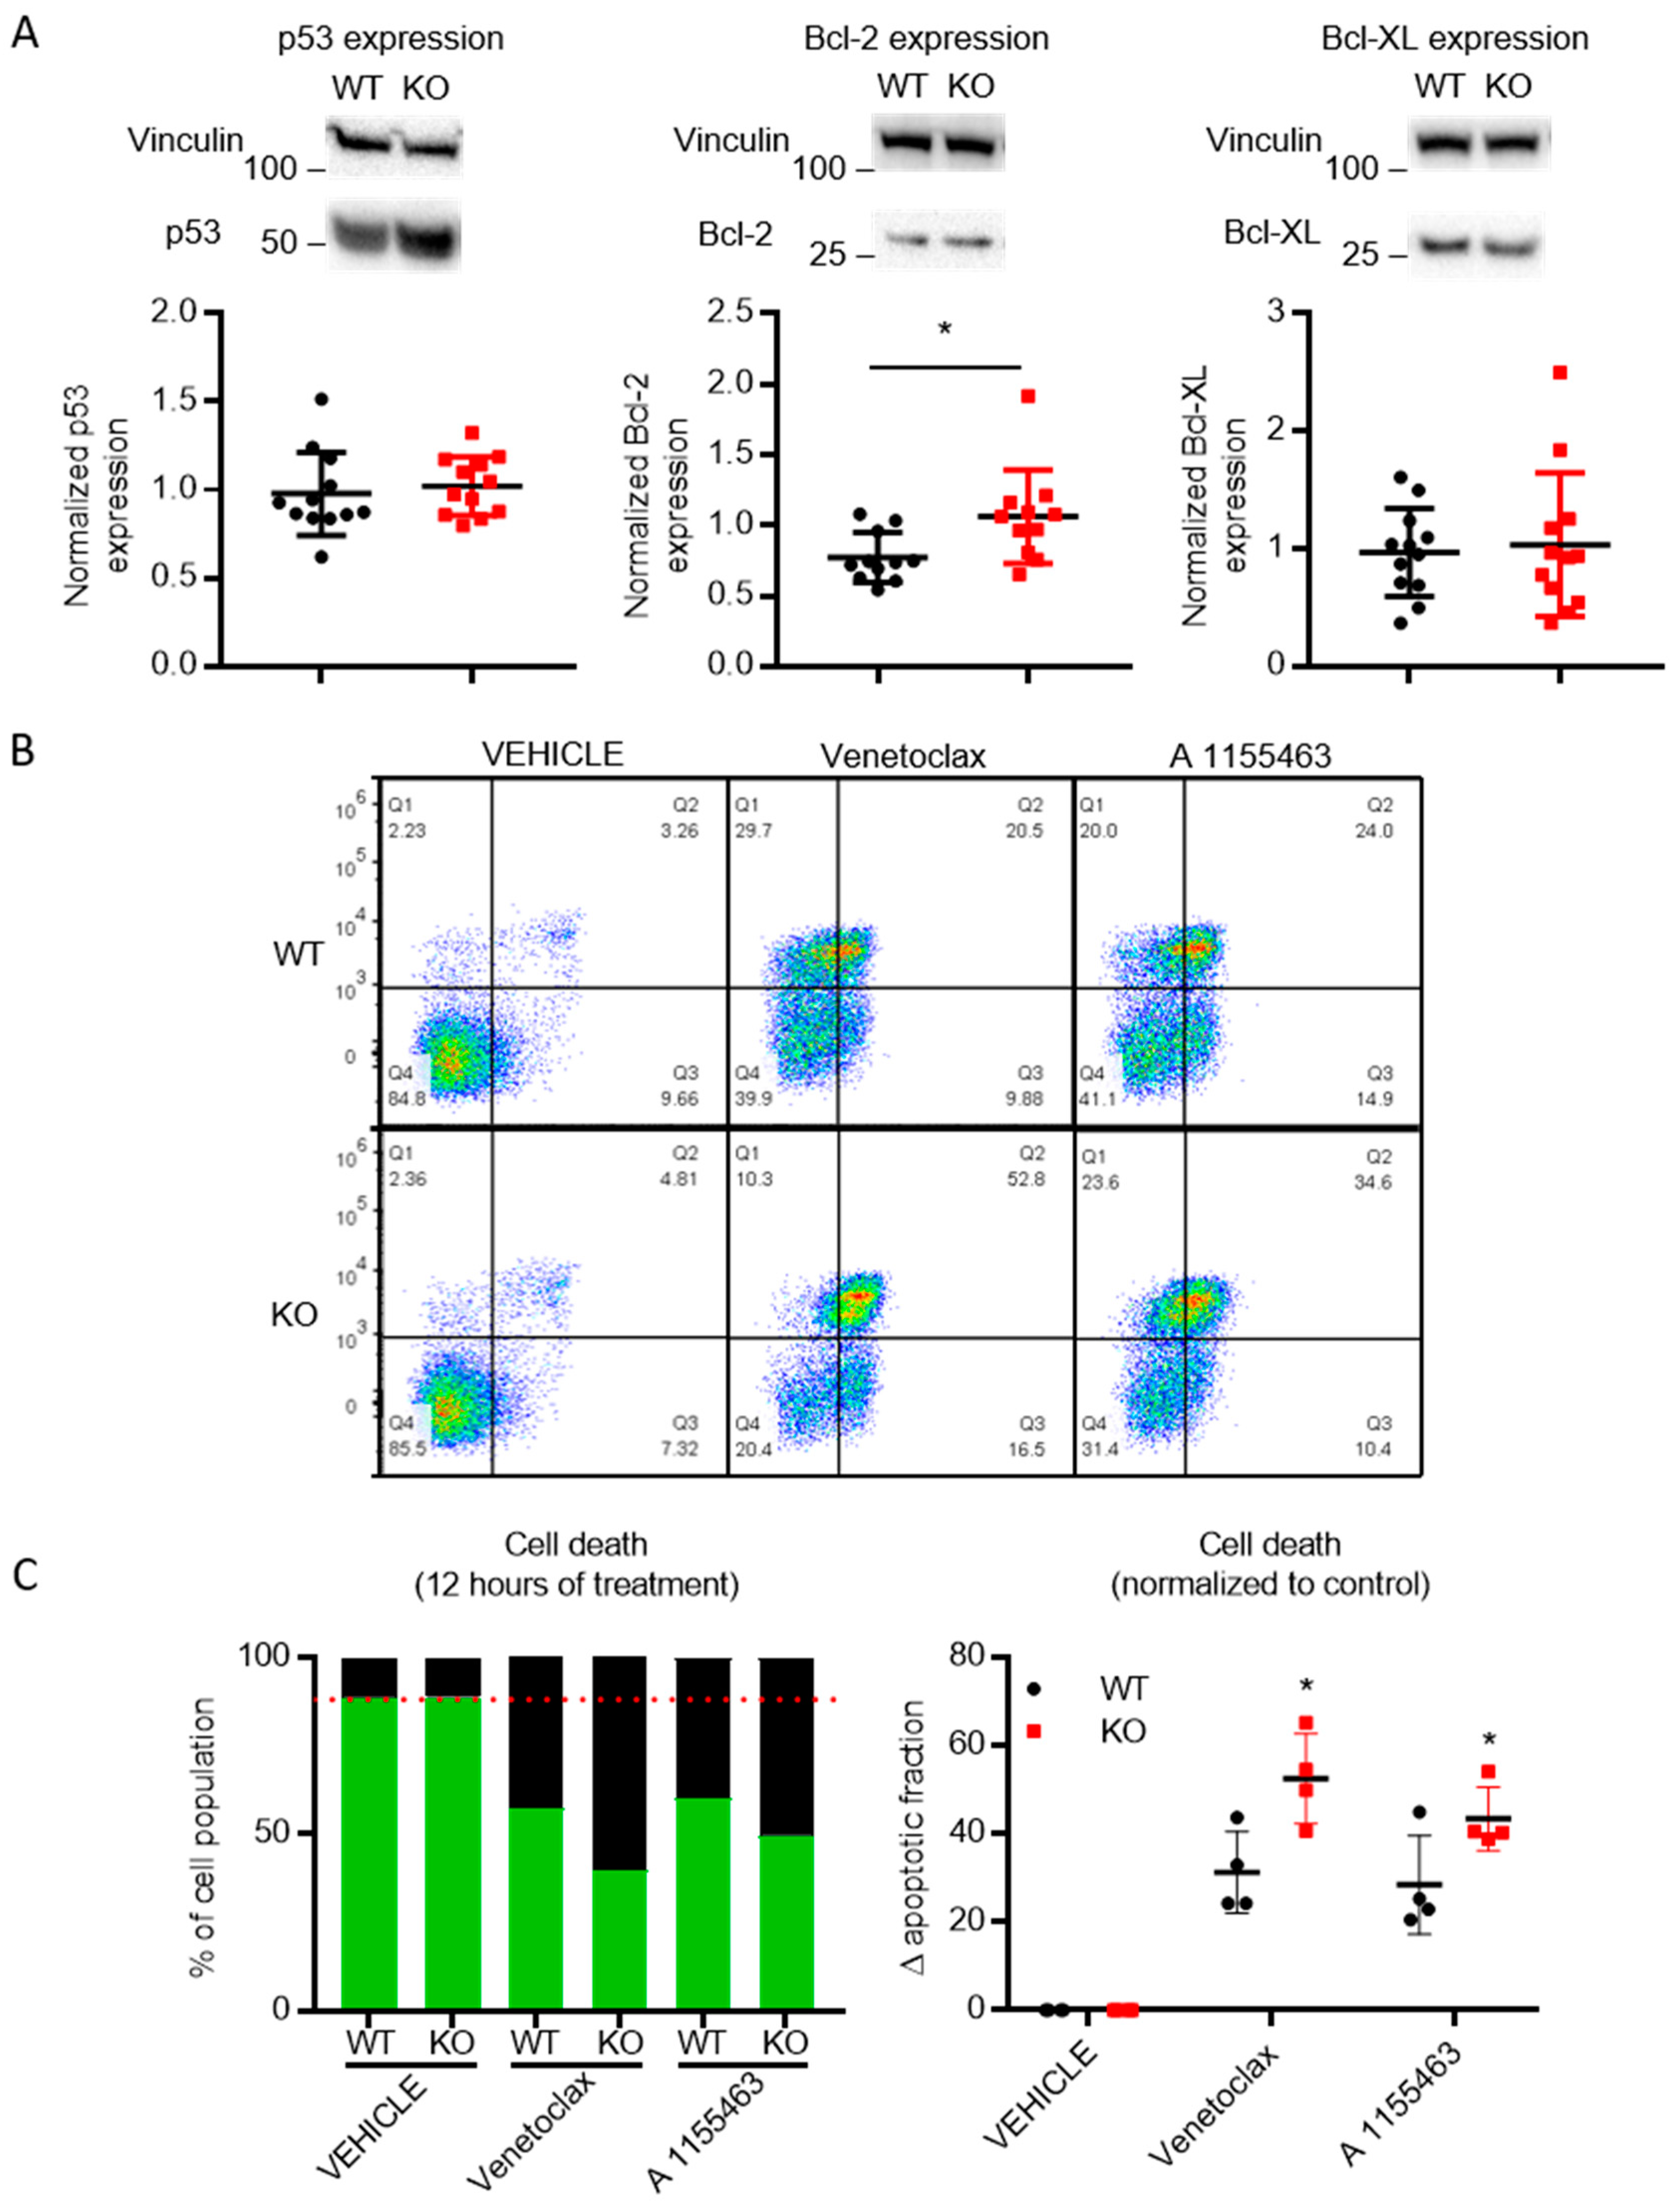
3.6. Cells Lacking TMBIM5 Are more Sensitive toward Cell Death Triggers
4. Discussion
Author Contributions
Funding
Acknowledgments
Conflicts of Interest
References
- Lisak, D.A.; Schacht, T.; Enders, V.; Habicht, J.; Kiviluoto, S.; Schneider, J.; Henke, N.; Bultynck, G.; Methner, A. The transmembrane Bax inhibitor motif (TMBIM) containing protein family: Tissue expression, intracellular localization and effects on the ER Ca2+-filling state. Biochim. Biophys. Acta 2015, 1853, 2104–2114. [Google Scholar] [CrossRef] [PubMed] [Green Version]
- Zhao, H.; Ito, A.; Kimura, S.H.; Yabuta, N.; Sakai, N.; Ikawa, M.; Okabe, M.; Matsuzawa, Y.; Yamashita, S.; Nojima, H. RECS1 deficiency in mice induces susceptibility to cystic medial degeneration. Genes Genet. Syst. 2006, 81, 41–50. [Google Scholar] [CrossRef] [PubMed] [Green Version]
- Shukla, S.; Fujita, K.; Xiao, Q.; Liao, Z.; Garfield, S.; Srinivasula, S.M. A shear stress responsive gene product PP1201 protects against Fas-mediated apoptosis by reducing Fas expression on the cell surface. Apoptosis 2011, 16, 162–173. [Google Scholar] [CrossRef] [PubMed]
- Somia, N.V.; Schmitt, M.J.; Vetter, D.E.; Van Antwerp, D.; Heinemann, S.F.; Verma, I.M. LFG: An anti-apoptotic gene that provides protection from Fas-mediated cell death. Proc. Natl. Acad. Sci. USA 1999, 96, 12667–12672. [Google Scholar] [CrossRef] [Green Version]
- Fernandez, M.; Segura, M.F.; Sole, C.; Colino, A.; Comella, J.X.; Cena, V. Lifeguard/neuronal membrane protein 35 regulates Fas ligand-mediated apoptosis in neurons via microdomain recruitment. J. Neurochem. 2007, 103, 190–203. [Google Scholar] [CrossRef]
- Schweitzer, B.; Suter, U.; Taylor, V. Neural membrane protein 35/Lifeguard is localized at postsynaptic sites and in dendrites. Brain Res. Mol. Brain Res. 2002, 107, 47–56. [Google Scholar] [CrossRef]
- Schweitzer, B.; Taylor, V.; Welcher, A.A.; McClelland, M.; Suter, U. Neural membrane protein 35 (NMP35): A novel member of a gene family which is highly expressed in the adult nervous system. Mol. Cell. Neurosci. 1998, 11, 260–273. [Google Scholar] [CrossRef] [PubMed]
- Kumar, K.N.; Tilakaratne, N.; Johnson, P.S.; Allen, A.E.; Michaelis, E.K. Cloning of cDNA for the glutamate-binding subunit of an NMDA receptor complex. Nature 1991, 354, 70–73. [Google Scholar] [CrossRef]
- Rojas-Rivera, D.; Armisen, R.; Colombo, A.; Martinez, G.; Eguiguren, A.L.; Diaz, A.; Kiviluoto, S.; Rodriguez, D.; Patron, M.; Rizzuto, R.; et al. TMBIM3/GRINA is a novel unfolded protein response (UPR) target gene that controls apoptosis through the modulation of ER calcium homeostasis. Cell Death Differ. 2012, 19, 1013–1026. [Google Scholar] [CrossRef] [Green Version]
- Nielsen, J.A.; Chambers, M.A.; Romm, E.; Lee, L.Y.; Berndt, J.A.; Hudson, L.D. Mouse transmembrane BAX inhibitor motif 3 (Tmbim3) encodes a 38 kDa transmembrane protein expressed in the central nervous system. Mol. Cell. Biochem. 2011, 357, 73–81. [Google Scholar] [CrossRef]
- Petryszak, R.; Keays, M.; Tang, Y.A.; Fonseca, N.A.; Barrera, E.; Burdett, T.; Fullgrabe, A.; Fuentes, A.M.; Jupp, S.; Koskinen, S.; et al. Expression Atlas update--an integrated database of gene and protein expression in humans, animals and plants. Nucleic Acids Res. 2016, 44, D746–D752. [Google Scholar] [CrossRef]
- Almeida, N.; Carrara, G.; Palmeira, C.M.; Fernandes, A.S.; Parsons, M.; Smith, G.L.; Saraiva, N. Stimulation of cell invasion by the Golgi Ion Channel GAAP/TMBIM4 via an H2O2-Dependent Mechanism. Redox. Biol. 2020, 28, 101361. [Google Scholar] [CrossRef]
- Saraiva, N.; Prole, D.L.; Carrara, G.; Johnson, B.F.; Taylor, C.W.; Parsons, M.; Smith, G.L. hGAAP promotes cell adhesion and migration via the stimulation of store-operated Ca2+ entry and calpain 2. J. Cell Biol. 2013, 202, 699–713. [Google Scholar] [CrossRef]
- Yoshida, T.; Nagata, S.; Kataoka, H. Ghitm is an ortholog of the Bombyx mori prothoracic gland-derived receptor (Pgdr) that is ubiquitously expressed in mammalian cells and requires an N-terminal signal sequence for expression. Biochem. Biophys. Res. Commun. 2006, 341, 13–18. [Google Scholar] [CrossRef] [PubMed]
- Oka, T.; Sayano, T.; Tamai, S.; Yokota, S.; Kato, H.; Fujii, G.; Mihara, K. Identification of a novel protein MICS1 that is involved in maintenance of mitochondrial morphology and apoptotic release of cytochrome c. Mol. Biol. Cell 2008, 19, 2597–2608. [Google Scholar] [CrossRef] [PubMed] [Green Version]
- Xu, Q.; Reed, J.C. Bax inhibitor-1, a mammalian apoptosis suppressor identified by functional screening in yeast. Mol. Cell 1998, 1, 337–346. [Google Scholar] [CrossRef]
- Chae, H.J.; Kim, H.R.; Xu, C.; Bailly-Maitre, B.; Krajewska, M.; Krajewski, S.; Banares, S.; Cui, J.; Digicaylioglu, M.; Ke, N.; et al. BI-1 regulates an apoptosis pathway linked to endoplasmic reticulum stress. Mol. Cell 2004, 15, 355–366. [Google Scholar] [CrossRef]
- Bailly-Maitre, B.; Fondevila, C.; Kaldas, F.; Droin, N.; Luciano, F.; Ricci, J.E.; Croxton, R.; Krajewska, M.; Zapata, J.M.; Kupiec-Weglinski, J.W.; et al. Cytoprotective gene bi-1 is required for intrinsic protection from endoplasmic reticulum stress and ischemia-reperfusion injury. Proc. Natl. Acad. Sci. USA 2006, 103, 2809–2814. [Google Scholar] [CrossRef] [Green Version]
- Westphalen, B.C.; Wessig, J.; Leypoldt, F.; Arnold, S.; Methner, A. BI-1 protects cells from oxygen glucose deprivation by reducing the calcium content of the endoplasmic reticulum. Cell Death Differ. 2005, 12, 304–306. [Google Scholar] [CrossRef] [Green Version]
- Bultynck, G.; Kiviluoto, S.; Henke, N.; Ivanova, H.; Schneider, L.; Rybalchenko, V.; Luyten, T.; Nuyts, K.; De Borggraeve, W.; Bezprozvanny, I.; et al. The C terminus of Bax inhibitor-1 forms a Ca2+-permeable channel pore. J. Biol. Chem. 2012, 287, 2544–2557. [Google Scholar] [CrossRef] [Green Version]
- Bultynck, G.; Kiviluoto, S.; Methner, A. Bax inhibitor-1 is likely a pH-sensitive calcium leak channel, not a H+/Ca2+ exchanger. Sci. Signal. 2014, 7, pe22. [Google Scholar] [CrossRef] [PubMed]
- Carrara, G.; Saraiva, N.; Gubser, C.; Johnson, B.F.; Smith, G.L. Six-transmembrane topology for Golgi anti-apoptotic protein (GAAP) and Bax inhibitor 1 (BI-1) provides model for the transmembrane Bax inhibitor-containing motif (TMBIM) family. J. Biol. Chem. 2012, 287, 15896–15905. [Google Scholar] [CrossRef] [PubMed] [Green Version]
- Rojas-Rivera, D.; Hetz, C. TMBIM protein family: Ancestral regulators of cell death. Oncogene 2015, 34, 269–280. [Google Scholar] [CrossRef] [PubMed]
- Chae, H.J.; Ke, N.; Kim, H.R.; Chen, S.; Godzik, A.; Dickman, M.; Reed, J.C. Evolutionarily conserved cytoprotection provided by Bax Inhibitor-1 homologs from animals, plants, and yeast. Gene 2003, 323, 101–113. [Google Scholar] [CrossRef]
- Li, Y.; Kelder, B.; Kopchick, J.J. Identification, isolation, and cloning of growth hormone (GH)-inducible interscapular brown adipose complementary deoxyribonucleic acid from GH antagonist mice. Endocrinology 2001, 142, 2937–2945. [Google Scholar] [CrossRef]
- Reimers, K.; Choi, C.Y.; Bucan, V.; Vogt, P.M. The growth-hormone inducible transmembrane protein (Ghitm) belongs to the Bax inhibitory protein-like family. Int. J. Biol. Sci. 2007, 3, 471–476. [Google Scholar] [CrossRef] [Green Version]
- Hajnoczky, G.; Robb-Gaspers, L.D.; Seitz, M.B.; Thomas, A.P. Decoding of cytosolic calcium oscillations in the mitochondria. Cell 1995, 82, 415–424. [Google Scholar] [CrossRef] [Green Version]
- Calvo, S.E.; Mootha, V.K. The mitochondrial proteome and human disease. Annu. Rev. Genom. Hum. Genet. 2010, 11, 25–44. [Google Scholar] [CrossRef] [Green Version]
- Frezza, C.; Cipolat, S.; Scorrano, L. Organelle isolation: Functional mitochondria from mouse liver, muscle and cultured fibroblasts. Nat. Protoc. 2007, 2, 287–295. [Google Scholar] [CrossRef] [Green Version]
- Wettmarshausen, J.; Goh, V.; Huang, K.T.; Arduino, D.M.; Tripathi, U.; Leimpek, A.; Cheng, Y.; Pittis, A.A.; Gabaldon, T.; Mokranjac, D.; et al. MICU1 Confers Protection from MCU-Dependent Manganese Toxicity. Cell Rep. 2018, 25, 1425–1435. [Google Scholar] [CrossRef] [Green Version]
- Yoshida, T.; Kakizuka, A.; Imamura, H. BTeam, a Novel BRET-based Biosensor for the Accurate Quantification of ATP Concentration within Living Cells. Sci. Rep. 2016, 6, 39618. [Google Scholar] [CrossRef] [PubMed]
- Sielaff, M.; Kuharev, J.; Bohn, T.; Hahlbrock, J.; Bopp, T.; Tenzer, S.; Distler, U. Evaluation of FASP, SP3, and iST Protocols for Proteomic Sample Preparation in the Low Microgram Range. J. Proteome Res. 2017, 16, 4060–4072. [Google Scholar] [CrossRef] [PubMed]
- Distler, U.; Kuharev, J.; Navarro, P.; Levin, Y.; Schild, H.; Tenzer, S. Drift time-specific collision energies enable deep-coverage data-independent acquisition proteomics. Nat. Methods 2014, 11, 167–170. [Google Scholar] [CrossRef] [PubMed]
- Distler, U.; Kuharev, J.; Navarro, P.; Tenzer, S. Label-free quantification in ion mobility-enhanced data-independent acquisition proteomics. Nat. Protoc. 2016, 11, 795–812. [Google Scholar] [CrossRef]
- Essletzbichler, P.; Konopka, T.; Santoro, F.; Chen, D.; Gapp, B.V.; Kralovics, R.; Brummelkamp, T.R.; Nijman, S.M.B.; Bürckstümmer, T. Megabase-scale deletion using CRISPR/Cas9 to generate a fully haploid human cell line. Genome Res. 2014, 24, 2059–2065. [Google Scholar] [CrossRef] [Green Version]
- Cogliati, S.; Frezza, C.; Soriano, M.E.; Varanita, T.; Quintana-Cabrera, R.; Corrado, M.; Cipolat, S.; Costa, V.; Casarin, A.; Gomes, L.C.; et al. Mitochondrial cristae shape determines respiratory chain supercomplexes assembly and respiratory efficiency. Cell 2013, 155, 160–171. [Google Scholar] [CrossRef] [Green Version]
- Chandel, N.S. Mitochondrial complex III: An essential component of universal oxygen sensing machinery? Respir. Physiol. Neurobiol. 2010, 174, 175–181. [Google Scholar] [CrossRef] [Green Version]
- Porter, G.A., Jr.; Beutner, G. Cyclophilin D, Somehow a Master Regulator of Mitochondrial Function. Biomolecules 2018, 8, 176. [Google Scholar] [CrossRef] [Green Version]
- Harner, M.; Korner, C.; Walther, D.; Mokranjac, D.; Kaesmacher, J.; Welsch, U.; Griffith, J.; Mann, M.; Reggiori, F.; Neupert, W. The mitochondrial contact site complex, a determinant of mitochondrial architecture. EMBO J. 2011, 30, 4356–4370. [Google Scholar] [CrossRef] [Green Version]
- Bohnert, M.; Zerbes, R.M.; Davies, K.M.; Muhleip, A.W.; Rampelt, H.; Horvath, S.E.; Boenke, T.; Kram, A.; Perschil, I.; Veenhuis, M.; et al. Central role of Mic10 in the mitochondrial contact site and cristae organizing system. Cell Metab. 2015, 21, 747–755. [Google Scholar] [CrossRef] [Green Version]
- Tarasenko, D.; Barbot, M.; Jans, D.C.; Kroppen, B.; Sadowski, B.; Heim, G.; Mobius, W.; Jakobs, S.; Meinecke, M. The MICOS component Mic60 displays a conserved membrane-bending activity that is necessary for normal cristae morphology. J. Cell Biol. 2017, 216, 889–899. [Google Scholar] [CrossRef] [PubMed] [Green Version]
- Cheng, Y.; Perocchi, F. ProtPhylo: Identification of protein-phenotype and protein-protein functional associations via phylogenetic profiling. Nucleic Acids Res. 2015, 43, W160–W168. [Google Scholar] [CrossRef] [PubMed] [Green Version]
- Guarani, V.; Jardel, C.; Chretien, D.; Lombes, A.; Benit, P.; Labasse, C.; Lacene, E.; Bourillon, A.; Imbard, A.; Benoist, J.F.; et al. QIL1 mutation causes MICOS disassembly and early onset fatal mitochondrial encephalopathy with liver disease. eLife 2016, 5. [Google Scholar] [CrossRef] [PubMed]
- Montero, J.; Letai, A. Why do BCL-2 inhibitors work and where should we use them in the clinic? Cell Death Differ. 2018, 25, 56–64. [Google Scholar] [CrossRef]
- Adams, J.M.; Cory, S. The BCL-2 arbiters of apoptosis and their growing role as cancer targets. Cell Death Differ. 2018, 25, 27–36. [Google Scholar] [CrossRef] [Green Version]
- Cory, S.; Roberts, A.W.; Colman, P.M.; Adams, J.M. Targeting BCL-2-like Proteins to Kill Cancer Cells. Trends Cancer 2016, 2, 443–460. [Google Scholar] [CrossRef]
- Souers, A.J.; Leverson, J.D.; Boghaert, E.R.; Ackler, S.L.; Catron, N.D.; Chen, J.; Dayton, B.D.; Ding, H.; Enschede, S.H.; Fairbrother, W.J.; et al. ABT-199, a potent and selective BCL-2 inhibitor, achieves antitumor activity while sparing platelets. Nat. Med. 2013, 19, 202–208. [Google Scholar] [CrossRef]
- Tao, Z.F.; Hasvold, L.; Wang, L.; Wang, X.; Petros, A.M.; Park, C.H.; Boghaert, E.R.; Catron, N.D.; Chen, J.; Colman, P.M.; et al. Discovery of a Potent and Selective BCL-XL Inhibitor with in Vivo Activity. ACS Med. Chem. Lett. 2014, 5, 1088–1093. [Google Scholar] [CrossRef] [Green Version]
- Villalobos-Ortiz, M.; Ryan, J.; Mashaka, T.N.; Opferman, J.T.; Letai, A. BH3 profiling discriminates on-target small molecule BH3 mimetics from putative mimetics. Cell Death Differ. 2020, 27, 999–1007. [Google Scholar] [CrossRef]
- Giorgi, C.; Bonora, M.; Pinton, P. Inside the tumor: P53 modulates calcium homeostasis. Cell Cycle 2015, 14, 933–934. [Google Scholar] [CrossRef] [Green Version]
- Vousden, K.H.; Lane, D.P. p53 in health and disease. Nat. Rev. Mol. Cell Biol. 2007, 8, 275–283. [Google Scholar] [PubMed]
- Reimers, K.; Choi, C.Y.; Bucan, V.; Vogt, P.M. The Bax Inhibitor-1 (BI-1) family in apoptosis and tumorigenesis. Curr. Mol. Med. 2008, 8, 148–156. [Google Scholar] [PubMed]
- Carrara, G.; Saraiva, N.; Parsons, M.; Byrne, B.; Prole, D.L.; Taylor, C.W.; Smith, G.L. Golgi anti-apoptotic proteins are highly conserved ion channels that affect apoptosis and cell migration. J. Biol. Chem. 2015, 290, 11785–11801. [Google Scholar] [PubMed] [Green Version]
- Guo, G.; Xu, M.; Chang, Y.; Luyten, T.; Seitaj, B.; Liu, W.; Zhu, P.; Bultynck, G.; Shi, L.; Quick, M.; et al. Ion and pH Sensitivity of a TMBIM Ca2+ Channel. Structure 2019, 27, 1013–1021. [Google Scholar]
- Zhang, K.; Li, H.; Song, Z. Membrane depolarization activates the mitochondrial protease OMA1 by stimulating self-cleavage. EMBO Rep. 2014, 15, 576–585. [Google Scholar]
- Frezza, C.; Cipolat, S.; Martins de Brito, O.; Micaroni, M.; Beznoussenko, G.V.; Rudka, T.; Bartoli, D.; Polishuck, R.S.; Danial, N.N.; De Strooper, B.; et al. OPA1 controls apoptotic cristae remodeling independently from mitochondrial fusion. Cell 2006, 126, 177–189. [Google Scholar]
- Jiang, X.; Jiang, H.; Shen, Z.; Wang, X. Activation of mitochondrial protease OMA1 by Bax and Bak promotes cytochrome c release during apoptosis. Proc. Natl. Acad. Sci. USA 2014, 111, 14782–14787. [Google Scholar]
- Meng, H.; Yamashita, C.; Shiba-Fukushima, K.; Inoshita, T.; Funayama, M.; Sato, S.; Hatta, T.; Natsume, T.; Umitsu, M.; Takagi, J.; et al. Loss of Parkinson’s disease-associated protein CHCHD2 affects mitochondrial crista structure and destabilizes cytochrome c. Nat. Commun. 2017, 8, 15500. [Google Scholar]
- Longen, S.; Bien, M.; Bihlmaier, K.; Kloeppel, C.; Kauff, F.; Hammermeister, M.; Westermann, B.; Herrmann, J.M.; Riemer, J. Systematic analysis of the twin cx(9)c protein family. J. Mol. Biol. 2009, 393, 356–368. [Google Scholar]
- Zhou, W.; Ma, D.R.; Sun, A.X.; Tran, H.D.; Ma, D.L.; Singh, B.K.; Zhou, J.; Zhang, J.Y.; Wang, D.L.; Zhao, Y.; et al. PD-linked CHCHD2 mutations impair CHCHD10 and a MICOS complex leading to mitochondria dysfunction. Hum. Mol. Genet. 2019, 28, 1100–1116. [Google Scholar]
- Yu, W.; Zhang, B.; Song, H.; Zhan, R.; Li, L.; He, C.; Jiang, Q.; Wang, X.; Wei, L.; Zhao, N.; et al. Preliminary investigation demonstrating the GHITM gene probably involved in apoptosis and growth of the golden apple snail (Pomacea canaliculata). BMC Genom. 2020, 21, 19. [Google Scholar] [CrossRef] [PubMed]
- Uhlen, M.; Zhang, C.; Lee, S.; Sjostedt, E.; Fagerberg, L.; Bidkhori, G.; Benfeitas, R.; Arif, M.; Liu, Z.; Edfors, F.; et al. A pathology atlas of the human cancer transcriptome. Science 2017, 357, 660. [Google Scholar] [CrossRef] [PubMed] [Green Version]
- Pihan, P.; Carreras-Sureda, A.; Hetz, C. BCL-2 family: Integrating stress responses at the ER to control cell demise. Cell Death Differ. 2017, 24, 1478–1487. [Google Scholar] [CrossRef] [PubMed] [Green Version]
- M’Angale, P.G.; Staveley, B.E. The inhibition of cg2076 the ghitm homologue inneurons of drosophila melanogaster can be rescued by buffy. J. RNA Genom. 2016, 12, 521–527. [Google Scholar]
- Spinazzi, M.; Radaelli, E.; Horre, K.; Arranz, A.M.; Gounko, N.V.; Agostinis, P.; Maia, T.M.; Impens, F.; Morais, V.A.; Lopez-Lluch, G.; et al. PARL deficiency in mouse causes Complex III defects, coenzyme Q depletion, and Leigh-like syndrome. Proc. Natl. Acad. Sci. USA 2019, 116, 277–286. [Google Scholar] [CrossRef] [Green Version]
- Nowikovsky, K.; Froschauer, E.M.; Zsurka, G.; Samaj, J.; Reipert, S.; Kolisek, M.; Wiesenberger, G.; Schweyen, R.J. The LETM1/YOL027 gene family encodes a factor of the mitochondrial K+ homeostasis with a potential role in the Wolf-Hirschhorn syndrome. J. Biol. Chem. 2004, 279, 30307–30315. [Google Scholar]
- Jiang, D.; Zhao, L.; Clapham, D.E. Genome-wide RNAi screen identifies Letm1 as a mitochondrial Ca2+/H+ antiporter. Science 2009, 326, 144–147. [Google Scholar] [CrossRef] [Green Version]
- Frazier, A.E.; Taylor, R.D.; Mick, D.U.; Warscheid, B.; Stoepel, N.; Meyer, H.E.; Ryan, M.T.; Guiard, B.; Rehling, P. Mdm38 interacts with ribosomes and is a component of the mitochondrial protein export machinery. J. Cell Biol. 2006, 172, 553–564. [Google Scholar] [CrossRef] [Green Version]
- Lupo, D.; Vollmer, C.; Deckers, M.; Mick, D.U.; Tews, I.; Sinning, I.; Rehling, P. Mdm38 is a 14-3-3-like receptor and associates with the protein synthesis machinery at the inner mitochondrial membrane. Traffic 2011, 12, 1457–1466. [Google Scholar] [CrossRef]
- Durigon, R.; Mitchell, A.L.; Jones, A.W.; Manole, A.; Mennuni, M.; Hirst, E.M.; Houlden, H.; Maragni, G.; Lattante, S.; Doronzio, P.N.; et al. LETM1 couples mitochondrial DNA metabolism and nutrient preference. EMBO Mol. Med. 2018, 10. [Google Scholar] [CrossRef]


© 2020 by the authors. Licensee MDPI, Basel, Switzerland. This article is an open access article distributed under the terms and conditions of the Creative Commons Attribution (CC BY) license (http://creativecommons.org/licenses/by/4.0/).
Share and Cite
Seitaj, B.; Maull, F.; Zhang, L.; Wüllner, V.; Wolf, C.; Schippers, P.; La Rovere, R.; Distler, U.; Tenzer, S.; Parys, J.B.; et al. Transmembrane BAX Inhibitor-1 Motif Containing Protein 5 (TMBIM5) Sustains Mitochondrial Structure, Shape, and Function by Impacting the Mitochondrial Protein Synthesis Machinery. Cells 2020, 9, 2147. https://doi.org/10.3390/cells9102147
Seitaj B, Maull F, Zhang L, Wüllner V, Wolf C, Schippers P, La Rovere R, Distler U, Tenzer S, Parys JB, et al. Transmembrane BAX Inhibitor-1 Motif Containing Protein 5 (TMBIM5) Sustains Mitochondrial Structure, Shape, and Function by Impacting the Mitochondrial Protein Synthesis Machinery. Cells. 2020; 9(10):2147. https://doi.org/10.3390/cells9102147
Chicago/Turabian StyleSeitaj, Bruno, Felicia Maull, Li Zhang, Verena Wüllner, Christina Wolf, Philipp Schippers, Rita La Rovere, Ute Distler, Stefan Tenzer, Jan B. Parys, and et al. 2020. "Transmembrane BAX Inhibitor-1 Motif Containing Protein 5 (TMBIM5) Sustains Mitochondrial Structure, Shape, and Function by Impacting the Mitochondrial Protein Synthesis Machinery" Cells 9, no. 10: 2147. https://doi.org/10.3390/cells9102147