The Lysosomotropic Activity of Hydrophobic Weak Base Drugs is Mediated via Their Intercalation into the Lysosomal Membrane


Abstract
:1. Introduction
2. Materials and Methods
2.1. Chemicals
2.2. Tissue Culture
2.3. Growth Inhibition Assay
2.4. Live Imaging
2.4.1. Confocal Live Imaging of Lysosomal Size and Number
2.4.2. InCell Lysosomal Quantification Analysis
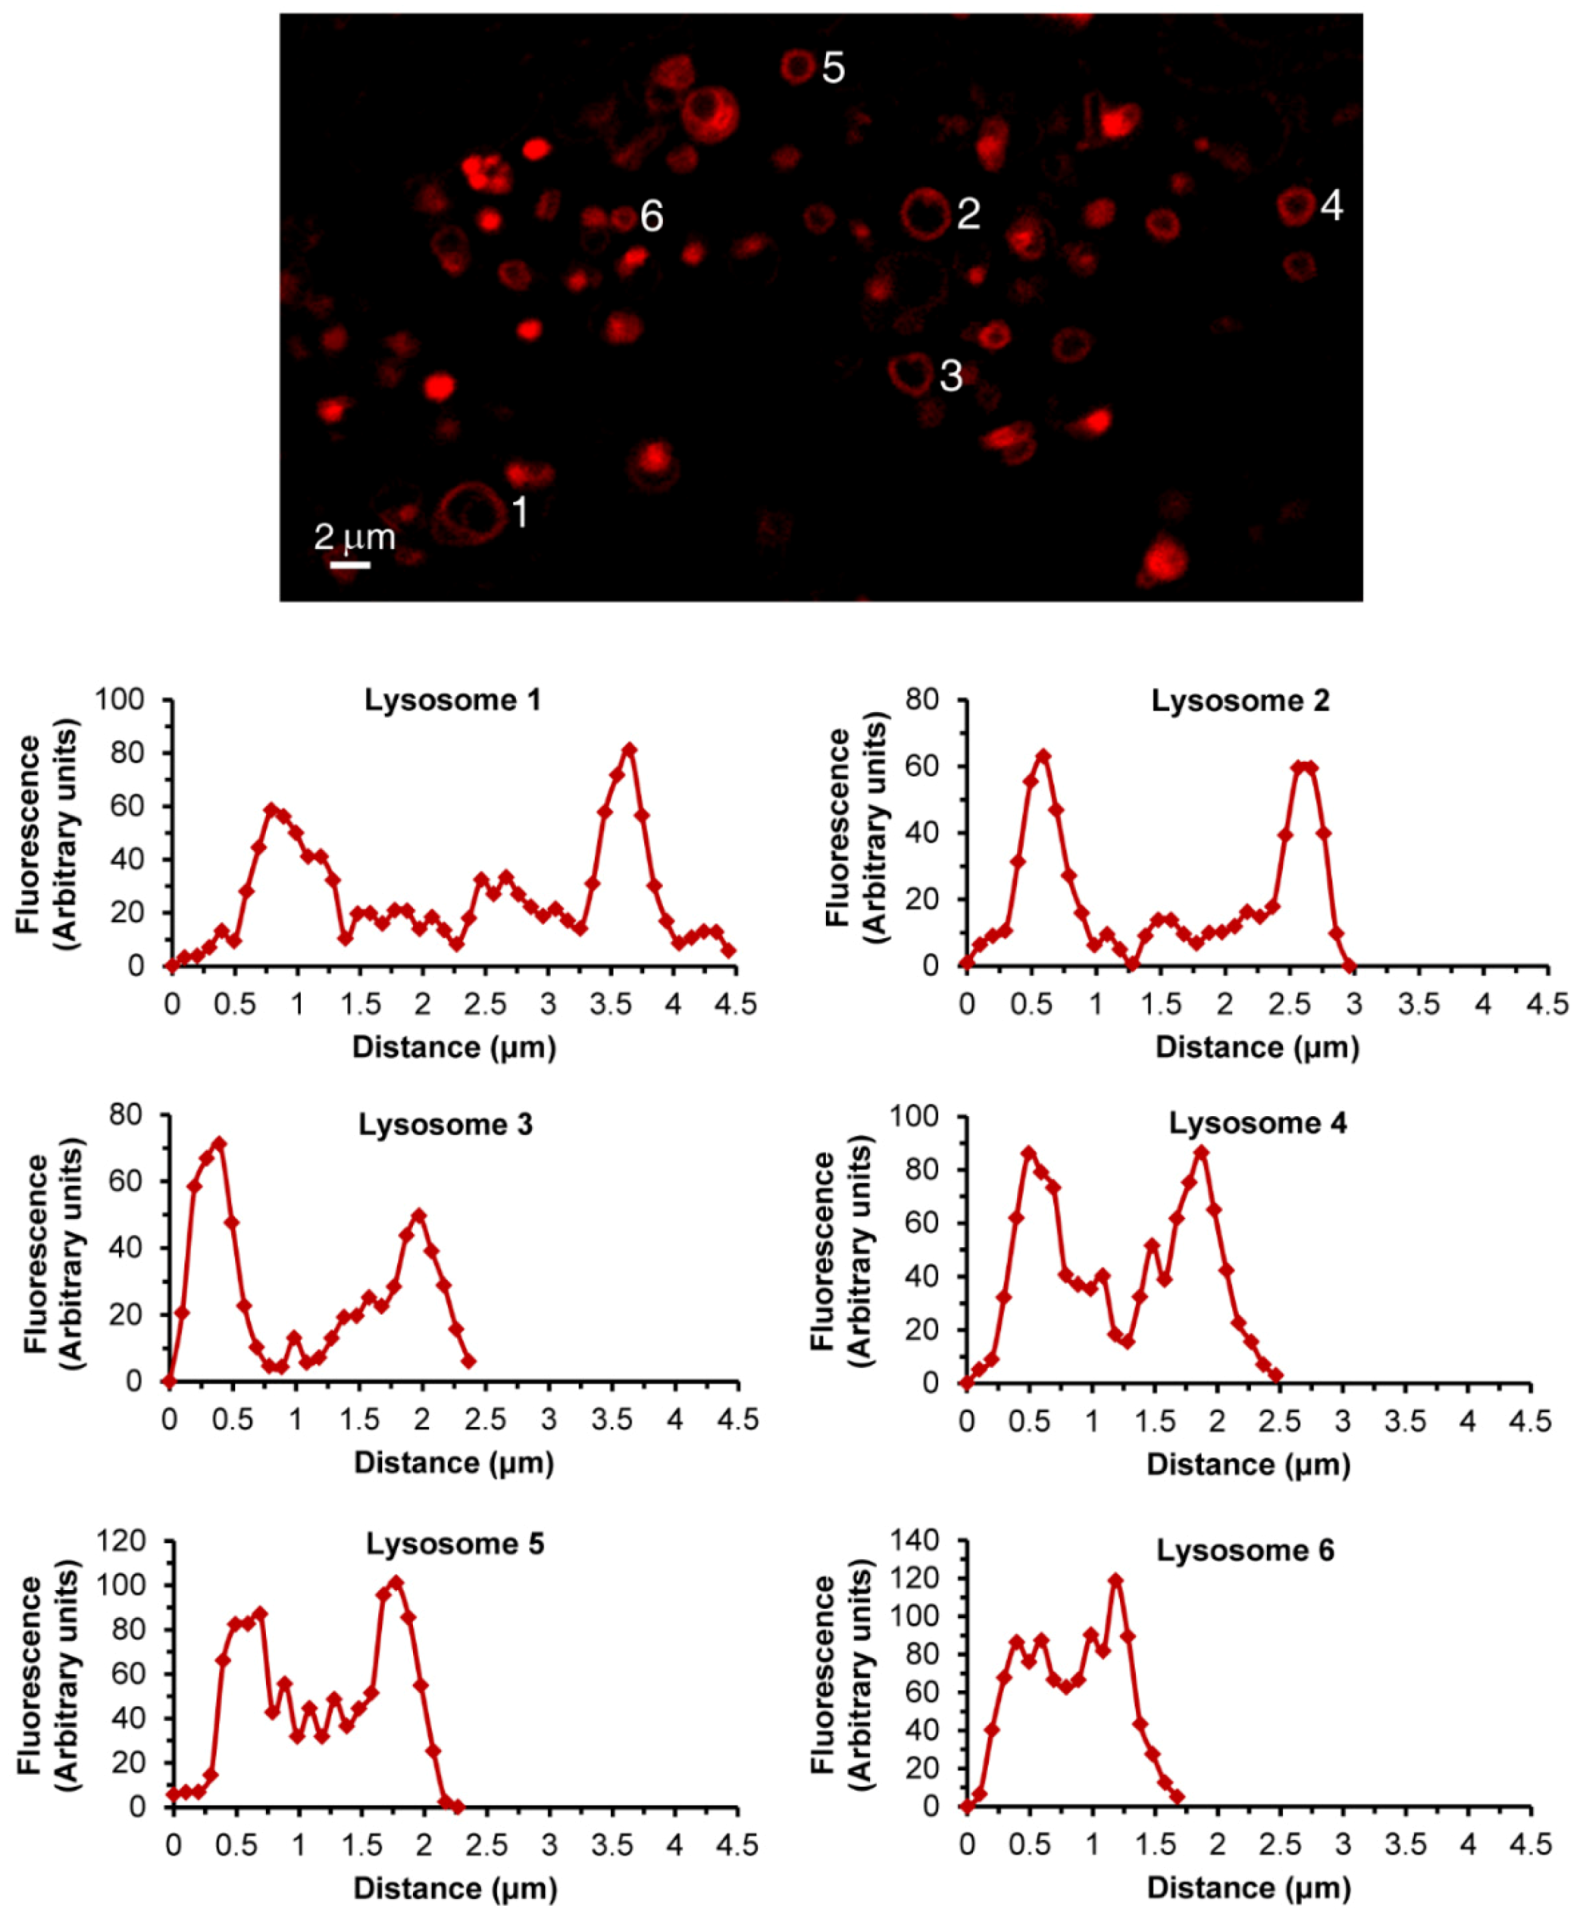
2.4.3. Confocal Visualization of Fluorescent Compounds in Lysosomal Membranes
2.5. CpHMD Simulations
2.5.1. System Setup and Simulation Settings
2.5.2. Poisson-Boltzmann/Monte Carlo Calculations
2.5.3. pH Replica Exchange Settings
2.5.4. Membrane Insertion Procedure
2.6. Statistical Analyses
3. Results
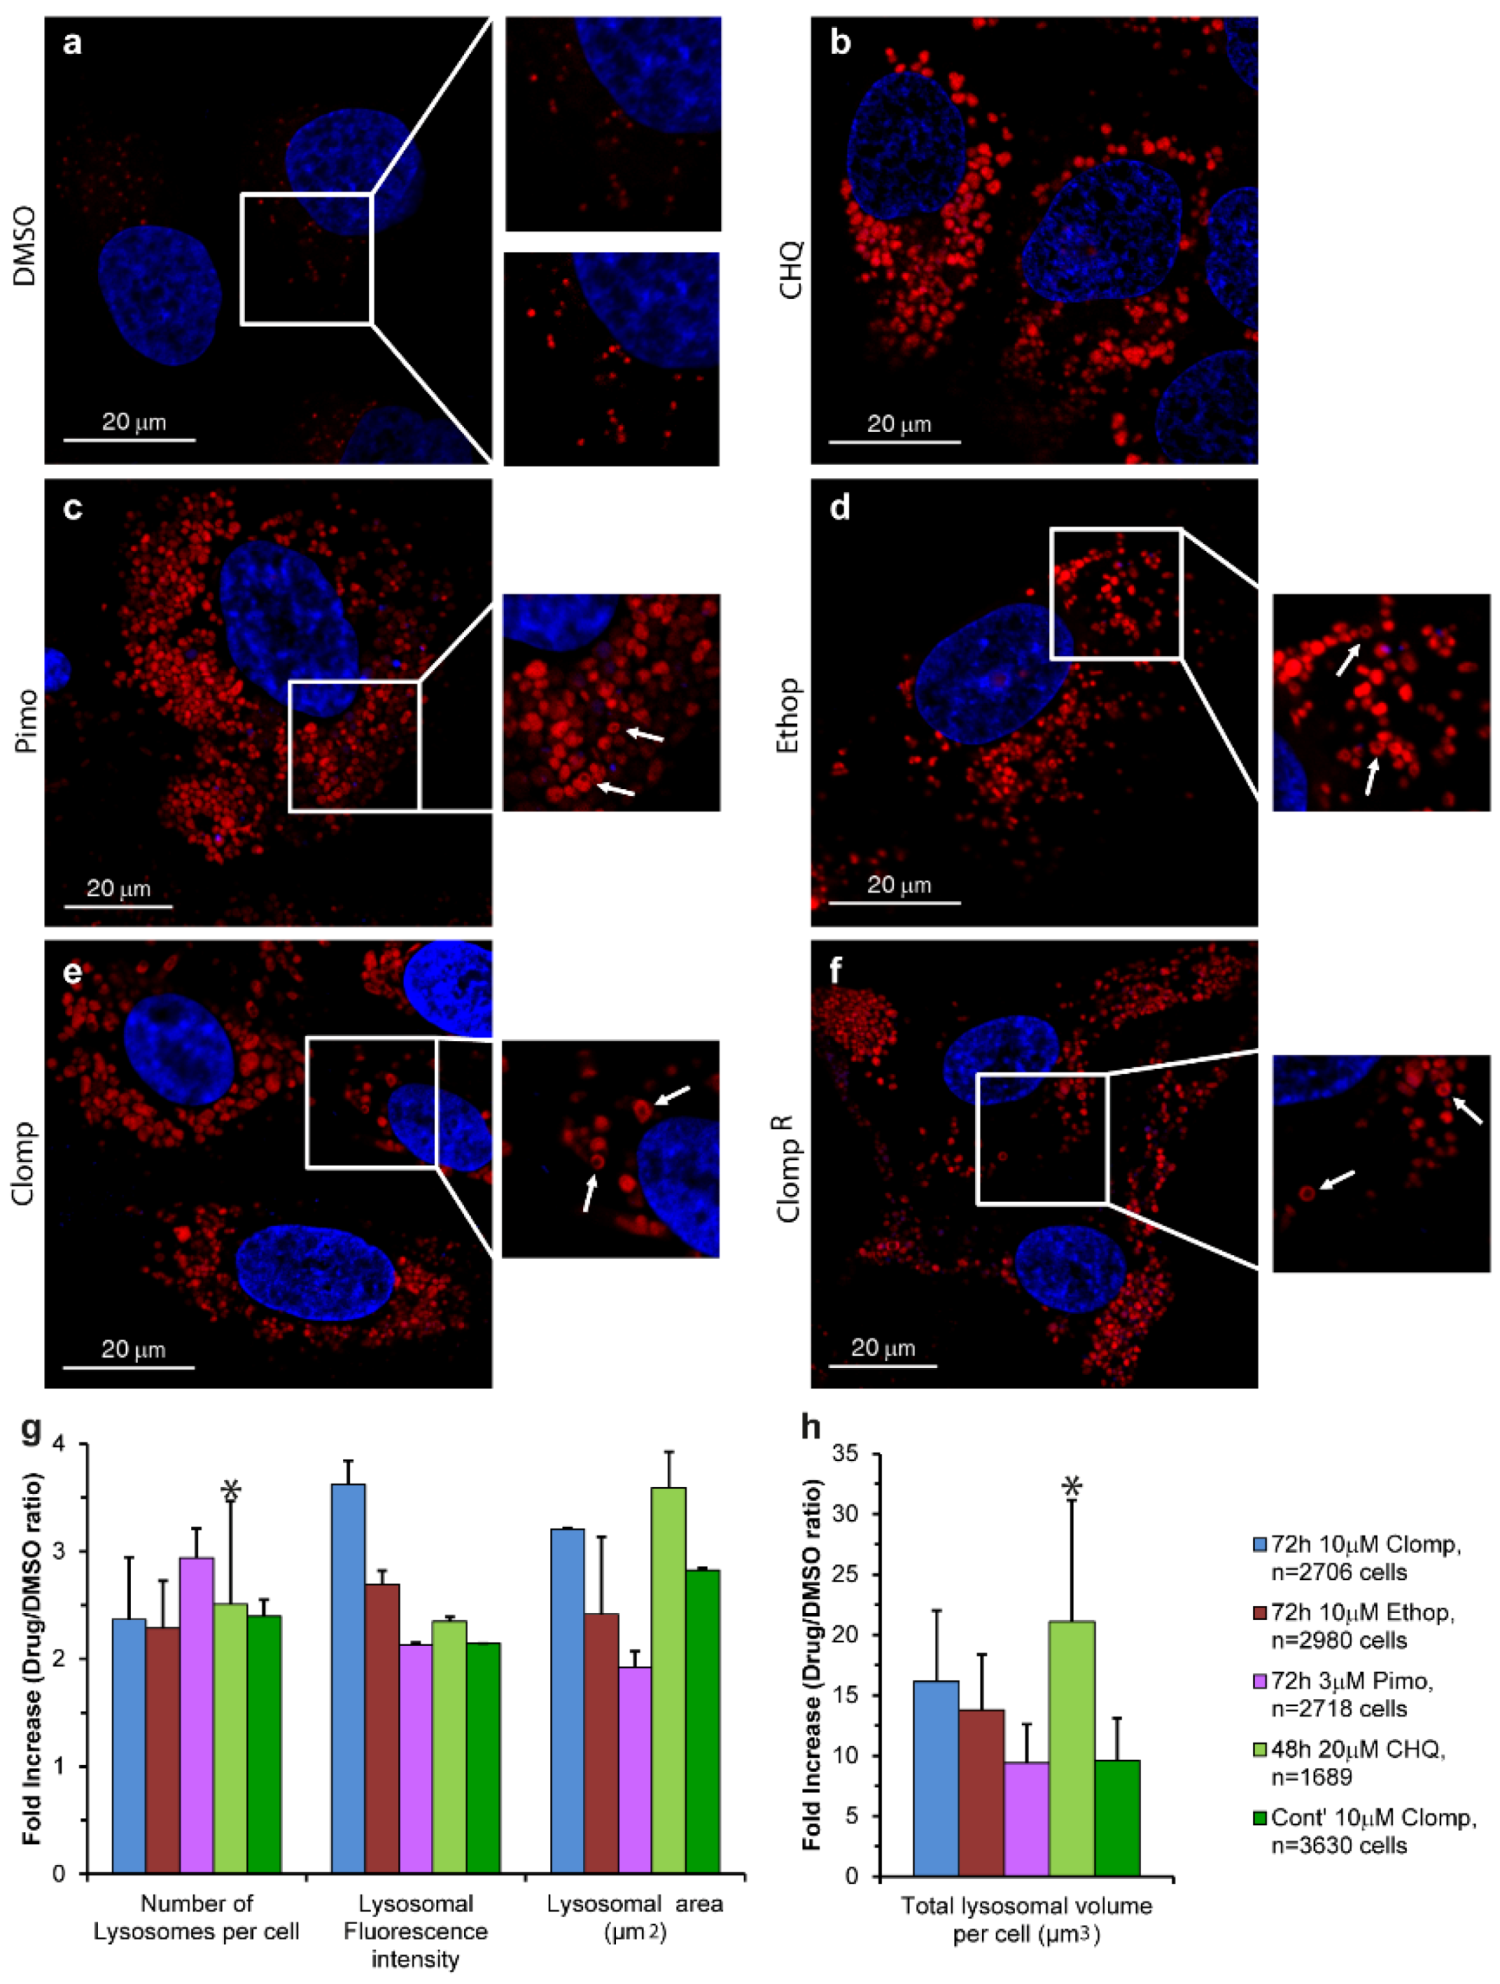
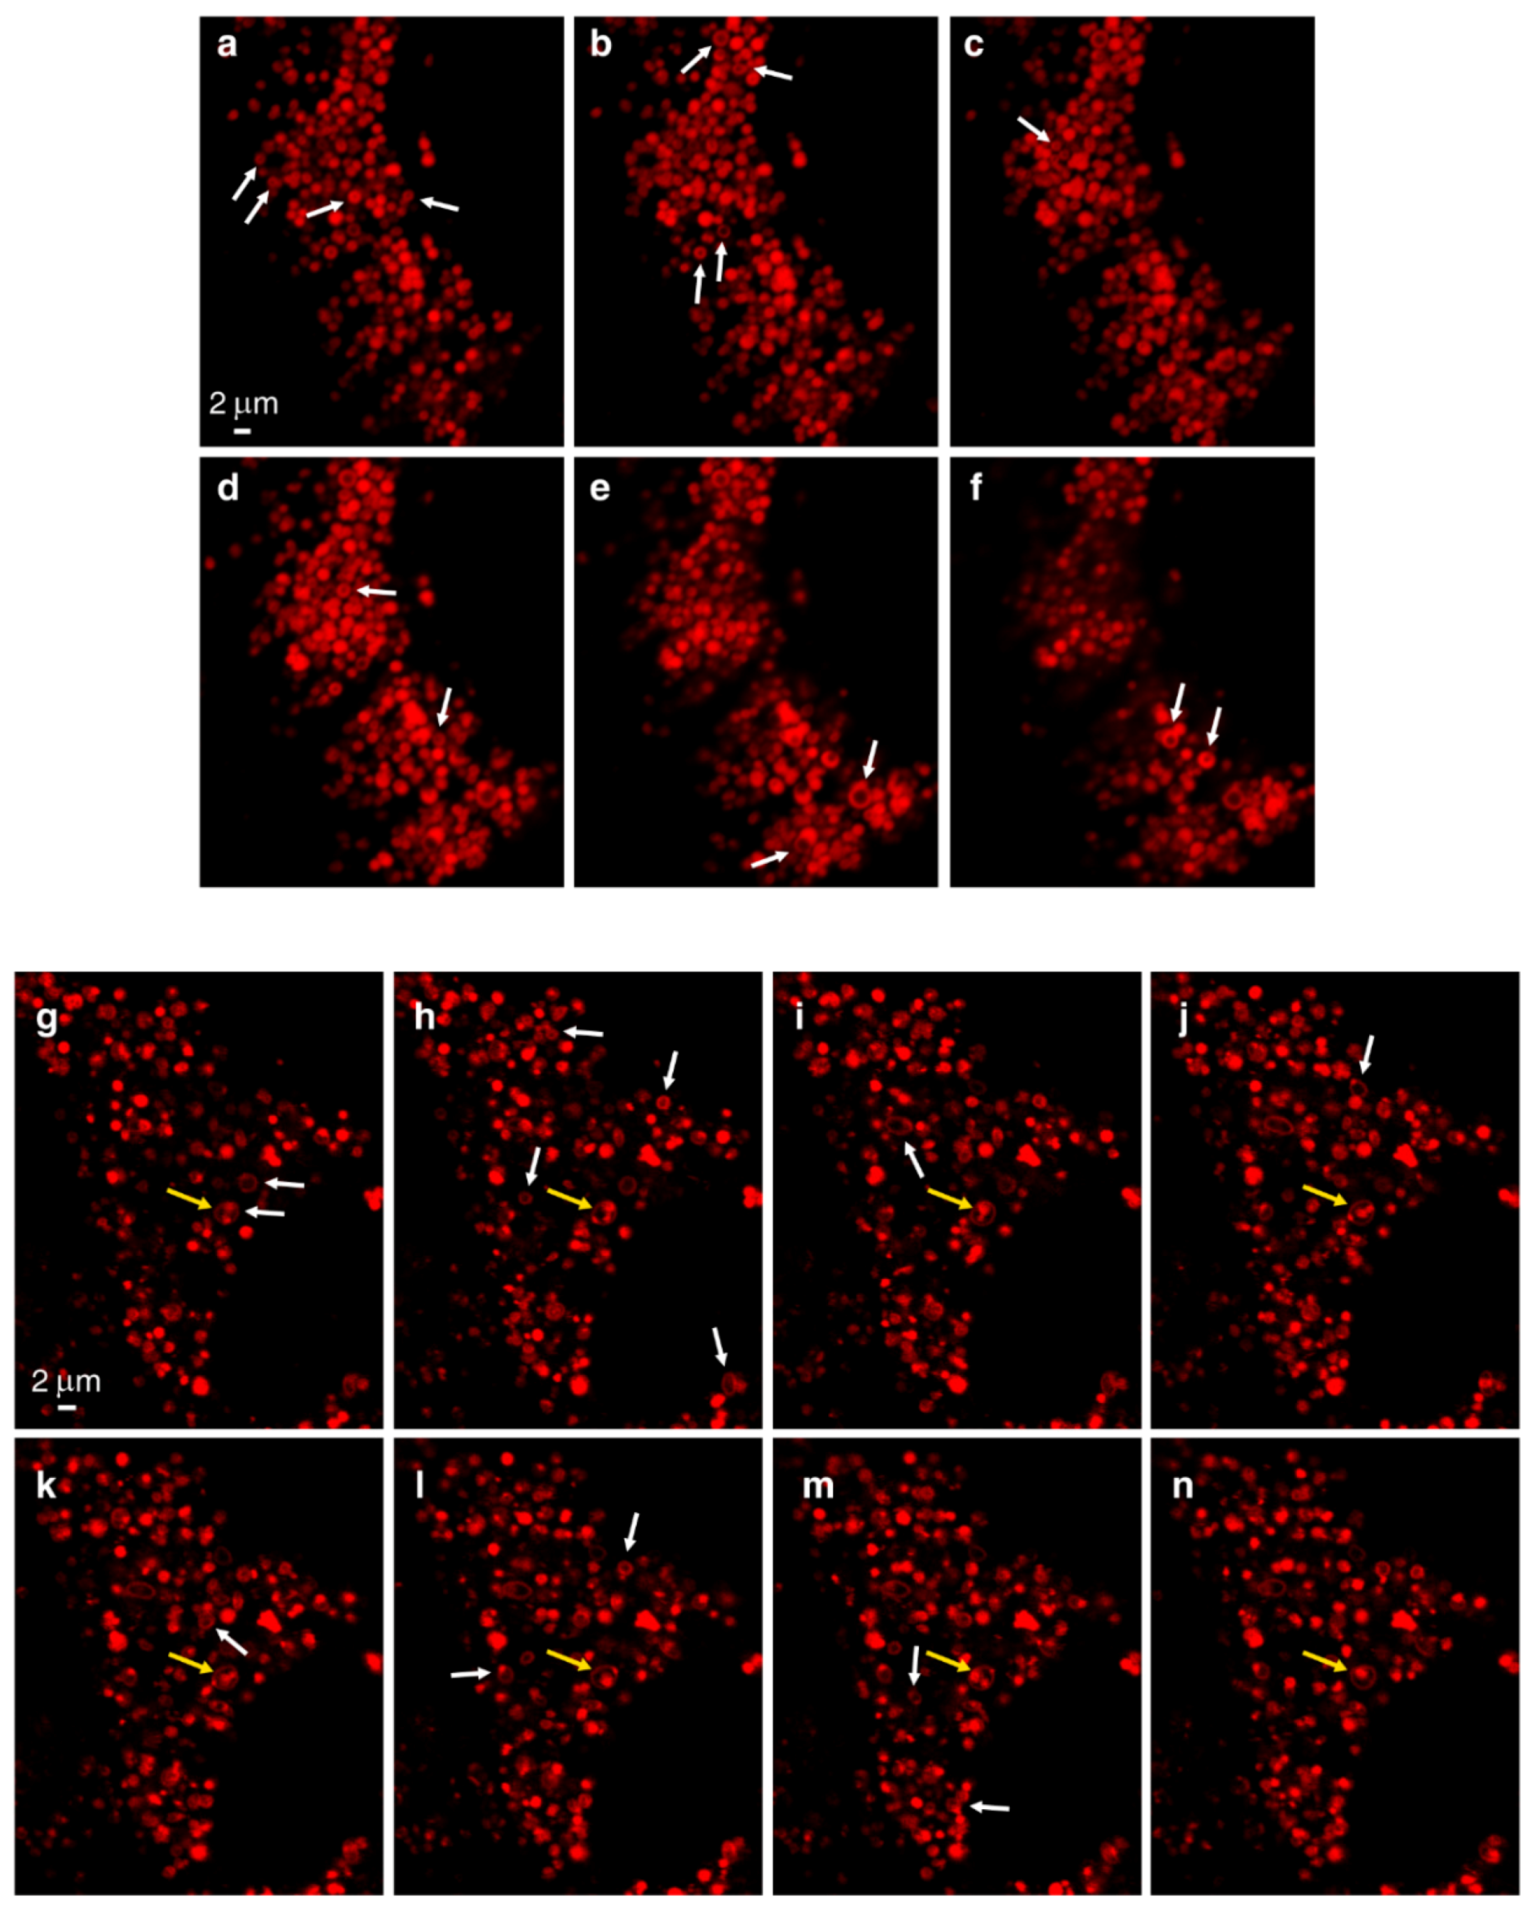
3.1. Live Imaging
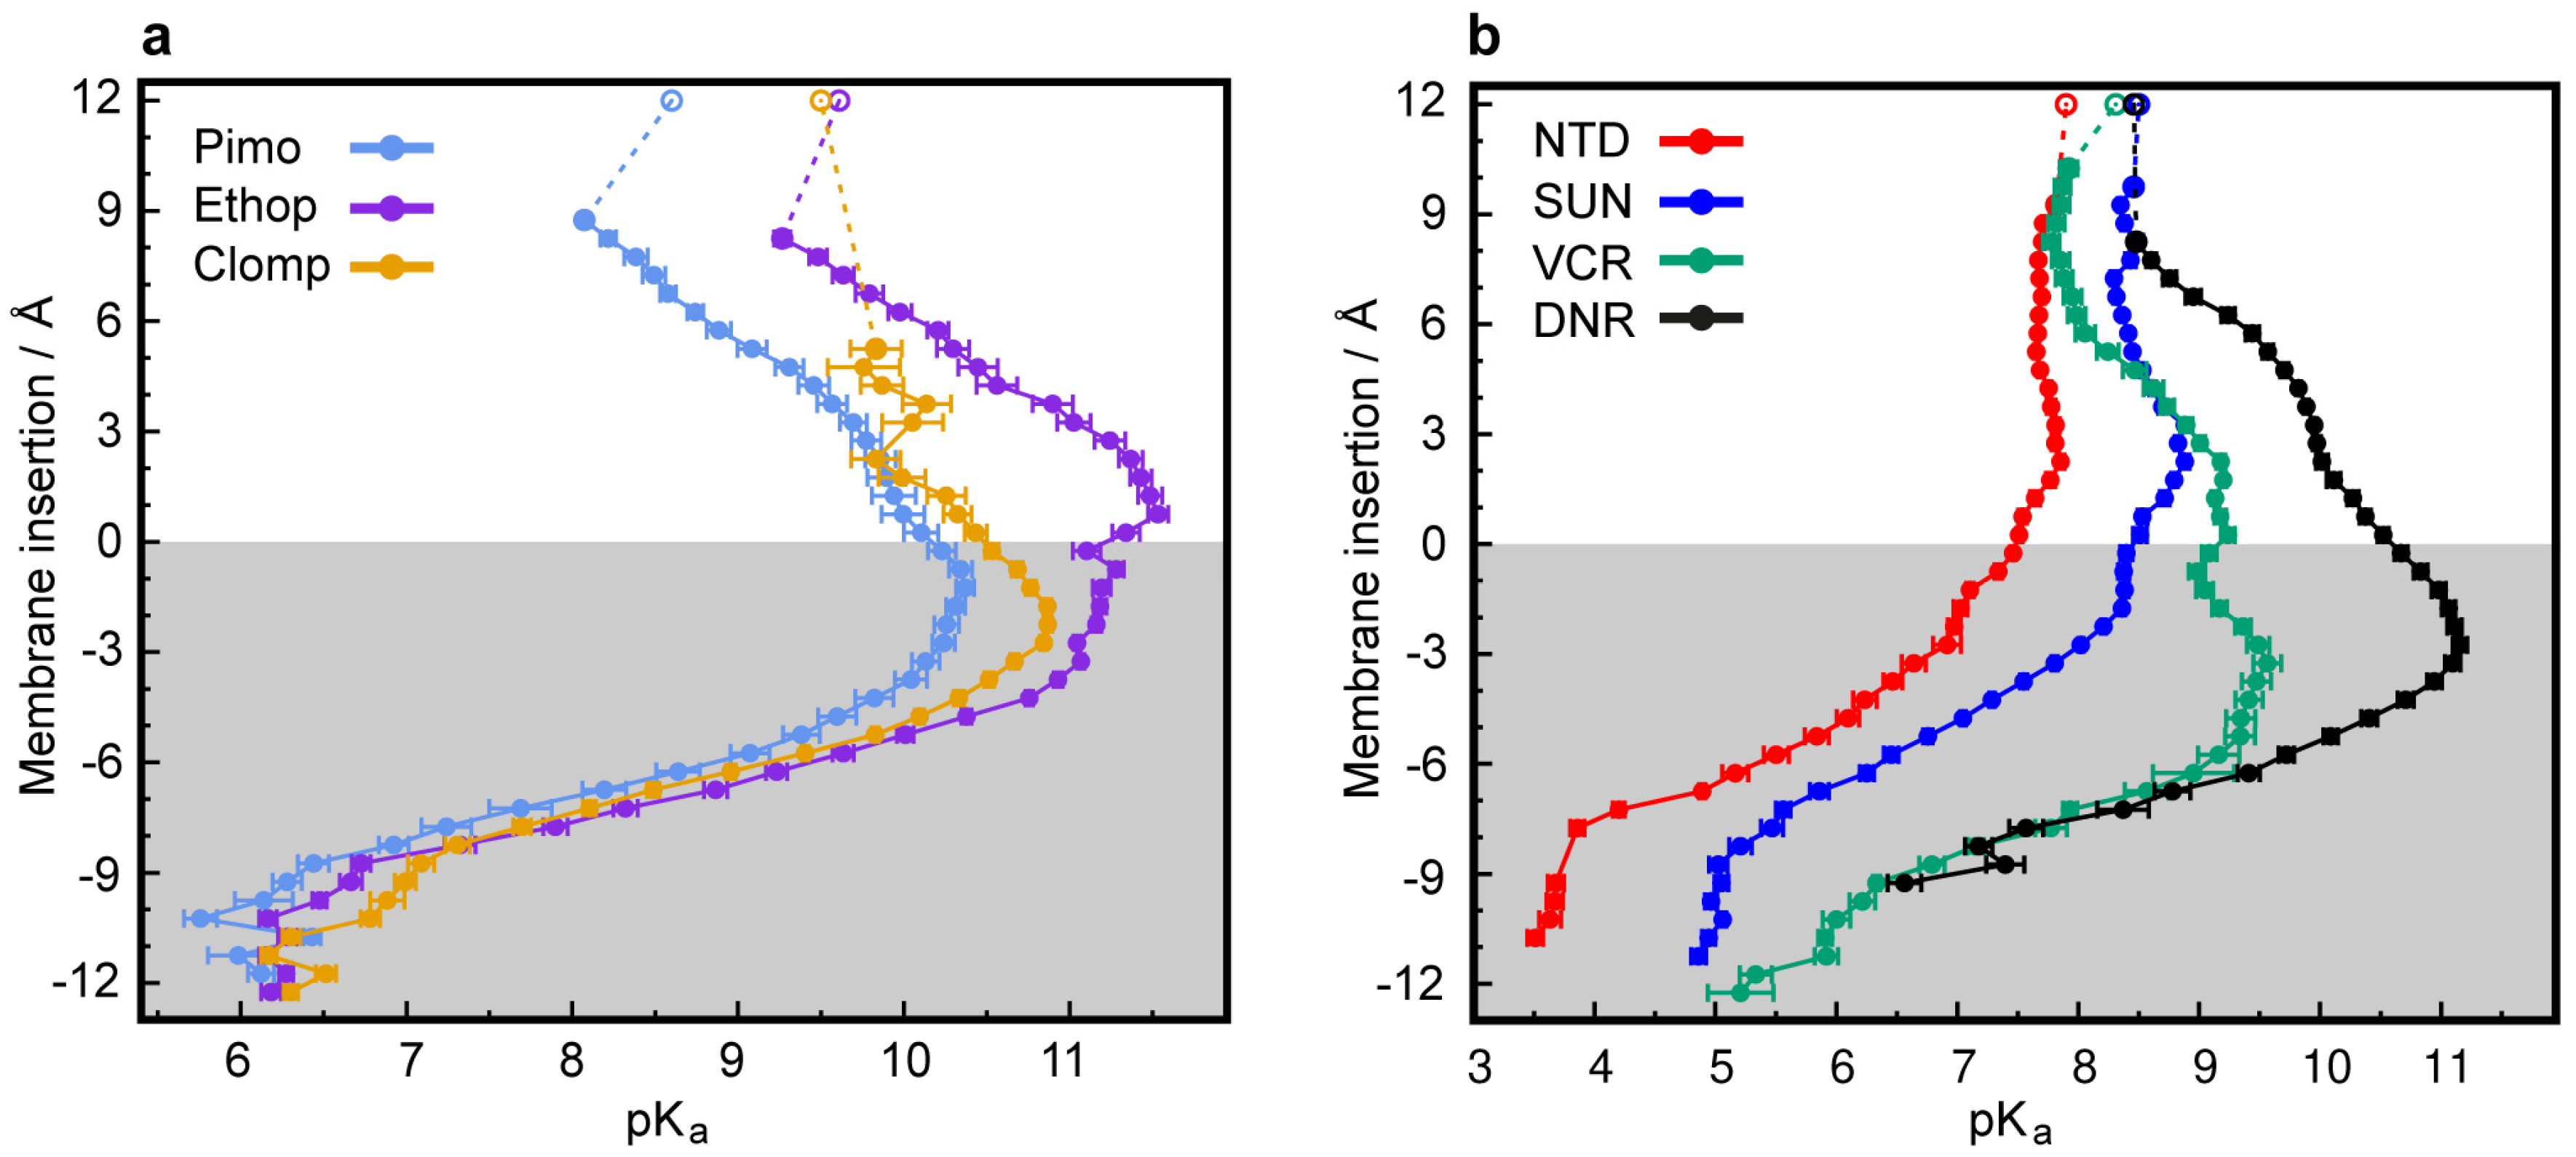
3.2. CpHMD Simulations of LD Insertion into a Phospholipid Bilayer
4. Discussion
Supplementary Materials
Author Contributions
Funding
Acknowledgments
Conflicts of Interest
References
- Lawrence, R.E.; Zoncu, R. The lysosome as a cellular centre for signalling, metabolism and quality control. Nat. Cell Biol. 2019, 21, 133–142. [Google Scholar] [CrossRef] [PubMed]
- Inpanathan, S.; Botelho, R.J. The Lysosome Signaling Platform: Adapting With the Times. Front. cell Dev. Biol. 2019, 7, 113. [Google Scholar] [CrossRef] [PubMed] [Green Version]
- Davidson, S.M.; Vander Heiden, M.G. Critical Functions of the Lysosome in Cancer Biology. Annu. Rev. Pharmacol. Toxicol. 2017, 57, 481–507. [Google Scholar] [CrossRef]
- Fennelly, C.; Amaravadi, R.K. Lysosomal biology in cancer. In Methods in Molecular Biology; Humana Press Inc.: Totowa, NJ, USA, 2017; Volume 1594, pp. 293–308. [Google Scholar]
- Zhitomirsky, B.; Assaraf, Y.G. Lysosomes as mediators of drug resistance in cancer. Drug Resist. Updat. 2016, 24, 23–33. [Google Scholar] [CrossRef] [PubMed]
- Sun, A. Lysosomal storage disease overview. Ann. Transl. Med. 2018, 6, 476. [Google Scholar] [CrossRef] [PubMed]
- Woldemichael, T.; Rosania, G.R. The physiological determinants of drug-induced lysosomal stress resistance. PLoS ONE 2017, 12, e0187627. [Google Scholar] [CrossRef] [Green Version]
- Schneider, P.; Korolenko, T.A.; Busch, U. A review of drug-induced lysosomal disorders of the liver in man and laboratory animals. Microsc. Res. Tech. 1997, 36, 253–275. [Google Scholar] [CrossRef]
- Anderson, N.; Borlak, J. Drug-induced phospholipidosis. FEBS Lett. 2006, 580, 5533–5540. [Google Scholar] [CrossRef]
- Ohkuma, S.; Poole, B. Fluorescence probe measurement of the intralysosomal pH in living cells and the perturbation of pH by various agents. Proc. Natl. Acad. Sci. USA 1978, 75, 3327–3331. [Google Scholar] [CrossRef] [Green Version]
- Johnson, D.E.; Ostrowski, P.; Jaumouillé, V.; Grinstein, S. The position of lysosomes within the cell determines their luminal pH. J. Cell Biol. 2016, 212, 677–692. [Google Scholar] [CrossRef] [Green Version]
- Pisonero-Vaquero, S.; Medina, D.L. Lysosomotropic Drugs: Pharmacological Tools to Study Lysosomal Function. Curr. Drug Metab. 2017, 18, 1147–1158. [Google Scholar] [CrossRef] [PubMed]
- Sironi, J.; Aranda, E.; Nordstrøm, L.U.; Schwartz, E.L. Lysosome Membrane Permeabilization and Disruption of the Molecular Target of Rapamycin (mTOR)-Lysosome Interaction Are Associated with the Inhibition of Lung Cancer Cell Proliferation by a Chloroquinoline Analog. Mol. Pharmacol. 2019, 95, 127–138. [Google Scholar] [CrossRef] [PubMed] [Green Version]
- Zhang, X.; Ding, K.; Ji, J.; Parajuli, H.; Aasen, S.N.; Espedal, H.; Huang, B.; Chen, A.; Wang, J.; Li, X.; et al. Trifluoperazine prolongs the survival of experimental brain metastases by STAT3-dependent lysosomal membrane permeabilization. Am. J. Cancer Res. 2020, 10, 545–563. [Google Scholar] [PubMed]
- Circu, M.; Cardelli, J.; Barr, M.P.; O’Byrne, K.; Mills, G.; El-Osta, H. Modulating lysosomal function through lysosome membrane permeabilization or autophagy suppression restores sensitivity to cisplatin in refractory non-small-cell lung cancer cells. PLoS ONE 2017, 12, e0184922. [Google Scholar] [CrossRef] [PubMed] [Green Version]
- Noguchi, S.; Shibutani, S.; Fukushima, K.; Mori, T.; Igase, M.; Mizuno, T. Bosutinib, an SRC inhibitor, induces caspase-independent cell death associated with permeabilization of lysosomal membranes in melanoma cells. Vet. Comp. Oncol. 2018, 16, 69–76. [Google Scholar] [CrossRef] [PubMed]
- Ostenfeld, M.S.; Fehrenbacher, N.; Hoyer-Hansen, M.; Thomsen, C.; Farkas, T.; Jäättelä, M. Effective tumor cell death by σ-2 receptor ligand siramesine involves lysosomal leakage and oxidative stress. Cancer Res. 2005, 65, 8975–8983. [Google Scholar] [CrossRef] [Green Version]
- Drori, S.; Eytan, G.D.; Assaraf, Y.G. Potentiation of Anticancer-Drug Cytotoxicity by Multidrug-Resistance Chemosensitizers Involves Alterationsin Membrane Fluidity Leading to Increased Membrane Permeability. Eur. J. Biochem. 1995, 228, 1020–1029. [Google Scholar] [CrossRef]
- Murata, T.; Maruoka, N.; Omata, N.; Takashima, Y.; Fujibayashi, Y.; Yonekura, Y.; Wada, Y. A comparative study of the plasma membrane permeabilization and fluidization induced by antipsychotic drugs in the rat brain. Int. J. Neuropsychopharmacol. 2007, 10, 683–689. [Google Scholar] [CrossRef] [Green Version]
- Breuzard, G.; Piot, O.; Angiboust, J.-F.; Manfait, M.; Candeil, L.; Del Rio, M.; Millot, J.-M. Changes in adsorption and permeability of mitoxantrone on plasma membrane of BCRP/MXR resistant cells. Biochem. Biophys. Res. Commun. 2005, 329, 64–70. [Google Scholar] [CrossRef]
- Kim, Y.-C.; Park, J.-H.; Ludovice, P.J.; Prausnitz, M.R. Synergistic enhancement of skin permeability by N-lauroylsarcosine and ethanol. Int. J. Pharm. 2008, 352, 129–138. [Google Scholar] [CrossRef]
- Zhitomirsky, B.; Yunaev, A.; Kreiserman, R.; Kaplan, A.; Stark, M.; Assaraf, Y.G. Lysosomotropic drugs activate TFEB via lysosomal membrane fluidization and consequent inhibition of mTORC1 activity. Cell Death Dis. 2018, 9, 1191. [Google Scholar] [CrossRef] [PubMed]
- Ellegaard, A.-M.; Groth-Pedersen, L.; Oorschot, V.; Klumperman, J.; Kirkegaard, T.; Nylandsted, J.; Jäättelä, M. Sunitinib and SU11652 inhibit acid sphingomyelinase, destabilize lysosomes, and inhibit multidrug resistance. Mol. Cancer Ther. 2013, 12, 2018–2030. [Google Scholar] [CrossRef] [PubMed] [Green Version]
- Ostenfeld, M.S.; Høyer-Hansen, M.; Bastholm, L.; Fehrenbacher, N.; Olsen, O.D.; Groth-Pedersen, L.; Puustinen, P.; Kirkegaard-Sørensen, T.; Nylandsted, J.; Farkas, T.; et al. Anti-cancer agent siramesine is a lysosomotropic detergent that induces cytoprotective autophagosome accumulation. Autophagy 2008, 4, 487–499. [Google Scholar] [CrossRef] [PubMed] [Green Version]
- Englinger, B.; Kallus, S.; Senkiv, J.; Heilos, D.; Gabler, L.; van Schoonhoven, S.; Terenzi, A.; Moser, P.; Pirker, C.; Timelthaler, G.; et al. Intrinsic fluorescence of the clinically approved multikinase inhibitor nintedanib reveals lysosomal sequestration as resistance mechanism in FGFR-driven lung cancer. J. Exp. Clin. Cancer Res. 2017, 36, 122. [Google Scholar] [CrossRef] [PubMed] [Green Version]
- Gotink, K.J.; Broxterman, H.J.; Labots, M.; De Haas, R.R.; Dekker, H.; Honeywell, R.J.; Rudek, M.A.; Beerepoot, L.V.; Musters, R.J.; Jansen, G.; et al. Lysosomal sequestration of sunitinib: A novel mechanism of drug resistance. Clin. Cancer Res. 2011, 17, 7337–7346. [Google Scholar] [CrossRef] [PubMed] [Green Version]
- Nowak-Sliwinska, P.; Weiss, A.; van Beijnum, J.R.; Wong, T.J.; Kilarski, W.W.; Szewczyk, G.; Verheul, H.M.W.; Sarna, T.; van den Bergh, H.; Griffioen, A.W. Photoactivation of lysosomally sequestered sunitinib after angiostatic treatment causes vascular occlusion and enhances tumor growth inhibition. Cell Death Dis. 2015, 6, e1641. [Google Scholar] [CrossRef] [Green Version]
- Hurwitz, S.J.; Terashima, M.; Mizunuma, N.; Slapak, C.A. Vesicular anthracycline accumulation in doxorubicin-selected U-937 cells: Participation of lysosomes. Blood 1997, 89, 3745–3754. [Google Scholar] [CrossRef] [Green Version]
- Zhao, B.; Dierichs, L.; Gu, J.-N.; Trajkovic-Arsic, M.; Axel Hilger, R.; Savvatakis, K.; Vega-Rubin-de-Celis, S.; Liffers, S.-T.; Peña-Llopis, S.; Behrens, D.; et al. TFEB-mediated lysosomal biogenesis and lysosomal drug sequestration confer resistance to MEK inhibition in pancreatic cancer. Cell death Discov. 2020, 6, 12. [Google Scholar] [CrossRef] [Green Version]
- Hellwich, U.; Schubert, R. Concentration-dependent binding of the chiral beta-blocker oxprenolol to isoelectric or negatively charged unilamellar vesicles. Biochem. Pharmacol. 1995, 49, 511–517. [Google Scholar] [CrossRef]
- Barton, P.; Davis, A.M.; McCarthy, D.J.; Webborn, P.J. Drug-phospholipid interactions. 2. Predicting the sites of drug distribution using n-octanol/water and membrane/water distribution coefficients. J. Pharm. Sci. 1997, 86, 1034–1039. [Google Scholar] [CrossRef]
- Avdeef, A.; Box, K.J.; Comer, J.E.A.; Hibbert, C.; Tam, K.Y. pH-Metric logP 10. Determination of liposomal membrane-water partition coefficients of ionizable drugs. Pharm. Res. 1998, 15, 209–215. [Google Scholar] [CrossRef]
- Falcón-Pérez, J.M.; Nazarian, R.; Sabatti, C.; Dell’Angelica, E.C. Distribution and dynamics of Lamp1-containing endocytic organelles in fibroblasts deficient in BLOC-3. J. Cell Sci. 2005, 118, 5243–5255. [Google Scholar] [CrossRef] [PubMed] [Green Version]
- Teixeira, V.H.; Vila-Viçosa, D.; Reis, P.B.P.S.; Machuqueiro, M. pK(a) Values of Titrable Amino Acids at the Water/Membrane Interface. J. Chem. Theory Comput. 2016, 12, 930–934. [Google Scholar] [CrossRef]
- Hess, B.; Kutzner, C.; van der Spoel, D.; Lindahl, E. GROMACS 4: Algorithms for Highly Efficient, Load-Balanced, and Scalable Molecular Simulation. J. Chem. Theory Comput. 2008, 4, 435–447. [Google Scholar] [CrossRef] [PubMed] [Green Version]
- Schmid, N.; Eichenberger, A.P.; Choutko, A.; Riniker, S.; Winger, M.; Mark, A.E.; Van Gunsteren, W.F. Definition and testing of the GROMOS force-field versions 54A7 and 54B7. Eur. Biophys. J. 2011, 40, 843–856. [Google Scholar] [CrossRef] [PubMed]
- Hermans, J.; Berendsen, H.J.C.; Van Gunsteren, W.F.; Postma, J.P.M. A consistent empirical potential for water-protein interactions. Biopolymers 1984, 23, 1513–1518. [Google Scholar] [CrossRef]
- Koziara, K.B.; Stroet, M.; Malde, A.K.; Mark, A.E. Testing and validation of the Automated Topology Builder (ATB) version 2.0: Prediction of hydration free enthalpies. J. Comput. Aided. Mol. Des. 2014, 28, 221–233. [Google Scholar] [CrossRef]
- Gwt, M.F.; Schlegel, H.; Scuseria, G.; Robb, M. Gaussian 09. Gaussian, Inc.: Wallingford, CT, USA, 2009. [Google Scholar]
- Stephens, P.J.; Devlin, F.J.; Chabalowski, C.F.; Frisch, M.J. Ab Initio Calculation of Vibrational Absorption and Circular Dichroism Spectra Using Density Functional Force Fields. J. Phys. Chem. 1994, 98, 11623–11627. [Google Scholar] [CrossRef]
- Rocchia, W.; Sridharan, S.; Nicholls, A.; Alexov, E.; Chiabrera, A.; Honig, B. Rapid grid-based construction of the molecular surface and the use of induced surface charge to calculate reaction field energies: Applications to the molecular systems and geometric objects. J. Comput. Chem. 2002, 23, 128–137. [Google Scholar] [CrossRef]
- Teixeira, V.H.; Cunha, C.A.; Machuqueiro, M.; Oliveira, A.S.F.; Victor, B.L.; Soares, C.M.; Baptista, A.M. On the use of different dielectric constants for computing individual and pairwise terms in poisson-boltzmann studies of protein ionization equilibrium. J. Phys. Chem. B 2005, 109, 14691–14706. [Google Scholar] [CrossRef]
- Baptista, A.M.; Scares, C.M. Some theoretical and computational aspects of the inclusion of proton isomerism in the protonation equilibrium of proteins. J. Phys. Chem. B 2001, 105, 293–309. [Google Scholar] [CrossRef]
- Vila-Viçosa, D.; Reis, P.B.P.S.; Baptista, A.M.; Oostenbrink, C.; Machuqueiro, M. A pH Replica Exchange Scheme in the Stochastic Titration Constant-pH MD Method. J. Chem. Theory Comput. 2019, 15, 3108–3116. [Google Scholar] [CrossRef] [PubMed]
- Baptista, A.M.; Teixeira, V.H.; Soares, C.M. Constant-pH molecular dynamics using stochastic titration. J. Chem. Phys. 2002, 117, 4184–4200. [Google Scholar] [CrossRef]
- Carvalheda, C.A.; Campos, S.R.R.; Baptista, A.M. The Effect of Membrane Environment on Surfactant Protein C Stability Studied by Constant-pH Molecular Dynamics. J. Chem. Inf. Model. 2015, 55, 2206–2217. [Google Scholar] [CrossRef] [PubMed]
- Rubin, D.B. The Bayesian Bootstrap. Ann. Stat. 1981, 9, 130–134. [Google Scholar] [CrossRef]
- Pajouhesh, H.; Lenz, G.R. Medicinal chemical properties of successful central nervous system drugs. NeuroRx 2005, 2, 541–553. [Google Scholar] [CrossRef] [PubMed] [Green Version]
- Anderson, G.P.; Linden, A.; Rabe, K.F. Why are long-acting beta-adrenoceptor agonists long-acting? Eur. Respir. J. 1994, 7, 569–578. [Google Scholar] [CrossRef] [PubMed] [Green Version]
- Opler, L.A.; Feinberg, S.S. The role of pimozide in clinical psychiatry: A review. J. Clin. Psychiatry 1991, 52, 221–233. [Google Scholar] [PubMed]
- Zielke, S.; Meyer, N.; Mari, M.; Abou-El-Ardat, K.; Reggiori, F.; van Wijk, S.J.L.; Kögel, D.; Fulda, S. Loperamide, pimozide, and STF-62247 trigger autophagy-dependent cell death in glioblastoma cells. Cell Death Dis. 2018, 9, 994. [Google Scholar] [CrossRef]
- Coleman, J.; Xiang, Y.; Pande, P.; Shen, D.; Gatica, D.; Patton, W.F. A live-cell fluorescence microplate assay suitable for monitoring vacuolation arising from drug or toxic agent treatment. J. Biomol. Screen. 2010, 15, 398–405. [Google Scholar] [CrossRef] [Green Version]
- Wilson, M.; Tripp, J. Clomipramine; StatPearls Publishing: St. Petersburg, FL, USA, 2020. [Google Scholar]
- Nadanaciva, S.; Lu, S.; Gebhard, D.F.; Jessen, B.A.; Pennie, W.D.; Will, Y. A high content screening assay for identifying lysosomotropic compounds. Toxicol. In Vitro 2011, 25, 715–723. [Google Scholar] [CrossRef] [PubMed]
- Brocks, D.R. Anticholinergic drugs used in Parkinson’s disease: An overlooked class of drugs from a pharmacokinetic perspective. J. Pharm. Pharm. Sci. 1999, 2, 39–46. [Google Scholar] [PubMed]
- Kornhuber, J.; Muehlbacher, M.; Trapp, S.; Pechmann, S.; Friedl, A.; Reichel, M.; Mühle, C.; Terfloth, L.; Groemer, T.W.; Spitzer, G.M.; et al. Identification of novel functional inhibitors of acid sphingomyelinase. PLoS ONE 2011, 6, e23852. [Google Scholar] [CrossRef] [PubMed] [Green Version]
- Beckmann, N.; Sharma, D.; Gulbins, E.; Becker, K.A.; Edelmann, B. Inhibition of acid sphingomyelinase by tricyclic antidepressants and analogons. Front. Physiol. 2014, 5, 331. [Google Scholar] [CrossRef] [PubMed] [Green Version]
- Zhao, H.; Cai, Y.; Santi, S.; Lafrenie, R.; Lee, H. Chloroquine-Mediated Radiosensitization is due to the Destabilization of the Lysosomal Membrane and Subsequent Induction of Cell Death by Necrosis. Radiat. Res. 2005, 164, 250–257. [Google Scholar] [CrossRef] [PubMed]
- Adar, Y.; Stark, M.; Bram, E.E.; Nowak-Sliwinska, P.; van den Bergh, H.; Szewczyk, G.; Sarna, T.; Skladanowski, A.; Griffioen, A.W.; Assaraf, Y.G. Imidazoacridinone-dependent lysosomal photodestruction: A pharmacological Trojan horse approach to eradicate multidrug-resistant cancers. Cell Death Dis. 2012, 3, e293. [Google Scholar] [CrossRef] [Green Version]
- Lu, Y.; Dong, S.; Hao, B.; Li, C.; Zhu, K.; Guo, W.; Wang, Q.; Cheung, K.-H.; Wong, C.W.M.; Wu, W.-T.; et al. Vacuolin-1 potently and reversibly inhibits autophagosome-lysosome fusion by activating RAB5A. Autophagy 2014, 10, 1895–1905. [Google Scholar] [CrossRef] [Green Version]
- Cerny, J.; Feng, Y.; Yu, A.; Miyake, K.; Borgonovo, B.; Klumperman, J.; Meldolesi, J.; McNeil, P.L.; Kirchhausen, T. The small chemical vacuolin-1 inhibits Ca(2+)-dependent lysosomal exocytosis but not cell resealing. EMBO Rep. 2004, 5, 883–888. [Google Scholar] [CrossRef]
- Aubel-Sadron, G.; Londos-Gagliardi, D. Daunorubicin and doxorubicin, anthracycline antibiotics, a physicochemical and biological review. Biochimie 1984, 66, 333–352. [Google Scholar] [CrossRef]
- Varone, F.; Sgalla, G.; Iovene, B.; Bruni, T.; Richeldi, L. Nintedanib for the treatment of idiopathic pulmonary fibrosis. Expert Opin. Pharmacother. 2018, 19, 167–175. [Google Scholar] [CrossRef]
- Roth, G.J.; Binder, R.; Colbatzky, F.; Dallinger, C.; Schlenker-Herceg, R.; Hilberg, F.; Wollin, S.-L.; Kaiser, R. Nintedanib: From discovery to the clinic. J. Med. Chem. 2015, 58, 1053–1063. [Google Scholar] [CrossRef] [PubMed]
- Zhitomirsky, B.; Assaraf, Y.G. Lysosomal sequestration of hydrophobic weak base chemotherapeutics triggers lysosomal biogenesis and lysosomedependent cancer multidrug resistance. Oncotarget 2015, 6, 1143–1156. [Google Scholar] [CrossRef] [PubMed] [Green Version]
- Kaufmann, A.M.; Krise, J.P. Lysosomal Sequestration of Amine-Containing Drugs: Analysis and Therapeutic Implications. J. Pharm. Sci. 2007, 96, 729–746. [Google Scholar] [CrossRef] [PubMed]
- Logan, R.; Kong, A.C.; Krise, J.P. Time-dependent effects of hydrophobic amine-containing drugs on lysosome structure and biogenesis in cultured human fibroblasts. J. Pharm. Sci. 2014, 103, 3287–3296. [Google Scholar] [CrossRef] [PubMed]
- Faigle, J.W.; Dieterle, W. The Metabolism and Pharmacokinetics of Clomipramine (Anafranil). J. Int. Med. Res. 1973, 1, 281–290. [Google Scholar] [CrossRef]
- El Tayar, N.; Van de Waterbeemd, H.; Testa, B. Lipophilicity measurements of protonated basic compounds by reversed-phase high-performance liquid chromatography. II. Procedure for the determination of a lipophilic index measured by reversed-phase high-performance liquid chromatography. J. Chromatogr. A 1985, 320, 305–312. [Google Scholar] [CrossRef]
- Marshall, P.B. Some chemical and physical properties associated with histamine antagonism. Br. J. Pharmacol. Chemother. 1955, 10, 270–278. [Google Scholar] [CrossRef] [Green Version]
- Sun, N.; Avdeef, A. Biorelevant pK(a) (37 °C) predicted from the 2D structure of the molecule and its pK(a) at 25 °C. J. Pharm. Biomed. Anal. 2011, 56, 173–182. [Google Scholar] [CrossRef] [Green Version]
- O’Neil, M.J. The Merck Index: An Encyclopedia of Chemicals, Drugs, and Biologicals; Merck: Kenilworth, NJ, USA, 2006; ISBN 9780911910001. [Google Scholar]
- Di Marco, A.; Casazza, A.M.; Dasdia, T.; Necco, A.; Pratesi, G.; Rivolta, P.; Velcich, A.; Zaccara, A.; Zunino, F. Changes of activity of daunorubicin, adriamycin and stereoisomers following the introduction or removal of hydroxyl groups in the amino sugar moiety. Chem. Biol. Interact. 1977, 19, 291–302. [Google Scholar] [CrossRef]
- Sanli, S.; Altun, Y.; Guven, G. Solvent effects on pKa values of some anticancer agents in acetonitrile—Water binary mixtures. J. Chem. Eng. Data 2014, 59, 4015–4020. [Google Scholar] [CrossRef]
- Duvvuri, M.; Gong, Y.; Chatterji, D.; Krise, J.P. Weak base permeability characteristics influence the intracellular sequestration site in the multidrug-resistant human leukemic cell line HL-60. J. Biol. Chem. 2004, 279, 32367–32372. [Google Scholar] [CrossRef] [PubMed] [Green Version]
- Yue, Z.; Li, C.; Voth, G.A.; Swanson, J.M.J. Dynamic Protonation Dramatically Affects the Membrane Permeability of Drug-like Molecules. J. Am. Chem. Soc. 2019, 141, 13421–13433. [Google Scholar] [CrossRef] [PubMed]
- Hansch, C.; Leo, A.; Hoekman, D.H. Exploring QSAR; American Chemical Society: Washington, DC, USA, 1995; ISBN 0841229910. [Google Scholar]
- Sangster, J. LOGKOW A Databank of Evaluated Octanol-Water Partition Coefficients; Sangster Research Laboratories: Montreal, QC, Canada, 1997; Volume 1. [Google Scholar]
- Leo, A.; Hansch, C.; Elkins, D. Partition coefficients and their uses. Chem. Rev. 1971, 71, 525–616. [Google Scholar] [CrossRef]
- Yang, F.; Zhang, Y.; Liang, H. Interactive association of drugs binding to human serum albumin. Int. J. Mol. Sci. 2014, 15, 3580–3595. [Google Scholar] [CrossRef] [PubMed]
- Shore, P.A.; Brodie, B.B.; Hogben, C.A. The gastric secretion of drugs: A pH partition hypothesis. J. Pharmacol. Exp. Ther. 1957, 119, 361–369. [Google Scholar]
- Paloncýová, M.; DeVane, R.; Murch, B.; Berka, K.; Otyepka, M. Amphiphilic drug-like molecules accumulate in a membrane below the head group region. J. Phys. Chem. B 2014, 118, 1030–1039. [Google Scholar] [CrossRef]
- Seu, K.J.; Cambrea, L.R.; Everly, R.M.; Hovis, J.S. Influence of lipid chemistry on membrane fluidity: Tail and headgroup interactions. Biophys. J. 2006, 91, 3727–3735. [Google Scholar] [CrossRef] [Green Version]
- Matyszewska, D. Comparison of the interactions of daunorubicin in a free form and attached to single-walled carbon nanotubes with model lipid membranes. Beilstein J. Nanotechnol. 2016, 7, 524–532. [Google Scholar] [CrossRef] [Green Version]
- Kornhuber, J.; Henkel, A.W.; Groemer, T.W.; Städtler, S.; Welzel, O.; Tripal, P.; Rotter, A.; Bleich, S.; Trapp, S. Lipophilic cationic drugs increase the permeability of lysosomal membranes in a cell culture system. J. Cell. Physiol. 2010, 224, 152–164. [Google Scholar] [CrossRef]
- Avdeef, A. Physicochemical profiling (solubility, permeability and charge state). Curr. Top. Med. Chem. 2001, 1, 277–351. [Google Scholar] [CrossRef] [PubMed]
- Boulanger, Y.; Schreier, S.; Smith, I.C. Molecular details of anesthetic--lipid interaction as seen by deuterium and phosphorus-31 nuclear magnetic resonance. Biochemistry 1981, 20, 6824–6830. [Google Scholar] [CrossRef] [PubMed]
- Schulze, H.; Kolter, T.; Sandhoff, K. Principles of lysosomal membrane degradation: Cellular topology and biochemistry of lysosomal lipid degradation. Biochim. Biophys. Acta 2009, 1793, 674–683. [Google Scholar] [CrossRef] [PubMed] [Green Version]
- Kolter, T.; Sandhoff, K. Principles of lysosomal membrane digestion: Stimulation of sphingolipid degradation by sphingolipid activator proteins and anionic lysosomal lipids. Annu. Rev. Cell Dev. Biol. 2005, 21, 81–103. [Google Scholar] [CrossRef] [PubMed] [Green Version]
- Kaufmann, A.M.; Krise, J.P. Niemann-Pick C1 functions in regulating lysosomal amine content. J. Biol. Chem. 2008, 283, 24584–24593. [Google Scholar] [CrossRef] [Green Version]
- Gong, Y.; Duvvuri, M.; Duncan, M.B.; Liu, J.; Krise, J.P. Niemann-Pick C1 protein facilitates the efflux of the anticancer drug daunorubicin from cells according to a novel vesicle-mediated pathway. J. Pharmacol. Exp. Ther. 2006, 316, 242–247. [Google Scholar] [CrossRef]
- Sousa, C.; Sá e Melo, T.; Gèze, M.; Gaullier, J.M.; Mazière, J.C.; Santus, R. Solvent polarity and pH effects on the spectroscopic properties of neutral red: Application to lysosomal microenvironment probing in living cells. Photochem. Photobiol. 1996, 63, 601–607. [Google Scholar] [CrossRef]
- Schmitt, M.V.; Lienau, P.; Fricker, G.; Reichel, A. Quantitation of Lysosomal Trapping of Basic Lipophilic Compounds Using In Vitro Assays and In Silico Predictions Based on the Determination of the Full pH Profile of the Endo-/Lysosomal System in Rat Hepatocytes. Drug Metab. Dispos. 2019, 47, 49–57. [Google Scholar] [CrossRef] [Green Version]
- Lemieux, B.; Percival, M.D.; Falgueyret, J.-P. Quantitation of the lysosomotropic character of cationic amphiphilic drugs using the fluorescent basic amine Red DND-99. Anal. Biochem. 2004, 327, 247–251. [Google Scholar] [CrossRef] [PubMed]
- Yoshida, K.; Nagatoishi, S.; Kuroda, D.; Suzuki, N.; Murata, T.; Tsumoto, K. Phospholipid Membrane Fluidity Alters Ligand Binding Activity of a G Protein-Coupled Receptor by Shifting the Conformational Equilibrium. Biochemistry 2019, 58, 504–508. [Google Scholar] [CrossRef]
- Ge, G.; Wu, J.; Lin, Q. Effect of membrane fluidity on tyrosine kinase activity of reconstituted epidermal growth factor receptor. Biochem. Biophys. Res. Commun. 2001, 282, 511–514. [Google Scholar] [CrossRef]
- Gowda, R.; Inamdar, G.S.; Kuzu, O.; Dinavahi, S.S.; Krzeminski, J.; Battu, M.B.; Voleti, S.R.; Amin, S.; Robertson, G.P. Identifying the structure-activity relationship of leelamine necessary for inhibiting intracellular cholesterol transport. Oncotarget 2017, 8, 28260–28277. [Google Scholar] [CrossRef] [PubMed] [Green Version]
- Kuzu, O.F.; Gowda, R.; Sharma, A.; Robertson, G.P. Leelamine mediates cancer cell death through inhibition of intracellular cholesterol transport. Mol. Cancer Ther. 2014, 13, 1690–1703. [Google Scholar] [CrossRef] [PubMed] [Green Version]
- Goldman, S.D.B.; Funk, R.S.; Rajewski, R.A.; Krise, J.P. Mechanisms of amine accumulation in, and egress from, lysosomes. Bioanalysis 2009, 1, 1445–1459. [Google Scholar] [CrossRef] [PubMed] [Green Version]
- Duvvuri, M.; Krise, J.P. A novel assay reveals that weakly basic model compounds concentrate in lysosomes to an extent greater than pH-partitioning theory would predict. Mol. Pharm. 2005, 2, 440–448. [Google Scholar] [CrossRef] [PubMed]
- Kopeć, W.; Telenius, J.; Khandelia, H. Molecular dynamics simulations of the interactions of medicinal plant extracts and drugs with lipid bilayer membranes. FEBS J. 2013, 280, 2785–2805. [Google Scholar] [CrossRef]
- Róg, T.; Pasenkiewicz-Gierula, M. Non-polar interactions between cholesterol and phospholipids: A molecular dynamics simulation study. Biophys. Chem. 2004, 107, 151–164. [Google Scholar] [CrossRef]
- Smaby, J.M.; Momsen, M.M.; Brockman, H.L.; Brown, R.E. Phosphatidylcholine acyl unsaturation modulates the decrease in interfacial elasticity induced by cholesterol. Biophys. J. 1997, 73, 1492–1505. [Google Scholar] [CrossRef] [Green Version]
- Alves, A.C.; Magarkar, A.; Horta, M.; Lima, J.L.F.C.; Bunker, A.; Nunes, C.; Reis, S. Influence of doxorubicin on model cell membrane properties: Insights from in vitro and in silico studies. Sci. Rep. 2017, 7, 6343. [Google Scholar] [CrossRef] [Green Version]
- Goldstein, D.B. The Effects of Drugs on Membrane Fluidity. Annu. Rev. Pharmacol. Toxicol. 1984, 24, 43–64. [Google Scholar] [CrossRef]
- Kölzer, M.; Werth, N.; Sandhoff, K. Interactions of acid sphingomyelinase and lipid bilayers in the presence of the tricyclic antidepressant desipramine. FEBS Lett. 2004, 559, 96–98. [Google Scholar] [CrossRef] [Green Version]
- Elojeimy, S.; Holman, D.H.; Liu, X.; El-Zawahry, A.; Villani, M.; Cheng, J.C.; Mahdy, A.; Zeidan, Y.; Bielwaska, A.; Hannun, Y.A.; et al. New insights on the use of desipramine as an inhibitor for acid ceramidase. FEBS Lett. 2006, 580, 4751–4756. [Google Scholar] [CrossRef] [PubMed] [Green Version]
- Matsuzawa, Y.; Hostetler, K.Y. Inhibition of lysosomal phospholipase A and phospholipase C by chloroquine and 4,4′-bis(diethylaminoethoxy) alpha, beta-diethyldiphenylethane. J. Biol. Chem. 1980, 255, 5190–5194. [Google Scholar] [PubMed]
- Shayman, J.A.; Kelly, R.; Kollmeyer, J.; He, Y.; Abe, A. Group XV phospholipase A₂, a lysosomal phospholipase A₂. Prog. Lipid Res. 2011, 50, 1–13. [Google Scholar] [CrossRef] [PubMed] [Green Version]
- Gorelik, A.; Illes, K.; Heinz, L.X.; Superti-Furga, G.; Nagar, B. Crystal structure of mammalian acid sphingomyelinase. Nat. Commun. 2016, 7, 12196. [Google Scholar] [CrossRef]
- Gebai, A.; Gorelik, A.; Li, Z.; Illes, K.; Nagar, B. Structural basis for the activation of acid ceramidase. Nat. Commun. 2018, 9, 1621. [Google Scholar] [CrossRef]
- Abe, A.; Shayman, J.A. The role of negatively charged lipids in lysosomal phospholipase A2 function. J. Lipid Res. 2009, 50, 2027–2035. [Google Scholar] [CrossRef] [Green Version]
- Linke, T.; Wilkening, G.; Sadeghlar, F.; Mozcall, H.; Bernardo, K.; Schuchman, E.; Sandhoff, K. Interfacial Regulation of Acid Ceramidase Activity: Stimulation of ceramide degradation by lysosomal lipids and sphingolipid activator proteins. J. Biol. Chem. 2001, 276, 5760–5768. [Google Scholar] [CrossRef] [Green Version]
- Hurwitz, R.; Ferlinz, K.; Sandhofl, K. The Tricyclic Antidepressant Desiprarnine Causes Proteolytic Degradation of Lysosomal Sphingomyelinase in Human Fibroblasts. Biol. Chem. Hoppe. Seyler. 1994, 375, 447–450. [Google Scholar] [CrossRef]
- Ali, B.H.; Al Za’abi, M.; Blunden, G.; Nemmar, A. Experimental gentamicin nephrotoxicity and agents that modify it: A mini-review of recent research. Basic Clin. Pharmacol. Toxicol. 2011, 109, 225–232. [Google Scholar] [CrossRef]
- Kacew, S. Cationic amphiphilic drug-induced renal cortical lysosomal phospholipidosis: An in vivo comparative study with gentamicin and chlorphentermine. Toxicol. Appl. Pharmacol. 1987, 91, 469–476. [Google Scholar] [CrossRef]
- Davies, J.P.; Ioannou, Y.A. Topological analysis of Niemann-Pick C1 protein reveals that the membrane orientation of the putative sterol-sensing domain is identical to those of 3-hydroxy-3-methylglutaryl-CoA reductase and sterol regulatory element binding protein cleavage-activating protein. J. Biol. Chem. 2000, 275, 24367–24374. [Google Scholar] [PubMed] [Green Version]
- Kosicek, M.; Gudelj, I.; Horvatic, A.; Jovic, T.; Vuckovic, F.; Lauc, G.; Hecimovic, S. N-glycome of the Lysosomal Glycocalyx is Altered in Niemann-Pick Type C Disease (NPC) Model Cells. Mol. Cell. Proteomics 2018, 17, 631–642. [Google Scholar] [CrossRef] [PubMed] [Green Version]
- Neiss, W.F. A coat of glycoconjugates on the inner surface of the lysosomal membrane in the rat kidney. Histochemistry 1984, 80, 603–608. [Google Scholar] [CrossRef] [PubMed]
- Eskelinen, E.L.; Tanaka, Y.; Saftig, P. At the acidic edge: Emerging functions for lysosomal membrane proteins. Trends Cell Biol. 2003, 13, 137–145. [Google Scholar] [CrossRef]
- Li, J.; Deffieu, M.S.; Lee, P.L.; Saha, P.; Pfeffer, S.R. Glycosylation inhibition reduces cholesterol accumulation in NPC1 protein-deficient cells. Proc. Natl. Acad. Sci. USA 2015, 112, 14876–14881. [Google Scholar] [CrossRef] [PubMed] [Green Version]
- Rodriguez-Navarro, J.A.; Kaushik, S.; Koga, H.; Dall’Armi, C.; Shui, G.; Wenk, M.R.; Di Paolo, G.; Cuervo, A.M. Inhibitory effect of dietary lipids on chaperone-mediated autophagy. Proc. Natl. Acad. Sci. USA 2012, 109, E705–E714. [Google Scholar] [CrossRef] [Green Version]
- Vance, J.E.; Steenbergen, R. Metabolism and functions of phosphatidylserine. Prog. Lipid Res. 2005, 44, 207–234. [Google Scholar] [CrossRef]
- Gallala, H.D.; Sandhoff, K. Biological function of the cellular lipid BMP-BMP as a key activator for cholesterol sorting and membrane digestion. Neurochem. Res. 2011, 36, 1594–1600. [Google Scholar] [CrossRef]
- Wherrett, J.R.; Huterer, S. Enrichment of bis-(monoacylglyceryl) phosphate in lysosomes from rat liver. J. Biol. Chem. 1972, 247, 4114–4120. [Google Scholar]
- Möbius, W.; van Donselaar, E.; Ohno-Iwashita, Y.; Shimada, Y.; Heijnen, H.F.G.; Slot, J.W.; Geuze, H.J. Recycling compartments and the internal vesicles of multivesicular bodies harbor most of the cholesterol found in the endocytic pathway. Traffic 2003, 4, 222–231. [Google Scholar] [CrossRef]
- Martinez-Seara Monne, H.; Danne, R.; Róg, T.; Ilpo, V.; Gurtovenko, A. Structure of Glycocalyx. Biophys. J. 2013, 104, 251a. [Google Scholar] [CrossRef] [Green Version]
- Yi, Y.-P.; Wang, X.; Zhang, G.; Fu, T.-S.; Zhang, G.-J. Phosphatidic acid osmotically destabilizes lysosomes through increased permeability to K+ and H+. Gen. Physiol. Biophys. 2006, 25, 149–160. [Google Scholar] [PubMed]
- Kolter, T.; Sandhoff, K. Sphingolipid metabolism diseases. Biochim. Biophys. Acta Biomembr. 2006, 1758, 2057–2079. [Google Scholar] [CrossRef] [PubMed] [Green Version]


© 2020 by the authors. Licensee MDPI, Basel, Switzerland. This article is an open access article distributed under the terms and conditions of the Creative Commons Attribution (CC BY) license (http://creativecommons.org/licenses/by/4.0/).
Share and Cite
Stark, M.; Silva, T.F.D.; Levin, G.; Machuqueiro, M.; Assaraf, Y.G. The Lysosomotropic Activity of Hydrophobic Weak Base Drugs is Mediated via Their Intercalation into the Lysosomal Membrane. Cells 2020, 9, 1082. https://doi.org/10.3390/cells9051082
Stark M, Silva TFD, Levin G, Machuqueiro M, Assaraf YG. The Lysosomotropic Activity of Hydrophobic Weak Base Drugs is Mediated via Their Intercalation into the Lysosomal Membrane. Cells. 2020; 9(5):1082. https://doi.org/10.3390/cells9051082
Chicago/Turabian StyleStark, Michal, Tomás F. D. Silva, Guy Levin, Miguel Machuqueiro, and Yehuda G. Assaraf. 2020. "The Lysosomotropic Activity of Hydrophobic Weak Base Drugs is Mediated via Their Intercalation into the Lysosomal Membrane" Cells 9, no. 5: 1082. https://doi.org/10.3390/cells9051082