Article

NOTO Transcription Factor Directs Human Induced Pluripotent Stem Cell-Derived Mesendoderm Progenitors to a Notochordal Fate

1
INSERM UMR 1229, RMeS, Université de Nantes, ONIRIS, F-44042 Nantes, France
2
CHU Nantes, PHU 4 OTONN, F-44042 Nantes, France
3
Nantes Université, CHU Nantes, INSERM, CNRS, SFR Santé, FED 4203, Inserm UMS 016, CNRS UMS 3556, F-44042 Nantes, France
4
Nantes Université, CHU Nantes, INSERM, CRTI, UMR 1064, ITUN, F-44042 Nantes, France
5
CHU Nantes, Pharmacie Centrale, PHU 11, F-44042 Nantes, France
*
Author to whom correspondence should be addressed.
Co-senior author.
Cells 2020, 9(2), 509; https://doi.org/10.3390/cells9020509
Submission received: 3 January 2020 / Revised: 18 February 2020 / Accepted: 19 February 2020 / Published: 24 February 2020

Abstract

:
The founder cells of the Nucleus pulposus, the centre of the intervertebral disc, originate in the embryonic notochord. After birth, mature notochordal cells (NC) are identified as key regulators of disc homeostasis. Better understanding of their biology has great potential in delaying the onset of disc degeneration or as a regenerative-cell source for disc repair. Using human pluripotent stem cells, we developed a two-step method to generate a stable NC-like population with a distinct molecular signature. Time-course analysis of lineage-specific markers shows that WNT pathway activation and transfection of the notochord-related transcription factor NOTO are sufficient to induce high levels of mesendoderm progenitors and favour their commitment toward the notochordal lineage instead of paraxial and lateral mesodermal or endodermal lineages. This study results in the identification of NOTO-regulated genes including some that are found expressed in human healthy disc tissue and highlights NOTO function in coordinating the gene network to human notochord differentiation.

1. Introduction

The intervertebral disc (IVD) is a fibrocartilaginous joint composed of a hydrated gel-like central part, the nucleus pulposus (NP), where large vacuolated notochordal cells (NC) and chondrocyte-like cells (CLC) reside [1,2]. The mature NC population has been well identified as a key regulator of disc homeostasis [3,4,5]. Indeed, around the age of skeletal maturity, the loss of NC followed by the decline of CLC viability is a primary event leading to degenerative disc disease (DDD) [6]. This condition results in impaired biomechanical functions of the IVD and causes low back pain. Current treatment strategies focus on pain management or surgical intervention with limited efficacy. The lack of disease-modifying therapeutics for DDD is linked to our limited understanding of the cellular and molecular mechanisms that regulate IVD development, maturation and health. In the past decade, studies have demonstrated that NC-secreted factors exert significant regenerative effects on human CLC derived from degenerated IVD by promoting anabolic activities and NP-like matrix synthesis [7,8,9,10,11]. The limited availability of resident NC cells and the difficulty of maintaining them in vitro make the use of pluripotent stem cells (PSC) an attractive alternative cell-based strategy for disc repair [12,13]. Lineage tracing studies in mouse model demonstrated that the founder cells of the NP originate in the embryonic notochord [14,15]. The notochord, or axial mesoderm, is a transient signalling structure involved in the regionalization of adjacent embryonic tissues such as the neural tube, the gut and its derivatives, and the paraxial mesoderm forming the somites [16]. Through secretion of SHH and NOGGIN, the notochord induces the migration and differentiation of the somite-derived sclerotomal cells to form the spine with alternating vertebrae and annulus fibrosus (IVD fibrous peripheral part). During organogenesis, NC accumulate and persist solely in the presumptive intervertebral region to form the NP [17,18].
Only one study has reported mouse embryonic stem cell differentiation into notochord-like cells (NLC) [19]. Several previous studies reported the production of NP-like cells by directing human induced PSC (hiPSCs) toward notochordal differentiation [20,21]. However, a thorough lineage monitoring will be required to ascertain the hiPSCs commitment to axial mesoderm/notochord lineage, rather than to the paraxial mesoderm/somitic lineage at the onset of musculoskeletal tissues formation [22,23]. Such a limitation highlights the need for optimized methodologies to generate human NLC for further investigations of its biology and for future potential clinical translation.
Fate-mapping, genetic and transcriptomic studies have demonstrated that axial mesoderm is distinct from the pan-mesoderm as it descends from the node/organizer region and expresses specific sets of genes [24,25,26,27]. In the mouse embryo, the onset of notochordal lineage is controlled by the transcription factors Brachyury (T) and Foxa2. Both factors are required for the expression of the notochordal transcription factor Noto [28,29,30]. Although the invalidation of the Noto gene results in moderate defects in node and posterior notochord formation, cell-tracking study in the mouse embryo demonstrates its pivotal role in the maintenance of notochordal identity [31,32]. Indeed, in the absence of NOTO, mutant axial mesoderm cells are found mis-located in the paraxial/somitic mesoderm and downregulate T and Foxa2 expression [33]. In human, NOTO expression pattern and function has not been elucidated [34].
Basic knowledge from the mouse model was used as a general framework in this study to investigate how WNT, ACTIVIN/NODAL, FGF and SHH signalling pathways drive hiPSCs differentiation into the notochordal lineage. Developmental paths and differentiation outcomes (endoderm, paraxial and lateral mesoderm, and axial mesoderm/notochord lineages) were characterized at RNA and protein levels using lineage specific markers. By providing NOTO mRNA, we demonstrated that hiPSCs differentiate towards a phenotypically stable NLC population, and remarkably express markers found in human healthy disc tissue. This study reports the identification of the whole transcriptomic signature of human NLC.

2. Materials and Methods

2.1. Reprogramming, Validation and Culture of Human Induced Pluripotent Stem Cells

Human iPSCs were generated from dermal fibroblasts and had normal karyotypes, no gain of SNP compared to parental fibroblasts. Pluripotency was assessed by teratoma formation and trilineage differentiation [35]. Human iPSCs lines used in this study were LON71-002, LON71-019 and PB174-005 and were maintained on matrigel-coated plates with mTeSR1 medium from 25 up to 40 passages. Gentle TryplE enzymatic digestion was performed twice a week for hiPSCs expansion.

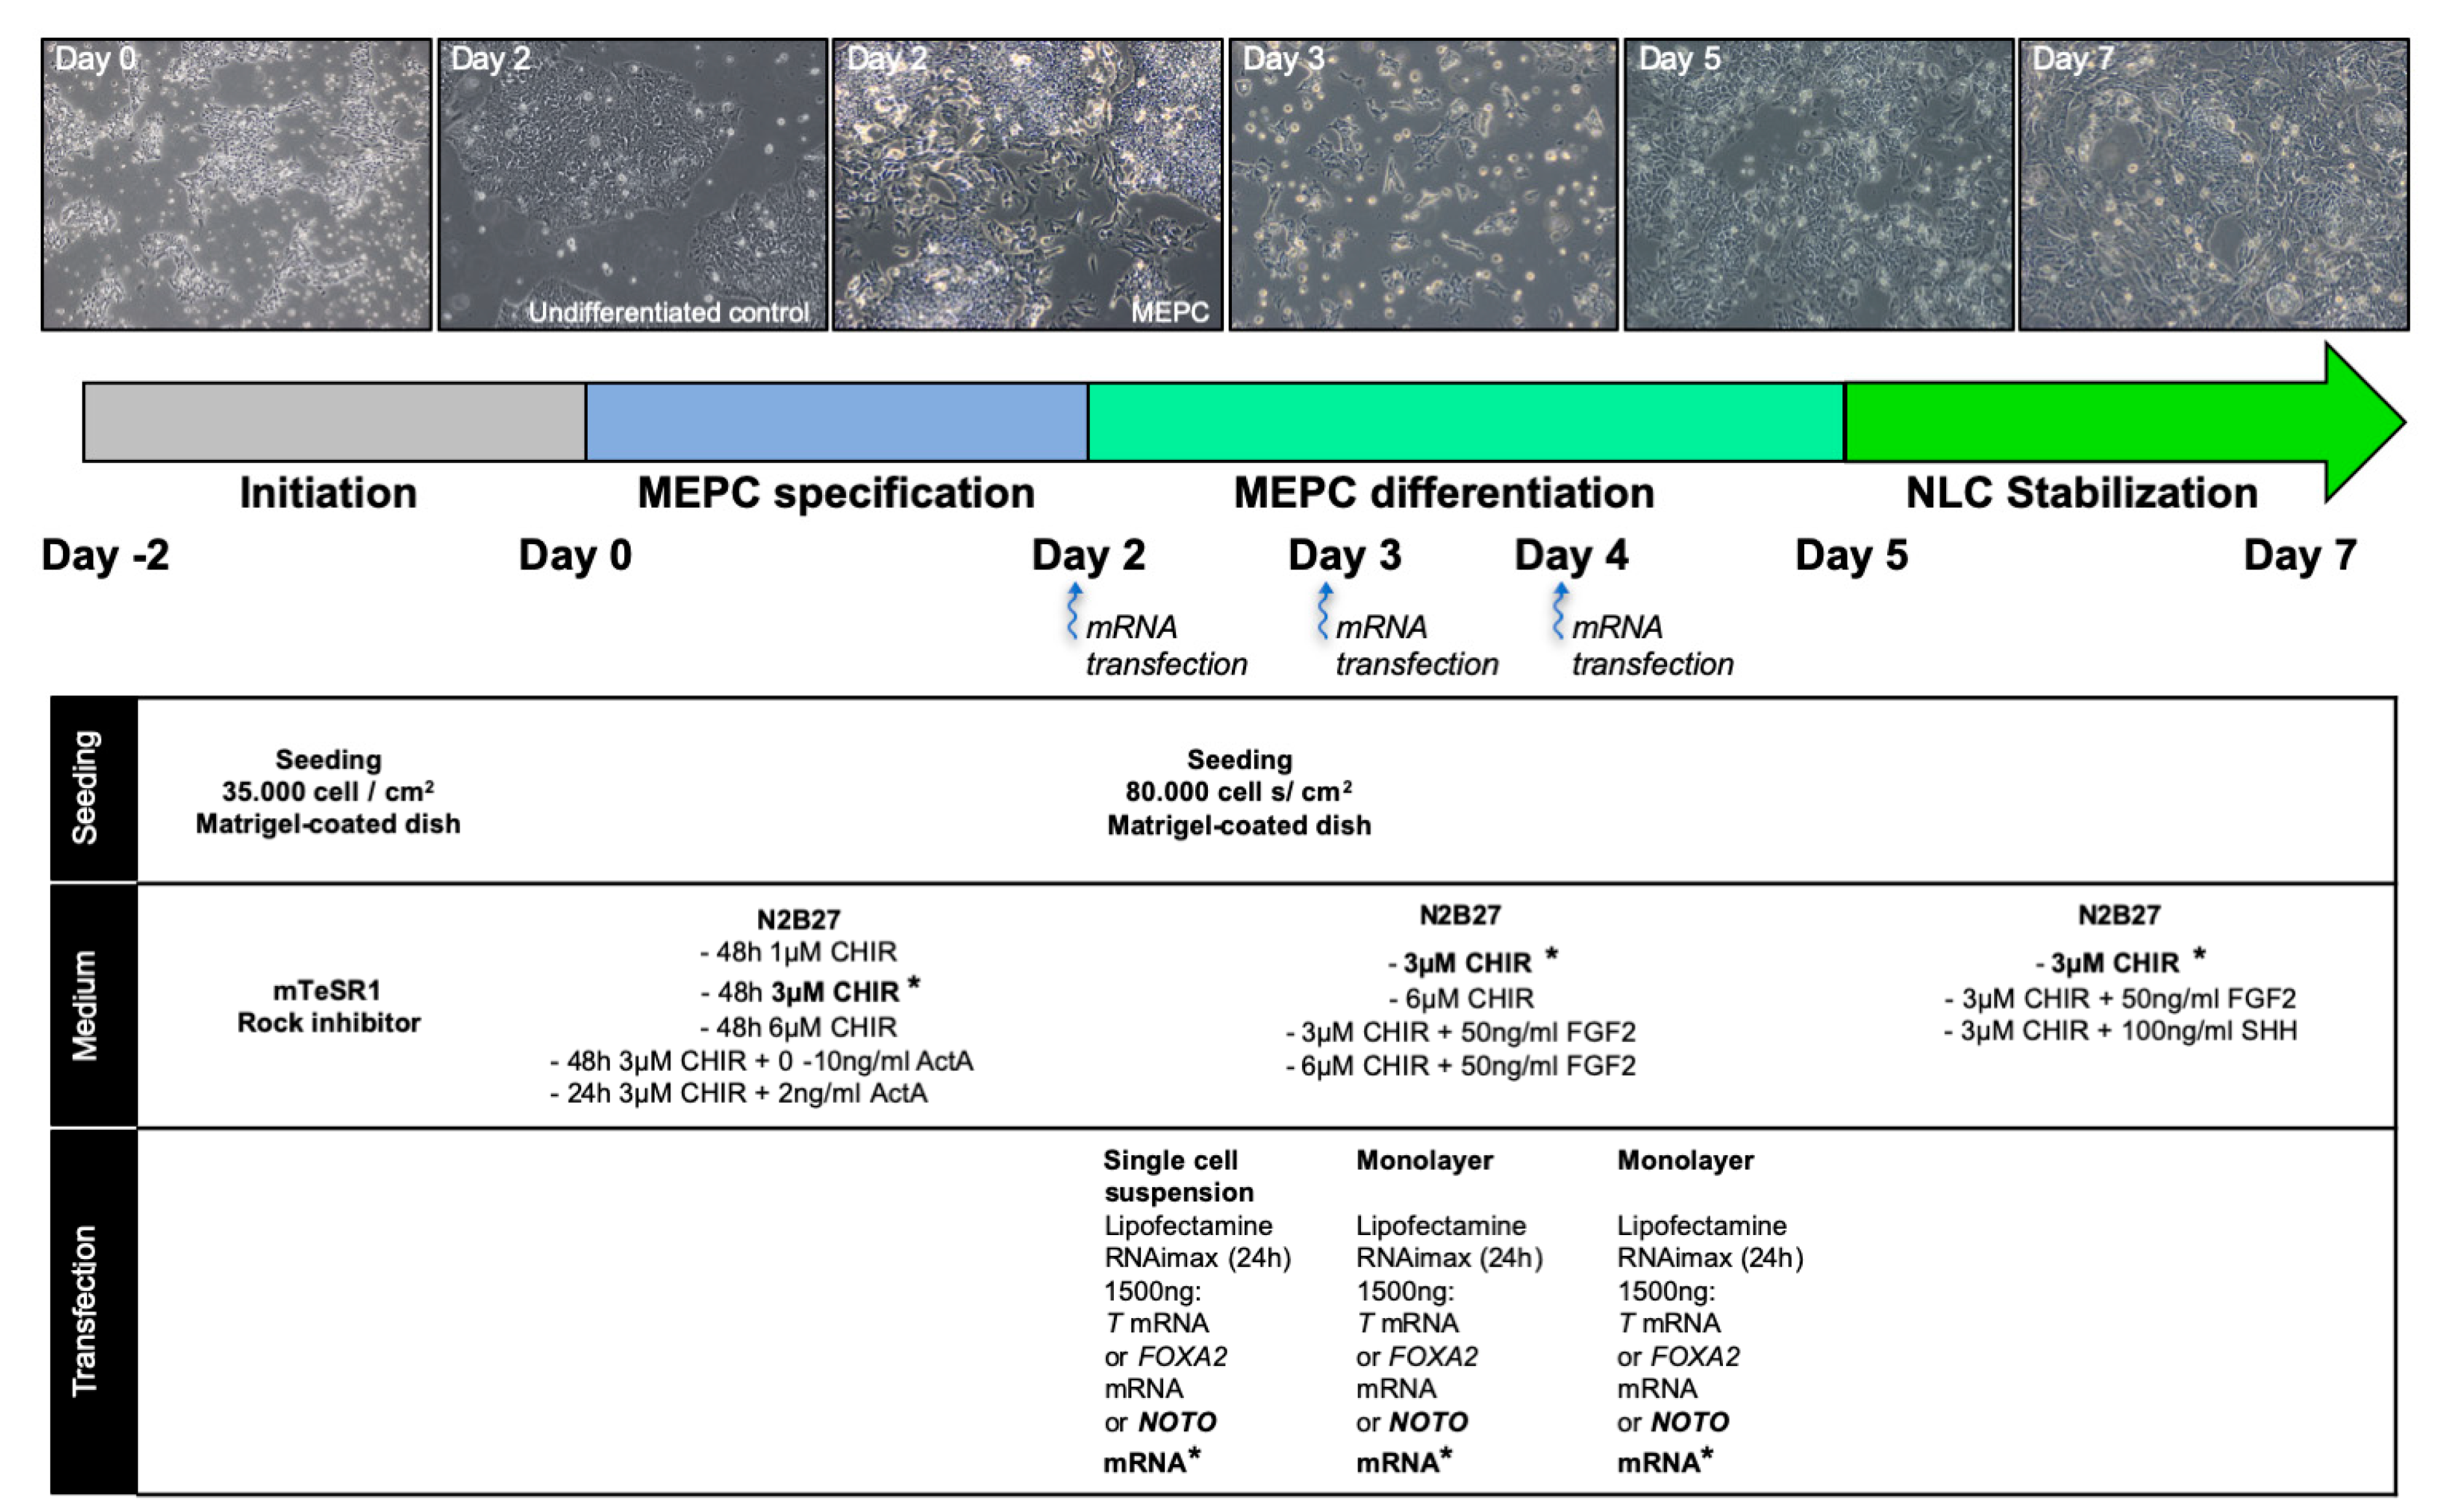
2.2. Differentiation of Human Induced Pluripotent Stem Cells

For differentiation, hiPSCs were stimulated with CHIR99021 (CHIR) and/or Activin A (ActA) in a N2B27 medium. After 2 days of stimulation, cells were transfected for 3 consecutive days with synthetic mRNA encoding for T, FOXA2 or NOTO. Differentiated cells were maintained in N2B27 supplemented with CHIR, and FGF2 or SHH factors. Detailed experimental procedures and the list of reagents are provided in Figure 1 and Table S1 (List of reagents used for hiPSCs culture and differentiation).

2.3. RNA Extraction and RT-qPCR

One microgram of total RNA extracted with the Nucleospin II RNA Kit (740955, Macherey Nagel) was reverse transcribed using SuperScript III First Strand synthesis kit (11752, Life technologies, Carlsbad, CA, USA). Quantitative RT-PCR experiments were performed using TaqMan technology and fold change represented using a base 2 logarithm determined by the Livak Method (Relative quantification RQ = 2^−ΔΔCq) [36]. Endogenous T, FOXA2 and NOTO transcripts were measured by SybR green technology. Taqman and primers used are listed in Table S2 (List of Taqman Assays and Primer sequences for RT-qPCR analysis by SYBR GREEN technology).

2.4. Immunostainings

Cells were fixed with 4% paraformaldehyde for 15 min, following by a permeabilization step and then blocked in 3% bovine serum albumin for 30 min. Immunostaining conditions for FOXA2, T, SOX9 and SOX17 are detailed in Table S3 (Antibodies and dilutions used for Immunofluorescence experiments). Nuclei were then counterstained with Hoechst (H3569, Life technologies, Carlsbad, CA, USA) before imaging with a confocal microscope A1Rsi (Nikon, Champigny-sur-Marne, France). The percentage of T+/FOXA2+, T+/SOX9+ or FOXA2+/SOX17+ double positive cells was defined using Volocity® software version 6.0.0.

2.5. cDNA Libraries, 3′ Digital Gene Expression RNA-Sequencing (DGE-seq), and Bioinformatic Analyses

To generate 3′-DGE libraries, Poly(A)+ mRNA were converted to cDNA decorated with universal adapters, sample-specific barcodes and unique molecular identifiers (UMIs) using a template-switching reverse transcriptase [37]. Differential expression analysis has been performed using DESeq2 in R (https://doi.org/10.1186/s13059-014-0550-8). Hierarchical clustering heatmaps were generated by complex heatMaps package in R (https://doi.org/10.1093/bioinformatics/btw313). Our transcriptomic data were compared to Tsankov et al., datasets (NCBI: GSE17312). Gene Ontology enrichment analyses were performed using Panther database. The raw read sequence data and sample annotations generated in this study are available at the European Nucleotide Archive (ENA) with the accession number PRJEB36475.

2.6. Statistical Analysis

Data are representative of the number of independent experiments as indicated in the figure legend. Mean values ± SEM are calculated when possible. As a consequence of the high number of experimental conditions and time points, no adequate statistical analysis can be provided, except for experiments in Figure 4C. Statistical analysis (2 way Anova test) is shown in Appendix B.

3. Results

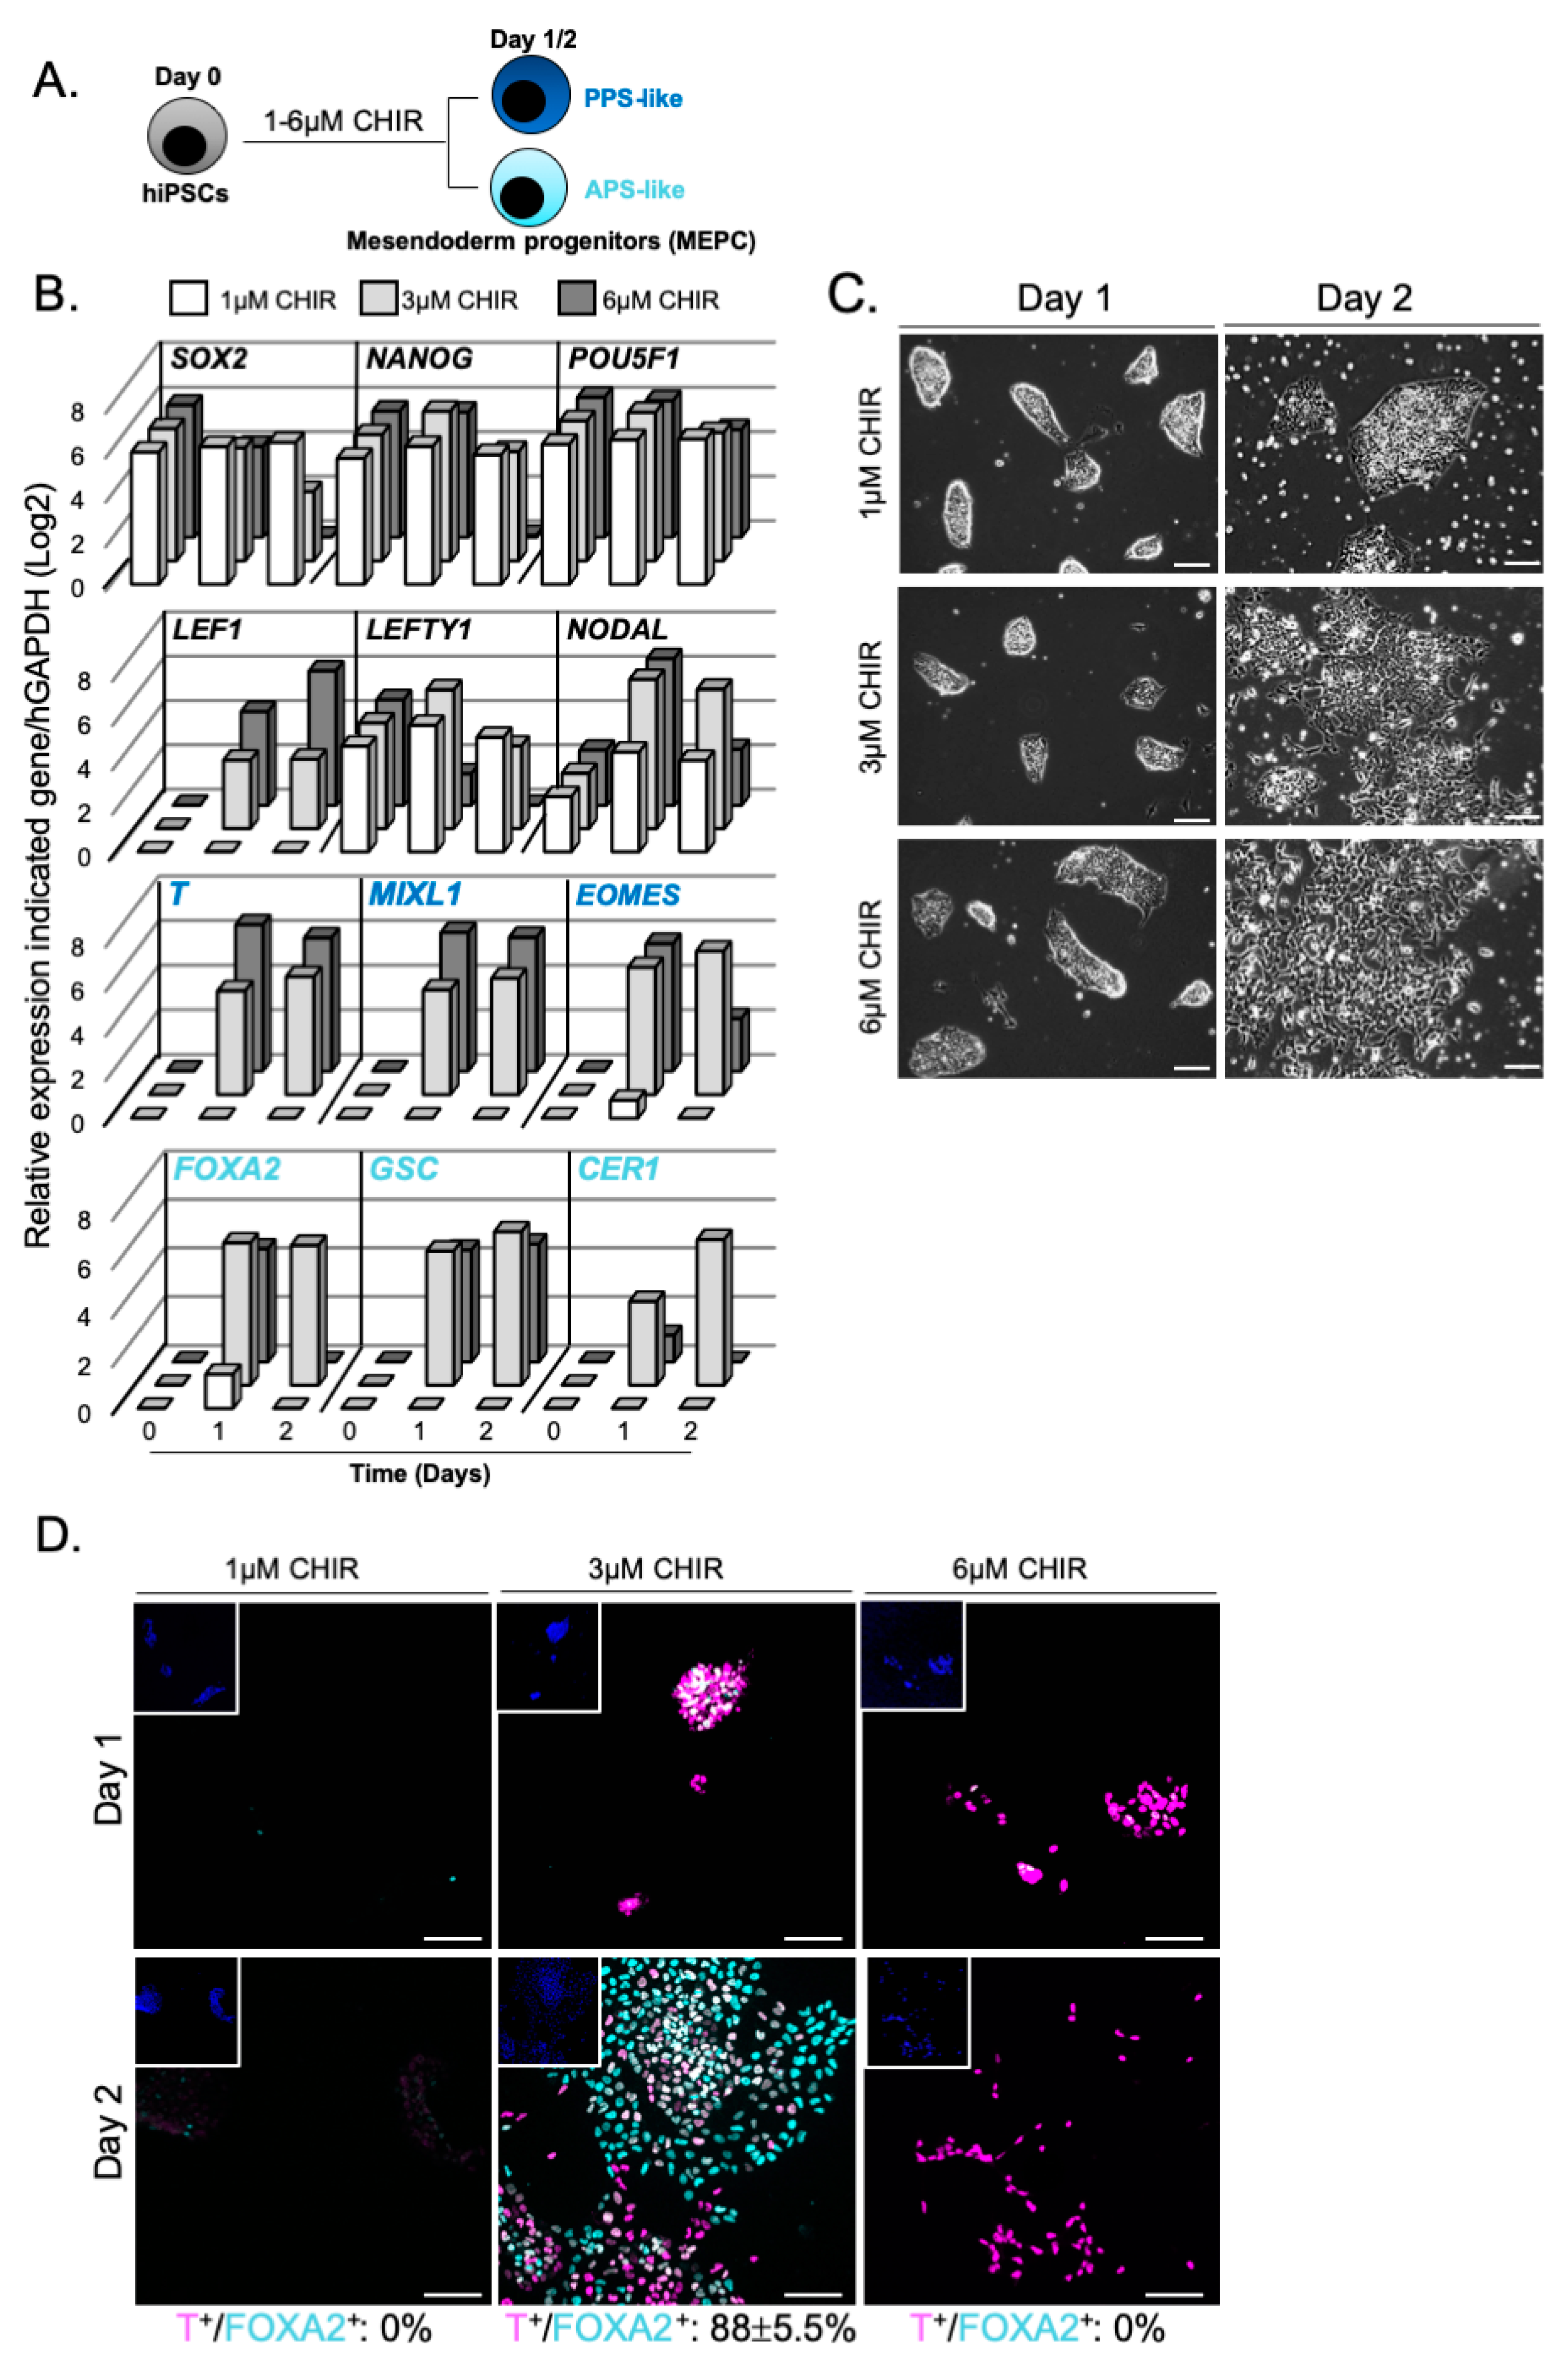
3.1. WNT Activity Induces High Levels of Mesendoderm Progenitors

WNT/β-CATENIN and NODAL/SMAD2/3 signalling are the two main pathways used in vitro to model the induction of the primitive streak (PS) and mimic early developmental events leading the formation of mesoderm and endoderm germ layers [38,39]. We first intended to decipher the contribution of those pathways during hiPSCs differentiation (see schematic workflow of hiPSCs differentiation, Figure 1).
Human iPSCs cultured for 2 days with 3 or 6 µM CHIR (activation of canonical WNT/β-CATENIN signalling via a selective small molecule inhibitor of GSK3) exhibited low level of pluripotency markers, high level of LEF1, NODAL and LEFTY1 transcripts and changes in cell morphology, indicating cell differentiation (Figure 2A–C). No sign of differentiation was observed at 1µM CHIR treatment. Interestingly, hiPSCs stimulated with 3 µM CHIR expressed the PS markers BRACHYURY (T), MIXL1 and EOMES together with high expression of the Anterior PS (APS) markers FOXA2, GSC and CER1 [40]. In contrast, when hiPSCs were treated with 6 µM CHIR, cells acquired a Posterior PS-like (PPS-like) identity revealed by elevated level of T and MIXL1 transcripts and conversely lower levels of NODAL, EOMES, FOXA2 and CER1 [41]. Both conditions resulted in mostly T immunopositive cells indicating an early PS-like identity at day 1 (Figure 2D). At day 2, 3 µM CHIR treatment induced 88% ± 5.5% of T+/FOXA2+ immunostained mesendoderm progenitors whereas 6 µM CHIR triggered commitment towards mesoderm progenitors with 95% ± 2.5% of T+/FOXA2- cells (Figure 2D).
We next investigated the differentiation outcome of hiPSCs treated with 3 µM CHIR supplemented with increasing doses of Activin A (ActA) (Figure 3A). No change in expression of LEF1 and NODAL was observed at day 1. At day 2, the down-regulation of NODAL and LEFTY expression indicated the activation of the negative feedback loop of NODAL/SMAD2/3 signalling (Figure 3B) [42,43]. FOXA2 and CER1 expression increased upon treatment with 10 ng/mL ActA, consistent with the role of ACTIVIN/NODAL in endoderm specification. No apparent effect in pluripotency status or cell morphology occurred with the addition of ActA (Figure 3B,C). Remarkably, while cells were predominantly positive for T immunostaining at day 1 (Figure 3D), T+/FOXA2+ mesendoderm progenitor cells was reduced from 65% ± 1.5% to 53% ± 8% with increasing doses of ActA at day 2 (Figure 3D). Altogether, these results showed that CHIR acts as potent inducer of mesendoderm progenitors in the hiPSCs model. The addition of ActA in the differentiation medium led to a decrease of these progenitors.

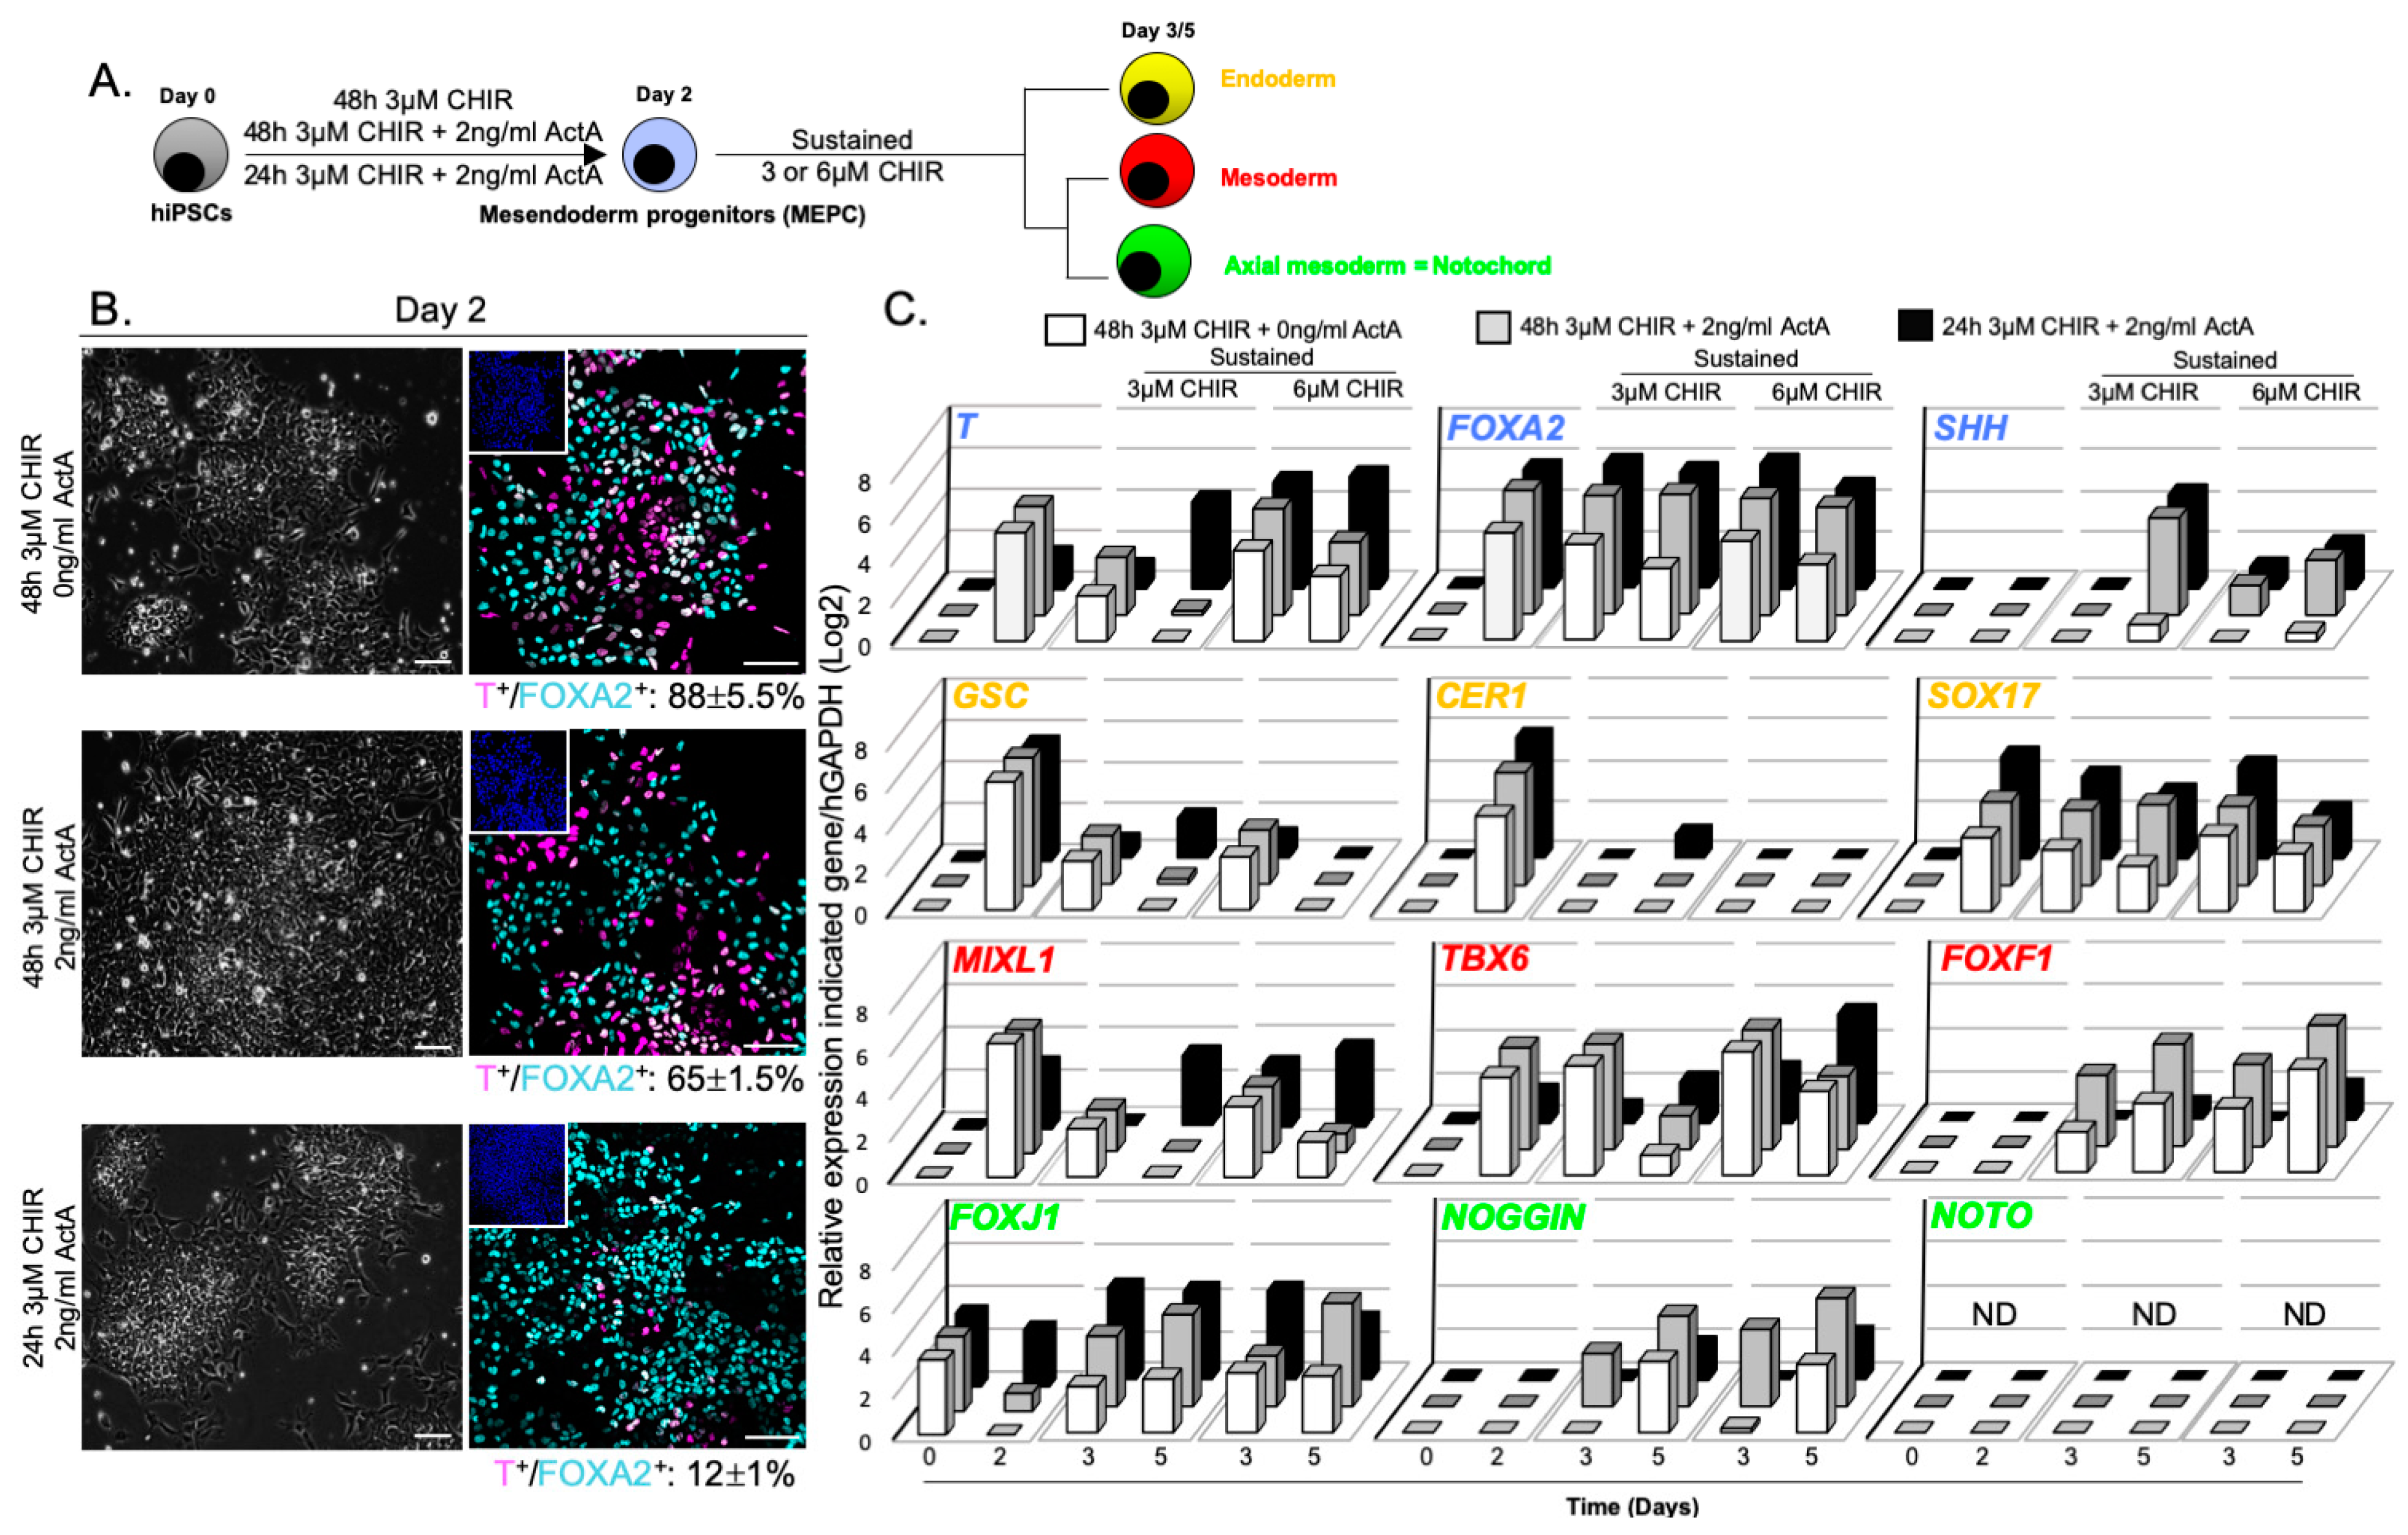
3.2. WNT and ACTIVIN/NODAL Activities Induces Mesendoderm Progenitors with Distinct Lineage Competencies

To evaluate the ability of hiPSC-derived mesendoderm progenitor cells (MEPC) to generate notochordal lineage, we treated hiPSCs with 3 µM CHIR, stimulated 1 or 2 days with or without 2 ng/mL of ActA (Figure 4A). Immunostaining quantification revealed that the optimal strategy was 3 µM CHIR stimulation for 2 days (88% ± 5.5% MEPC) compared to 3 µM CHIR + 2 ng/mL ActA for 1 or 2 days (12% ± 1% and 65% ± 1.5% MEPC, respectively; Figure 4B). Cells were further cultured for 3 days with sustained 3 or 6 µM CHIR, to mimic the function of WNT signalling in the maintenance of notochordal fate during mouse axis elongation [44,45,46]. Gene expression analysis showed that MEPC sustained with 6 µM CHIR differentiated towards mesoderm lineages as demonstrated by higher expression of MIXL1, TBX6 and FOXF1 (Figure 4C). In contrast, FOXA2, T, SHH, FOXJ1 and NOGGIN transcripts were detected when MEPC were cultured further with 3 µM CHIR. Interestingly, FOXA2, T, SHH, FOXJ1 and NOGGIN transcripts were also detected when cells were co-stimulated with CHIR and ActA. However, ActA supplementation at the beginning of the differentiation protocol correlated with greater endoderm specification as shown by increased FOXA2 and SOX17 expression. Altogether, these results refine our understanding of the respective influence of both WNT and ACTIVIN/NODAL signalling on lineage specification: ACTIVIN/NODAL activity directs MEPC differentiation towards endoderm fate rather than mesoderm fate, while mesoderm fate is promoted by high WNT activity.
In mouse, NOTO gene expression delineates organizer regions where axial mesoderm progenitors are found. Later, Noto marks node-derived posterior axial mesoderm/notochord until early organogenesis. Remarkably, the absence of axial mesoderm/notochord progenitors and progenies at day 5, as demonstrated by the lack of NOTO expression and T+/FOXA2+ cells (data not shown), indicates that MEPC did not differentiate toward notochord lineage in any condition analysed. This result suggests that neither the combined activation of both pathways, nor the continuous activation of WNT pathway, is sufficient to sustain notochordal fate. Based on these findings, and to circumvent definitive endoderm differentiation, hiPSCs were treated with 3 µM CHIR to generate high levels of MEPCs for the remainder of the study.

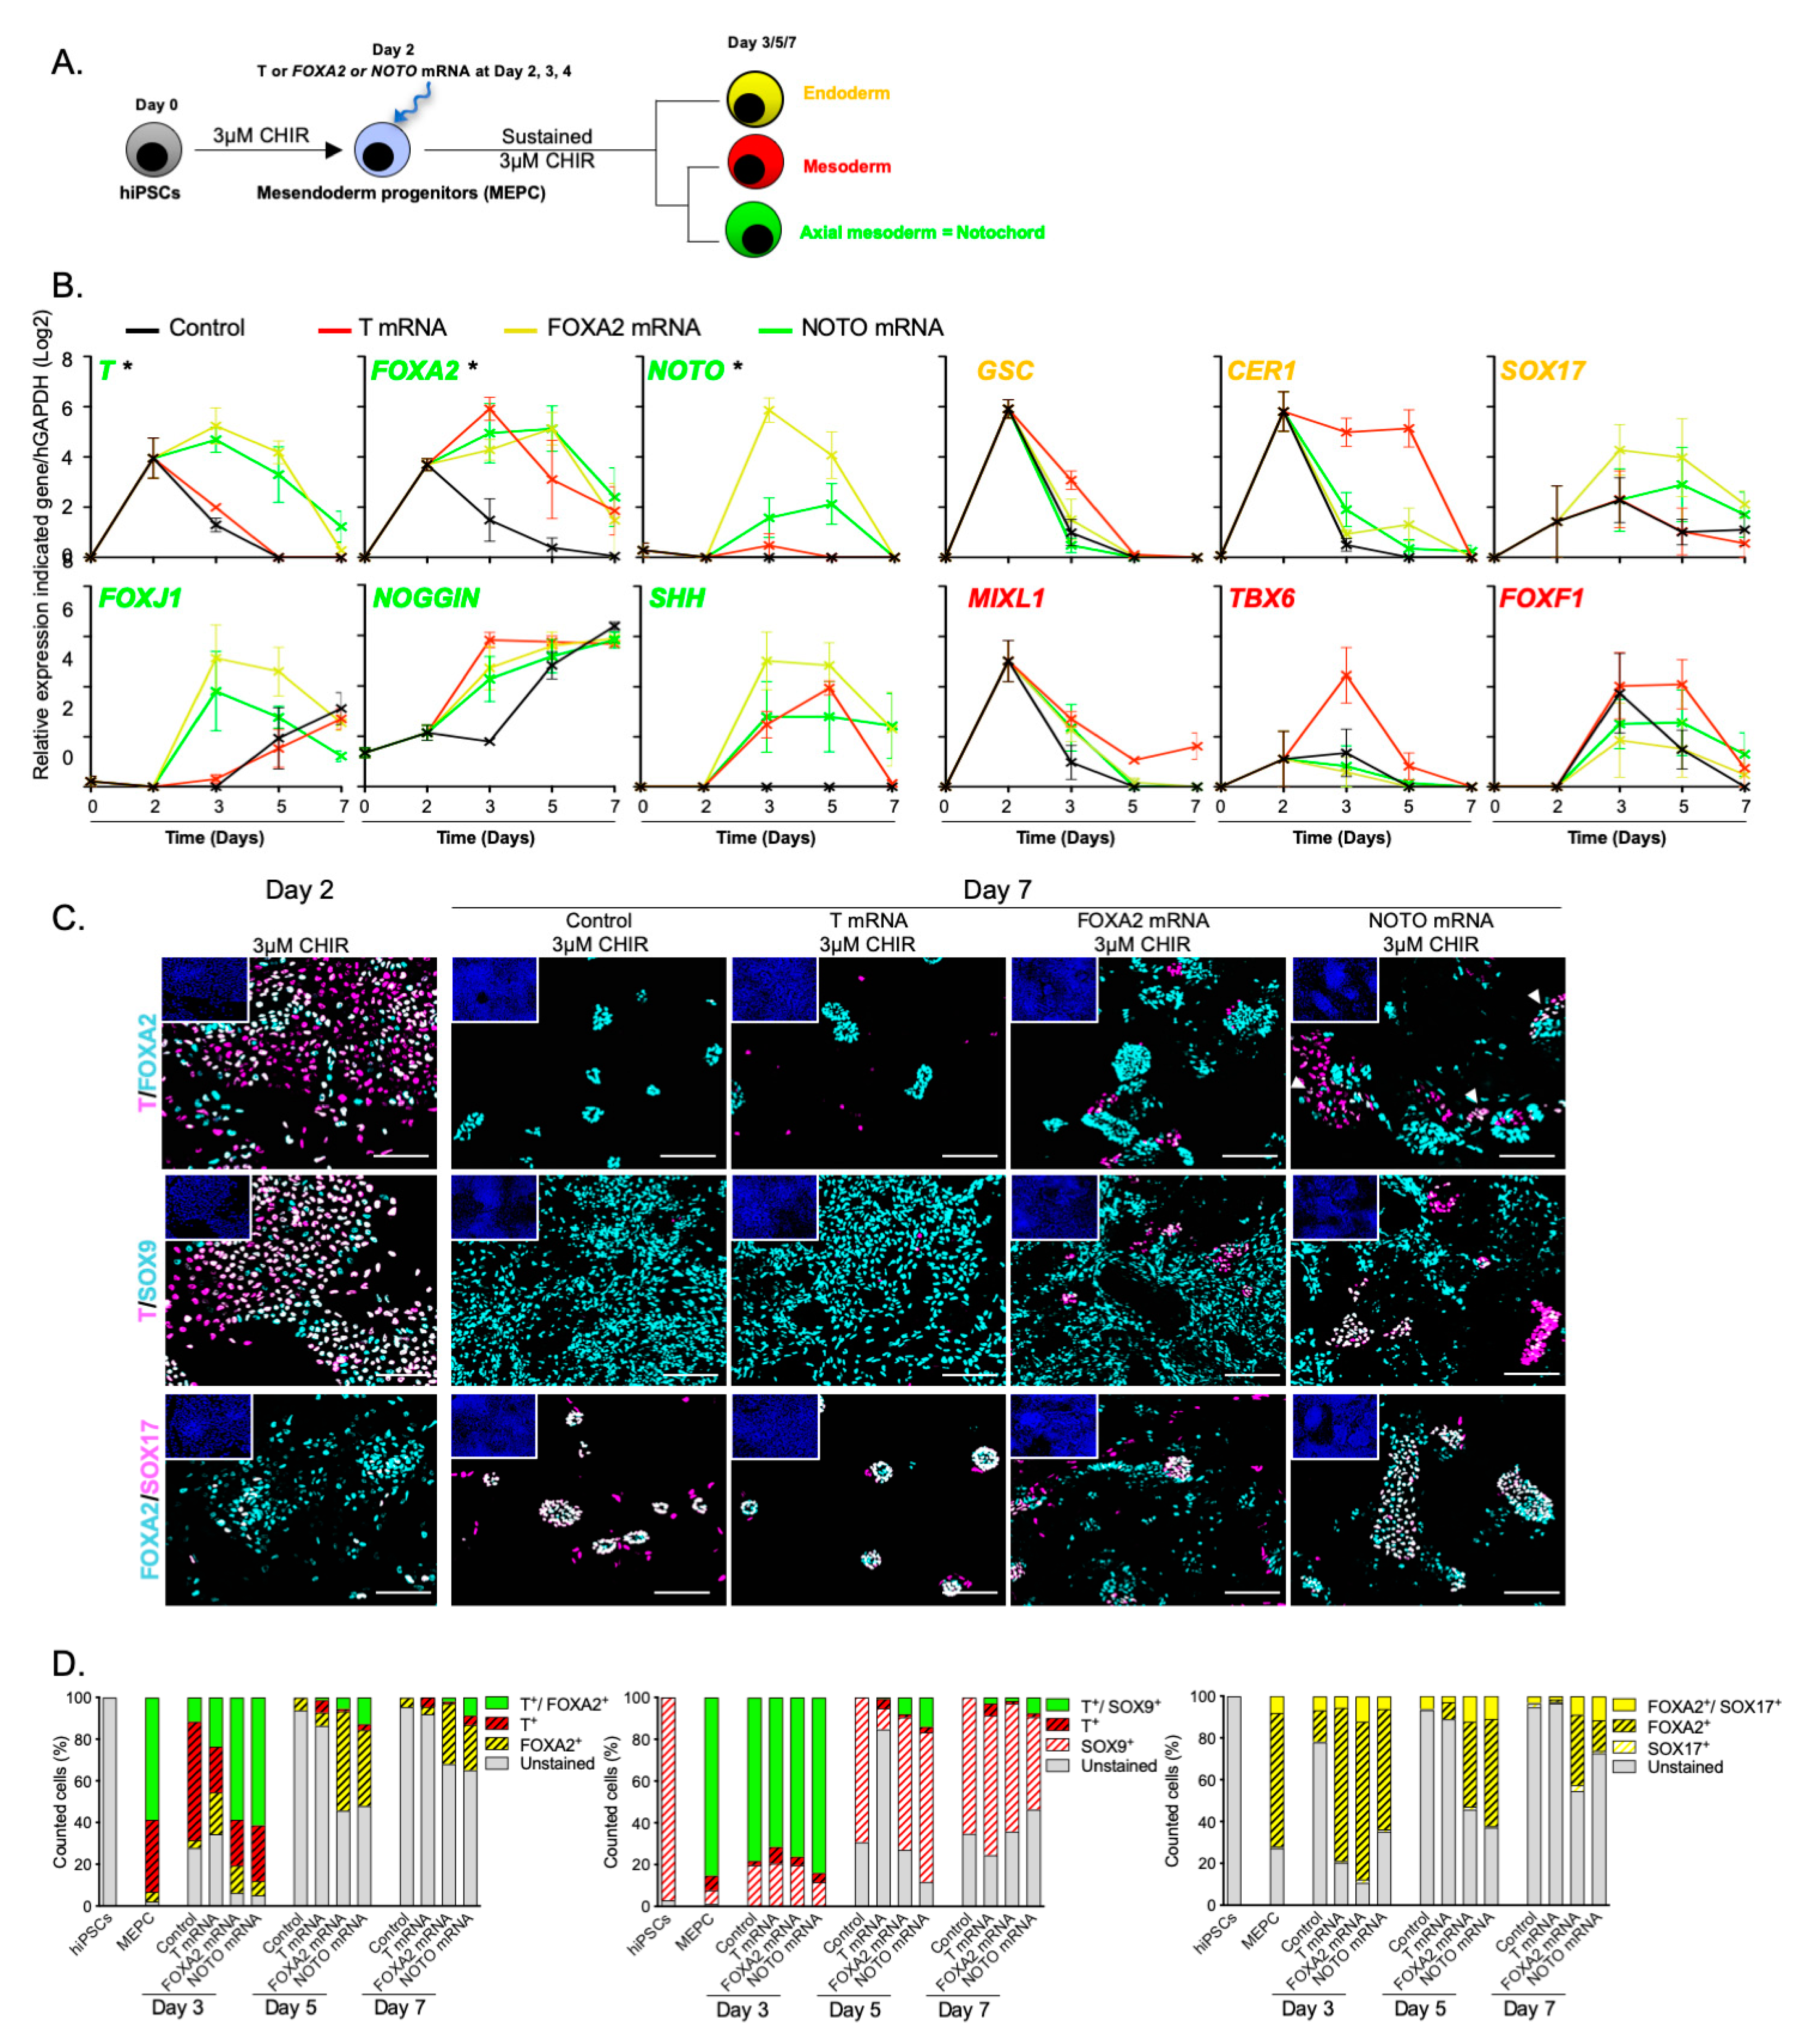
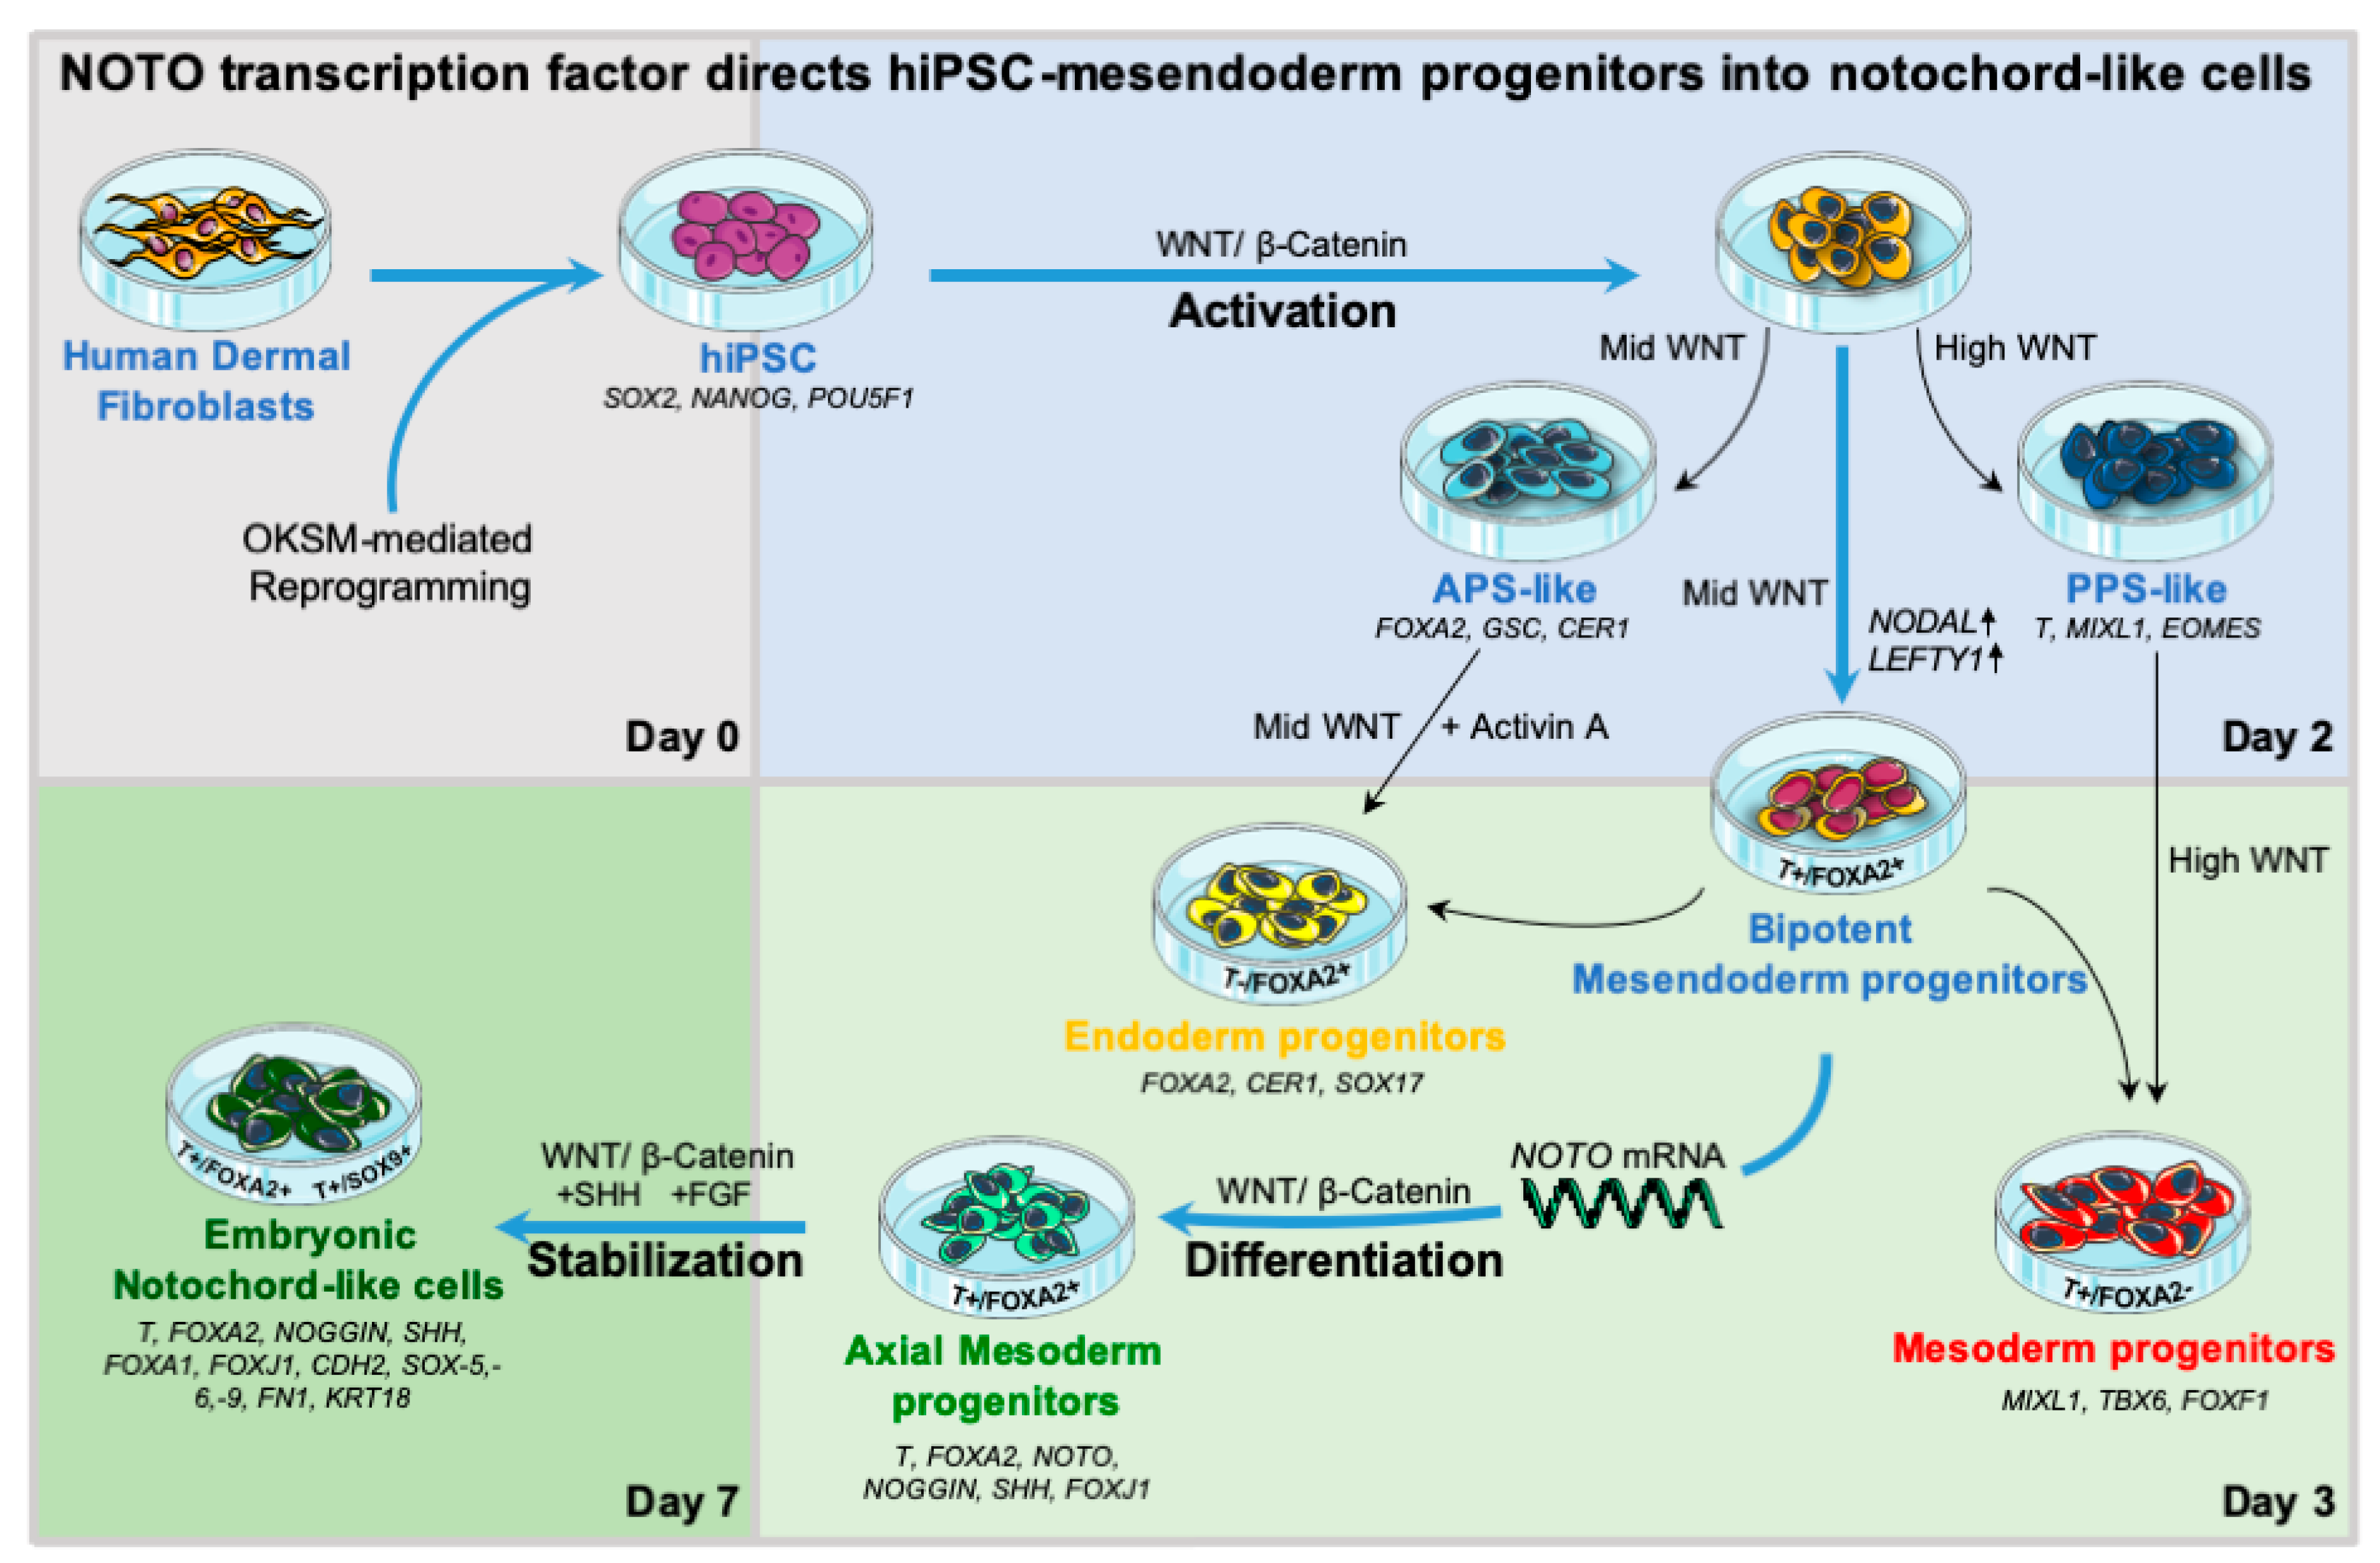
3.3. NOTO Transcription Factor Triggers MEPC Commitment toward Notochordal Fate

The early loss of T+/FOXA2+ cells during the course of hiPSCs differentiation argues against the presence of NLC. We thus investigated whether forced expression of T, FOXA2 or NOTO factors could trigger the commitment of MEPC toward notochordal fate. Synthetic mRNAs encoding for T, FOXA2 and NOTO were independently transfected daily from day 2 to day 4 in MEPC maintained in 3 µM CHIR (Figure 5A). The time-course analysis of lineage specific markers revealed three distinct differentiation outcomes, with T transfection leading to an increase in paraxial and lateral mesoderm markers (MIXL1, TBX6 and FOXF1), while FOXA2 or NOTO transfection resulted in a significant increase in axial mesoderm markers (T, FOXA2, NOTO, and SHH; Figure 5B). The presence of T+/FOXA2+ cells at day 7, when NOTO was transfected only, confirmed the presence of NLC (6.6%, Figure 5C,D and Figure S1—Immunostaining at day 3 and day 5 in T-, FOXA2-, and NOTO- transfected cells). In the course of the notochordal maturation process, we expected based on the mouse embryonic studies, a down-regulation of immature markers FOXA2 and NOTO and conversely, an up-regulation of the transcription factors SOX-5, -6 and -9 as a consequence of the activation of SHH signalling [47,48,49,50]. These SOX- gene markers are detected both in NC and somite-derived sclerotomal cells. In order to discriminate between these two cell-types, we performed co-immunostaining analysis. The results confirmed the presence of T+/SOX9+ NLC up to day 7 when NOTO was transfected (7.6%, Figure 5C,D and Figure S1). In the course of hiPSCs differentiation, FOXA2+ is also indicative of the presence of nascent definitive endoderm cells, which co-express SOX17 at early stages [51,52]. Consistent with our RT-qPCR results, FOXA2-transfected cells had a propensity to differentiate into definitive endoderm cells as compared to those transfected with NOTO (45.6% and 26.2% of FOXA2+/SOX17+ cells at day 7 respectively; Figure 5C,D and Figure S1). Altogether the results support the hypothesis that amongst all three transcription factors transfected, NOTO directs the commitment of MEPC toward notochordal lineage.

3.4. NOTO mRNA Transfection and WNT Signalling Activity Are Sufficient to Induce a Stable Notochord Population

In mice, FGF and SHH activities are required for the emergence of different mesoderm subtypes and in the maintenance of the notochordal lineage during embryonic axis elongation [53,54]. Thus, we sought to test the effect of exogenous FGF or SHH on the proportion of stable NLC in the hiPSCs differentiation model. When MEPC were transfected with NOTO mRNA in the presence of 50 ng/mL FGF2 from day 2 to day 5, notochordal markers remained unchanged, except for a slight up-regulation of endogenous T and NOTO, and the proportion of FOXA2+/T+ cells was maintained (Figure 6A–C). In contrast, FGF2 supplementation led to a significant increase in paraxial and lateral mesoderm markers.
Lastly, we investigated the differentiation outcome when FGF2 or SHH was supplemented during the last phase of differentiation (Figure 7A). NOTO mRNA transfection induced high expression of notochord-related markers between day 3 and day 5 and maintenance until day 7, while the expression the endoderm marker SOX17 was down-regulated with time (Figure 7B). Only a slight decrease in T and SHH expression was noticeable from day 5 when FGF2 was added. A similar proportion of T+/FOXA2+ cells were observed in all the NOTO-transfected conditions, whether complemented or not with FGF2 or SHH (Figure 7C). This result indicates that addition of exogenous FGF2 and SHH ligands did not enhance, neither the differentiation of MEPC into NLC nor their maintenance in vitro. NOTO mRNA transfection and sustained WNT signalling activity are sufficient to induce a stable NLC population.
Broader gene expression was analysed to characterize the nature of NLC emerging when NOTO mRNA is transfected. The expression of FGF and SHH pathway target genes SPRY1 and GLI1 respectively were found strongly up-regulated from day 5 in NOTO-transfected cells (Figure 7D). This could account for the small changes observed above in the general expression profile following FGF2 and SHH supplementation. The nascent-mesoderm marker CDH2 and notochordal markers FOXA1 and FN1 were also induced and maintained up to day 7 in MEPC when transfected with NOTO, suggesting similarities between notochordal differentiation in vitro and mouse notochord development. SOX5, SOX6 and SOX9 genes are important regulators of NC survival and chondrogenesis in IVD development by controlling the synthesis of common extracellular matrix component such as AGGRECAN and TYPE II COLLAGEN [47,48]. It should be noted that these markers were detected at relatively higher levels in control compared to NOTO-transfected condition. This result indicated that somite-derived sclerotomal cells differentiation is major in untransfected control. Although KRT18 and CDH2 were strongly induced, cytosolic vacuolar structures typically found in human mature juvenile NC were not observed [55,56,57,58]. In addition, the low expression of CA12 and LGALS3 at day 7 indicated that differentiated NLC maintains an immature/embryonic state.

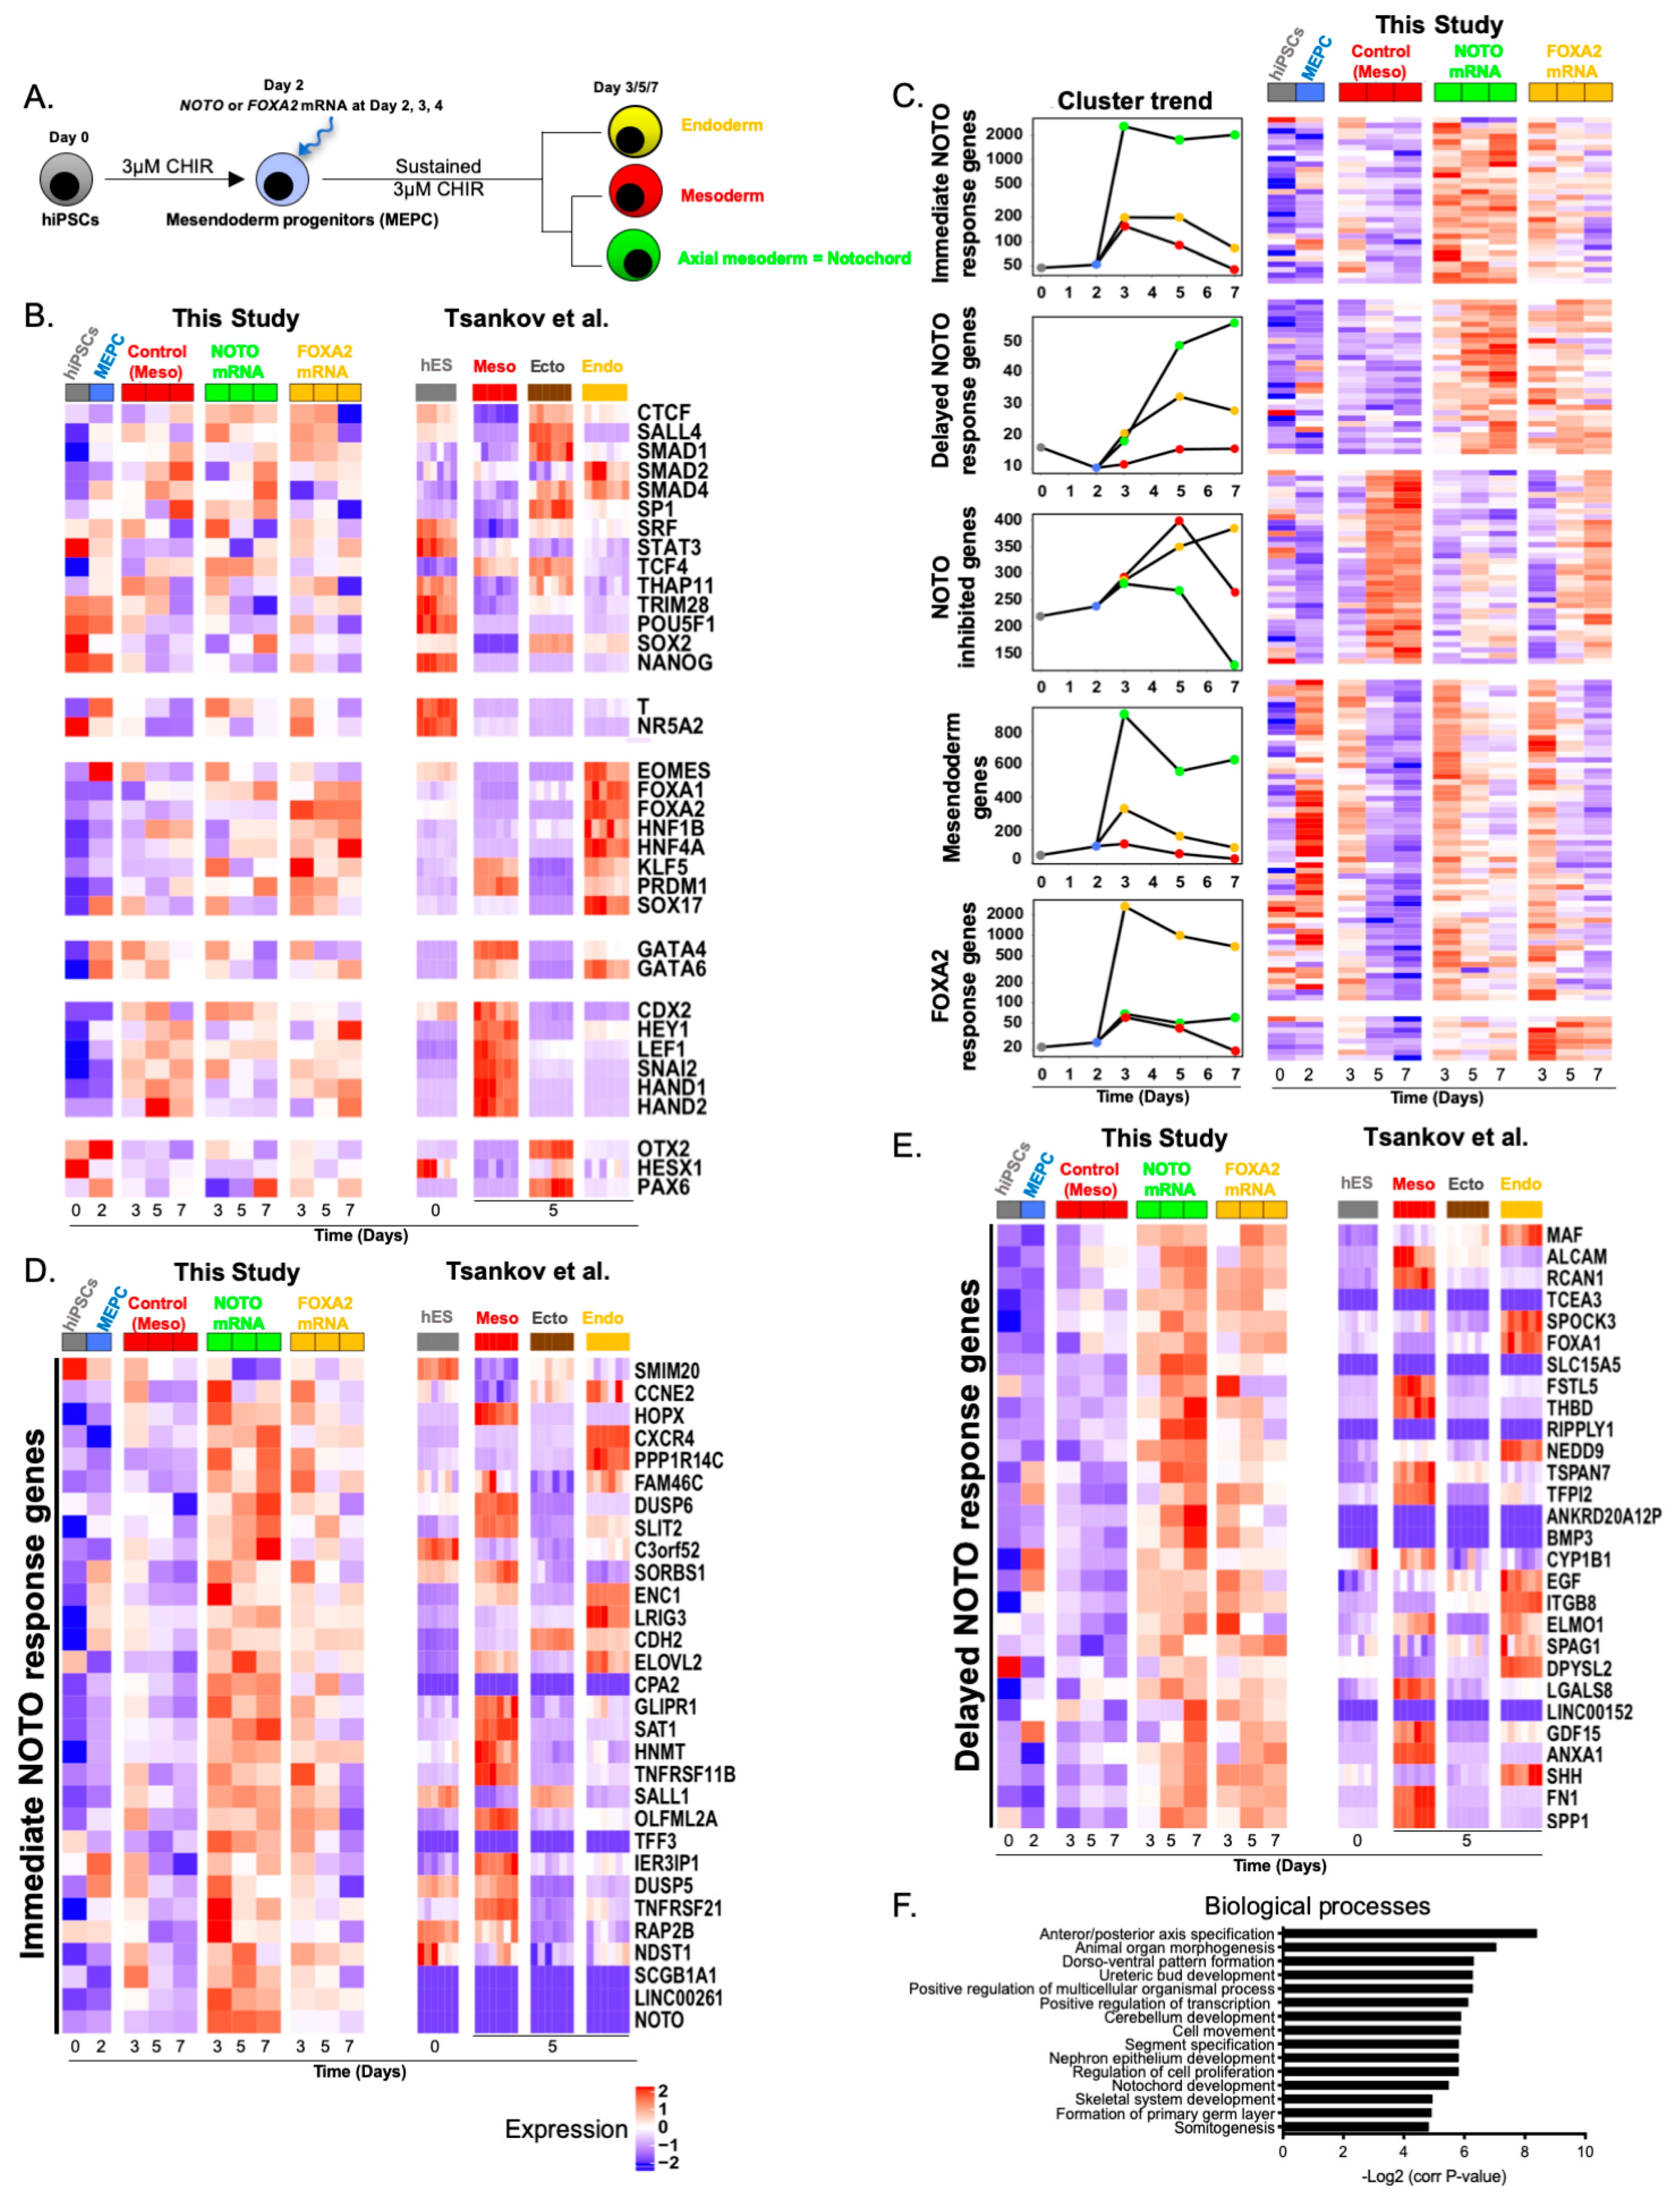
3.5. Molecular Characterization of NOTO- and FOXA2-Directed MEPC Differentiation

RNAseq analysis was performed in order to understand molecular events arising during differentiation following NOTO mRNA transfection in the presence of 3 µM CHIR (Figure 8A). We first assessed expression levels of mesoderm, ectoderm and endoderm markers previously characterised by Tsankov et al. in control, NOTO- and FOXA2- transfected cells [59]. This integrative analysis revealed that the control most resembled mesoderm, FOXA2-transfected condition resembled endoderm but NOTO-transfected cells displayed distinct transcriptomic signature (Figure 8B). Genes differentially expressed between the three conditions: control, NOTO- and FOXA2- transfected cells highlighted five clusters with similar expression trends (Figure 8C): (i) Genes readily induced in NOTO-transfected cells, reaching their maximal expression at day 3 and maintained until day 7 (“Immediate NOTO response genes”, shown Figure 8D), (ii) Genes induced in the NOTO condition, at day 3 but reaching their maximal expression at day 7 (“Delayed NOTO response genes” shown Figure 8E), (iii) Genes inhibited by NOTO (shown in Figure S2B; Details of the transcriptomic cluster presented in Figure 8C), (iv) Mesendoderm-related genes (shown in Figure S2A; Details of the transcriptomic cluster presented in Figure 8C), and (v) Genes induced in FOXA2-transfected cells (“FOXA2 response genes”, shown in Figure S2C; Details of the transcriptomic cluster presented in Figure 8C). Intersection of the NOTO response gene expression profiles with datasets from Tsankov et al., showed that NOTO-transfected cells display a unique signature composed of clusters (i) and (ii), not observed in the three germ layers (Figure 8D,E). Mesendoderm genes were transiently expressed at day 3 in all differentiation conditions, but their prolonged expression was only observed in NOTO-transfected cells (Figure S2A). Some of these genes were distinctively expressed in mesoderm or endoderm cells, but none in ectoderm cells (Figure S2A). Conversely, genes specifically inhibited by NOTO are not expressed in mesendoderm at day 2 but are expressed in one of the three germ layers (Figure S2B), suggesting that NOTO also blocked the commitment toward other germ layers. Our transcriptomic analysis indicates that the overexpression of NOTO during hiPSCs differentiation while maintaining mesendoderm-related genes also prevents cells from differentiating into mesoderm, ectoderm or endoderm layers. Finally, functional enrichment analysis highlighted “anterior/posterior axis specification” and “notochord development” associated with NOTO-transfected cells (Figure 8F), supporting our conclusion that expression of NOTO in MEPC induced notochordal fate. Hence, this transcriptomic analysis provides the first molecular signature of hiPSCs-derived NLC.

4. Discussion

In humans, limited knowledge is available on signalling pathways and gene network orchestrating the formation of the node and notochord [60,61]. Sequential experiments in the present study demonstrate that the differentiation of hiPSCs towards endoderm and mesoderm lineages is effective by modulating WNT, ACTIVIN, and FGF signalling pathways [62,63]. Our results validate the use of CHIR99021 as a potent inducer of hiPSCs differentiation towards mesendoderm progenitors without commitment toward ectodermal/neuroectodermal lineages. The absence of expression of the cardiac markers HAND1 and HAND2 and the lack of beating cells indicated the failure of hiPSCs to form cardiomyocyte-like cells using this differentiation protocol. We show that the use of intermediate concentration of CHIR promotes mesendoderm progenitors with APS-like identity, which is favourable to the emergence of the notochordal lineage. ActA supplemented CHIR treatment severely reduces the proportion of mesendoderm progenitors and then promotes endodermal fate commitment.
BRACHYURY (T) is expressed early in PS and nascent endoderm and mesoderm lineages. From early organogenesis, its expression is restricted to axial mesoderm/notochord lineage and further maintained after birth in NC constituting the NP, the core of the IVD, in mouse and in human [64,65]. In a recent report, T-encoding plasmid transfection was shown to reprogram mildly degenerate human CLC in vitro to a healthy NP-like phenotype with increased expression of key NP markers and significant proteoglycan/glycosaminoglycan accumulation [66]. Another interesting study also used T-encoding plasmid transfection to differentiate hiPSCs toward an NLC phenotype capable of synthesizing a proteoglycan-rich matrix and playing a protective role in the catabolic environment of injury-induced porcine disc model [67]. Previous work has revealed that T genomic targets in differentiating PSC vary based on cellular, developmental and signalling contexts [59,68]. Here, we report that sustained expression of T in mesendoderm progenitors was not sufficient for their further differentiation into NLC, despite SHH and FGF2 supplementation.
Our study provides evidence that amongst all three transcription factors required for axial mesoderm development in mouse, NOTO triggers the commitment of mesendoderm progenitors toward notochordal fate as demonstrated by the upregulation of notochord-associated markers. This study demonstrates that transient expression of NOTO allows mesendoderm progenitors to maintain the lineage-specific expression of the two key notochordal regulatory factors, FOXA2 and T (Figure 9). Our results support the hypothetical model that NOTO confers axial mesoderm stability to the promiscuous state of the bipotent mesendoderm progenitors, preventing differentiation towards the mutually exclusive endoderm and mesoderm fates (Figure 9). NOTO factor may exert its transcriptional activity via the stabilization of FOXA2 and T transcription complexes required to regulate the molecular program of notochord formation. In mouse, this hypothesis is supported by the existence of putative binding sites for FoxA2 or T in notochordal-related gene promoters and by the model of gene regulatory network of node/notochord proposed by Tamplin et al. [25,28,30]. Whether this model is valid for notochordal lineage commitment in human remains to be proved. This model does not exclude the possibility that NOTO interacts with other partners and that this diversity of interaction enables axial mesoderm/notochord fate specification. Remarkably, NOTO mRNA transfection in MEPC resulted in a significant increase of endogenous NOTO gene expression. Several reports in the literature provided evidence that Noto activates or represses its own expression depending on the context. Data from the zebrafish model showed downregulation of flh expression (Noto homolog) in flhn1 mutants suggesting that flh positively regulates its own expression [69]. In the mouse model, the loss of Noto function resulted in persistent Noto expression in anterior region of the embryo suggesting that Noto is required for its own repression [31]. FOXA2 mRNA transfection in MEPC also resulted in an increase of endogenous NOTO gene expression. Several binding sites for FOXA2 transcription factor are found in the NOCE (Node and nascent notOChord Enhancer) within the ci-regulatory region of the murine Noto gene [29]. Although a pivotal role of FOXA2 for the activation of other identified notochord enhancers has been described [28,70], in the case of the Noto gene, it is more likely that FOXA2 acts cooperatively with other factors to activate the NOCE enhancer [29]. Note that NOCE contains a HOX binding site suggesting the possibility that NOTO regulates its own transcription. These positive feedback loops involving several transcriptional regulators that reinforce expression of specific lineage markers may participate to the stabilization of the notochordal identity. Whether the regulation of the human NOTO gene is mediated directly by these transcription factors remained to be addressed in order to understand gene regulatory networks that control human notochord development.
Further refinement of the culture conditions is required to exclude the commitment to alternative cell fates. Variation in the differentiation outcome can be explained by cells’ response to endogenous/paracrine signalling. Further investigations of NLC by single cell RNAseq will allow us to decipher specific regulatory networks driving notochord fate specification in humans. In the future, 3D culture will be investigated and ultimately with the use of material with biophysical properties. This may optimize notochordal differentiation efficiency and be supportive of NLC maintenance, particularly with extended culture duration, as well as maturation toward an adult NLC phenotype.
Our method achieves an essential step and lays the groundwork for future studies in generating therapeutically useful hiPSC-derived cells for IVD regeneration. NLC production will allow further study on their biology and NC-associated secreted regulatory molecules to pave the way for the characterization of essential players for healthy disc maintenance.

Supplementary Materials

The following are available online at https://www.mdpi.com/2073-4409/9/2/509/s1, Figure S1: Immunostaining at day 3 and day 5 in T-, FOXA2-, and NOTO- transfected cells, Figure S2: Details of the transcriptomic cluster presented in Figure 8C, Table S1: List of reagents used for hiPSCs culture and differentiation; Table S2: List of Taqman Assays and Primer sequences for RT-qPCR analysis by SYBR GREEN technology, Table S3: Antibodies and dilutions used for Immunofluorescence experiments.

Author Contributions

Conceptualization P.C., A.C. and L.D.; methodology, P.C., B.H., C.C. (Claire Chédeville), C.C.(Caroline Chariau), V.F.-C., S.K. and N.V.; formal analysis, A.C., P.C., and L.D.; writing—original draft preparation, A.C. with help of P.C. and L.D.; review and editing of the manuscript, A.C., N.V., J.C., and J.G.; supervision, A.C.; funding acquisition, J.G., A.C. and L.D. All authors have read and agreed to the published version of the manuscript.

Funding

This research was funded by INSERM and by grants from ANR 2014 (REMEDIV), the FRM (Bioingenierie), the AO Foundation (S-12-14G), the Region Pays de la Loire (BIODIV and RFI BIOREGATE-CAVEODISC) and Arthritis Foundation (NOTOCH). P.C. was supported by doctoral grant from AXA Research Fund and N.V. by the European Union’s Horizon 2020 research and innovation programme under grant agreement no. 825925.

Acknowledgments

The authors would like to thank A. Henry for experimental contributions, L. Lescaudron for discussions, M. Tryfonidou for critical reading of the manuscript, Cellular and Tissular Imaging Core Facility of Nantes University (MicroPICell) staff for excellent technical assistance.

Conflicts of Interest

The authors declare no conflict of interest. The funders had no role in the design of the study, analyses, or interpretation of data; in the writing of the manuscript, or in the decision to publish the results.

Appendix A

Table A1. Mean and standard error of mean (SEM) values relative to Figure 4C. Relative quantification (RQ) values (log2) have been pooled and SEM determined for each condition during the course of hiPSC differentiation. Negative log2-transformed RQ values are plotted as 0 in Figure 4C and correspond to very low expression levels. ND= not detected Ct value by RT-qPCR.
Culture Condition 48 h
3 µM CHIR
Sustained
3 µM CHIR
48 h
3 µM CHIR
Sustained
6 µM CHIR
48 h
3 µM CHIR
+ 2 ng/mlActA
Sustained
3 µM CHIR
48 h
3 µM CHIR
+ 2 ng/mlActA
Sustained
6 µM CHIR
24 h
3 µM CHIR
+ 2 ng/mlActA
Sustained
3 µM CHIR
24 h
3 µM CHIR
+ 2 ng/mlActA
Sustained
6 µM CHIR
Gene NameTime (Days)Mean RQ ValueSEMMean RQ ValueSEMMean RQ ValueSEMMean RQ ValueSEMMean RQ ValueSEMMean RQ ValueSEM
T0−4.680.50−4.680.50−4.680.50−4.680.50−4.680.50−4.680.50
25.240.365.240.365.270.165.270.161.620.391.620.39
32.190.714.380.202.800.665.160.370.990.355.180.44
5−2.391.643.141.500.201.333.541.224.230.625.450.43
FOXA20−1.710.28−1.710.28−1.710.28−1.710.28−1.710.28−1.710.28
24.780.204.780.205.530.255.530.255.310.185.310.18
34.650.304.890.515.780.225.720.276.030.366.120.32
53.480.553.740.595.840.385.290.235.640.424.940.46
SHH0NDNDNDNDNDNDNDNDNDNDNDND
2NDNDNDNDNDNDNDND−0.320.87−0.320.87
3−2.550.81NDND−0.400.961.441.28−0.510.971.041.20
50.801.930.401.684.710.732.670.794.570.922.111.26
GSC0−3.070.36−3.070.36−3.070.36−3.070.36−3.070.36−3.070.36
26.160.226.160.226.160.266.160.265.591.035.591.03
32.390.172.600.142.370.232.650.200.740.281.000.25
5−0.710.37−1.030.100.250.32−0.530.331.950.84−1.060.46
CER10−2.570.26−2.570.26−2.570.26−2.570.26−2.570.26−2.570.26
24.630.284.630.285.470.295.470.295.961.485.961.48
3−1.830.74−3.680.55−2.430.44−3.090.35−2.570.39−1.860.15
5−6.170.52−6.510.46−5.570.47−6.500.201.241.24−3.351.14
SOX170NDNDNDNDNDNDNDNDNDNDNDND
23.600.983.600.984.100.394.100.395.030.705.030.70
33.000.683.710.993.680.333.870.344.030.514.550.40
52.210.902.821.193.950.542.910.463.210.872.310.70
MIXL10−3.470.19−3.470.19−3.470.19−3.470.19−3.470.19−3.470.19
26.270.156.270.155.790.285.790.282.960.582.960.58
32.350.503.860.142.010.613.590.29−0.450.473.340.34
5−2.461.161.941.48−0.280.991.010.843.380.994.230.41
TBX60−0.120.18−0.120.18−0.120.18−0.120.18−0.120.18−0.120.18
24.770.744.770.744.950.454.950.451.440.371.440.37
35.340.636.030.325.130.495.830.390.680.302.540.31
50.981.074.101.301.640.513.570.642.020.395.310.44
FOXF10−3.300.63−3.300.63−3.300.63−3.300.63−3.300.63−3.300.63
2−3.101.08−3.101.08−1.310.97−1.310.97−5.691.00−5.691.00
31.960.873.061.413.460.343.951.07−1.110.53−1.650.24
53.351.374.931.244.980.205.810.790.750.751.630.87
FOXJ103.490.303.490.303.490.303.490.303.490.303.490.30
2−1.430.33−1.430.330.830.520.830.522.740.692.740.69
32.240.142.910.843.420.542.470.704.530.294.380.43
52.600.462.750.574.480.365.040.514.360.422.910.87
NOGGIN0−0.320.86−0.320.86−0.320.86−0.320.86−0.320.86−0.320.86
2−1.450.76−1.450.76−1.490.72−1.490.72−5.130.67−5.130.67
3−0.190.690.200.722.580.923.761.22−1.500.26−0.810.24
53.460.453.320.534.410.395.281.761.640.772.220.77
NOTO0NDNDNDNDNDNDNDNDNDNDNDND
2NDNDNDNDNDNDNDNDNDNDNDND
3NDNDNDNDNDNDNDNDNDNDNDND
5NDNDNDNDNDNDNDNDNDNDNDND
Table_Mean_SEM_Figure 4C.

Appendix B

Table A2. Statistical analysis relative to Figure 4C. A two-way Anova test was performed across all the conditions at day 2 and day 5. * p-value < 0.05. x indicates missing p-values due to absence of gene expression.
GeneMEPCDay 2Day 5
Sustained 3 μM CHIRSustained 6 μM CHIR
T48 h 3 µM CHIR vs. 48 h 3 µM CHIR + 2 ng/mL ActA>0.999>0.9990.485
48 h 3 µM CHIR vs. 24 h 3 µM CHIR + 2 ng/mL ActA0.001 *0.1670.085
48 h 3 µM CHIR + 2 ng/mL ActA vs. 24 h 3 µM CHIR + 2 ng/mL ActA0.001 *0.039 *0.012 *
FOXA248 h 3 µM CHIR vs. 48 h 3 µM CHIR + 2 ng/mL ActA0.3790.1060.169
48 h 3 µM CHIR vs. 24 h 3 µM CHIR + 2 ng/mL ActA0.3630.1560.379
48 h 3 µM CHIR + 2 ng/mL ActA vs. 24 h 3 µM CHIR + 2 ng/mL ActA>0.9990.9990.831
SHH48 h 3 µM CHIR vs. 48 h 3 µM CHIR + 2 ng/mL ActAx0.0370.332
48 h 3 µM CHIR vs. 24 h 3 µM CHIR + 2 ng/mL ActAx0.0760.892
48 h 3 µM CHIR + 2 ng/mL ActA vs. 24 h 3 µM CHIR + 2 ng/mL ActAx0.9990.231
GSC48 h 3 µM CHIR vs. 48 h 3 µM CHIR + 2 ng/mL ActA>0.9990.4981.000
48 h 3 µM CHIR vs. 24 h 3 µM CHIR + 2 ng/mL ActA0.7160.3860.967
48 h 3 µM CHIR + 2 ng/mL ActA vs. 24 h 3 µM CHIR + 2 ng/mL ActA0.7480.8520.245
CER148 h 3 µM CHIR vs. 48 h 3 µM CHIR + 2 ng/mL ActA0.4440.950>0.999
48 h 3 µM CHIR vs. 24h 3 µM CHIR + 2 ng/mL ActA>0.9990.033 *0.999
48 h 3 µM CHIR + 2 ng/mL ActA vs. 24h 3 µM CHIR + 2 ng/mL ActA0.9850.052>0.999
SOX1748 h 3 µM CHIR vs. 48 h 3 µM CHIR + 2 ng/mL ActA0.8940.4080.827
48 h 3 µM CHIR vs. 24h 3 µM CHIR + 2 ng/mL ActA0.8310.9630.986
48 h 3 µM CHIR + 2 ng/mL ActA vs. 24h 3 µM CHIR + 2 ng/mL ActA0.9970.8280.565
MIXL148 h 3 µM CHIR vs. 48 h 3 µM CHIR + 2 ng/mL ActA0.5120.9990.908
48 h 3 µM CHIR vs. 24h 3 µM CHIR + 2 ng/mL ActA0.007 *0.2740.066
48 h 3 µM CHIR + 2 ng/mL ActA vs. 24h 3 µM CHIR + 2 ng/mL ActA0.012 *0.1100.008 *
TBX648 h 3 µM CHIR vs. 48 h 3 µM CHIR + 2 ng/mL ActA0.9980.9990.926
48 h 3 µM CHIR vs. 24h 3 µM CHIR + 2 ng/mL ActA0.089>0.9990.188
48 h 3 µM CHIR + 2 ng/mL ActA vs. 24h 3 µM CHIR + 2 ng/mL ActA0.002 *0.9490.002 *
FOXF148 h 3 µM CHIR vs. 48 h 3 µM CHIR + 2 ng/mL ActAx0.7020.687
48 h 3 µM CHIR vs. 24h 3 µM CHIR + 2 ng/mL ActAx0.4550.751
48 h 3 µM CHIR + 2 ng/mL ActA vs. 24h 3 µM CHIR + 2 ng/mL ActAx0.005 *0.027 *
FOXJ148 h 3 µM CHIR vs. 48 h 3 µM CHIR + 2 ng/mL ActA0.0950.0720.071
48 h 3 µM CHIR vs. 24h 3 µM CHIR + 2 ng/mL ActA0.005 *0.122>0.999
48 h 3 µM CHIR + 2 ng/mL ActA vs. 24h 3 µM CHIR + 2 ng/mL ActA0.1220.9990.350
NOGGIN48 h 3 µM CHIR vs. 48 h 3 µM CHIR + 2 ng/mL ActA0.9870.391>0.999
48 h 3 µM CHIR vs. 24h 3 µM CHIR + 2 ng/mL ActA0.2290.2250.688
48 h 3 µM CHIR + 2 ng/mL ActA vs. 24h 3 µM CHIR + 2 ng/mL ActA0.4120.1310.774
NOTO48 h 3 µM CHIR vs. 48 h 3 µM CHIR + 2 ng/mL ActAxxx
48 h 3 µM CHIR vs. 24h 3 µM CHIR + 2 ng/mL ActAxxx
48 h 3 µM CHIR + 2 ng/mL ActA vs. 24h 3 µM CHIR + 2 ng/mL ActAxxx
Table_Anova test_Figure 4C.

References

  1. Colombier, P.; Camus, A.; Lescaudron, L.; Clouet, J.; Guicheux, J. Intervertebral disc regeneration: A great challenge for tissue engineers. Trends Biotechnol. 2014, 32, 433–435. [Google Scholar] [CrossRef] [PubMed]
  2. Richardson, S.M.; Ludwinski, F.E.; Gnanalingham, K.K.; Atkinson, R.A.; Freemont, A.J.; Hoyland, J.A. Notochordal and nucleus pulposus marker expression is maintained by sub-populations of adult human nucleus pulposus cells through aging and degeneration. Sci. Rep. 2017, 7, 1501. [Google Scholar] [CrossRef] [PubMed]
  3. Aguiar, D.J.; Johnson, S.L.; Oegema, T.R. Notochordal cells interact with nucleus pulposus cells: Regulation of proteoglycan synthesis. Exp. Cell Res. 1999, 246, 129–137. [Google Scholar] [CrossRef] [PubMed]
  4. Erwin, W.M.; Inman, R.D. Notochord cells regulate intervertebral disc chondrocyte proteoglycan production and cell proliferation. Spine 2006, 31, 1094–1099. [Google Scholar] [CrossRef] [PubMed]
  5. McCann, M.; Séguin, C. Notochord Cells in Intervertebral Disc Development and Degeneration. JDB 2016, 4, 3. [Google Scholar] [CrossRef]
  6. Sakai, D.; Nakamura, Y.; Nakai, T.; Mishima, T.; Kato, S.; Grad, S.; Alini, M.; Risbud, M.V.; Chan, D.; Cheah, K.S.E.; et al. Exhaustion of nucleus pulposus progenitor cells with ageing and degeneration of the intervertebral disc. Nat. Commun. 2012, 3, 1264. [Google Scholar] [CrossRef] [Green Version]
  7. Boyd, L.M.; Chen, J.; Kraus, V.B.; Setton, L.A. Conditioned medium differentially regulates matrix protein gene expression in cells of the intervertebral disc. Spine 2004, 29, 2217–2222. [Google Scholar] [CrossRef] [Green Version]
  8. Abbott, R.D.; Purmessur, D.; Monsey, R.D.; Iatridis, J.C. Regenerative potential of TGFβ3 + Dex and notochordal cell conditioned media on degenerated human intervertebral disc cells. J. Orthop. Res. 2012, 30, 482–488. [Google Scholar] [CrossRef] [Green Version]
  9. Bach, F.C.; de Vries, S.A.H.; Krouwels, A.; Creemers, L.B.; Ito, K.; Meij, B.P.; Tryfonidou, M.A. The species-specific regenerative effects of notochordal cell-conditioned medium on chondrocyte-like cells derived from degenerated human intervertebral discs. Eur. Cell Mater. 2015, 30, 132–147. [Google Scholar] [CrossRef]
  10. Mehrkens, A.; Matta, A.; Karim, M.Z.; Kim, S.; Fehlings, M.G.; Schaeren, S.; Mark Erwin, W. Notochordal cell-derived conditioned medium protects human nucleus pulposus cells from stress-induced apoptosis. Spine J. 2017, 17, 579–588. [Google Scholar] [CrossRef]
  11. Matta, A.; Karim, M.Z.; Isenman, D.E.; Erwin, W.M. Molecular Therapy for Degenerative Disc Disease: Clues from Secretome Analysis of the Notochordal Cell-Rich Nucleus Pulposus. Sci. Rep. 2017, 7, 45623. [Google Scholar] [CrossRef] [Green Version]
  12. Liebscher, T.; Haefeli, M.; Wuertz, K.; Nerlich, A.G.; Boos, N. Age-related variation in cell density of human lumbar intervertebral disc. Spine 2011, 36, 153–159. [Google Scholar] [CrossRef]
  13. Clouet, J.; Fusellier, M.; Camus, A.; Le Visage, C.; Guicheux, J. Intervertebral disc regeneration: From cell therapy to the development of novel bioinspired endogenous repair strategies. Adv. Drug Deliv. Rev. 2018, 146, 306–324. [Google Scholar] [CrossRef]
  14. Choi, K.-S.; Cohn, M.J.; Harfe, B.D. Identification of nucleus pulposus precursor cells and notochordal remnants in the mouse: Implications for disk degeneration and chordoma formation. Dev. Dyn. 2008, 237, 3953–3958. [Google Scholar] [CrossRef] [Green Version]
  15. McCann, M.R.; Tamplin, O.J.; Rossant, J.; Séguin, C.A. Tracing notochord-derived cells using a Noto-cre mouse: Implications for intervertebral disc development. Dis. Model. Mech. 2012, 5, 73–82. [Google Scholar] [CrossRef] [Green Version]
  16. Camus, A.; Davidson, B.P.; Billiards, S.; Khoo, P.; Rivera-Pérez, J.A.; Wakamiya, M.; Behringer, R.R.; Tam, P.P. The morphogenetic role of midline mesendoderm and ectoderm in the development of the forebrain and the midbrain of the mouse embryo. Development 2000, 127, 1799–1813. [Google Scholar]
  17. Lawson, L.Y.; Harfe, B.D. Developmental mechanisms of intervertebral disc and vertebral column formation. Wiley Interdiscip. Rev. Dev. Biol. 2017, 6. [Google Scholar] [CrossRef]
  18. Williams, S.; Alkhatib, B.; Serra, R. Development of the axial skeleton and intervertebral disc. Curr. Top. Dev. Biol. 2019, 133, 49–90. [Google Scholar]
  19. Winzi, M.K.; Hyttel, P.; Dale, J.K.; Serup, P. Isolation and characterization of node/notochord-like cells from mouse embryonic stem cells. Stem Cells Dev. 2011, 20, 1817–1827. [Google Scholar] [CrossRef] [Green Version]
  20. Liu, Y.; Rahaman, M.N.; Bal, B.S. Modulating notochordal differentiation of human induced pluripotent stem cells using natural nucleus pulposus tissue matrix. PLoS ONE 2014, 9, e100885. [Google Scholar] [CrossRef] [Green Version]
  21. Tang, R.; Jing, L.; Willard, V.P.; Wu, C.-L.; Guilak, F.; Chen, J.; Setton, L.A. Differentiation of human induced pluripotent stem cells into nucleus pulposus-like cells. Stem Cell Res. 2018, 9, 61. [Google Scholar] [CrossRef] [PubMed] [Green Version]
  22. Hoffmann, A.; Czichos, S.; Kaps, C.; Bächner, D.; Mayer, H.; Kurkalli, B.G.; Zilberman, Y.; Turgeman, G.; Pelled, G.; Gross, G.; et al. The T-box transcription factor Brachyury mediates cartilage development in mesenchymal stem cell line C3H10T1/2. J. Cell Sci. 2002, 115, 769–781. [Google Scholar] [PubMed]
  23. Oldershaw, R.A.; Baxter, M.A.; Lowe, E.T.; Bates, N.; Grady, L.M.; Soncin, F.; Brison, D.R.; Hardingham, T.E.; Kimber, S.J. Directed differentiation of human embryonic stem cells toward chondrocytes. Nat. Biotechnol. 2010, 28, 1187–1194. [Google Scholar] [CrossRef]
  24. Vincent, S.D.; Dunn, N.R.; Hayashi, S.; Norris, D.P.; Robertson, E.J. Cell fate decisions within the mouse organizer are governed by graded Nodal signals. Genes Dev. 2003, 17, 1646–1662. [Google Scholar] [CrossRef] [Green Version]
  25. Tamplin, O.J.; Kinzel, D.; Cox, B.J.; Bell, C.E.; Rossant, J.; Lickert, H. Microarray analysis of Foxa2 mutant mouse embryos reveals novel gene expression and inductive roles for the gastrula organizer and its derivatives. BMC Genom. 2008, 9, 511. [Google Scholar] [CrossRef] [Green Version]
  26. Balmer, S.; Nowotschin, S.; Hadjantonakis, A.-K. Notochord morphogenesis in mice: Current understanding & open questions. Dev. Dyn. 2016, 245, 547–557. [Google Scholar]
  27. Wymeersch, F.J.; Skylaki, S.; Huang, Y.; Watson, J.A.; Economou, C.; Marek-Johnston, C.; Tomlinson, S.R.; Wilson, V. Transcriptionally dynamic progenitor populations organised around a stable niche drive axial patterning. Development 2019, 146. [Google Scholar] [CrossRef] [Green Version]
  28. Tamplin, O.J.; Cox, B.J.; Rossant, J. Integrated microarray and ChIP analysis identifies multiple Foxa2 dependent target genes in the notochord. Dev. Biol. 2011, 360, 415–425. [Google Scholar] [CrossRef] [Green Version]
  29. Alten, L.; Schuster-Gossler, K.; Eichenlaub, M.P.; Wittbrodt, B.; Wittbrodt, J.; Gossler, A. A novel mammal-specific three partite enhancer element regulates node and notochord-specific Noto expression. PLoS ONE 2012, 7, e47785. [Google Scholar] [CrossRef] [Green Version]
  30. Lolas, M.; Valenzuela, P.D.T.; Tjian, R.; Liu, Z. Charting Brachyury-mediated developmental pathways during early mouse embryogenesis. Proc. Natl. Acad. Sci. USA 2014, 111, 4478–4483. [Google Scholar] [CrossRef] [Green Version]
  31. Abdelkhalek, H.B.; Beckers, A.; Schuster-Gossler, K.; Pavlova, M.N.; Burkhardt, H.; Lickert, H.; Rossant, J.; Reinhardt, R.; Schalkwyk, L.C.; Müller, I.; et al. The mouse homeobox gene Not is required for caudal notochord development and affected by the truncate mutation. Genes Dev. 2004, 18, 1725–1736. [Google Scholar] [CrossRef] [PubMed] [Green Version]
  32. Beckers, A.; Alten, L.; Viebahn, C.; Andre, P.; Gossler, A. The mouse homeobox gene Noto regulates node morphogenesis, notochordal ciliogenesis, and left right patterning. Proc. Natl. Acad. Sci. USA 2007, 104, 15765–15770. [Google Scholar] [CrossRef] [PubMed] [Green Version]
  33. Yamanaka, Y.; Tamplin, O.J.; Beckers, A.; Gossler, A.; Rossant, J. Live imaging and genetic analysis of mouse notochord formation reveals regional morphogenetic mechanisms. Dev. Cell 2007, 13, 884–896. [Google Scholar] [CrossRef] [Green Version]
  34. Rodrigues-Pinto, R.; Ward, L.; Humphreys, M.; Zeef, L.A.H.; Berry, A.; Hanley, K.P.; Hanley, N.; Richardson, S.M.; Hoyland, J.A. Human notochordal cell transcriptome unveils potential regulators of cell function in the developing intervertebral disc. Sci. Rep. 2018, 8, 12866. [Google Scholar] [CrossRef] [Green Version]
  35. Gaignerie, A.; Lefort, N.; Rousselle, M.; Forest-Choquet, V.; Flippe, L.; Francois-Campion, V.; Girardeau, A.; Caillaud, A.; Chariau, C.; Francheteau, Q.; et al. Urine-derived cells provide a readily accessible cell type for feeder-free mRNA reprogramming. Sci. Rep. 2018, 8, 14363. [Google Scholar] [CrossRef] [Green Version]
  36. Livak, K.J.; Schmittgen, T.D. Analysis of relative gene expression data using real-time quantitative PCR and the 2(-Delta Delta C(T)) Method. Methods 2001, 25, 402–408. [Google Scholar] [CrossRef]
  37. Kilens, S.; Meistermann, D.; Moreno, D.; Chariau, C.; Gaignerie, A.; Reignier, A.; Lelièvre, Y.; Casanova, M.; Vallot, C.; Nedellec, S.; et al. Parallel derivation of isogenic human primed and naive induced pluripotent stem cells. Nat. Commun 2018, 9, 360s. [Google Scholar] [CrossRef]
  38. Gadue, P.; Huber, T.L.; Paddison, P.J.; Keller, G.M. Wnt and TGF-beta signalling are required for the induction of an in vitro model of primitive streak formation using embryonic stem cells. Proc. Natl. Acad. Sci. USA 2006, 103, 16806–16811. [Google Scholar] [CrossRef] [Green Version]
  39. Sumi, T.; Tsuneyoshi, N.; Nakatsuji, N.; Suemori, H. Defining early lineage specification of human embryonic stem cells by the orchestrated balance of canonical Wnt/beta-catenin, Activin/Nodal and BMP signalling. Development 2008, 135, 2969–2979. [Google Scholar] [CrossRef] [Green Version]
  40. Costello, I.; Nowotschin, S.; Sun, X.; Mould, A.W.; Hadjantonakis, A.-K.; Bikoff, E.K.; Robertson, E.J. Lhx1 functions together with Otx2, Foxa2, and Ldb1 to govern anterior mesendoderm, node, and midline development. Genes Dev. 2015, 29, 2108–2122. [Google Scholar] [CrossRef] [Green Version]
  41. Arnold, S.J.; Robertson, E.J. Making a commitment: Cell lineage allocation and axis patterning in the early mouse embryo. Nat. Rev. Mol. Cell Biol. 2009, 10, 91–103. [Google Scholar] [CrossRef]
  42. Brennan, J.; Lu, C.C.; Norris, D.P.; Rodriguez, T.A.; Beddington, R.S.; Robertson, E.J. Nodal signalling in the epiblast patterns the early mouse embryo. Nature 2001, 411, 965–969. [Google Scholar] [CrossRef]
  43. Besser, D. Expression of nodal, lefty-a, and lefty-B in undifferentiated human embryonic stem cells requires activation of Smad2/3. J. Biol. Chem. 2004, 279, 45076–45084. [Google Scholar] [CrossRef] [Green Version]
  44. Lickert, H.; Kutsch, S.; Kanzler, B.; Tamai, Y.; Taketo, M.M.; Kemler, R. Formation of multiple hearts in mice following deletion of beta-catenin in the embryonic endoderm. Dev. Cell 2002, 3, 171–181. [Google Scholar] [CrossRef] [Green Version]
  45. Ukita, K.; Hirahara, S.; Oshima, N.; Imuta, Y.; Yoshimoto, A.; Jang, C.-W.; Oginuma, M.; Saga, Y.; Behringer, R.R.; Kondoh, H.; et al. Wnt signalling maintains the notochord fate for progenitor cells and supports the posterior extension of the notochord. Mech. Dev. 2009, 126, 791–803. [Google Scholar] [CrossRef] [Green Version]
  46. Rudloff, S.; Kemler, R. Differential requirements for β-catenin during mouse development. Development 2012, 139, 3711–3721. [Google Scholar] [CrossRef] [Green Version]
  47. Smits, P.; Lefebvre, V. Sox5 and Sox6 are required for notochord extracellular matrix sheath formation, notochord cell survival and development of the nucleus pulposus of intervertebral discs. Development 2003, 130, 1135–1148. [Google Scholar] [CrossRef] [Green Version]
  48. Barrionuevo, F.; Taketo, M.M.; Scherer, G.; Kispert, A. Sox9 is required for notochord maintenance in mice. Dev. Biol. 2006, 295, 128–140. [Google Scholar] [CrossRef] [Green Version]
  49. Maier, J.A.; Lo, Y.; Harfe, B.D. Foxa1 and Foxa2 are required for formation of the intervertebral discs. PLoS ONE 2013, 8, e55528. [Google Scholar] [CrossRef] [Green Version]
  50. Bagheri-Fam, S.; Barrionuevo, F.; Dohrmann, U.; Günther, T.; Schüle, R.; Kemler, R.; Mallo, M.; Kanzler, B.; Scherer, G. Long-range upstream and downstream enhancers control distinct subsets of the complex spatiotemporal Sox9 expression pattern. Dev. Biol. 2006, 291, 382–397. [Google Scholar] [CrossRef] [Green Version]
  51. Spence, J.R.; Lange, A.W.; Lin, S.-C.J.; Kaestner, K.H.; Lowy, A.M.; Kim, I.; Whitsett, J.A.; Wells, J.M. Sox17 regulates organ lineage segregation of ventral foregut progenitor cells. Dev. Cell 2009, 17, 62–74. [Google Scholar] [CrossRef] [Green Version]
  52. Korostylev, A.; Mahaddalkar, P.U.; Keminer, O.; Hadian, K.; Schorpp, K.; Gribbon, P.; Lickert, H. A high-content small molecule screen identifies novel inducers of definitive endoderm. Mol. Metab 2017, 6, 640–650. [Google Scholar] [CrossRef]
  53. Ciruna, B.; Rossant, J. FGF signalling regulates mesoderm cell fate specification and morphogenetic movement at the primitive streak. Dev. Cell 2001, 1, 37–49. [Google Scholar] [CrossRef] [Green Version]
  54. Choi, K.-S.; Harfe, B.D. Hedgehog signalling is required for formation of the notochord sheath and patterning of nuclei pulposi within the intervertebral discs. Proc. Natl. Acad. Sci. USA 2011, 108, 9484–9489. [Google Scholar] [CrossRef] [Green Version]
  55. Omlor, G.W.; Nerlich, A.G.; Tirlapur, U.K.; Urban, J.P.; Guehring, T. Loss of notochordal cell phenotype in 3D-cell cultures: Implications for disc physiology and disc repair. Arch. Orthop Trauma Surg. 2014, 134, 1673–1681. [Google Scholar] [CrossRef]
  56. Hwang, P.Y.; Jing, L.; Michael, K.W.; Richardson, W.J.; Chen, J.; Setton, L.A. N-Cadherin-Mediated Signaling Regulates Cell Phenotype for Nucleus Pulposus Cells of the Intervertebral Disc. Cell Mol. Bioeng 2015, 8, 51–62. [Google Scholar] [CrossRef] [Green Version]
  57. Wang, F.; Gao, Z.-X.; Cai, F.; Sinkemani, A.; Xie, Z.-Y.; Shi, R.; Wei, J.-N.; Wu, X.-T. Formation, function, and exhaustion of notochordal cytoplasmic vacuoles within intervertebral disc: Current understanding and speculation. Oncotarget 2017, 8, 57800–57812. [Google Scholar] [CrossRef]
  58. Resutek, L.; Hsieh, A.H. The vacuolated morphology of chordoma cells is dependent on cytokeratin intermediate filaments. J. Cell. Physiol. 2018, 110, 115. [Google Scholar] [CrossRef]
  59. Tsankov, A.M.; Gu, H.; Akopian, V.; Ziller, M.J.; Donaghey, J.; Amit, I.; Gnirke, A.; Meissner, A. Transcription factor binding dynamics during human ES cell differentiation. Nature 2015, 518, 344–349. [Google Scholar] [CrossRef] [Green Version]
  60. Sharon, N.; Mor, I.; Golan-lev, T.; Fainsod, A.; Benvenisty, N. Molecular and functional characterizations of gastrula organizer cells derived from human embryonic stem cells. Stem Cells 2011, 29, 600–608. [Google Scholar] [CrossRef]
  61. Martyn, I.; Kanno, T.Y.; Ruzo, A.; Siggia, E.D.; Brivanlou, A.H. Self-organization of a human organizer by combined Wnt and Nodal signalling. Nature 2018, 558, 132–135. [Google Scholar] [CrossRef]
  62. Vallier, L.; Touboul, T.; Chng, Z.; Brimpari, M.; Hannan, N.; Millan, E.; Smithers, L.E.; Trotter, M.; Rugg-Gunn, P.; Weber, A.; et al. Early cell fate decisions of human embryonic stem cells and mouse epiblast stem cells are controlled by the same signalling pathways. PLoS ONE 2009, 4, e6082. [Google Scholar] [CrossRef]
  63. Funa, N.S.; Schachter, K.A.; Lerdrup, M.; Ekberg, J.; Hess, K.; Dietrich, N.; Honoré, C.; Hansen, K.; Semb, H. b-Catenin Regulates Primitive Streak Induction through Collaborative Interactions with SMAD2/SMAD3 and Oct4. Cell Stem Cell 2015, 15, 639–652. [Google Scholar] [CrossRef] [Green Version]
  64. Rodrigues-Pinto, R.; Berry, A.; Piper-Hanley, K.; Hanley, N.; Richardson, S.M.; Hoyland, J.A. Spatiotemporal analysis of putative notochordal cell markers reveals CD24 and keratins 8, 18, and 19 as notochord-specific markers during early human intervertebral disc development. J. Orthop. Res. 2016, 34, 1327–1340. [Google Scholar] [CrossRef] [Green Version]
  65. Peck, S.H.; McKee, K.K.; Tobias, J.W.; Malhotra, N.R.; Harfe, B.D.; Smith, L.J. Whole Transcriptome Analysis of Notochord-Derived Cells during Embryonic Formation of the Nucleus Pulposus. Sci. Rep. 2017, 7, 10504. [Google Scholar] [CrossRef] [Green Version]
  66. Tang, S.; Richards, J.; Khan, S.; Hoyland, J.; Gallego Perez, D.; Higuita Castro, N.; Walter, B.; Purmessur, D. Nonviral Transfection with Brachyury Reprograms Human Intervertebral Disc Cells to a Pro-Anabolic Anti-Catabolic/Inflammatory Phenotype: A Proof of Concept Study. J. Orthop. Res. 2019, 37, 2389–2400. [Google Scholar] [CrossRef]
  67. Sheyn, D.; Ben-David, S.; Tawackoli, W.; Zhou, Z.; Salehi, K.; Bez, M.; De Mel, S.; Chan, V.; Roth, J.; Avalos, P.; et al. Human iPSCs can be differentiated into notochordal cells that reduce intervertebral disc degeneration in a porcine model. Theranostics 2019, 9, 7506–7524. [Google Scholar] [CrossRef]
  68. Faial, T.; Bernardo, A.S.; Mendjan, S.; Diamanti, E.; Ortmann, D.; Gentsch, G.E.; Mascetti, V.L.; Trotter, M.W.B.; Smith, J.C.; Pedersen, R.A. Brachyury and SMAD signalling collaboratively orchestrate distinct mesoderm and endoderm gene regulatory networks in differentiating human embryonic stem cells. Development 2015, 142, 2121–2135. [Google Scholar] [CrossRef] [Green Version]
  69. Melby, A.E.; Kimelman, D.; Kimmel, C.B. Spatial regulation of floating head expression in the developing notochord. Dev. Dyn. 1997, 209, 156–165. [Google Scholar] [CrossRef]
  70. Sawada, A.; Nishizaki, Y.; Sato, H.; Yada, Y.; Nakayama, R.; Yamamoto, S.; Nishioka, N.; Kondoh, H.; Sasaki, H. Tead proteins activate the Foxa2 enhancer in the node in cooperation with a second factor. Development 2005, 132, 4719–4729. [Google Scholar] [CrossRef] [Green Version]
Figure 1. Schematic workflow of hiPSCs differentiation. The differentiation was initiated by single cell seeding at 35.000 cells/cm2 (TryplE digestion) on matrigel-coated plates in mTser1 medium supplemented with rock inhibitor for 24 h. From day 0 to day 2, hiPSCs were cultivated in N2B27 in increasing doses of CHIR99021 and Activin A for hiPSC-derived mesendoderm progenitor cell (MEPC) specification. At Day 2, MEPC were dissociated with TryplE and transfected with Lipofectamin RNAimax (5:1) in a single cell suspension with 1500 ng of T, FOXA2 or NOTO mRNA for 24 h for MEPC differentiation. Monolayer transfections were then performed on day 3 and day 4. Cells were maintained in N2B27 with 3 or 6 µM CHIR99021 with or without 50 ng/mL FGF2 from day 2 to day 5. For the stabilization phase, transfected cells were maintained in N2B27 supplemented with 3 µM CHIR99021 with or without 50 ng/mL FGF2 and 100 ng/mL SHH from day 5 to day 7. Top panel: representative brightfield images of differentiating hiPSCs upon optimal culture condition for notochordal lineage from day 0 to day 7, including undifferentiated control cells at day 2 (cells without treatment). (*) indicates optimal culture condition for notochordal differentiation at day 7.
Cells 09 00509 g001
Figure 2. WNT signalling pathway induces hiPSCs differentiation towards mesendoderm progenitors. (A) Modulation of WNT signalling by CHIR; (B) Relative expression of pluripotent markers (SOX2, NANOG and POU5F1), WNT and NODAL target genes (LEF1, LEFTY1 and NODAL), primitive streak (T, MIXL1 and EOMES) and mesendoderm markers (FOXA2, GSC and CER1), (n = 2 independent experiments, mean values); (C) Brightfield acquisition of differentiating hiPSCs upon CHIR treatment; (D) Immunostainings of T+/FOXA2+ positive cells (cell counting at day 2, n = 2 independent experiments, mean percentage ± SEM). Insets are showing nuclei staining with Hoechst. Scale bars: 100 µm. APS = anterior primitive streak; PPS = posterior primitive streak.
Cells 09 00509 g002
Figure 3. WNT and NODAL signalling pathways induce hiPSCs differentiation towards mesendoderm progenitors. (A) Modulation of WNT and NODAL signalling by CHIR and ActA; (B) Relative expression of pluripotent markers (SOX2, NANOG and POU5F1), WNT and NODAL target genes (LEF1, LEFTY1 and NODAL), primitive streak (T, MIXL1 and EOMES) and mesendoderm markers (FOXA2, GSC and CER1), (n = 3, mean values); (C) Brightfield acquisition of differentiating hiPCSs upon CHIR and ActA treatment; (D) Immunostainings of T+/FOXA2+ positive cells (cell counting at day 2, n = 2 independent experiments, mean values ± SEM). Insets are showing nuclei staining with Hoechst. Scale bars: 100 µm. APS = anterior primitive streak; PPS = posterior primitive streak.
Cells 09 00509 g003
Figure 4. Generation and differentiation of mesendoderm progenitors upon WNT and NODAL signalling activation. (A) Effects of sustained WNT signalling activation on the differentiation of MEPC; (B) Brightfield acquisition of MEPC and immunostainings of T+/FOXA2+ positive cells (cell counting at day 2, n = 2 independent experiments, mean percentage ± SEM). Insets are showing nuclei staining with Hoechst; (C) Relative expression of axial mesoderm (T, FOXA2, SHH, FOXJ1, NOGGIN and NOTO), endoderm (GSC, CER1 and SOX17) and mesoderm (MIXL1, TBX6 and FOXF1) markers expression (n = 4, mean values). ND = Non-Detected Ct value. Mean and standard error of mean (SEM) values relative to experiments in panel C are shown in Appendix A. Statistical analysis (2 way Anova test) relative to experiments in panel C to determine significant differences between conditions at day 2 and day 5 is shown in Appendix B. Scale bars: 100 µm.
Cells 09 00509 g004
Figure 5. Generation and differentiation of mesendoderm progenitors upon WNT signalling activation following T, FOXA2 or NOTO mRNA transfections. (A) Differentiation of MEPC following T, FOXA2 or NOTO mRNA transfections; (B) Relative expression of axial mesoderm (T, FOXA2 NOTO, SHH, NOGGIN and FOXJ1), endoderm (GSC, CER1 and SOX17) and mesoderm (MIXL1, TBX6 and FOXF1) markers, (n = 3 independent experiments, mean values ± SEM). * indicates endogenous expression analysed by 3′UTR amplification of T, FOXA2 and NOTO transcripts; (C,D) Immunostainings and quantifications of T+/FOXA2+, T+/SOX9+ and FOXA2+/SOX17+ cells (n = 2; quantification n = 2 technical replicates, mean values). Insets in C are showing nuclei staining with Hoechst. Scale bars: 100 µm.
Cells 09 00509 g005
Figure 6. The FGF signalling pathway does not enhance notochordal differentiation. (A) Assessment of MEPC differentiation into NLC following FGF2 supplementation; (B) Relative expression of axial mesoderm (T, FOXA2, NOTO, FOXJ1, NOGGIN and SHH), endoderm (GSC, CER1 and SOX17) and mesoderm (MIXL1, TBX6 and FOXF1) markers in differentiating MEPC (RT-qPCR, n = 2 independent experiments, mean values ± SEM). * endogenous expression analysed by 3′UTR amplification of NOTO transcript; (C) Immunostaining of T+/FOXA2+ positive cells in differentiating MEPC (n = 2). Insets are showing nuclei stained with Hoechst. Scale bar: 50 μm.
Cells 09 00509 g006
Figure 7. NOTO mRNA transfection and WNT signalling activity are sufficient to induce a stable NLC population. (A) Assessment of NLC stabilization by FGF and SHH signalling activities; (B) Relative expression of axial mesoderm (T, FOXA2, NOTO, SHH, FOXJ1, NOGGIN and SHH), endoderm (GSC, CER1, SOX17) and mesoderm (MIXL1, TBX6 and FOXF1) markers (n = 2 independent experiments, mean ± SEM). * Endogenous expression analysed by 3′UTR amplification of NOTO transcript; (C) Immunostainings of T+/FOXA2+ positive cells. Insets are showing nuclei staining with Hoechst. Scale bars: 50 µm; (D) Heatmap representation of gene expression profiles during control and NOTO-transfected cell differentiation (n = 2, mean values).
Cells 09 00509 g007
Figure 8. NOTO mRNA transfection induced a distinct molecular signature. (A) Differentiation of MEPC following NOTO or FOXA2 mRNA transfections; (B) Expression levels of genes used as markers of mesoderm, ectoderm and endoderm across our samples (left) or Tsankov et al. samples (right); (C) RNAseq expression profile of differentially expressed genes during the course of differentiation. Differentially expressed genes were distributed in 5 clusters based on their kinetic of expression; (D) Expression levels of immediate NOTO response genes during the course of NOTO- and FOXA2-driven MEPC differentiation (this study) and in hESC-derived mesoderm, ectoderm and endoderm [59]; (E) Expression levels of delayed NOTO response genes during the course of NOTO- and FOXA2-driven MEPC differentiation (this study) and in hESC-derived mesoderm, ectoderm and endoderm [59]; (F) Top 15 Biological Processes associated with the up-regulated genes in NOTO-transfected condition compared to FOXA2-transfected condition. Cluster details for mesendoderm genes, NOTO inhibited genes and FOXA2 response genes are presented in Figure S2.
Cells 09 00509 g008
Figure 9. Visual summary of the main findings of the study. Human iPSCs were generated from dermal fibroblasts using 4 reprogramming factors (Oct4, Klf4, Sox2 and c-Myc = OKSM). Activation at day 2: WNT/β-catenin pathway activity (intermediate concentration of CHIR = Mid WNT) induced an increase in NODAL and LEFTY1 gene expression. In this condition, high levels of bipotent mesendoderm progenitors (T+/FOXA2+ cells) were generated. Supplementation with Activin A resulted in hiPSCs commitment toward endoderm lineage (T-/FOXA2+ progenitor cells). High WNT pathway activation (high concentration of CHIR = High WNT) resulted in hiPSCs commitment toward mesoderm lineage (T+/FOXA2- progenitor cells). Differentiation from day 3: Mesendoderm progenitors transfected with synthetic mRNAs encoding human NOTO transcription factor and sustained with Mid WNT signalling activation generated axial mesoderm progenitors (T+/FOXA2+ cells). Stabilization up to day 7: NOTO transfection and Mid WNT signalling activation increased both SHH and FGF signalling pathway activities in axial mesoderm progenitors, which further differentiated into stable notochord-like cell population (NLC) at day 7 (T+/FOXA2+ cells and T+/SOX9+ cells). Human iPSC-derived NLC expressed embryonic notochord-related markers. Blue arrows indicate optimal culture condition for notochordal differentiation. Sets of gene markers relative to lineages or specific cell-types are indicated.
Cells 09 00509 g009

