WNK2 Inhibits Autophagic Flux in Human Glioblastoma Cell Line
by
 , , , , and
Ana Laura Vieira Alves
1 ,
,
Angela Margarida Costa
2,3,
Olga Martinho
1,2,3,
Vinicius Duval da Silva
1,
Peter Jordan
4,5,
Viviane Aline Oliveira Silva
1 and
Rui Manuel Reis
1,2,3,*
1
Molecular Oncology Research Center, Barretos Cancer Hospital, 14784 400 Barretos, Brazil
2
Life and Health Sciences Research Institute (ICVS), School of Medicine, University of Minho, 4710-057 Braga, Portugal
3
ICVS/3B’s—PT—Government Associate Laboratory, 4806-909 Braga, Portugal
4
Department of Human Genetics, National Health Institute Doutor Ricardo Jorge, 1649-016 Lisbon, Portugal
5
BioISI—Biosystems & Integrative Sciences Institute, Faculty of Sciences, University of Lisbon, 1749-016 Lisbon, Portugal
*
Author to whom correspondence should be addressed.
Cells 2020, 9(2), 485; https://doi.org/10.3390/cells9020485
Submission received: 29 December 2019
/
Revised: 22 January 2020
/
Accepted: 25 January 2020
/
Published: 20 February 2020
(This article belongs to the Special Issue Molecular and Cellular Mechanisms of Cancers: Glioblastoma)
Abstract
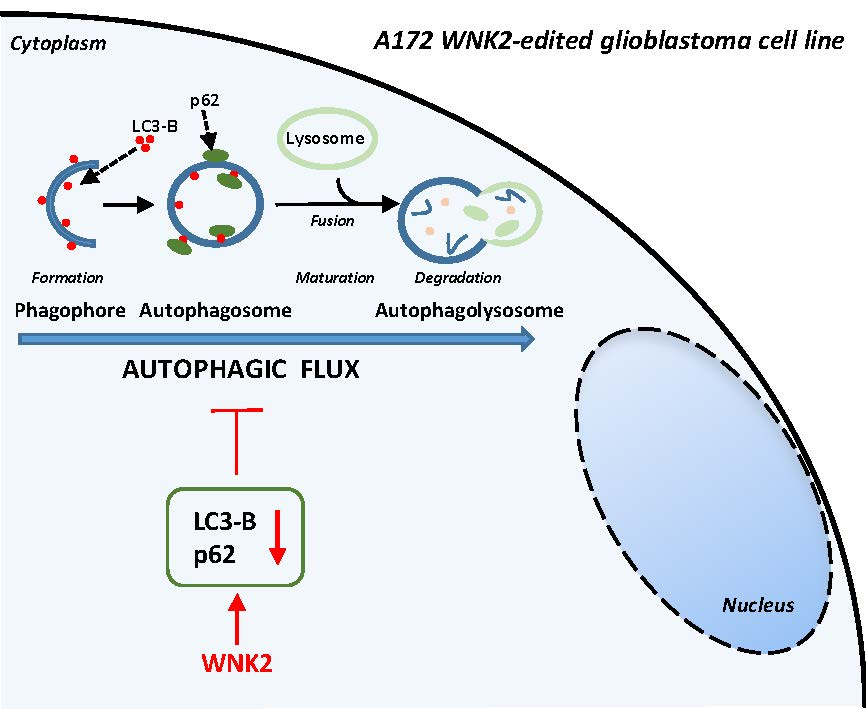
:Autophagy is a cell-survival pathway with dual role in tumorigenesis, promoting either tumor survival or tumor death. WNK2 gene, a member of the WNK (with no lysine (K)) subfamily, acts as a tumor suppressor gene in gliomas, regulating cell migration and invasion; however, its role in autophagy process is poorly explored. The WNK2-methylated human glioblastoma cell line A172 WT (wild type) was compared to transfected clones A172 EV (empty vector), and A172 WNK2 (WNK2 overexpression) for the evaluation of autophagy using an inhibitor (bafilomycin A1—baf A1) and an inducer (everolimus) of autophagic flux. Western blot and immunofluorescence approaches were used to monitor autophagic markers, LC3A/B and SQSTM1/p62. A172 WNK2 cells presented a significant decrease in LC3B and p62 protein levels, and in LC3A/B ratio when compared with control cells, after treatment with baf A1 + everolimus, suggesting that WNK2 overexpression inhibits the autophagic flux in gliomas. The mTOR pathway was also evaluated under the same conditions, and the observed results suggest that the inhibition of autophagy mediated by WNK2 occurs through a mTOR-independent pathway. In conclusion, the evaluation of the autophagic process demonstrated that WNK2 inhibits the autophagic flux in glioblastoma cell line.

1. Introduction
Gliomas are the most common adult primary brain tumors [1]. Glioblastoma (GBM) is the highest-grade form of glioma (WHO grade IV), as well as one of the most aggressive types of cancer with rapid cellular growth, and highly invasive behavior, with a median overall survival time of 15-18 months [2]. The current therapeutic approach is surgery followed by concomitant radiotherapy and temozolomide-based chemotherapy [3,4,5]; however, despite significant advances in diagnosis and therapy in recent decades, the outcomes for high grade gliomas (WHO grade III-IV) remains unfavorable [6]. To change this scenario, a deeper understanding of glioma cancer biology is needed.
Autophagy is a catabolic mechanism that maintains cellular homeostasis. In this cellular process proteins or cytoplasmic organelles are sequestered by double-membrane vesicles known as autophagosomes [7]. Fusion of autophagosomes with lysosomes forms a structure in which intracellular degradation occurs, leading to a state of equilibrium of cellular metabolism, as well as apoptosis [8]. Uncontrolled autophagy is also a cell death mechanism that may occur either in the absence or concomitantly with signs of apoptosis [9]. The autophagy process has been found activated in many tumors and its inhibition can lead to both increased cell death and increased survival, depending on the tissue type, tumor grade, and therapy used [10,11]. Furthermore, it is known that prolonged and progressive autophagy stress can lead to cell death [12]. Thus, induction of autophagic cell death has been proposed as a possible mechanism of tumor suppression [13]. Since autophagy can be viewed as pro- or anti-tumor, depending on the context [14], the dissection of its role in gliomas, as well as the associated molecular mechanisms is of critical importance. This is particularly relevant because glioma cells usually respond to therapeutic agents that induce the autophagic process such as, TMZ and rapamycin in a clinical setting [15].
The serine/threonine kinase WNK2 (with no lysine protein kinase 2) acts as a tumor suppressor in GBM and is associated to carcinogenesis-related pathways [16,17,18]. WNK2 inhibits cell proliferation, invasion, and migration [19,20,21]. These effects are lost following epigenetic silencing by hypermethylation of WNK2 promoter region [16,17]. However, the role of WNK2 in cell death is still unclear and contradictory data concerning WNK2 as an autophagic modulator has been reported [22,23]. Therefore, the present study aimed to explore the in vitro role of WNK2 in autophagic process in gliomas.
2. Materials and Methods
2.1. Cell Lines and Cell Culture
The human glioblastoma cell lines A172 WT (wild-type), A172 EV (empty-vector), and A172 WNK2 (WNK2 overexpression) (Supplementary Figure S1) were cultured in Dulbecco’s modified Eagle’s medium (DMEM) supplemented with 10% fetal bovine serum (FBS) (Sigma-Aldrich, St. Louis, MO, USA), 1% p/s (penicillin/streptomycin) (Life Technologies, Carlsbad, CA, USA) at 37 °C under humidified atmosphere containing 5% CO2. A172 EV and A172 WNK2 were generated and maintained as previously described [18]. The authentication of the cell lines was performed by a DNA short tandem repeat (STR) profile at the Diagnostic Laboratory at Barretos Cancer Hospital (São Paulo, Brazil), as previously described [24].
2.2. Cell Treatment
The A172 WT, A172 EV, and A172 WNK2 cell lines were plated in 6-well plates at a density of 6 × 10⁵ cells/well, and allowed to adhere overnight. After this period, the cells were starved for 3 h with DMEM 0.5% FBS. Next, for the control cells, the growth medium was replaced with DMEM 10% FBS. To evaluate the autophagic process, the cells were treated with Earle’s Balanced Salt Solution (EBSS) (Thermo Fisher Scientific, Waltham, MA, USA). To evaluate the autophagy process, 20 nM bafilomycin A1 (baf A1) (Sigma-Aldrich) was added to the EBSS. Furthermore, 10 nM everolimus (Sigma-Aldrich) was added, acting on the inhibition of mammalian target of rapamycin (mTOR), resulting in the induction of autophagy. Cells were incubated with the respective treatments for 4 and 6 h.
2.3. Immunofluorescence
Cells were plated in a 24-well plate at a density of 7.5 × 10⁵ cells/well, and allowed to adhere for at least 24 h. Subsequently, the cells were starved for 3 h with DMEM (0.5% FBS) before treatment, and then treated with 30 µM chloroquine (CQ) (Molecular Probes, Invitrogen, Eugene, OR, USA) for 16 h. Next, the cells were incubated with formaldehyde 3.7% in Dulbecco’s phosphate-buffered saline (DPBS 1X) (Sigma-Aldrich) and permeabilized with 0.2% Triton X-100 in DBPS 1X for 15 min at room temperature. The cells were incubated for 2 h with a primary LC3 rabbit polyclonal antibody (Molecular Probes, Invitrogen, Eugene, OR, USA) diluted in DPBS with 5% BSA (Bovine Serum Albumin), followed by the secondary antibody Alexa Fluor 488 (Life Technologies, Carlsbad, CA, USA) for 1 h at room temperature. Finally, the cells were labeled with HOECHST 33342 (1:2000) (Life Technologies) and phalloidin-rhodamine (1:200) (Molecular Probes, Invitrogen, Eugene, OR, USA). Images were acquired by the High Content In Cell Analyzer 2200 platform (GE Healthcare Life Sciences, Chicago, IL, USA) and quantification was performed in the Image-Pro software (Media Cybernetics, Rockville, MD, USA).
2.4. Transient Transfection
The pDest-mCherry-EGFP-LC3B and pDest-mCherry-GFP-p62 plasmids were kindly provided by Prof. Terje Johansen (Molecular Cancer Research group, Institute of Medical Biology, University of Tromsø, Tromsø, Norway) for transient transfection. Cells were plated in 6-well plates at a density of 2.5 × 10⁵ cells/well 24 h before transfection with plasmid using the Lipofectamine 3000 reagent (Invitrogen) according to the manufacturer’s recommendations. After 5 h, the transfection medium was replaced by a fresh culture medium, and the cells were incubated for another 24 h. Subsequently, the cells were starved with Hank’s Balanced Salt solution (HBSS) (Invitrogen) for 4 h prior to treatment with 200 µM baf A1 (Sigma Aldrich) for 24 h. After this period, the cells were labeled with HOECHST (1:2000) (Life Technologies). Images were acquired by the High Content In Cell Analyzer 2200 platform (GE Healthcare Life Sciences) and quantification was performed in the Image-Pro software (Media Cybernetics).
2.5. Western Blotting Analysis
Total protein from cell death and autophagy assays was analyzed by western blot as previously described [25]. The following antibodies were used: Anti-LC3A/B (1:1000), anti-SQSTM1/p62 (1:1000), anti-p-p70S6K (Thr389) (1:1000), anti-p-4EBP1 (1:1000), anti-p-mTOR (Ser2448) (1:1000), α-tubulin (1:2000), and β-actin (1:2000), all purchased from Cell Signaling (Danvers, MA, USA). β-actin and α-tubulin were used as a loading control. HRP-conjugated goat anti-mouse and goat anti-rabbit (all from Cell Signaling) were used as secondary antibodies. Chemiluminescence using ECL (GE Healthcare Life Sciences) was detected on an Image Quant LAS4000 mini photo documentation system (GE Healthcare Life Sciences). The subsequent quantification was performed by Image J software version 1.52s (National Institutes of Health—https://imagej.nih.gov/ij/).
2.6. Statistical Analysis
Data from experiments were expressed as the mean ± standard deviation (SD) of three independent experiments. p-values were calculated by two-way ANOVA. Symbols indicate statistical comparisons (* p < 0.05, ** p < 0.01, *** p < 0.001). The aforementioned analysis was performed using GraphPad PRISM version 5 (GraphPad Software, San Diego, CA, USA).
3. Results
WNK2 Inhibits Autophagic Flux
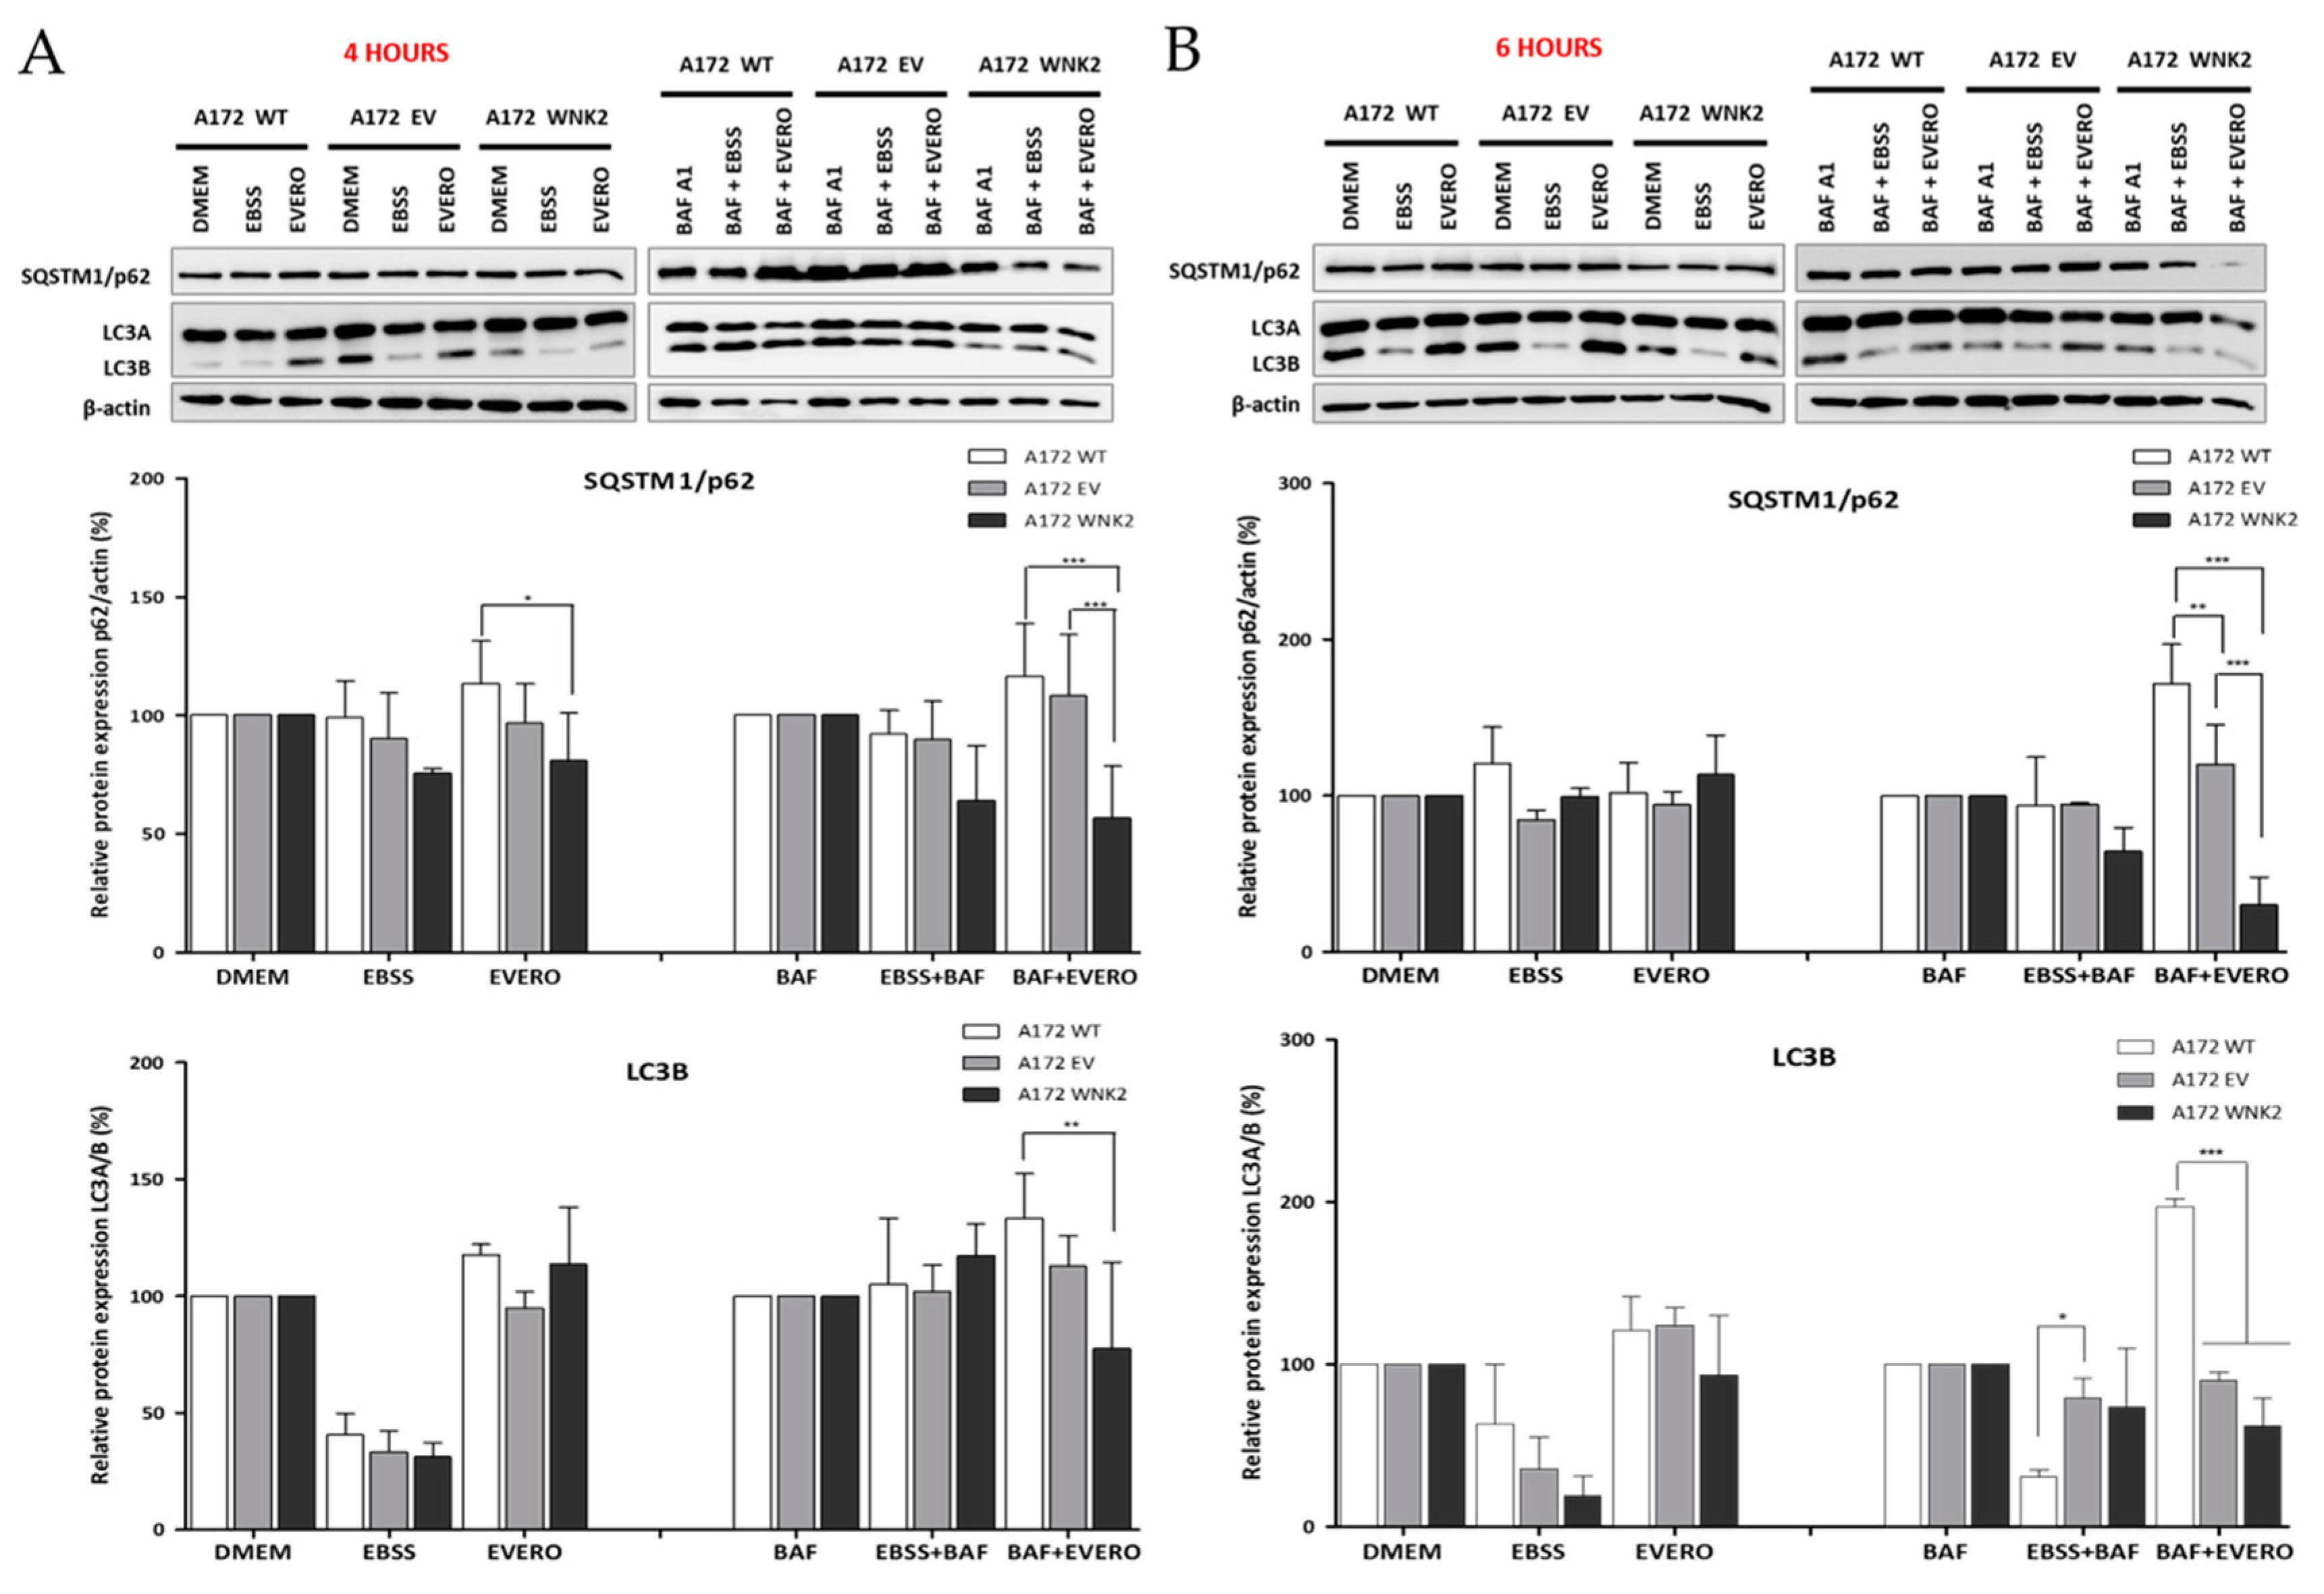
To investigate the potential effect of WNK2 overexpression on autophagy, the A172-derived cell lines (A172 WT, A172 EV, and A172 WNK2) were evaluated for the main markers recommended by the guidelines for the use and interpretation of assays for autophagy monitoring (3rd edition) [26]. The cells were treated with baf A1 as an autophagy flux inhibitor, as well as with starvation (EBSS) and everolimus as autophagy inducers. The western blot analysis demonstrated that WNK2 overexpression significantly decreased LC3B (microtubule-associated protein 1 light chain 3 beta) protein lipidation, and SQSTM1 (sequestosome 1)/p62 levels after 4 and 6 h of combinatorial treatments (Figure 1A,B) indicating a clear autophagic flux inhibition.
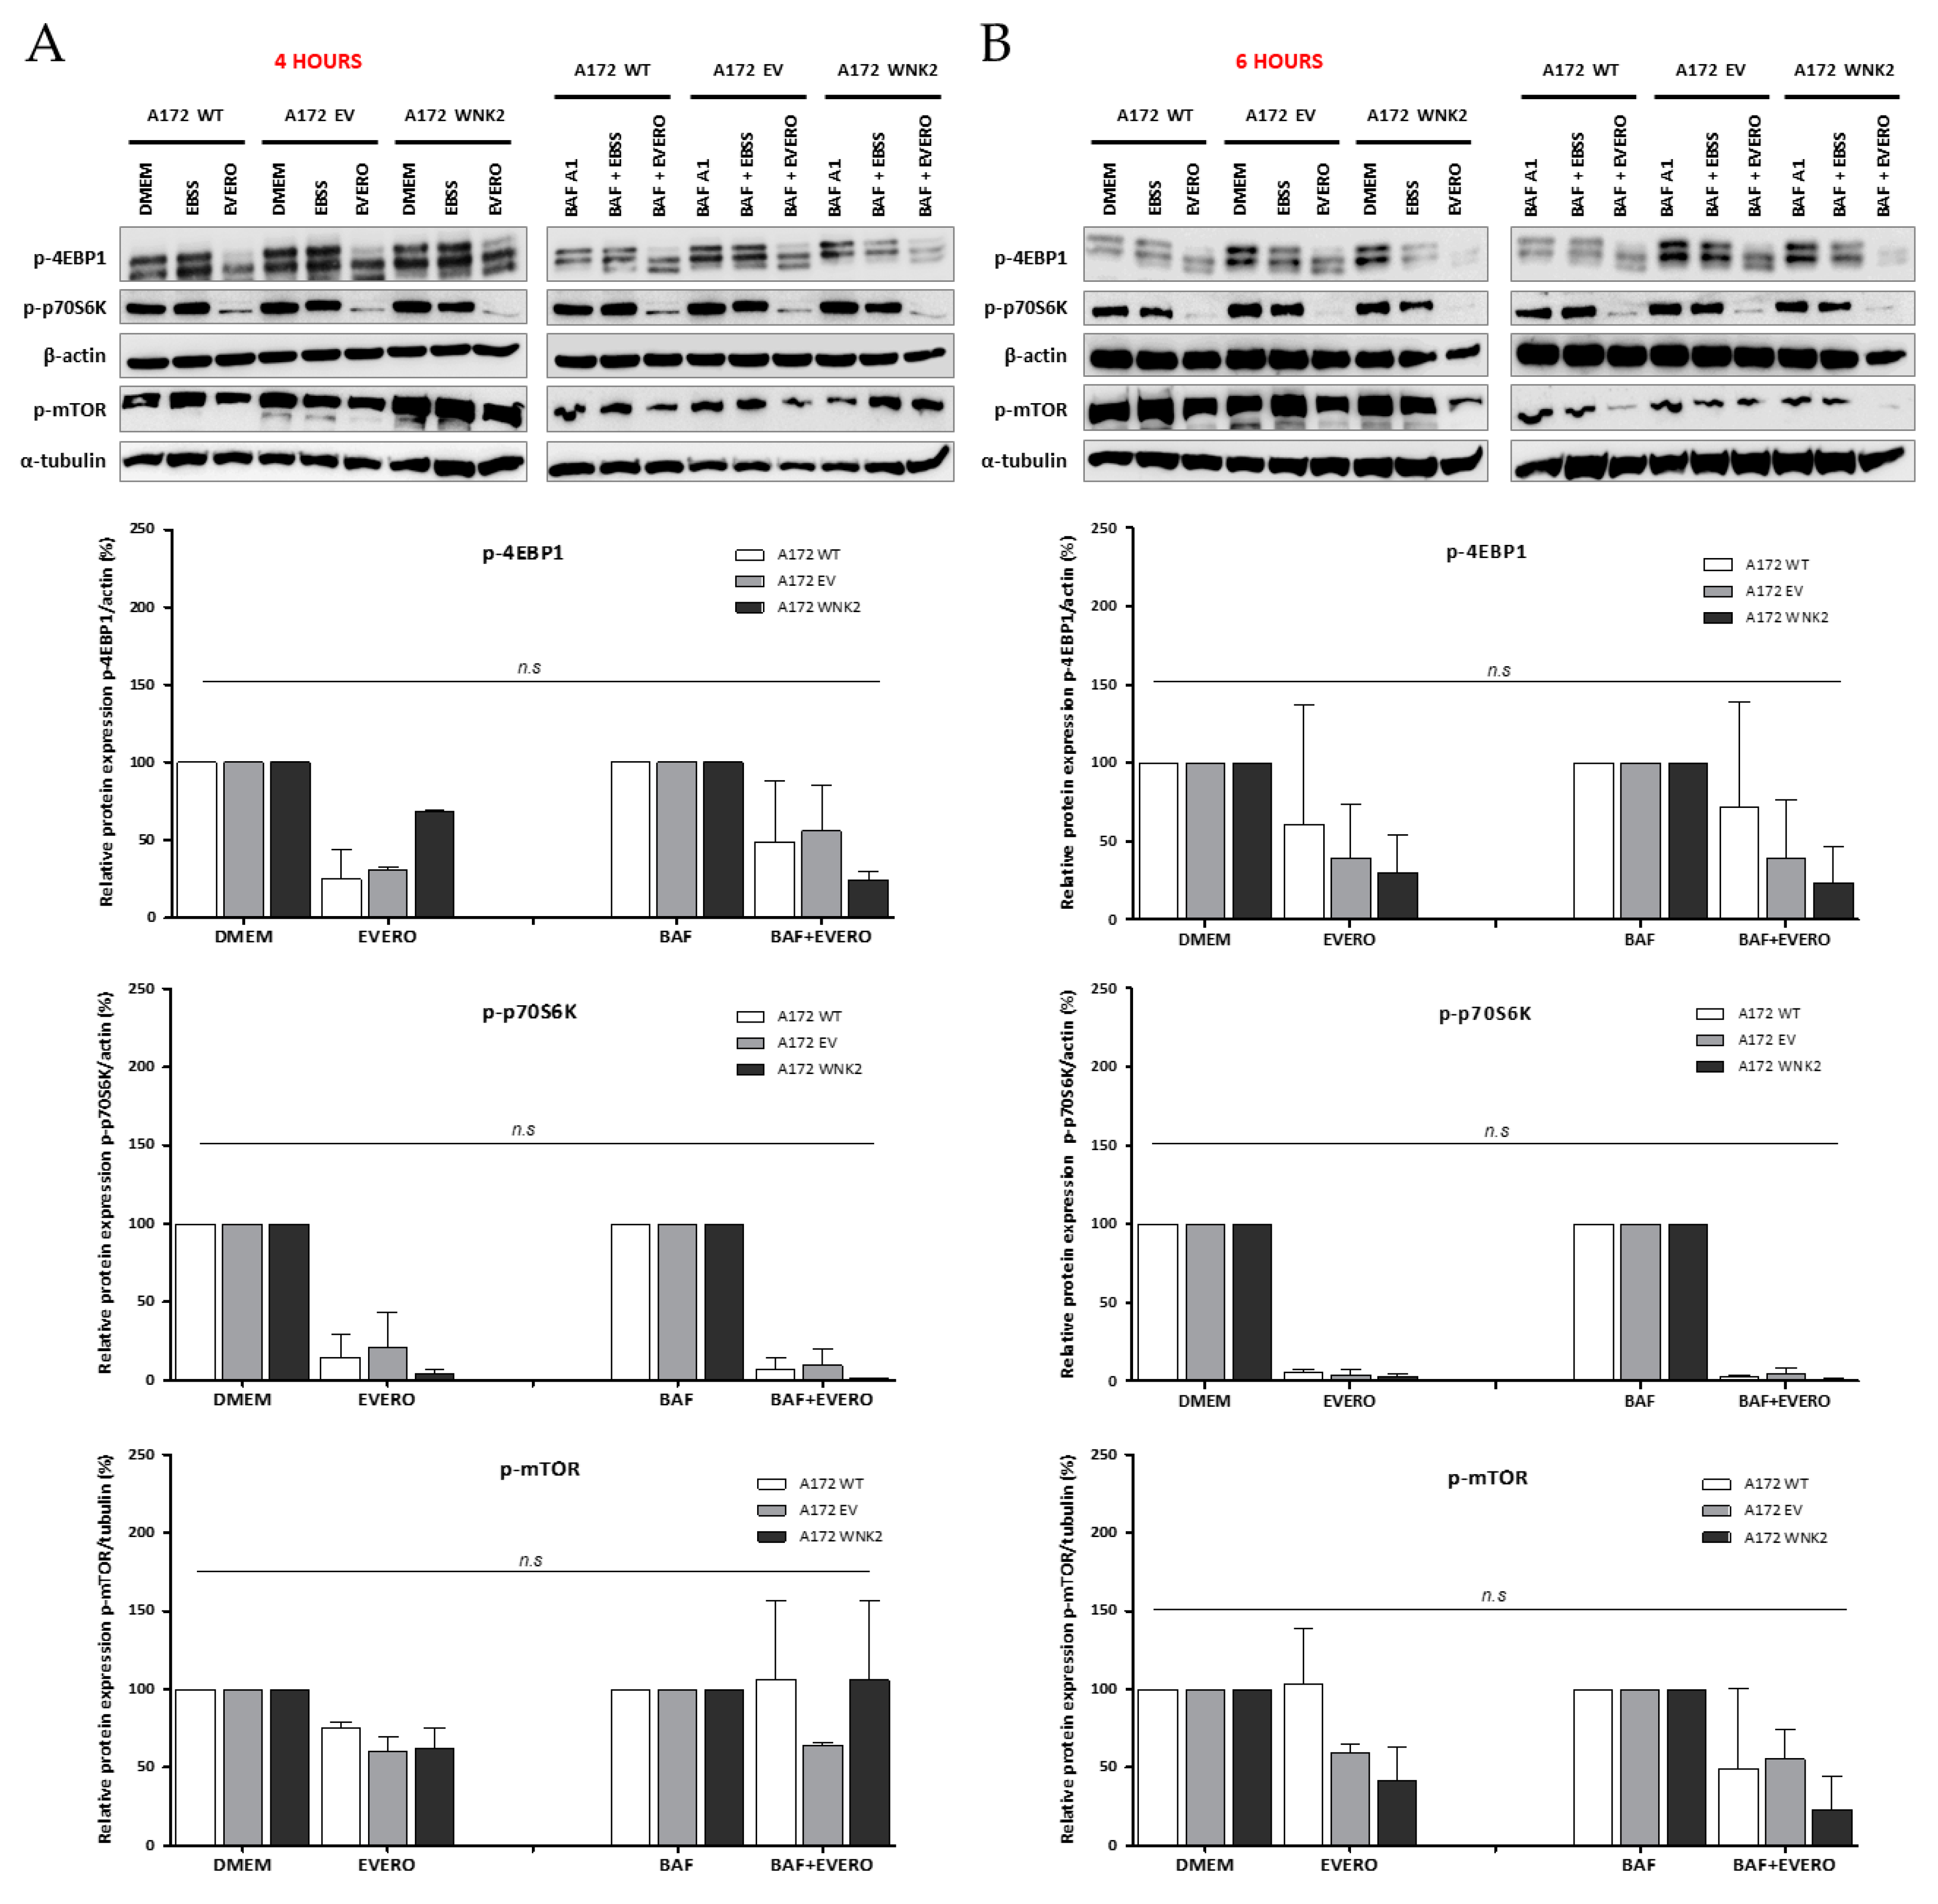
Since everolimus, an mTOR pathway inhibitor, was used in combination with baf A1 treatment, proteins belonging to this pathway were evaluated. Interestingly, under these conditions, the activity of mTOR or the phosphorylation of its substrates EBP1 and p70S6K did not differ between the WNK2-overexpressing cell line compared to the WT and EV controls (Figure 2A,B), suggesting that the observed autophagic flux inhibition in the WNK2 presence is mTOR-independent.
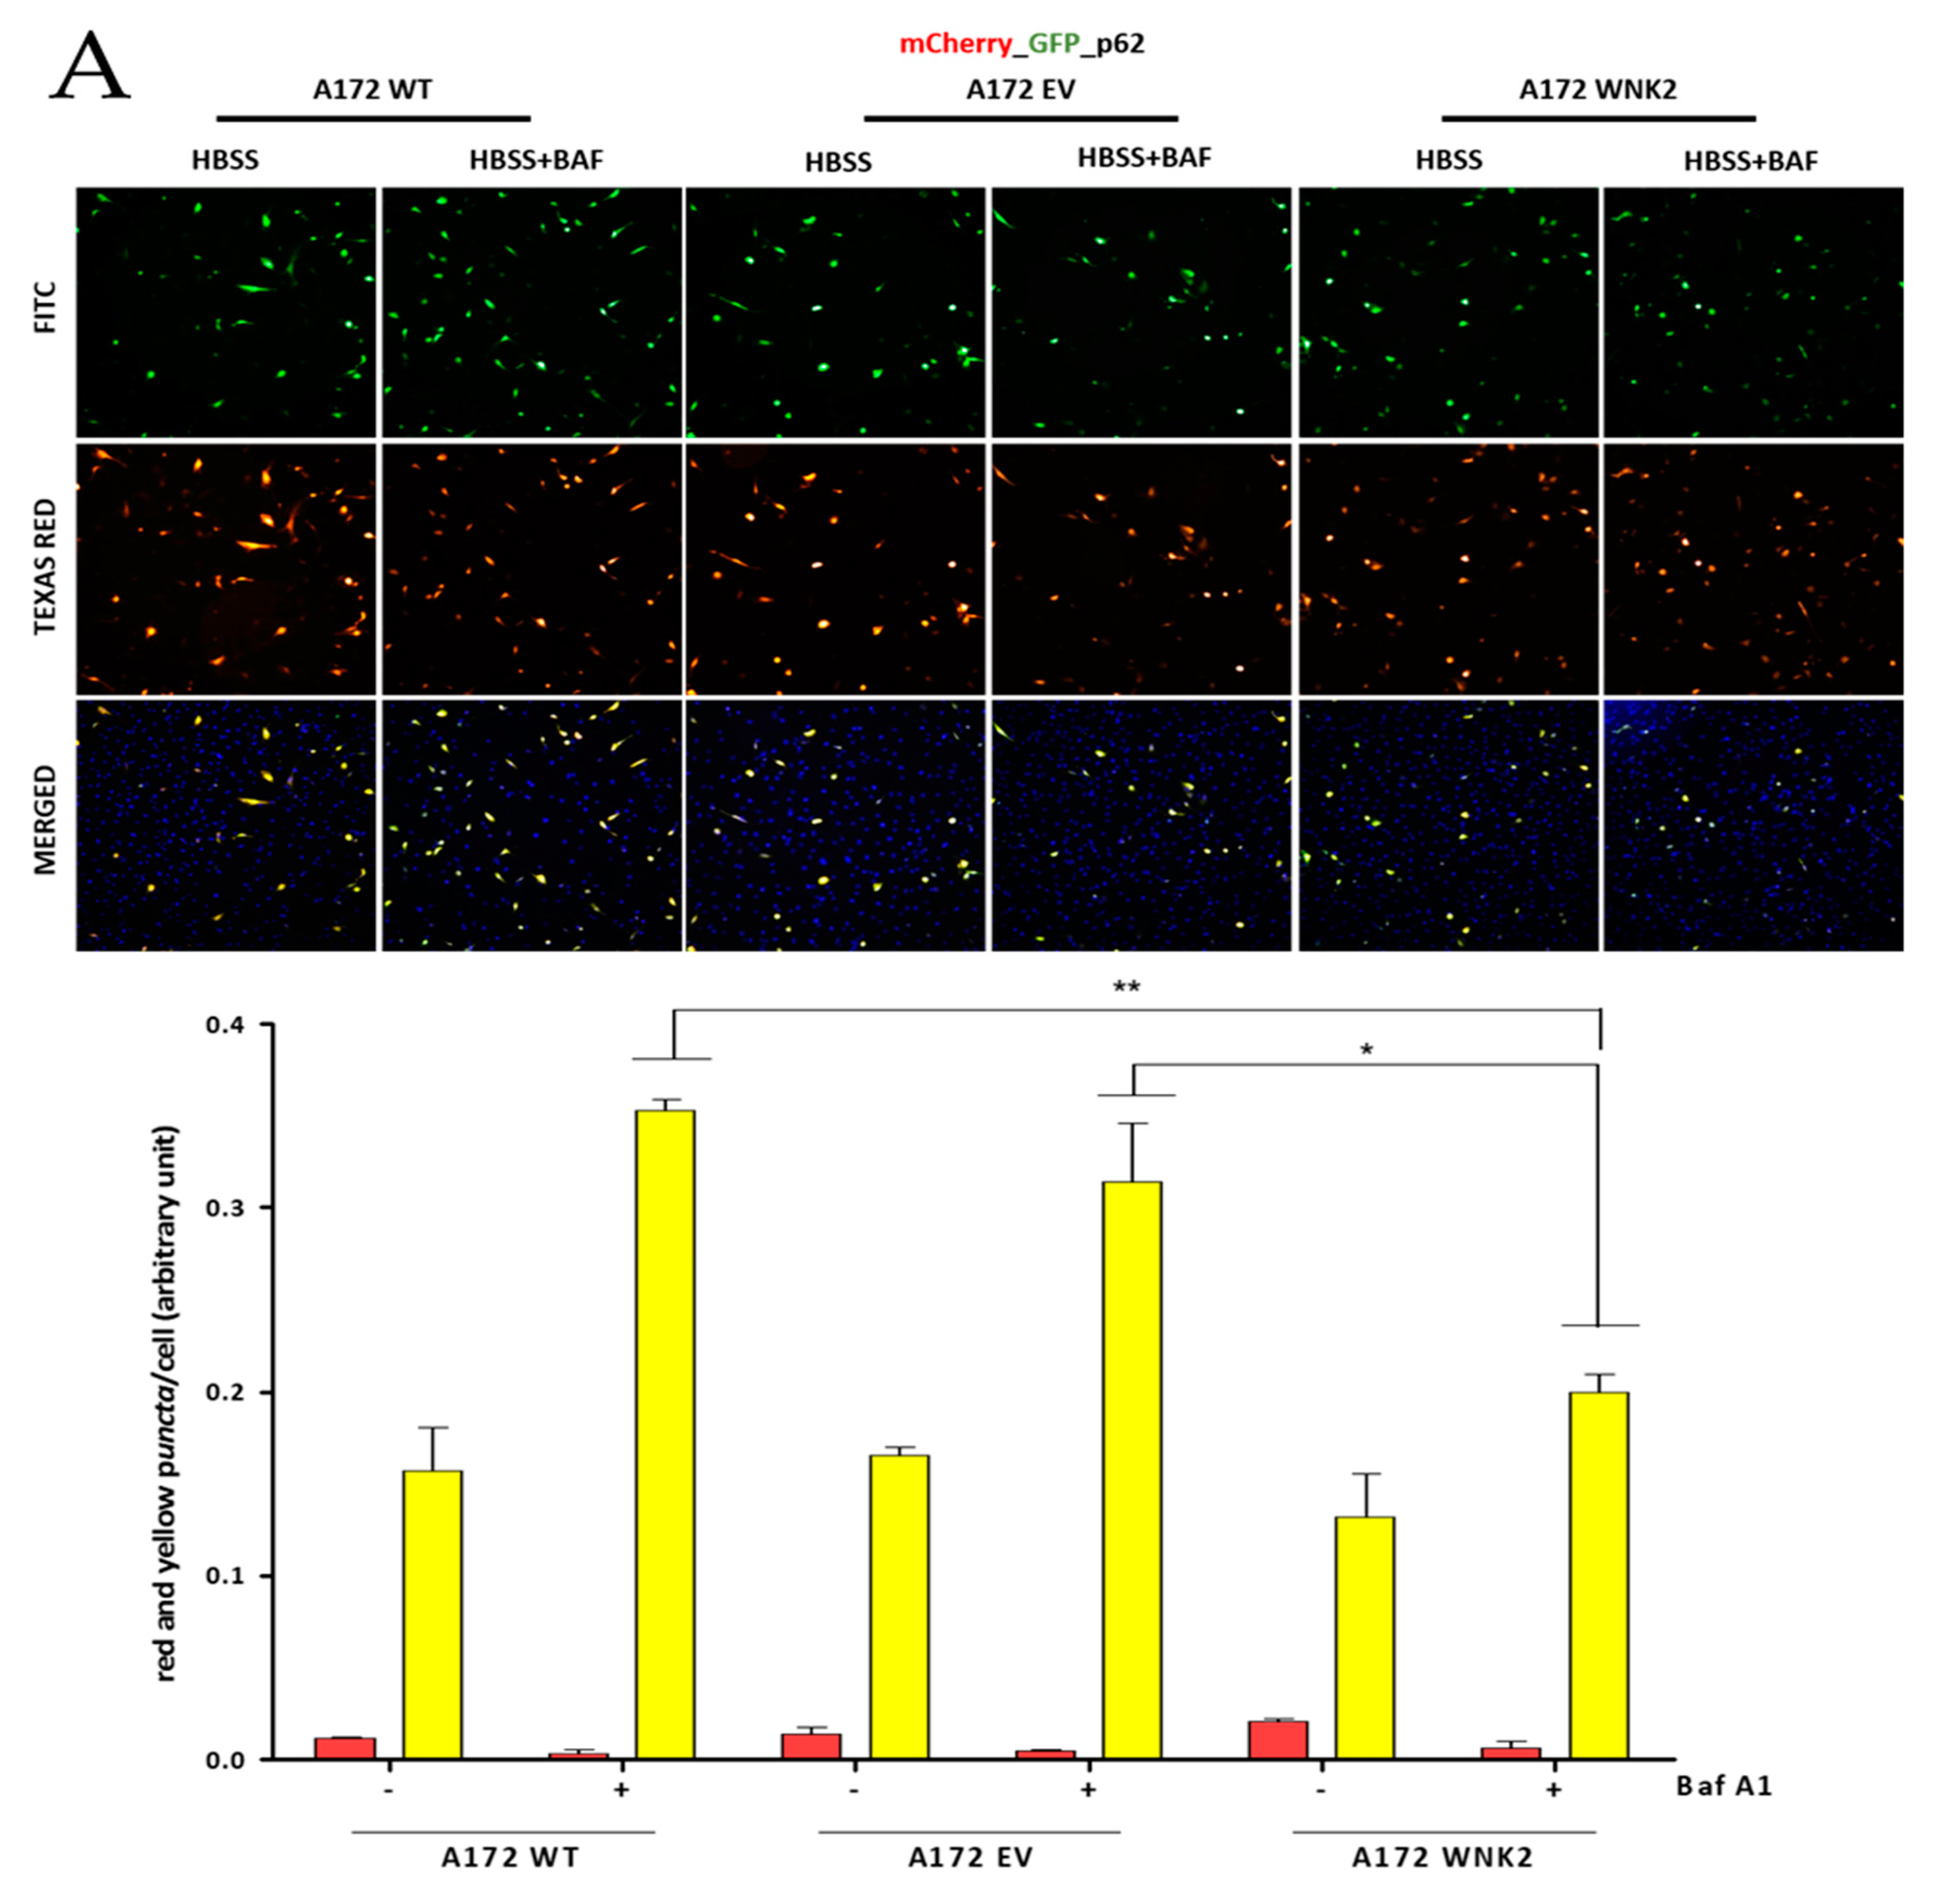
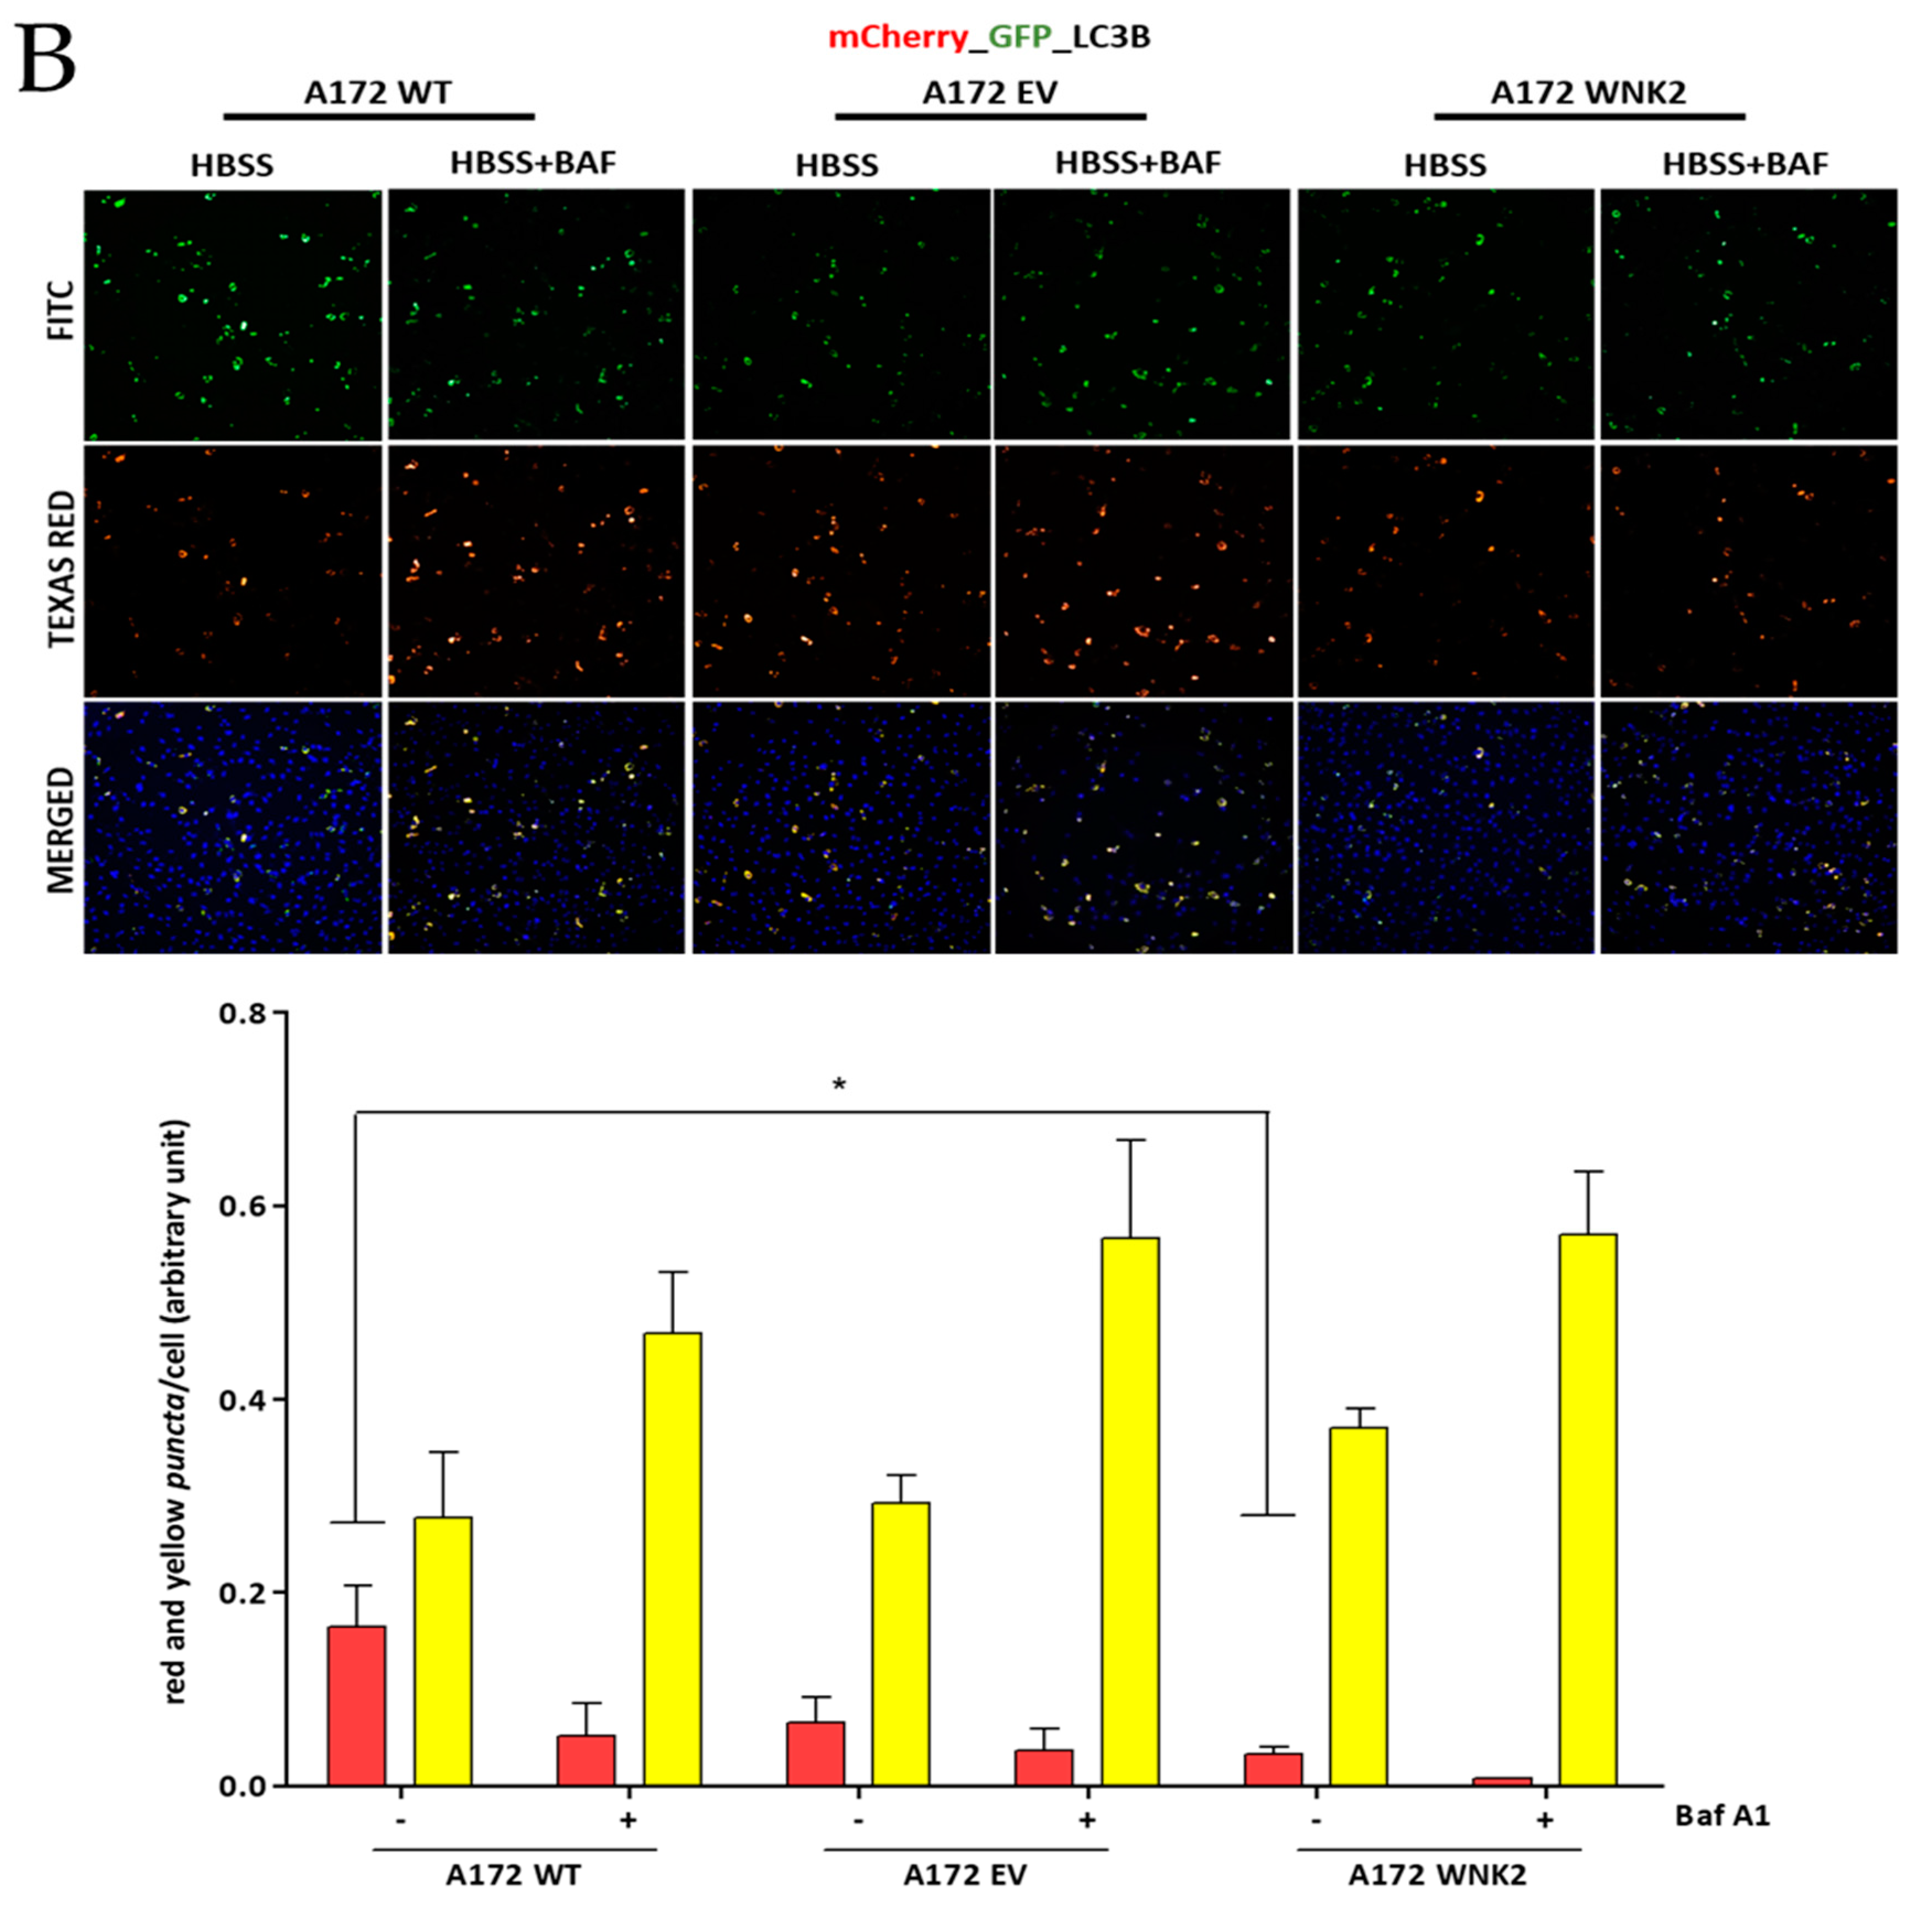
To confirm the autophagy flux inhibition observed in the WNK2 overexpressing cells, we transfected the three A172-derived cell lines with tandem conjugated pDest.mCherry-GFP-p62 and pDest.mCherry-GFP-LC3B plasmids [27] and then treated for autophagy induction with HBSS and with the autophagy flux inhibitor baf A1. In this approach, yellow signal indicates the presence of LC3B or p62 in autophagosomes, whereas red signal indicates autophagolysosomes due to loss of green fluorescence in their acidic environment. We found a marked decrease in p62-positive puncta in A172 WNK2 cells in the HBSS + baf A1 treated condition (Figure 3A). On the other hand, these cells showed no change in autophagic flux as evidenced by the number of LC3B-positive puncta when compared to control cells; however, a decrease in red dots representing autophagolysosomes was evidenced between WT and WNK2 cell line (Figure 3B).
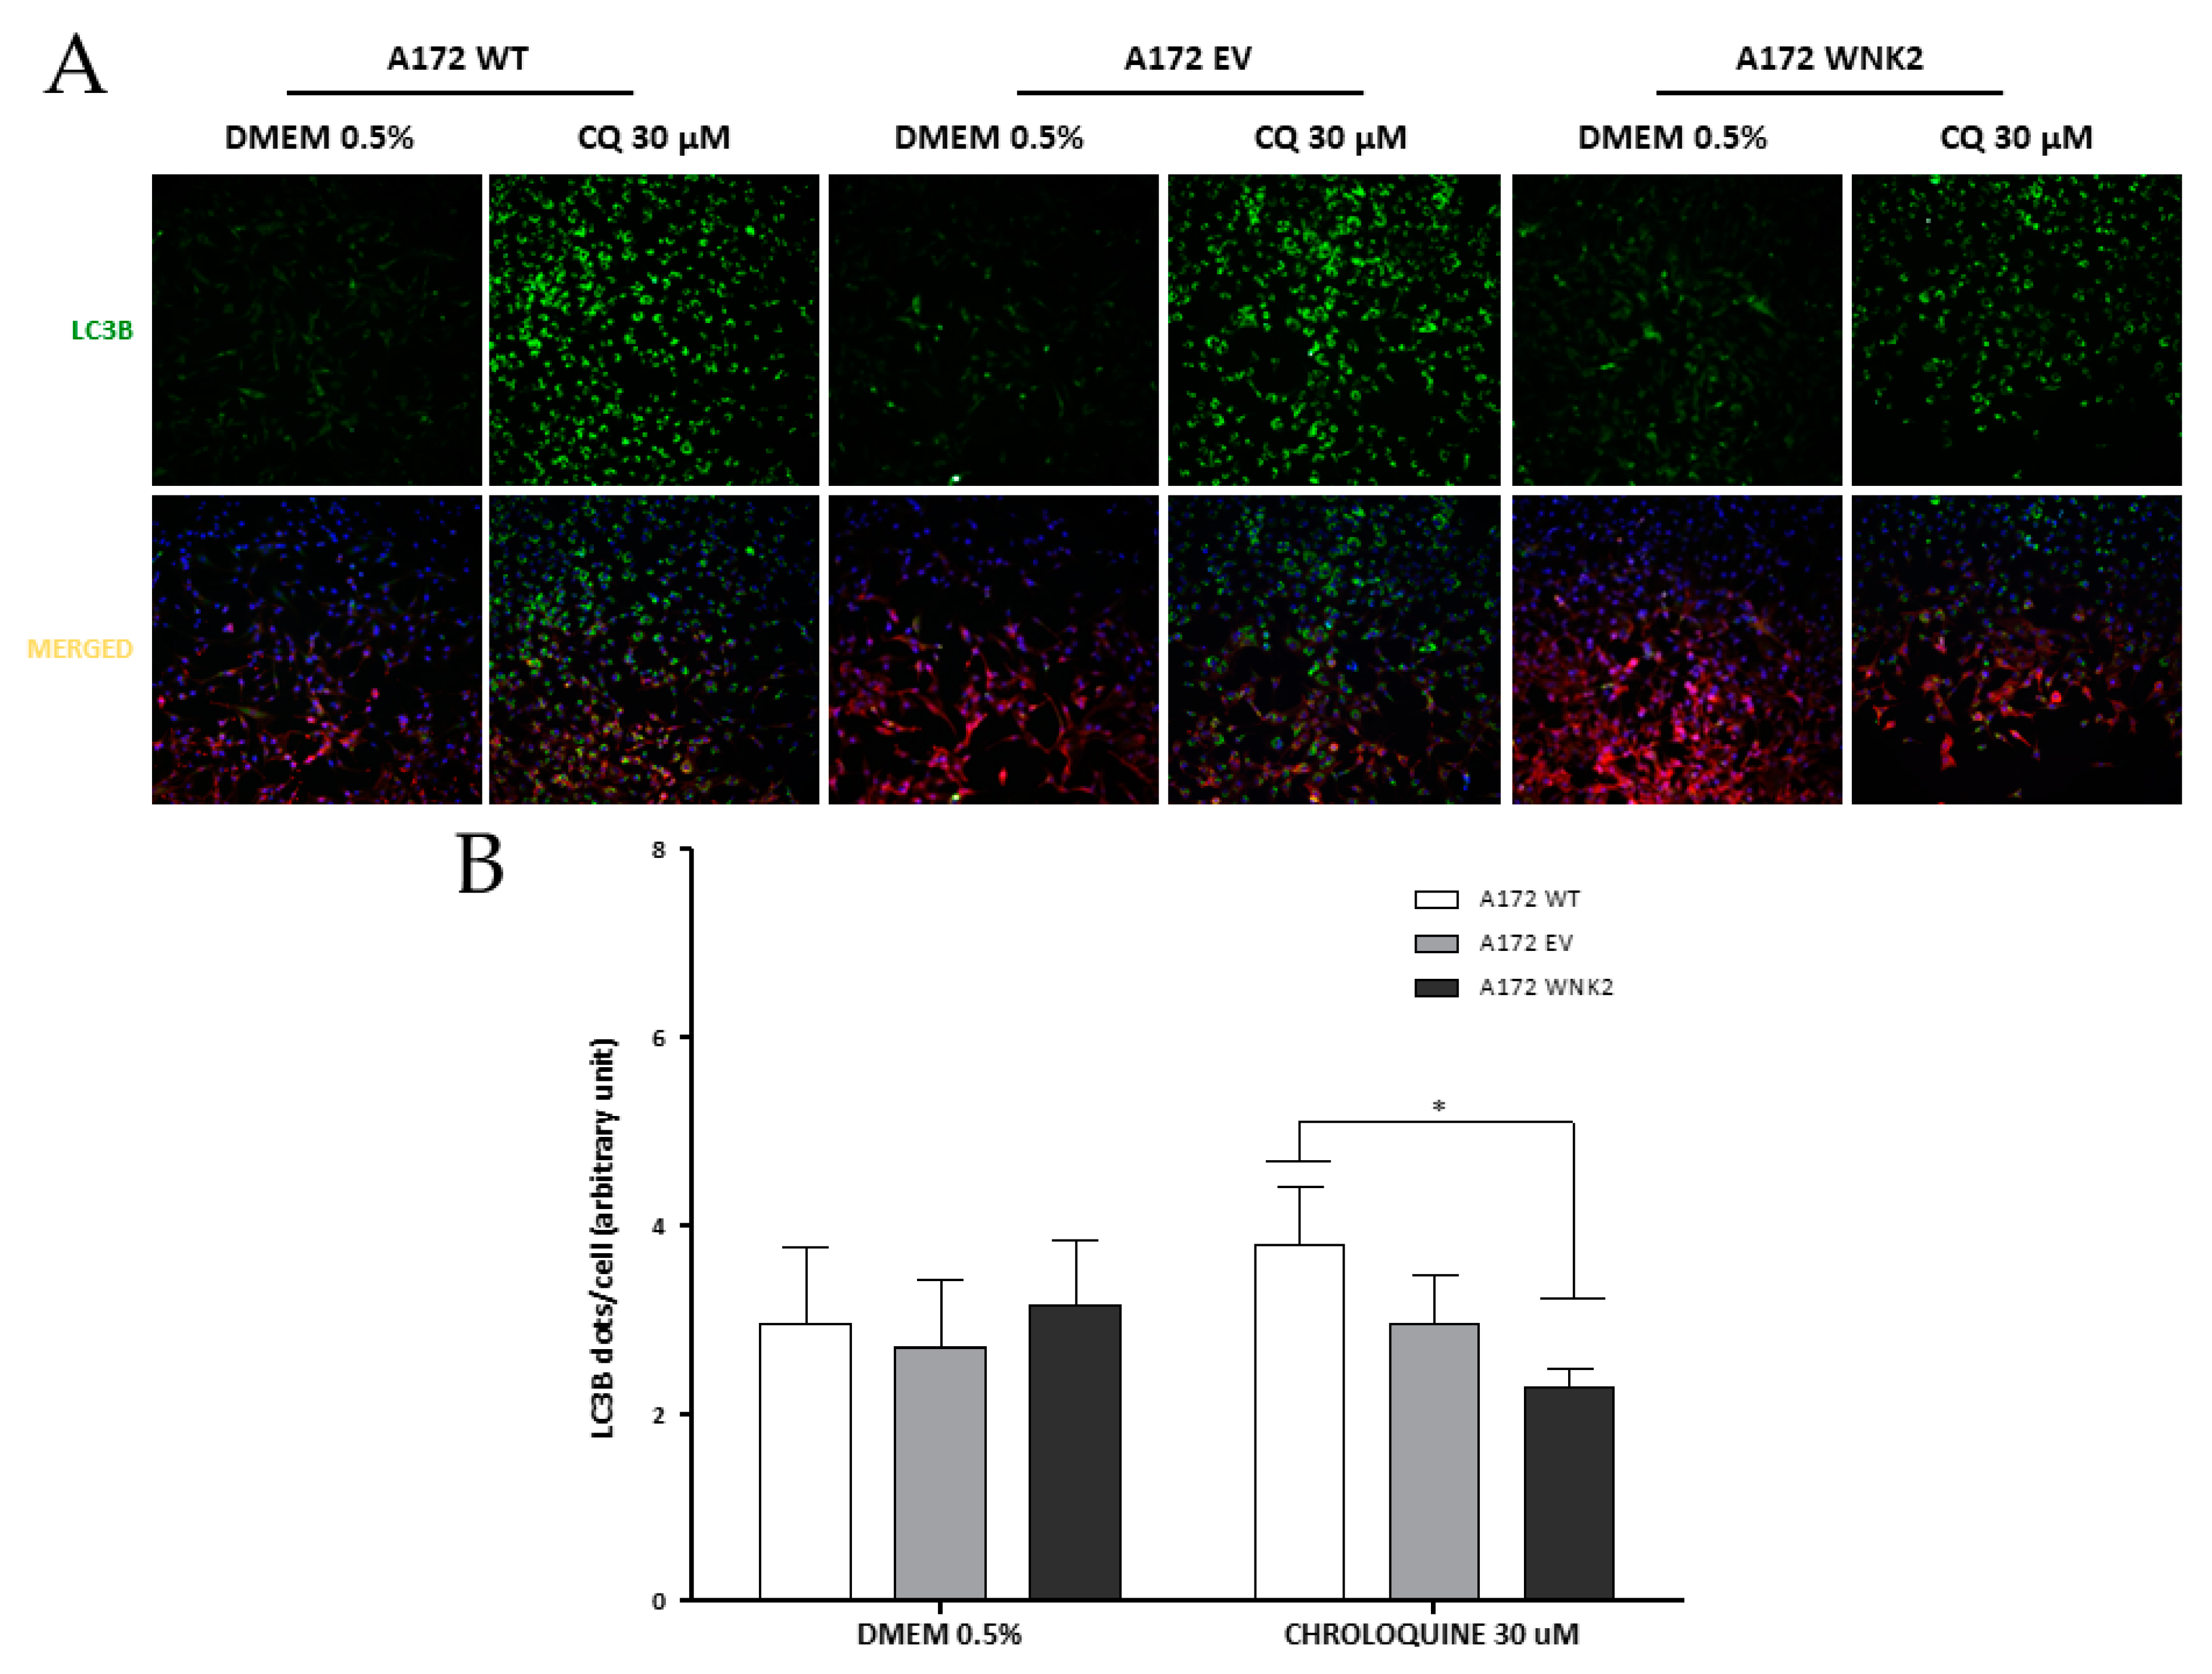
Additionally, another approach was used for evaluating autophagic flux in the edited cell lines. In these results, WNK2 overexpression changed LC3B levels after 16 h upon another autophagy inhibitor treatment, chloroquine at 30 μM (Figure 4A,B) when compared with WT cell line.
4. Discussion
The role of WNK2 in the autophagy process is still contradictory. In this study, the assessment of the autophagic process using different methodological approaches has suggested that the presence of WNK2 inhibits the autophagic flux in glioma cell lines and it is independent of the mTOR pathway.
In the autophagic process, some important markers allow to estimate autophagic activity, such as LC3 and p62. Typically, LC3A is converted to LC3B by lipidation and is present in the formation of autophagosomes [26]. p62 protein binds to ubiquitinylated proteins, that are labeled for degradation and direct them to the lysosome. Generally, p62 levels correlate inversely with autophagic activity. However, it is unclear whether p62 is degraded only by autophagy or partially by the ubiquitin-proteasome pathway [28]. Thus, p62, as well as LC3, can be transcriptionally regulated during autophagy [29]. Western blot analysis showed a significant decrease in the levels of LC3B and p62 markers after 4 and 6 h of baf A1 treatment and everolimus. In addition, immunofluorescence results demonstrated a decrease in LC3B level after CQ treatment and p62 puncta after HBSS + baf A1 treatment and although no statistical difference was found in the LC3B puncta, there was a decrease in red dots in the overexpressing WNK2 cell line when compared to the WT cell line. Previous studies point to WNK2 acting in the early stages of autophagic flux, however, with contradictory functions. Szyniarowski et al. (2011) [23] silenced WNK2 via siRNA (small interfering RNA) in MCF-7 human breast carcinoma cells and reported p62 accumulation, thus inhibiting autophagic flux [30]. Accumulation of this protein indicates defective maturation of autophagosomes [23], thus WNK2 would act as a positive regulator of the autophagic process. On the other hand, Guo et al. (2015) silenced WNK2 through shRNAs (short hairpin RNA) that induced a significant increase in LC3B by immunofluorescence [22] demonstrating that WNK2 could inhibit autophagy flux. It is noteworthy that according to Yoshii et al. (2017), cells that present a low number of positive puncta in the basal condition, as we reported, and that do not suffer alterations after treatment with baf A1 are suggestive of defects in the autophagy induction process [31].
It is known that one of the major biological changes in glioma is the alteration of the PI3K (phosphatidyl inositol 3 kinase)/AKT/mTOR pathway [32]. Inhibition of mTOR may be detected as dephosphorylation of its substrates p70S6K kinase and 4EBP1 (4E binding protein 1) [33] and are correlated with the autophagic process in gliomas [34,35]. To assess the impact of this pathway, we used treatment with the autophagic inducer (everolimus), a rapamycin analog that inhibits mTOR signaling in combination with an autophagic inhibitor (baf A1). The results suggest that WNK2-mediated autophagy inhibition occurs independently of the mTOR pathway. Previous studies relating WNK2 and autophagy have also contradicted the effect of this gene on mTOR activity. While Szyniarowski et al. (2011) did not find any effect on mTORC1 activity in breast cancer cell lines by analyzing the phosphorylation status its p70S6K [23], another study using chronic myeloid leukemia demonstrated suppressed autophagy by activating mTOR [22]. Furthermore, it was recently reported that mTOR mutations have essential implication in inducing resistance to the mTOR inhibitors preserving its activity [36], as observed in our study. One hypothesis for our findings would be that WNK2 could promote defects in the initial autophagy flux or autophagosome maturation [22,23]. During autophagosome formation PI3K activity, an upstream element in the mTOR pathway, is required and when suppressed inhibits autophagic flux. In this sense, the mechanism used by WNK2 to inhibit autophagic flux would be similar to the 3-methyladedine autophagy inhibitor (3-MA) [36].
TMZ is considered the most effective treatment drug for GBMs and its main mechanism of action is on autophagy [37,38]. However, depending on the cellular context, it has been shown that autophagy could lead to the development of resistance to TMZ treatment rather than cell death [39,40,41]. Recently, therapeutic molecules that inhibit autophagy such as CQ and hydroxychloroquine have been used in phase I/II clinical trials concomitant with TMZ treatment and radiation and have shown increased survival in patients diagnosed with GBM [15,42]. In this study, assessment of the autophagic process has suggested that the presence of WNK2 inhibits the autophagic flux in glioblastoma cell line. It will now be interesting to study the role of WNK2 in autophagic vesicular trafficking in response to therapy.
Supplementary Materials
The following are available online at https://www.mdpi.com/2073-4409/9/2/485/s1, Figure S1: Validation of WNK2 overexpression by RT-PCR.
Author Contributions
Conception or design of the work, Acquisition, Analysis and interpretation of data, Writing—original draft preparation, Final approval, A.L.V.A.; Writing—Review and Editing, Final approval, A.M.C.; Writing—Review and Editing, Final approval, O.M.; Software Analysis and interpretation of data, Writing—Review and Editing, Final approval, V.D.d.S.; Writing—Review and Editing, Final approval, P.J.; Analysis and interpretation of data, Writing—Review and Editing, Final approval, V.A.O.S.; (Corresponding author)—Conception or design of the work, Interpretation of data, Drafting the work, Supervision of study, Project Administration, Resources, Funding Acquisition, Final approval, R.M.R. All authors have read and agreed to the published version of the manuscript.
Funding
This project was supported by the Barretos Cancer Hospital Internal Research Funds (PAIP) to Rui Manuel Reis and by the Public Ministry of Labor Campinas (Research, Prevention, and Education of Occupational Cancer Project), Campinas, Brazil. Ana Laura Vieira Alves is the recipient of a FAPESP master fellowship (2016/18907-0).
Acknowledgments
José M Bravo-San Pedro (Centre de Recherche des Cordeliers, Paris, France) for all the scientific and technical support available for this study to be carried out. Terje Johansen (Molecular Cancer Research group, Institute of Medical Biology. University of Tromsø, Norway) for kindly giving the tandem plasmids used in this study.
Conflicts of Interest
The authors declare no conflict of interest.
References
- Ostrom, Q.T.; Gittleman, H.; Truitt, G.; Boscia, A.; Kruchko, C.; Barnholtz-Sloan, J.S. CBTRUS Statistical Report: Primary Brain and Other Central Nervous System Tumors Diagnosed in the United States in 2011-2015. Neuro-Oncology 2018, 20, iv1–iv86. [Google Scholar] [CrossRef] [PubMed] [Green Version]
- Omuro, A.; DeAngelis, L.M. Glioblastoma and other malignant gliomas: A clinical review. JAMA 2013, 310, 1842–1850. [Google Scholar] [CrossRef] [PubMed]
- Zhu, Y.; Parada, L.F. The molecular and genetic basis of neurological tumours. Nat. Rev. Cancer 2002, 2, 616–626. [Google Scholar] [CrossRef] [PubMed]
- Cruceru, M.L.; Neagu, M.; Demoulin, J.B.; Constantinescu, S.N. Therapy targets in glioblastoma and ncancer stem cells: Lessons from haematopoietic neoplasms. J. Cell. Mol. Med. 2013, 17, 1218–1235. [Google Scholar] [CrossRef]
- Lapointe, S.; Perry, A.; Butowski, N.A. Primary brain tumours in adults. Lancet 2018, 392, 432–446. [Google Scholar] [CrossRef]
- Stupp, R.; Mason, W.P.; van den Bent, M.J.; Weller, M.; Fisher, B.; Taphoorn, M.J.; Belanger, K.; Brandes, A.A.; Marosi, C.; Bogdahn, U.; et al. Radiotherapy plus concomitant and adjuvant temozolomide for glioblastoma. New Engl. J. Med. 2005, 352, 987–996. [Google Scholar] [CrossRef]
- Mizushima, N.; Levine, B. Autophagy in mammalian development and differentiation. Nat. Cell Biol. 2010, 12, 823–830. [Google Scholar] [CrossRef]
- Yuanchao, S.; Xunsi, Q.; Hong, C.; Wei, S. Epigenetic control of autophagy. Yi Chuan Hered. 2014, 36, 447–455. [Google Scholar]
- Yan, Y.; Xu, Z.; Dai, S.; Qian, L.; Sun, L.; Gong, Z. Targeting autophagy to sensitive glioma to temozolomide treatment. J. Exp. Clin. Cancer Res. 2016, 35, 23. [Google Scholar] [CrossRef] [Green Version]
- Eskelinen, E.L. The dual role of autophagy in cancer. Curr. Opin. Pharmacol. 2011, 11, 294–300. [Google Scholar] [CrossRef]
- Notte, A.; Leclere, L.; Michiels, C. Autophagy as a mediator of chemotherapy-induced cell death in cancer. Biochem. Pharmacol. 2011, 82, 427–434. [Google Scholar] [CrossRef] [PubMed] [Green Version]
- Mathew, R.; Karantza-Wadsworth, V.; White, E. Role of autophagy in cancer. Nat. Rev. Cancer 2007, 7, 961–967. [Google Scholar] [CrossRef] [PubMed]
- Kroemer, G.; Levine, B. Autophagic cell death: The story of a misnomer. Nat. Rev. Mol. Cell Biol. 2008, 9, 1004–1010. [Google Scholar] [CrossRef] [PubMed]
- Jiang, H.; White, E.J.; Conrad, C.; Gomez-Manzano, C.; Fueyo, J. Autophagy pathways in glioblastoma. Methods Enzymol. 2009, 453, 273–286. [Google Scholar] [CrossRef] [PubMed]
- Golden, E.B.; Cho, H.Y.; Jahanian, A.; Hofman, F.M.; Louie, S.G.; Schonthal, A.H.; Chen, T.C. Chloroquine enhances temozolomide cytotoxicity in malignant gliomas by blocking autophagy. Neurosurg. Focus 2014, 37, E12. [Google Scholar] [CrossRef] [PubMed] [Green Version]
- Hong, C.; Moorefield, K.S.; Jun, P.; Aldape, K.D.; Kharbanda, S.; Phillips, H.S.; Costello, J.F. Epigenome scans and cancer genome sequencing converge on WNK2, a kinase-independent suppressor of cell growth. Proc. Natl. Acad. Sci. USA 2007, 104, 10974–10979. [Google Scholar] [CrossRef] [Green Version]
- Jun, P.; Hong, C.; Lal, A.; Wong, J.M.; McDermott, M.W.; Bollen, A.W.; Plass, C.; Held, W.A.; Smiraglia, D.J.; Costello, J.F. Epigenetic silencing of the kinase tumor suppressor WNK2 is tumor-type and tumor-grade specific. Neuro-Oncology 2009, 11, 414–422. [Google Scholar] [CrossRef] [Green Version]
- Moniz, S.; Martinho, O.; Pinto, F.; Sousa, B.; Loureiro, C.; Oliveira, M.J.; Moita, L.F.; Honavar, M.; Pinheiro, C.; Pires, M.; et al. Loss of WNK2 expression by promoter gene methylation occurs in adult gliomas and triggers Rac1-mediated tumour cell invasiveness. Hum. Mol. Genet. 2013, 22, 84–95. [Google Scholar] [CrossRef] [Green Version]
- Moniz, S.; Verissimo, F.; Matos, P.; Brazao, R.; Silva, E.; Kotelevets, L.; Chastre, E.; Gespach, C.; Jordan, P. Protein kinase WNK2 inhibits cell proliferation by negatively modulating the activation of MEK1/ERK1/2. Oncogene 2007, 26, 6071–6081. [Google Scholar] [CrossRef] [Green Version]
- Moniz, S.; Matos, P.; Jordan, P. WNK2 modulates MEK1 activity through the Rho GTPase pathway. Cell. Signal. 2008, 20, 1762–1768. [Google Scholar] [CrossRef]
- Costa, A.M.; Pinto, F.; Martinho, O.; Oliveira, M.J.; Jordan, P.; Reis, R.M. Silencing of the tumor suppressor gene WNK2 is associated with upregulation of MMP2 and JNK in gliomas. Oncotarget 2015, 6, 1422–1434. [Google Scholar] [CrossRef] [PubMed] [Green Version]
- Guo, S.; Liang, Y.; Murphy, S.F.; Huang, A.; Shen, H.; Kelly, D.F.; Sobrado, P.; Sheng, Z. A rapid and high content assay that measures cyto-ID-stained autophagic compartments and estimates autophagy flux with potential clinical applications. Autophagy 2015, 11, 560–572. [Google Scholar] [CrossRef] [PubMed] [Green Version]
- Szyniarowski, P.; Corcelle-Termeau, E.; Farkas, T.; Hoyer-Hansen, M.; Nylandsted, J.; Kallunki, T.; Jaattela, M. A comprehensive siRNA screen for kinases that suppress macroautophagy in optimal growth conditions. Autophagy 2011, 7, 892–903. [Google Scholar] [CrossRef] [PubMed] [Green Version]
- Silva-Oliveira, R.J.; Silva, V.A.; Martinho, O.; Cruvinel-Carloni, A.; Melendez, M.E.; Rosa, M.N.; de Paula, F.E.; de Souza Viana, L.; Carvalho, A.L.; Reis, R.M. Cytotoxicity of allitinib, an irreversible anti-EGFR agent, in a large panel of human cancer-derived cell lines: KRAS mutation status as a predictive biomarker. Cell. Oncol. 2016, 39, 253–263. [Google Scholar] [CrossRef] [PubMed]
- Teixeira, T.L.; Oliveira Silva, V.A.; da Cunha, D.B.; Polettini, F.L.; Thomaz, C.D.; Pianca, A.A.; Zambom, F.L.; da Silva Leitao Mazzi, D.P.; Reis, R.M.; Mazzi, M.V. Isolation, characterization and screening of the in vitro cytotoxic activity of a novel L-amino acid oxidase (LAAOcdt) from Crotalus durissus terrificus venom on human cancer cell lines. Toxicon 2016, 119, 203–217. [Google Scholar] [CrossRef] [PubMed]
- Klionsky, D.J.; Abdelmohsen, K.; Abe, A.; Abedin, M.J.; Abeliovich, H.; Acevedo Arozena, A.; Adachi, H.; Adams, C.M.; Adams, P.D.; Adeli, K.; et al. Guidelines for the use and interpretation of assays for monitoring autophagy (3rd edition). Autophagy 2016, 12, 1–222. [Google Scholar] [CrossRef] [Green Version]
- Bravo-San Pedro, J.M.; Niso-Santano, M.; Gomez-Sanchez, R.; Pizarro-Estrella, E.; Aiastui-Pujana, A.; Gorostidi, A.; Climent, V.; Lopez de Maturana, R.; Sanchez-Pernaute, R.; Lopez de Munain, A.; et al. The LRRK2 G2019S mutant exacerbates basal autophagy through activation of the MEK/ERK pathway. Cell. Mol. Life Sci. 2013, 70, 121–136. [Google Scholar] [CrossRef]
- Mizushima, N.; Yoshimori, T.; Levine, B. Methods in mammalian autophagy research. Cell 2010, 140, 313–326. [Google Scholar] [CrossRef] [Green Version]
- He, C.; Klionsky, D.J. Regulation mechanisms and signaling pathways of autophagy. Annu. Rev. Genet. 2009, 43, 67–93. [Google Scholar] [CrossRef] [Green Version]
- Pankiv, S.; Clausen, T.H.; Lamark, T.; Brech, A.; Bruun, J.A.; Outzen, H.; Overvatn, A.; Bjorkoy, G.; Johansen, T. p62/SQSTM1 binds directly to Atg8/LC3 to facilitate degradation of ubiquitinated protein aggregates by autophagy. J. Biol. Chem. 2007, 282, 24131–24145. [Google Scholar] [CrossRef] [Green Version]
- Yoshii, S.R.; Mizushima, N. Monitoring and Measuring Autophagy. Int. J. Mol. Sci. 2017, 18. [Google Scholar] [CrossRef] [PubMed]
- Furnari, F.B.; Fenton, T.; Bachoo, R.M.; Mukasa, A.; Stommel, J.M.; Stegh, A.; Hahn, W.C.; Ligon, K.L.; Louis, D.N.; Brennan, C.; et al. Malignant astrocytic glioma: Genetics, biology, and paths to treatment. Genes Dev. 2007, 21, 2683–2710. [Google Scholar] [CrossRef] [PubMed] [Green Version]
- Saxton, R.A.; Sabatini, D.M. mTOR Signaling in Growth, Metabolism, and Disease. Cell 2017, 168, 960–976. [Google Scholar] [CrossRef] [PubMed] [Green Version]
- Ito, H.; Daido, S.; Kanzawa, T.; Kondo, S.; Kondo, Y. Radiation-induced autophagy is associated with LC3 and its inhibition sensitizes malignant glioma cells. Int. J. Oncol. 2005, 26, 1401–1410. [Google Scholar] [CrossRef]
- Iwamaru, A.; Kondo, Y.; Iwado, E.; Aoki, H.; Fujiwara, K.; Yokoyama, T.; Mills, G.B.; Kondo, S. Silencing mammalian target of rapamycin signaling by small interfering RNA enhances rapamycin-induced autophagy in malignant glioma cells. Oncogene 2007, 26, 1840–1851. [Google Scholar] [CrossRef] [Green Version]
- Murugan, A.K. mTOR: Role in cancer, metastasis and drug resistance. Semin. Cancer Biol. 2019. [Google Scholar] [CrossRef]
- Sui, X.; Chen, R.; Wang, Z.; Huang, Z.; Kong, N.; Zhang, M.; Han, W.; Lou, F.; Yang, J.; Zhang, Q.; et al. Autophagy and chemotherapy resistance: A promising therapeutic target for cancer treatment. Cell Death Dis. 2013, 4, e838. [Google Scholar] [CrossRef]
- Li, S.; Jiang, T.; Li, G.; Wang, Z. Impact of p53 status to response of temozolomide in low MGMT expression glioblastomas: Preliminary results. Neurol. Res. 2008, 30, 567–570. [Google Scholar] [CrossRef]
- Carmo, A.; Carvalheiro, H.; Crespo, I.; Nunes, I.; Lopes, M.C. Effect of temozolomide on the U-118 glioma cell line. Oncol. Lett. 2011, 2, 1165–1170. [Google Scholar] [CrossRef] [Green Version]
- Kanzawa, T.; Germano, I.M.; Komata, T.; Ito, H.; Kondo, Y.; Kondo, S. Role of autophagy in temozolomide-induced cytotoxicity for malignant glioma cells. Cell Death Differ. 2004, 11, 448–457. [Google Scholar] [CrossRef] [Green Version]
- Filippi-Chiela, E.C.; Bueno e Silva, M.M.; Thome, M.P.; Lenz, G. Single-cell analysis challenges the connection between autophagy and senescence induced by DNA damage. Autophagy 2015, 11, 1099–1113. [Google Scholar] [CrossRef] [PubMed] [Green Version]
- Rosenfeld, M.R.; Ye, X.; Supko, J.G.; Desideri, S.; Grossman, S.A.; Brem, S.; Mikkelson, T.; Wang, D.; Chang, Y.C.; Hu, J.; et al. A phase I/II trial of hydroxychloroquine in conjunction with radiation therapy and concurrent and adjuvant temozolomide in patients with newly diagnosed glioblastoma multiforme. Autophagy 2014, 10, 1359–1368. [Google Scholar] [CrossRef] [PubMed]
Figure 1.
Evaluation of LC3B and p62 proteins by western blot. A172 WT, A172 EV, and A172 WNK2 cell lines were treated with bafilomycin A1 (BAF, 20 nM), starvation (EBSS medium), everolimus (EVERO, 10 nM), or the combination BAF+EVERO for 4 (A) or 6 h (B). The graphs are representative of three independent biological experiments. β-actin protein was used as an endogenous loading control. Symbols mean (*) p < 0.05; (**) p < 0.01; (***) p < 0.001.

Figure 2.
Evaluation of proteins involved in mammalian target of rapamycin (mTOR) pathway by western blot. A172 WT, A172 EV, and A172 WNK2 cell lines were treated with bafilomycin A1 (BAF, 20 nM), starvation (EBSS medium), or everolimus (EVERO, 10 nM) for 4 (A) and 6 h (B). The protein extract was evaluated for phosphorylation of mTOR and its substrates p-p70S6K and p-4EBP1 by western blot. Normalized densitometric band intensities of mTOR activity used α-tubulin as an endogenous loading control. For the substrates p-p70S6K and p-4EBP1, β-actin was used as an endogenous control. The graphs are representative of two independent biological experiments. n.s.: Not significant.

Figure 3.
Evaluation of LC3B and p62 proteins by using transient transfection with pDest.mCherry-GFP-LC3B and pDest.mCherry-GFP-p62 plasmids. A172 WT, A172 EV, and A172 WNK2 cell lines were transfected with plasmid pDest.mCherry-GFP-LC3B (A) or pDest.mCherry-GFP-p62 (B) and then treated for 24 h with bafilomycin A1 (baf A1). Hoechst (DAPI) treatment indicates nuclear staining by blue fluorescence. FITC indicates green fluorescence and Texas Red indicates red fluorescence wavelengths by the In Cell Analyzer platform. In the figures, yellow dots indicate the presence of LC3B or p62 in autophagosomes, whereas red dots indicate autophagolysosomes due to loss of green fluorescence in an acidic environment. In the graphics, the yellow and red bars indicate the quantification of autophagossomos and autophagolysosomes, respectively, observed in the merged. The graphs are representative of two independent biological experiments. Images were quantified using Image-Pro software. Symbols mean (*) p < 0.05; (**) p < 0.01; (***) p < 0.001. (+) means presence of baf A1; (-) means absence of baf A1.


Figure 4.
Evaluation of the effect of WNK2 overexpression on the autophagic process after chloroquine (CQ) treatment. (A) A172 WT, A172 EV, and A172 WNK2 cell lines were treated with DMEM 0.5% FBS for control conditions and to induce autophagy with the autophagy flux inhibitor chloroquine (CQ, 30 μM) for 16 h after a 3-h starvation period. Images were acquired at DAPI (blue, nuclei), FITC (green, LC3 dots), and CY3 (red, cytoplasm) wavelengths by the In Cell Analyzer platform. (B) Graph of the quantification of LC3B vesicles in merged after control condition and treatment with CQ for 16 h. The graphs are representative of three independent biological experiments. The quantification of images was realized in Image-Pro software. Symbols mean (*) p < 0.05; (**) p < 0.01; (***) p < 0.001.

© 2020 by the authors. Licensee MDPI, Basel, Switzerland. This article is an open access article distributed under the terms and conditions of the Creative Commons Attribution (CC BY) license (http://creativecommons.org/licenses/by/4.0/).
Share and Cite
MDPI and ACS Style
Alves, A.L.V.; Costa, A.M.; Martinho, O.; da Silva, V.D.; Jordan, P.; Silva, V.A.O.; Reis, R.M. WNK2 Inhibits Autophagic Flux in Human Glioblastoma Cell Line. Cells 2020, 9, 485. https://doi.org/10.3390/cells9020485
AMA Style
Alves ALV, Costa AM, Martinho O, da Silva VD, Jordan P, Silva VAO, Reis RM. WNK2 Inhibits Autophagic Flux in Human Glioblastoma Cell Line. Cells. 2020; 9(2):485. https://doi.org/10.3390/cells9020485
Chicago/Turabian StyleAlves, Ana Laura Vieira, Angela Margarida Costa, Olga Martinho, Vinicius Duval da Silva, Peter Jordan, Viviane Aline Oliveira Silva, and Rui Manuel Reis. 2020. "WNK2 Inhibits Autophagic Flux in Human Glioblastoma Cell Line" Cells 9, no. 2: 485. https://doi.org/10.3390/cells9020485
Note that from the first issue of 2016, this journal uses article numbers instead of page numbers. See further details here.