Involvement of the Gap Junction Protein, Connexin43, in the Formation and Function of Invadopodia in the Human U251 Glioblastoma Cell Line

 and
and 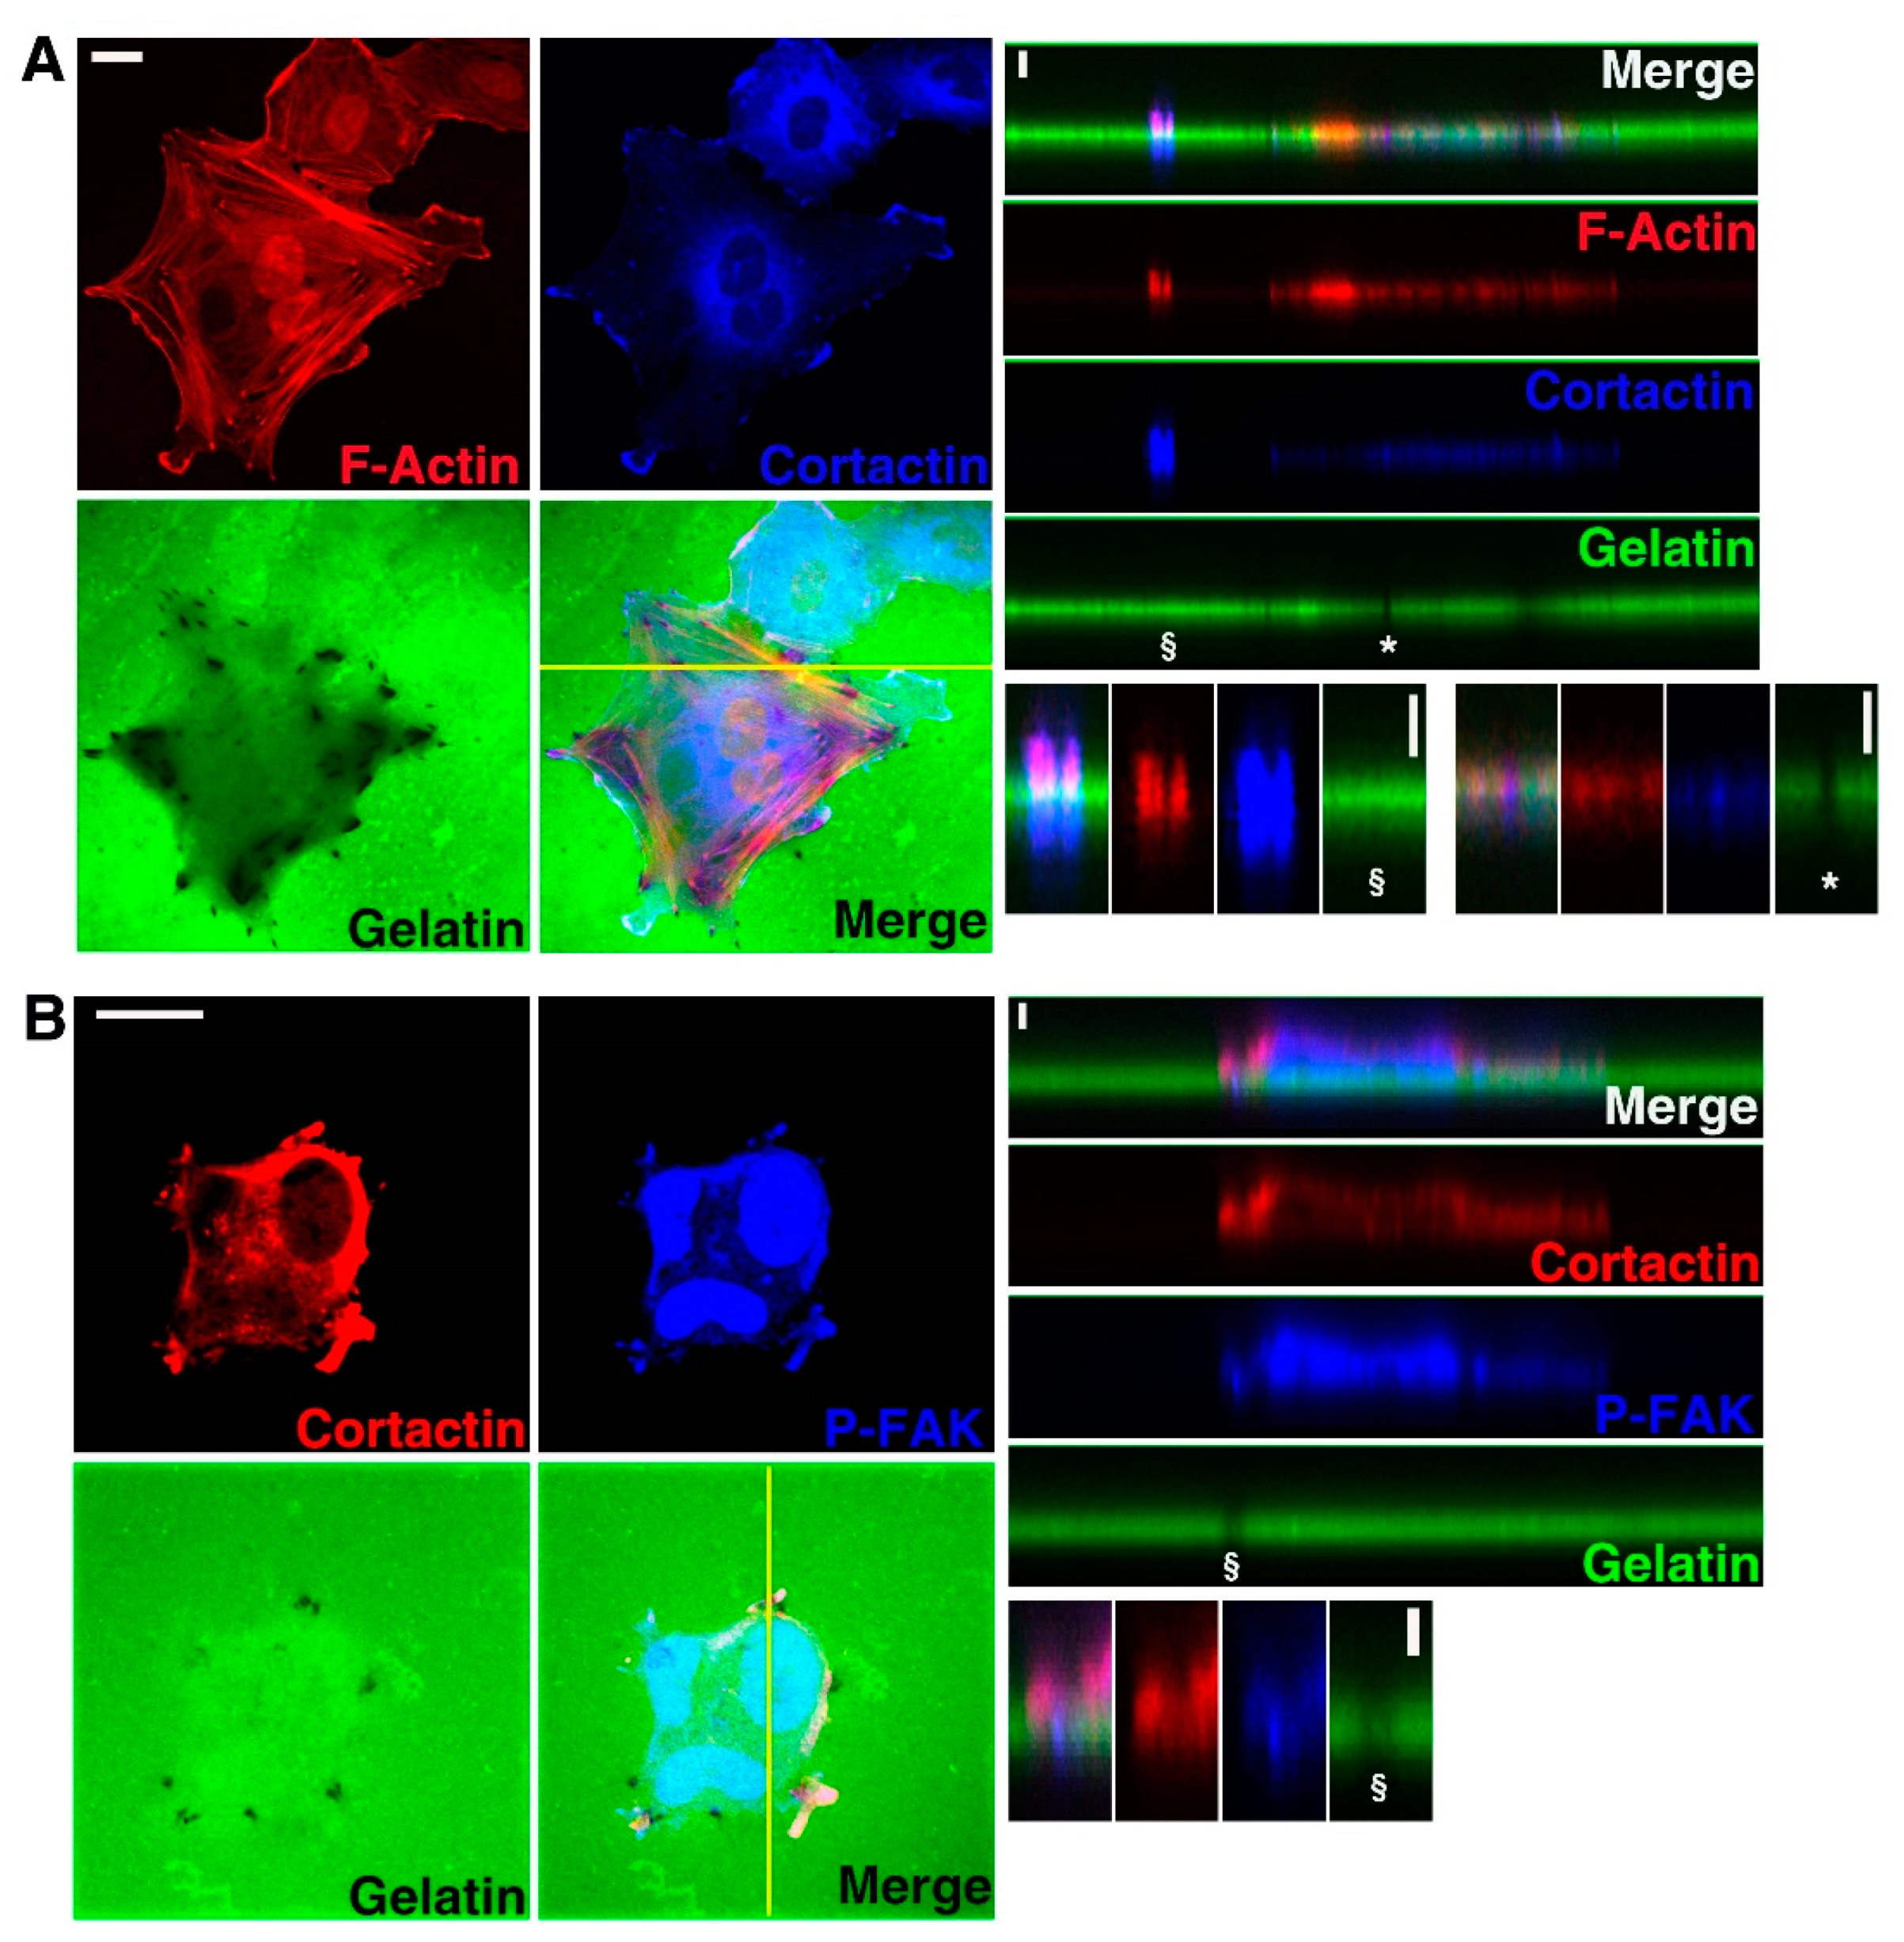
Abstract
:1. Introduction
2. Materials and Methods
2.1. Antibodies
2.2. Cell Culture Conditions
2.3. Quantitative Real-Time PCR
2.4. Western Blot
2.5. Fluorescent-Gelatin Degradation Assay
2.6. Invadopodia Synchronization
2.7. Indirect Immunofluorescence
2.8. Confocal Fluorescence Microscopy
2.9. Co-Immunoprecipitation
2.10. Zymography
2.11. Dye Uptake Assay
2.12. Statistical Analyses
3. Results
3.1. U251 Cells form Invadopodia
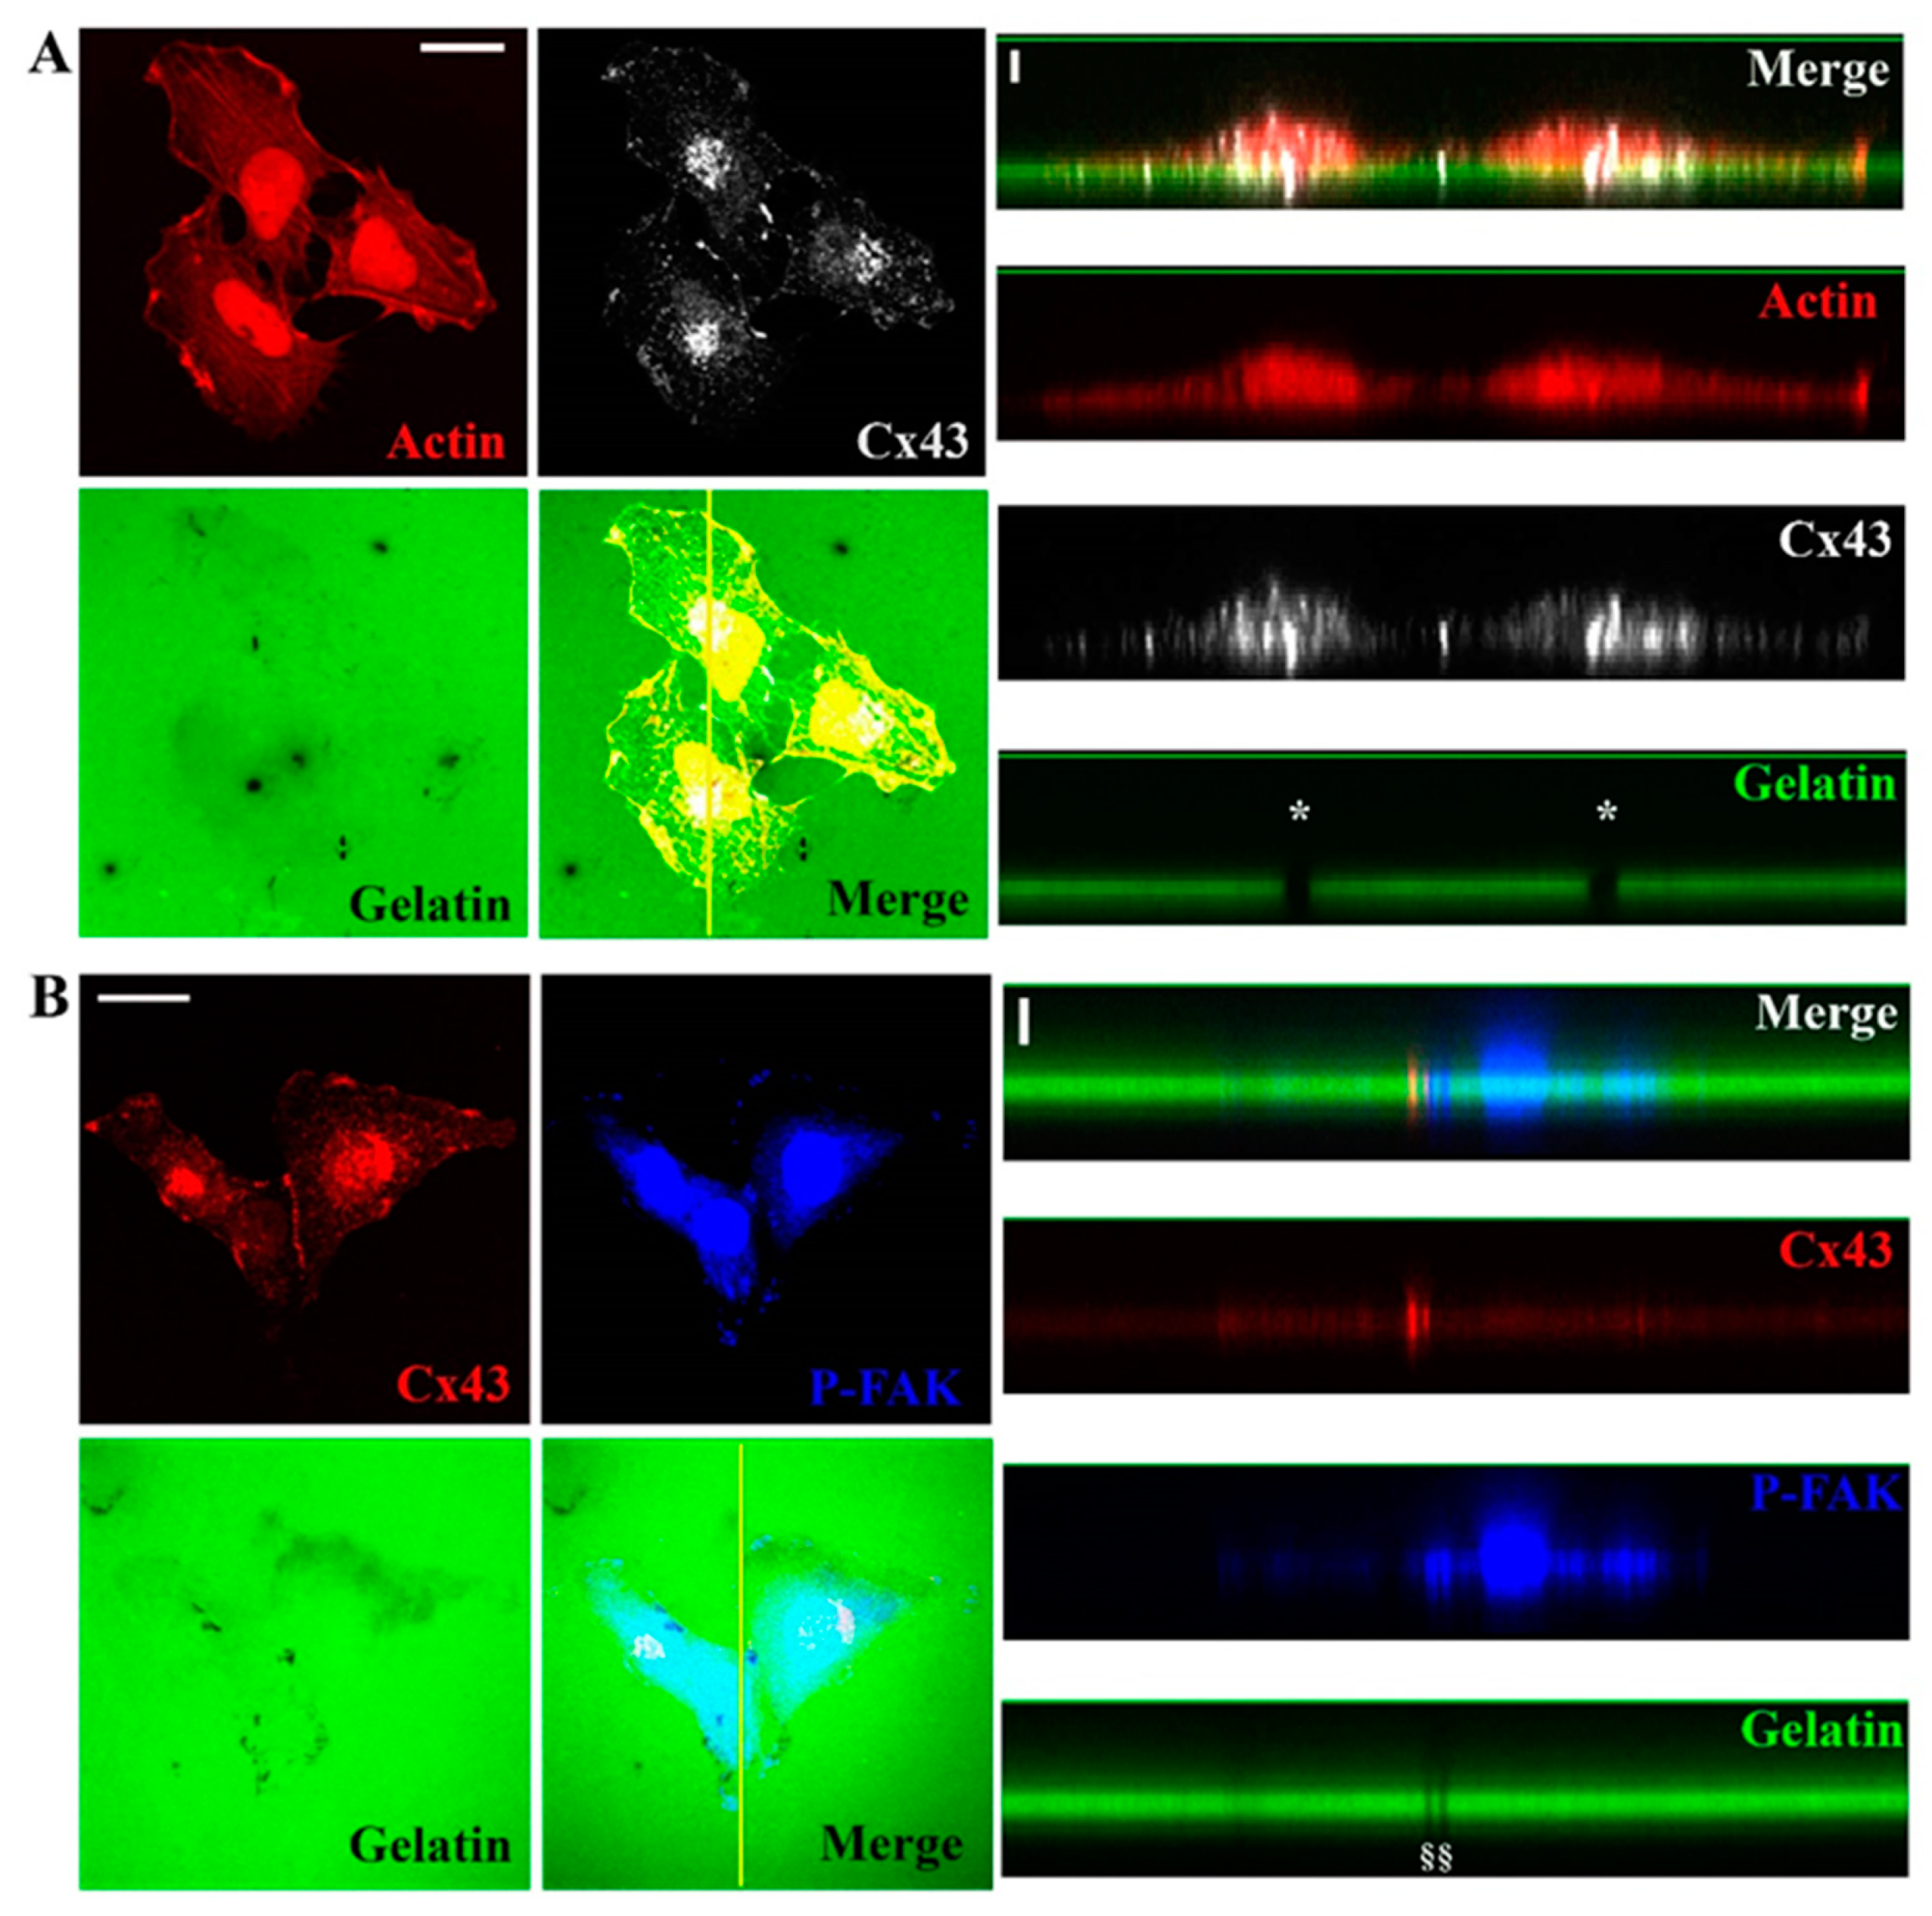
3.2. Cx43 Is A Component of Invadopodia
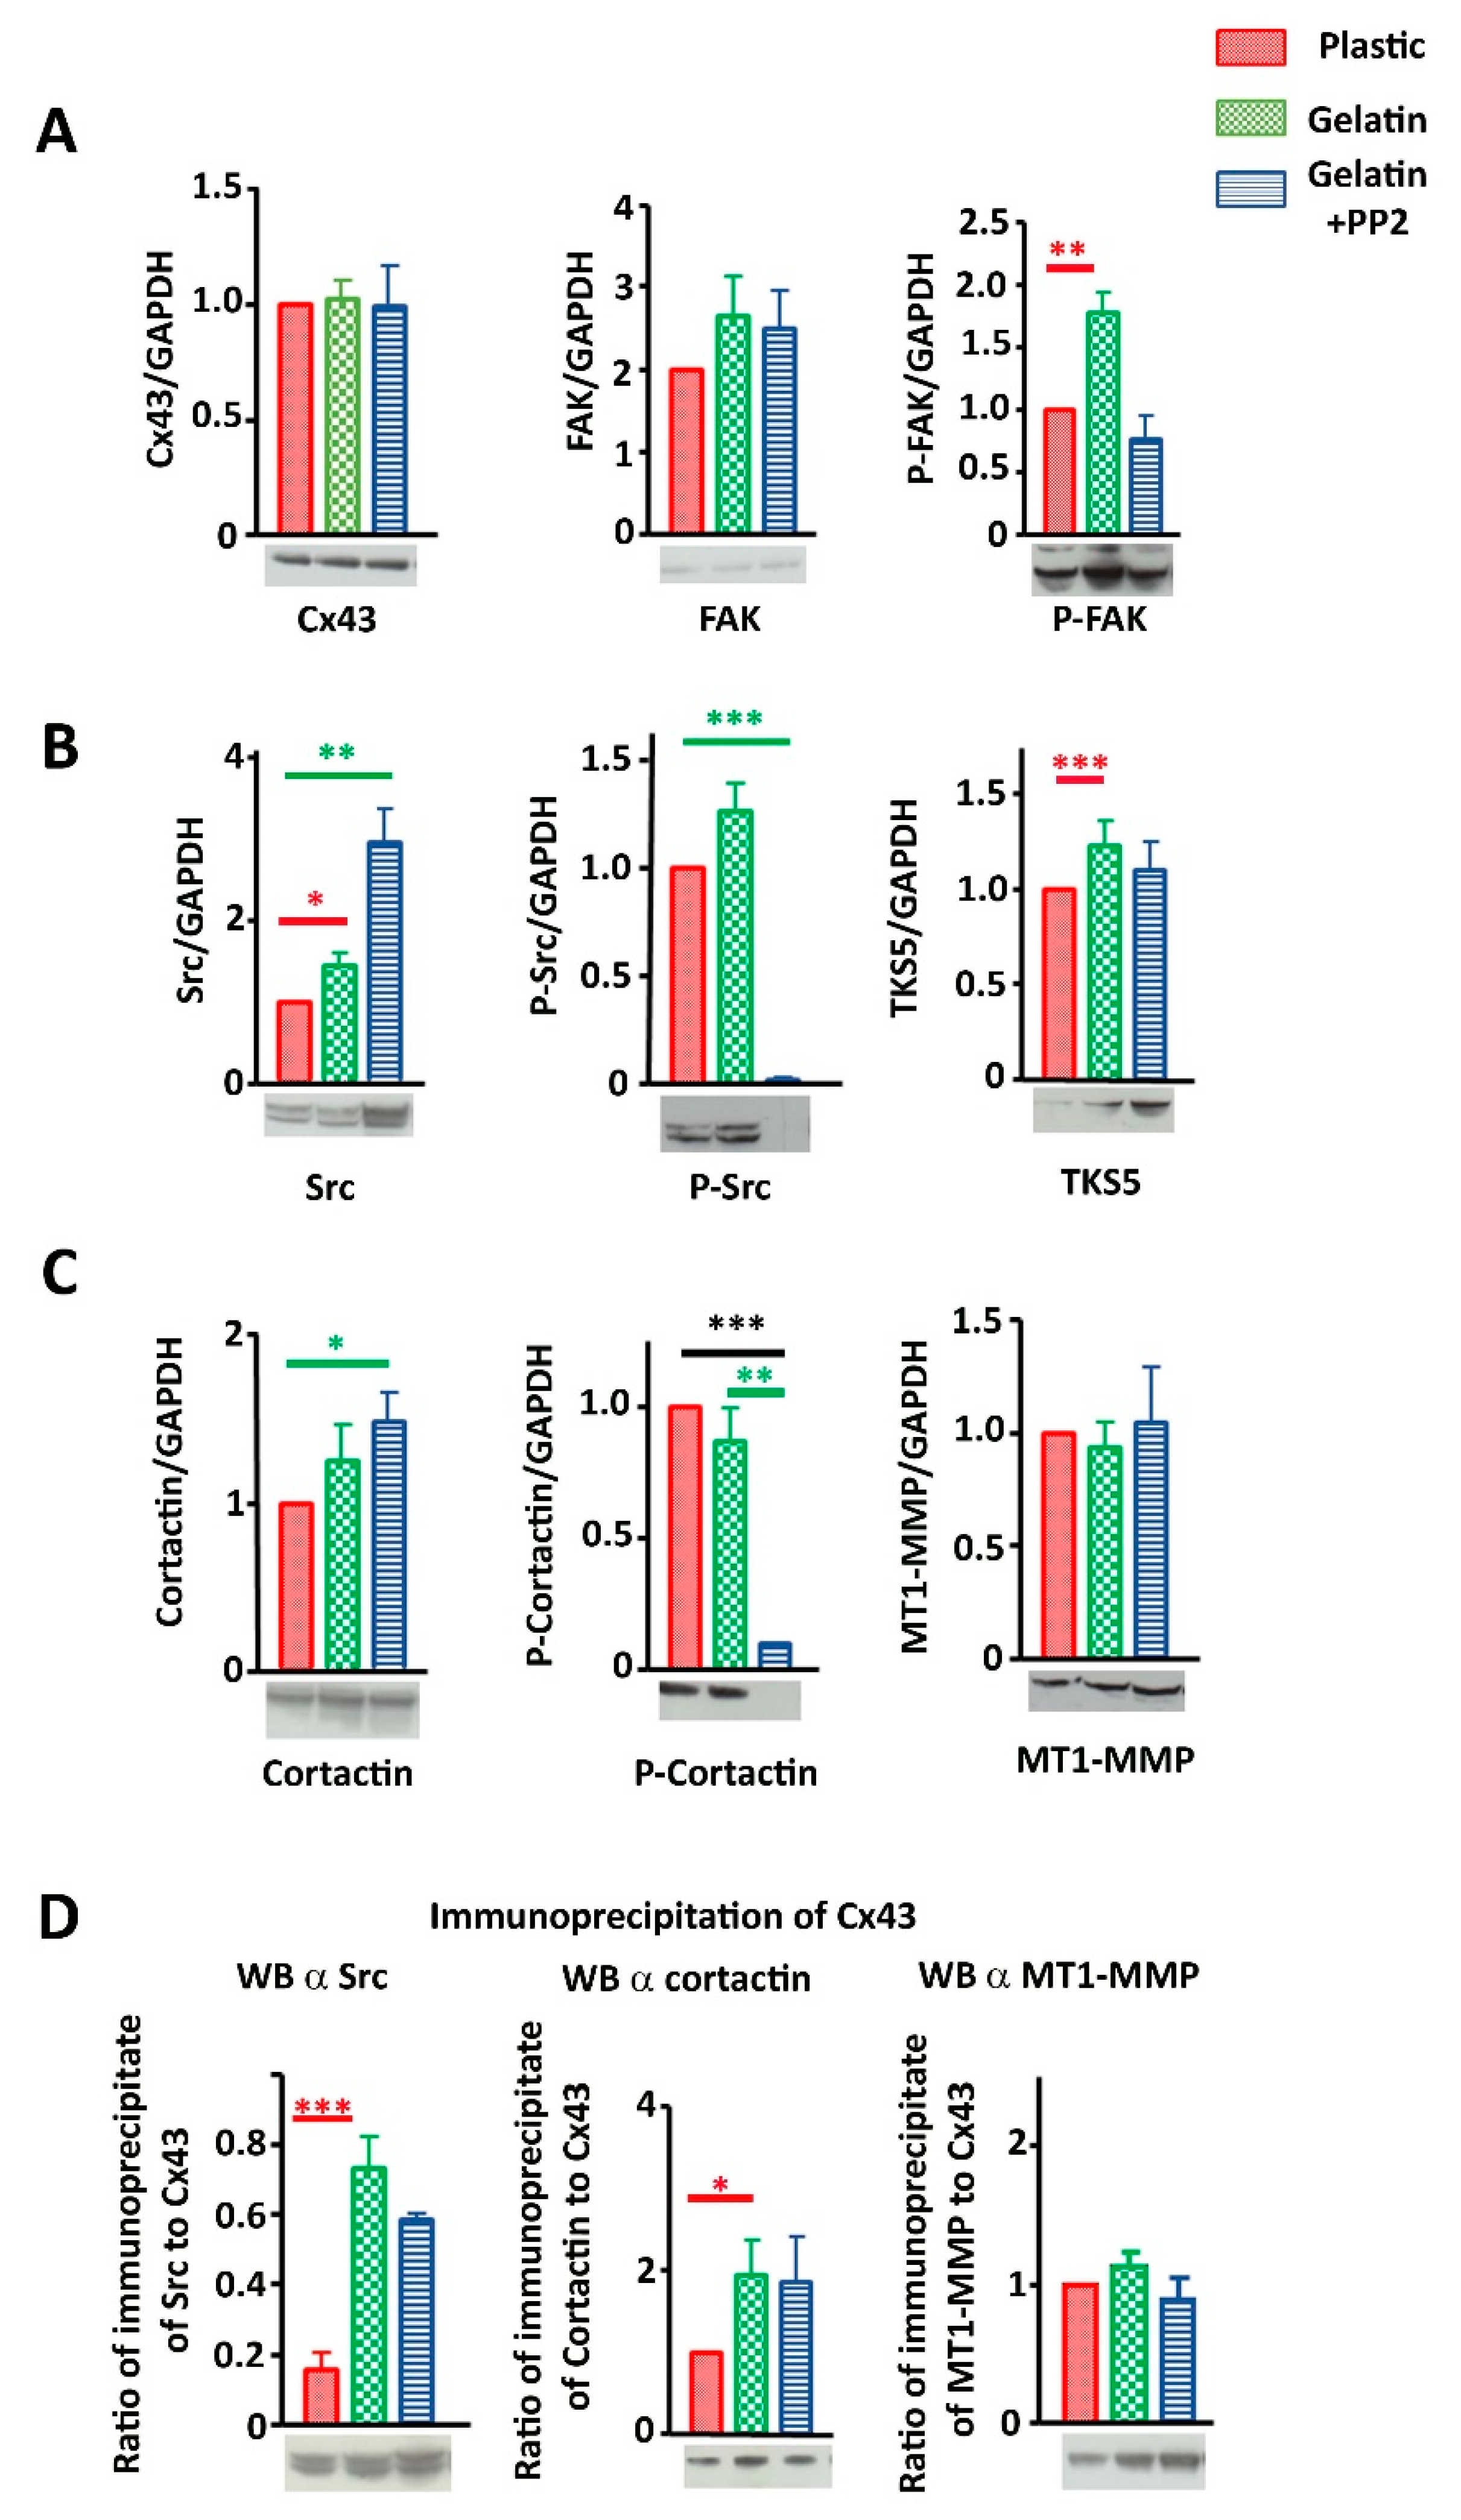
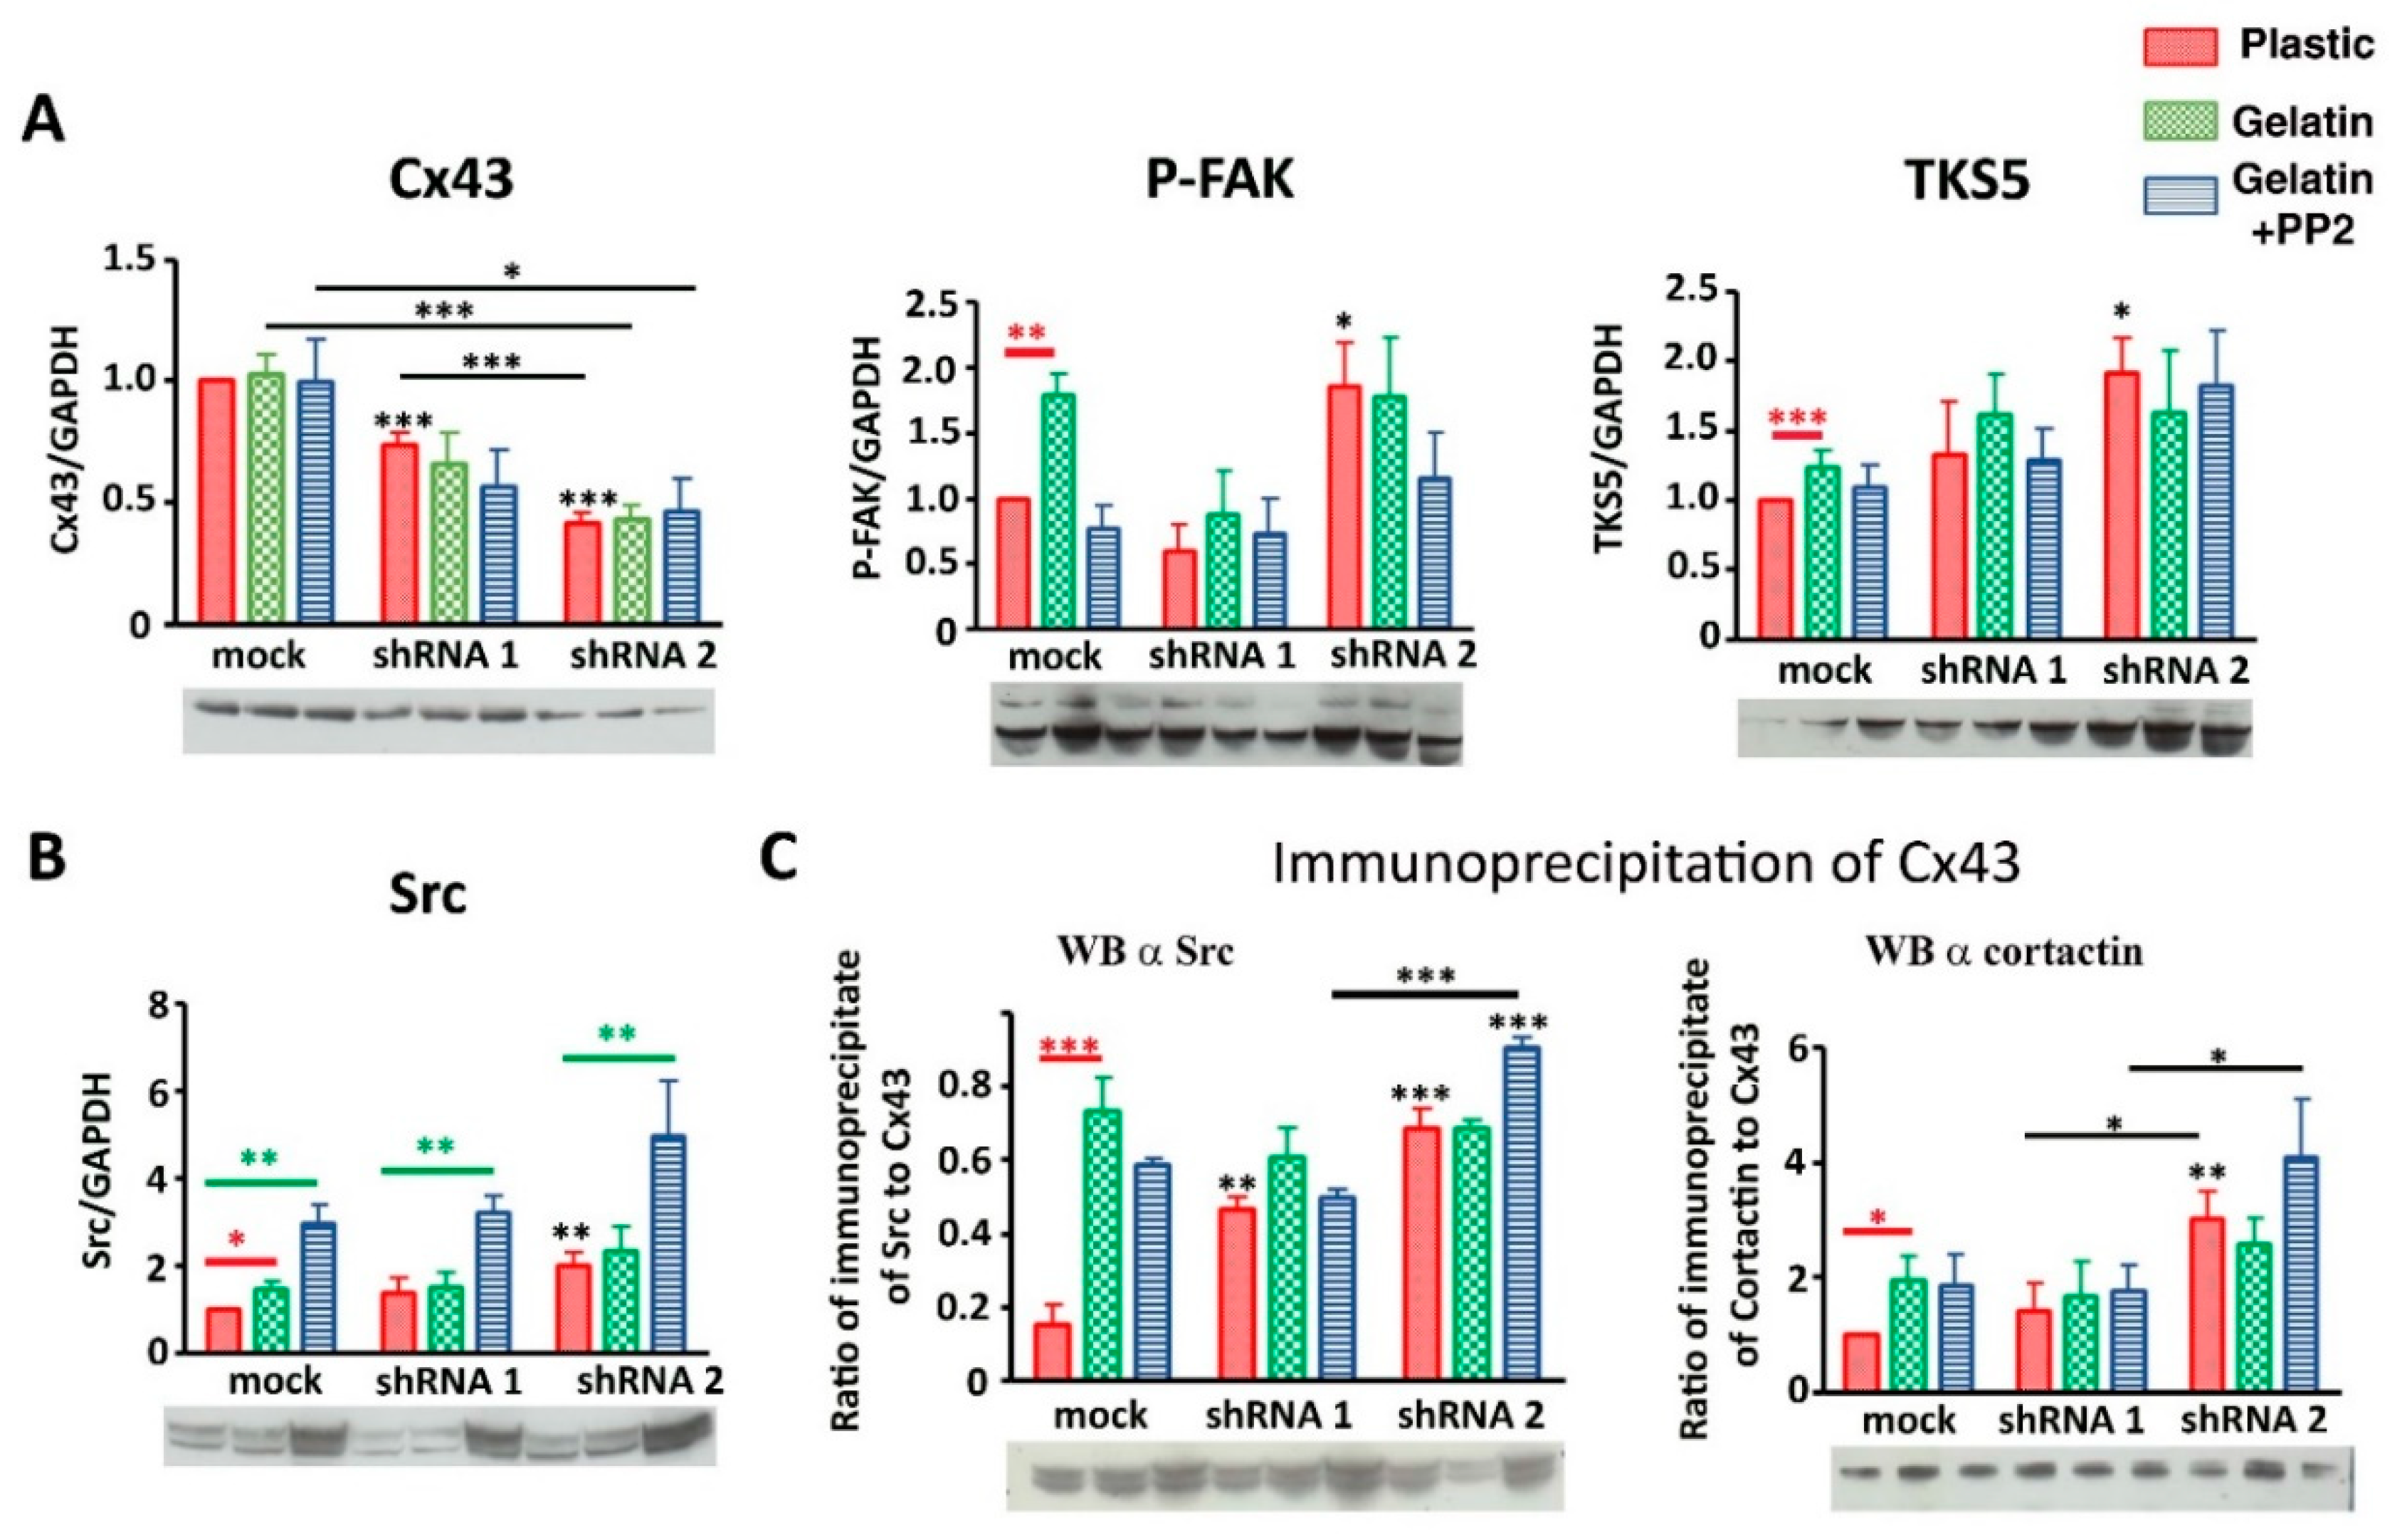
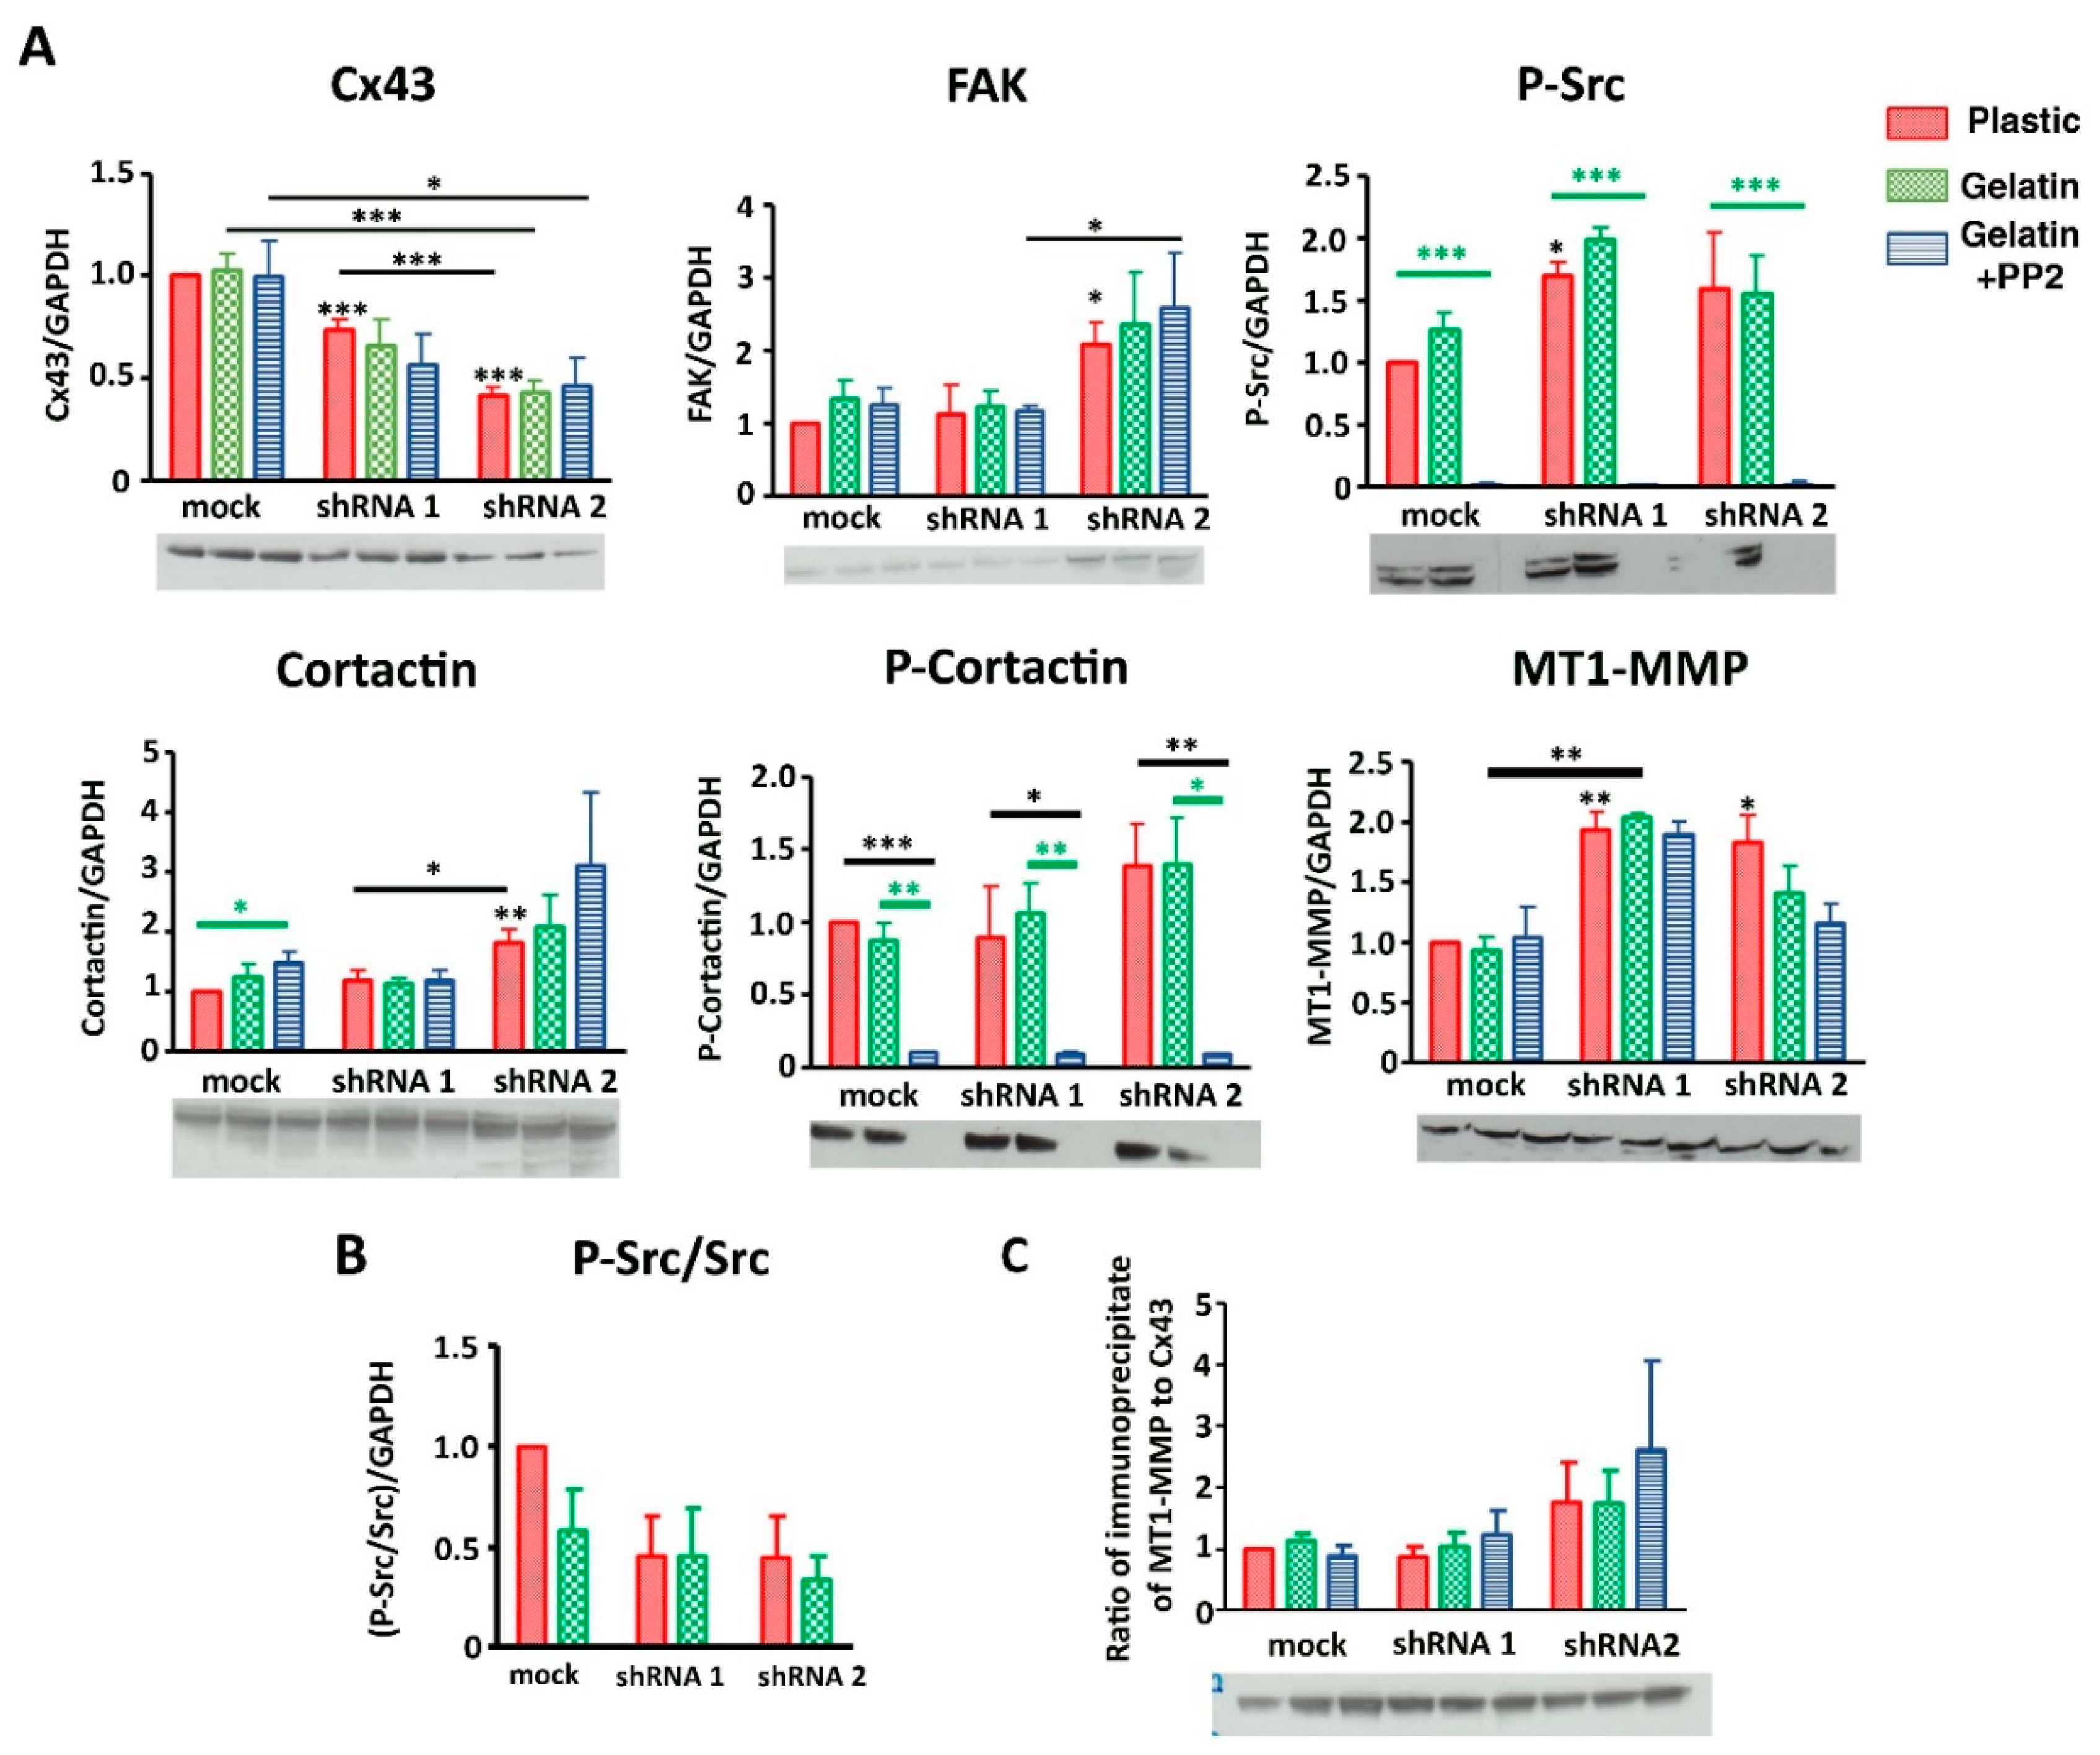
3.3. Cx43 Interacts with Key Proteins in Formation of Invadopodia
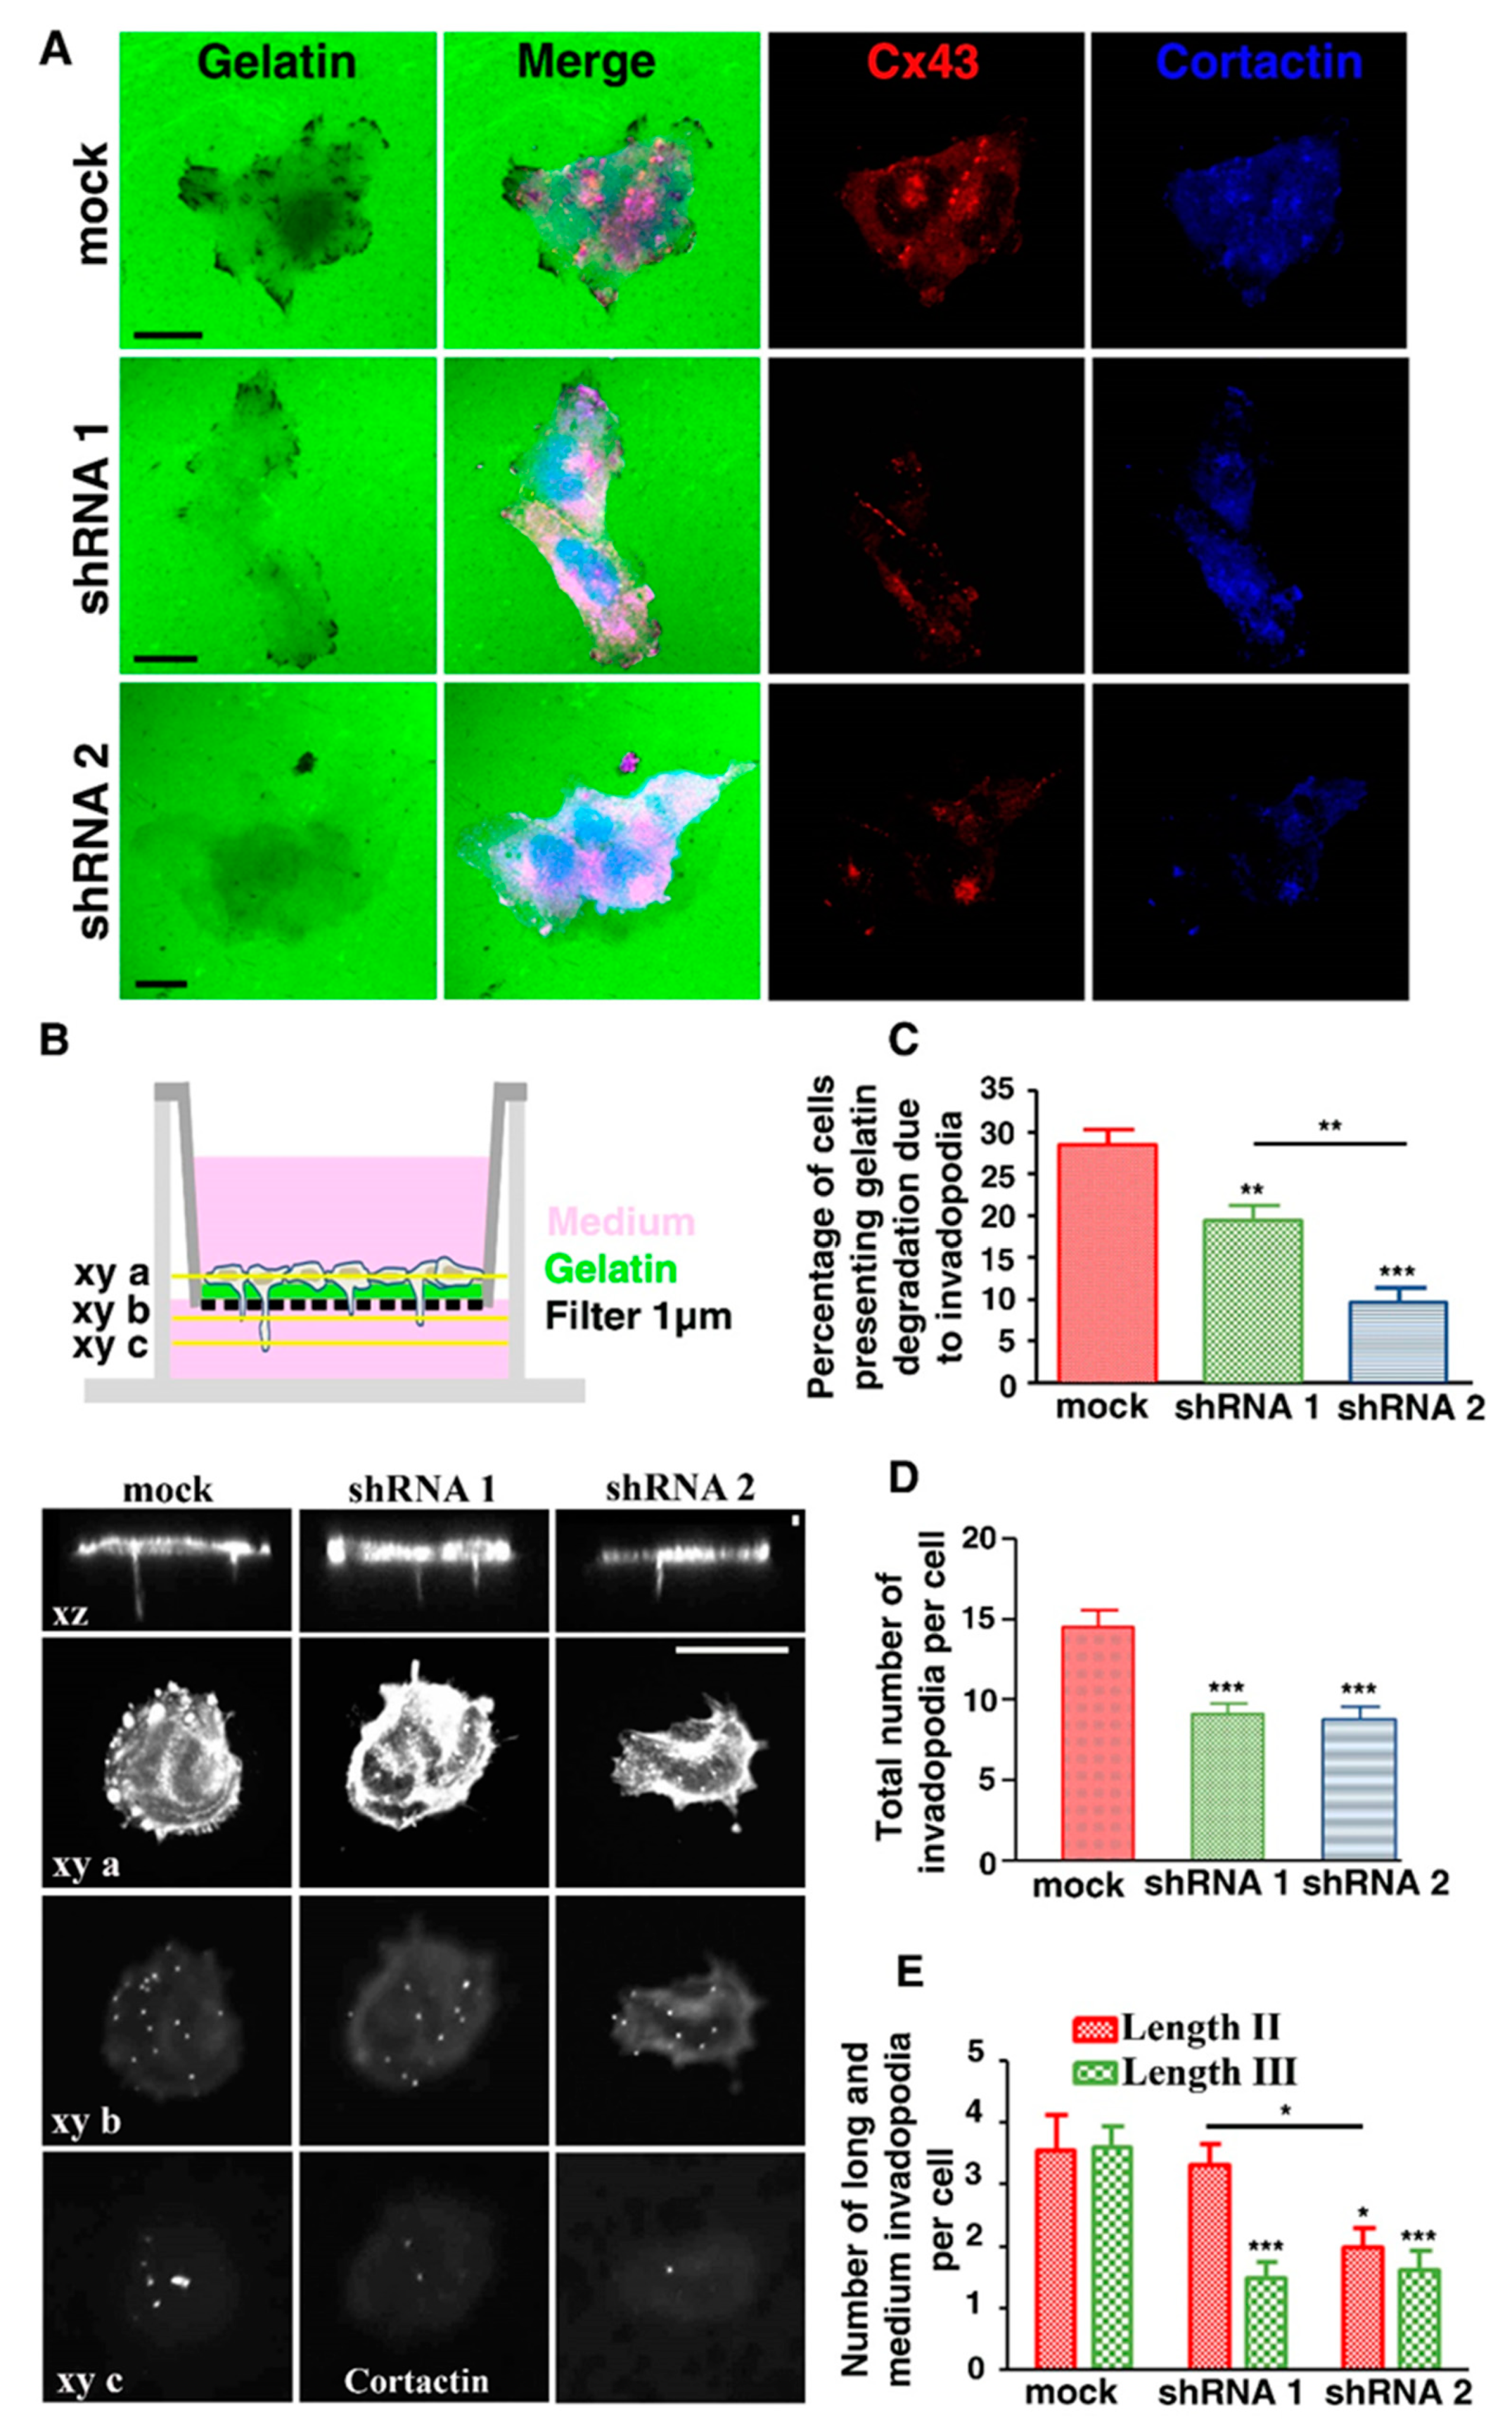
3.4. Cx43 Knockdown Is Associated with Reduced Gelatin Degradation
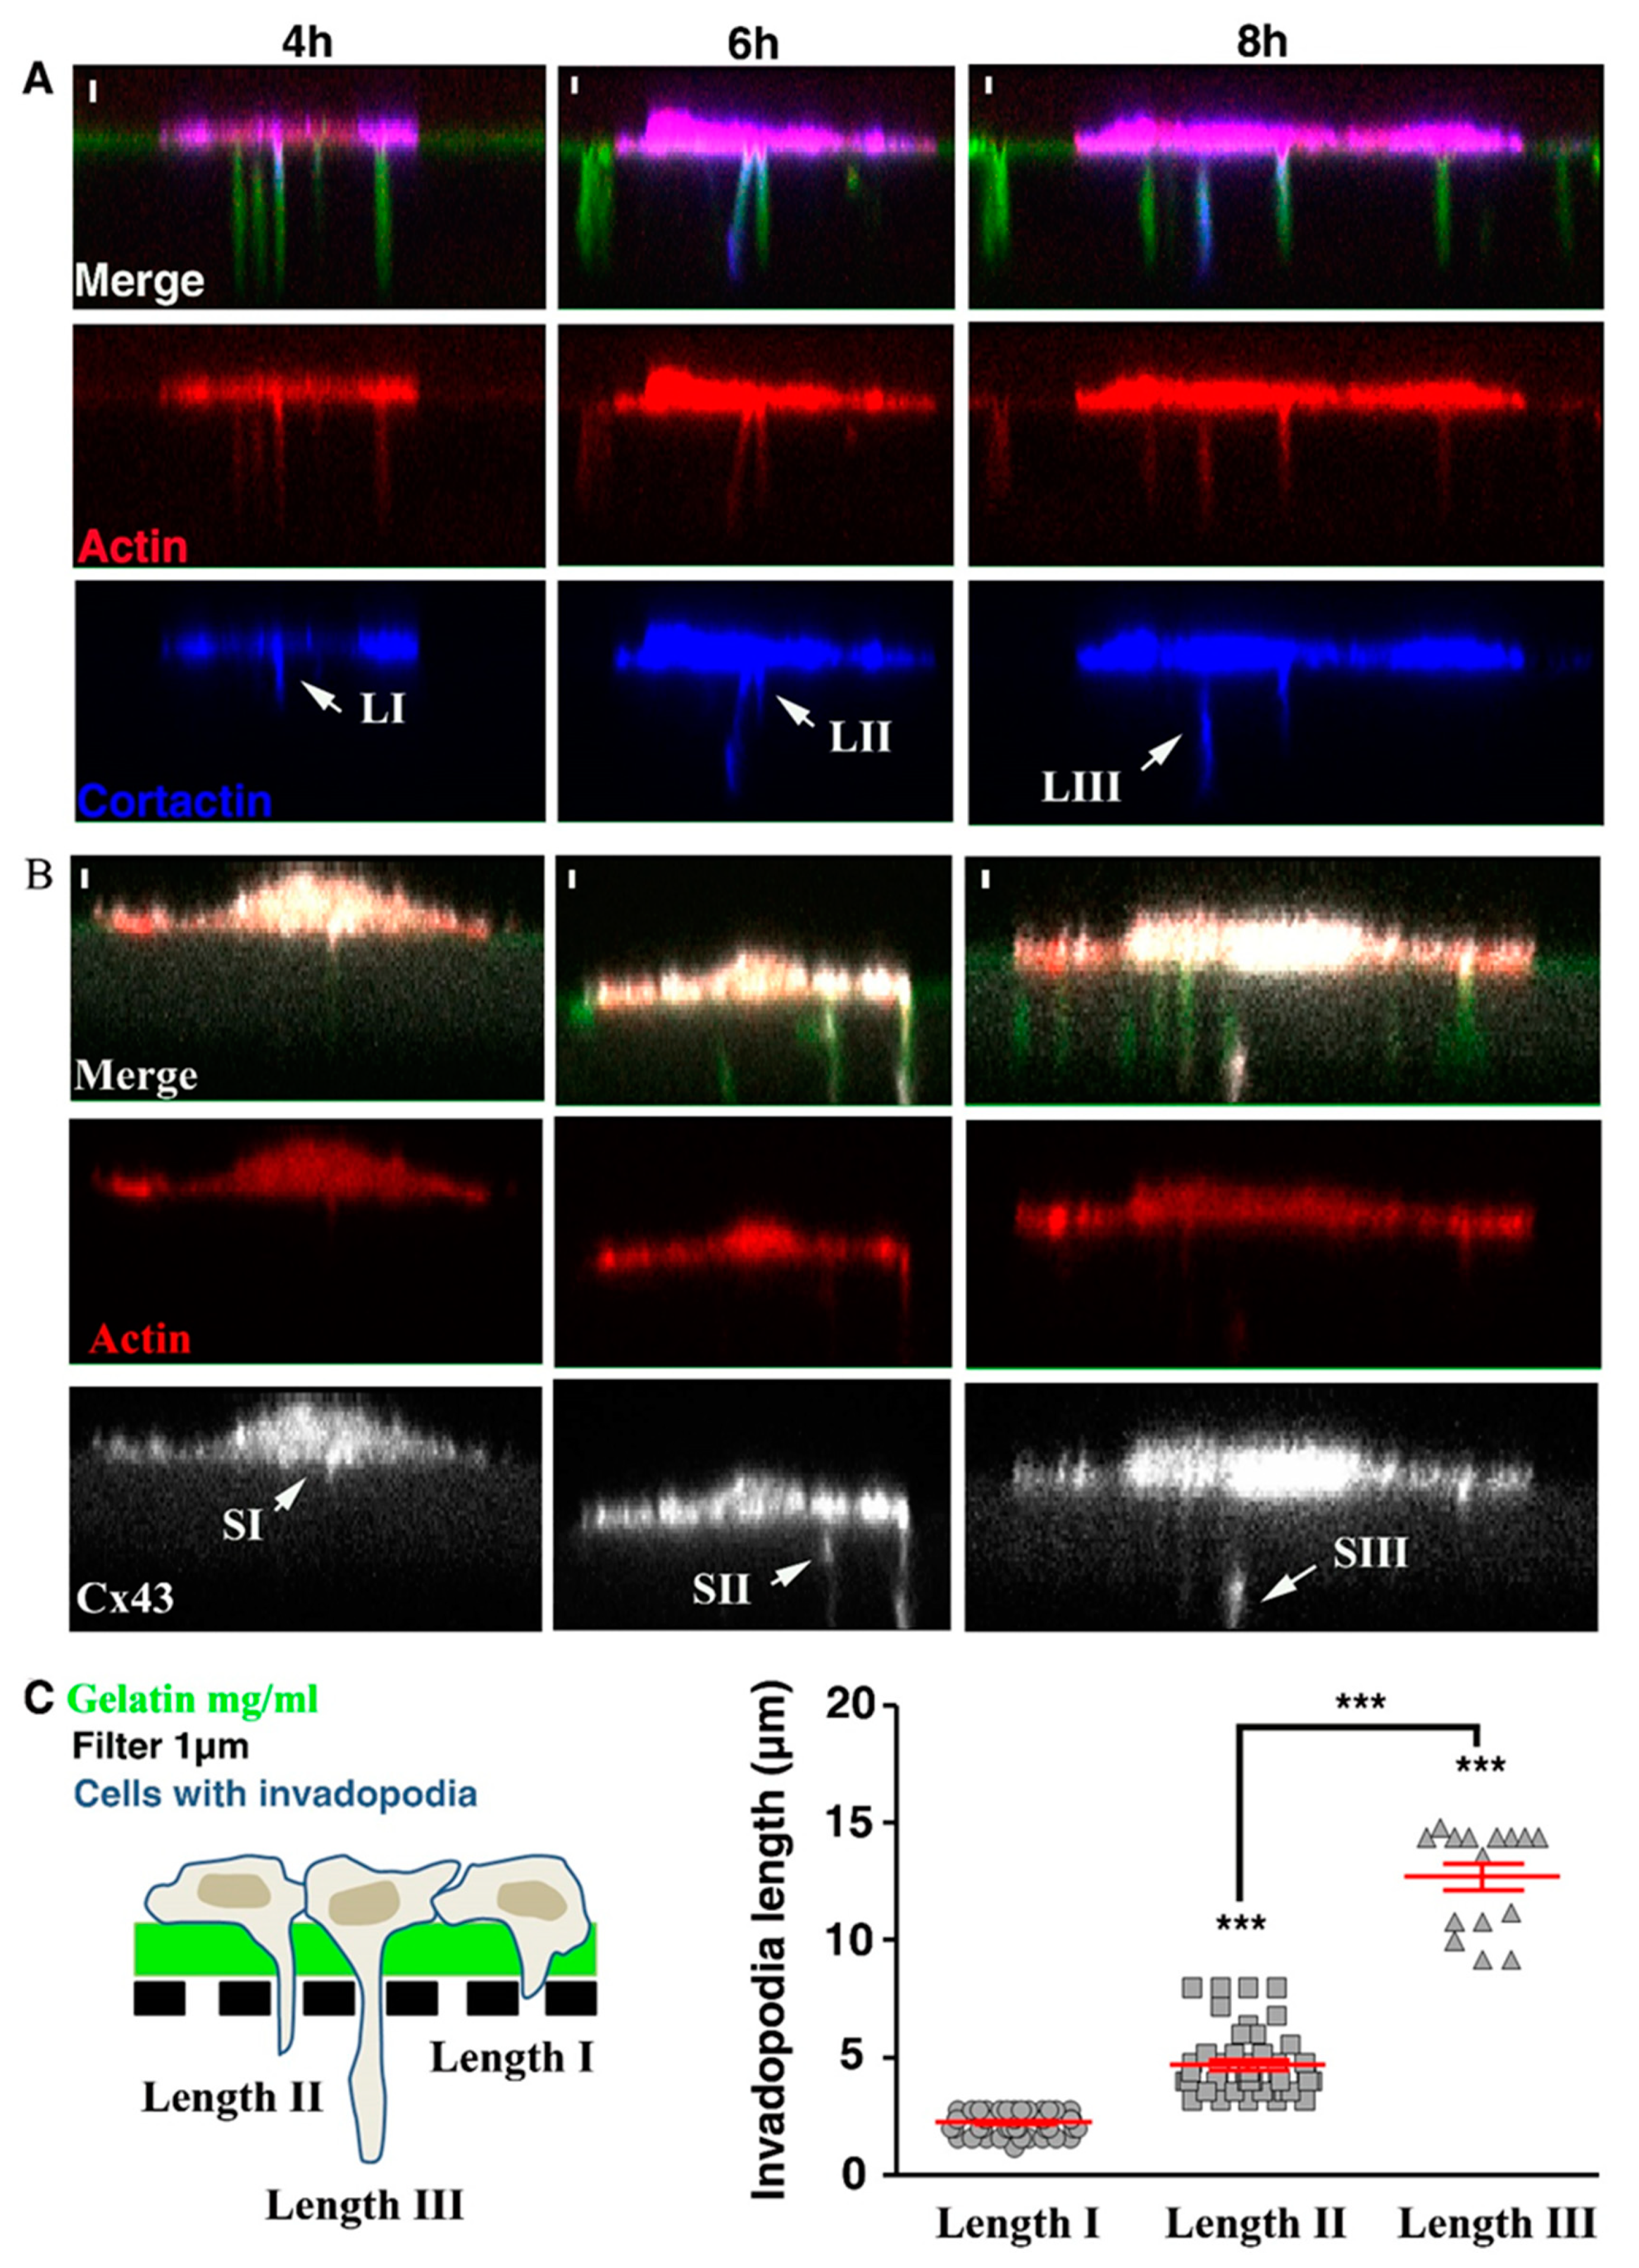
3.5. Cx43 Knockdown Is Associated with Decreased Invadopodia Formation and Growth
3.6. Cx43 Facilitates Formation and Growth of Invadopodia by Interacting with Key Proteins
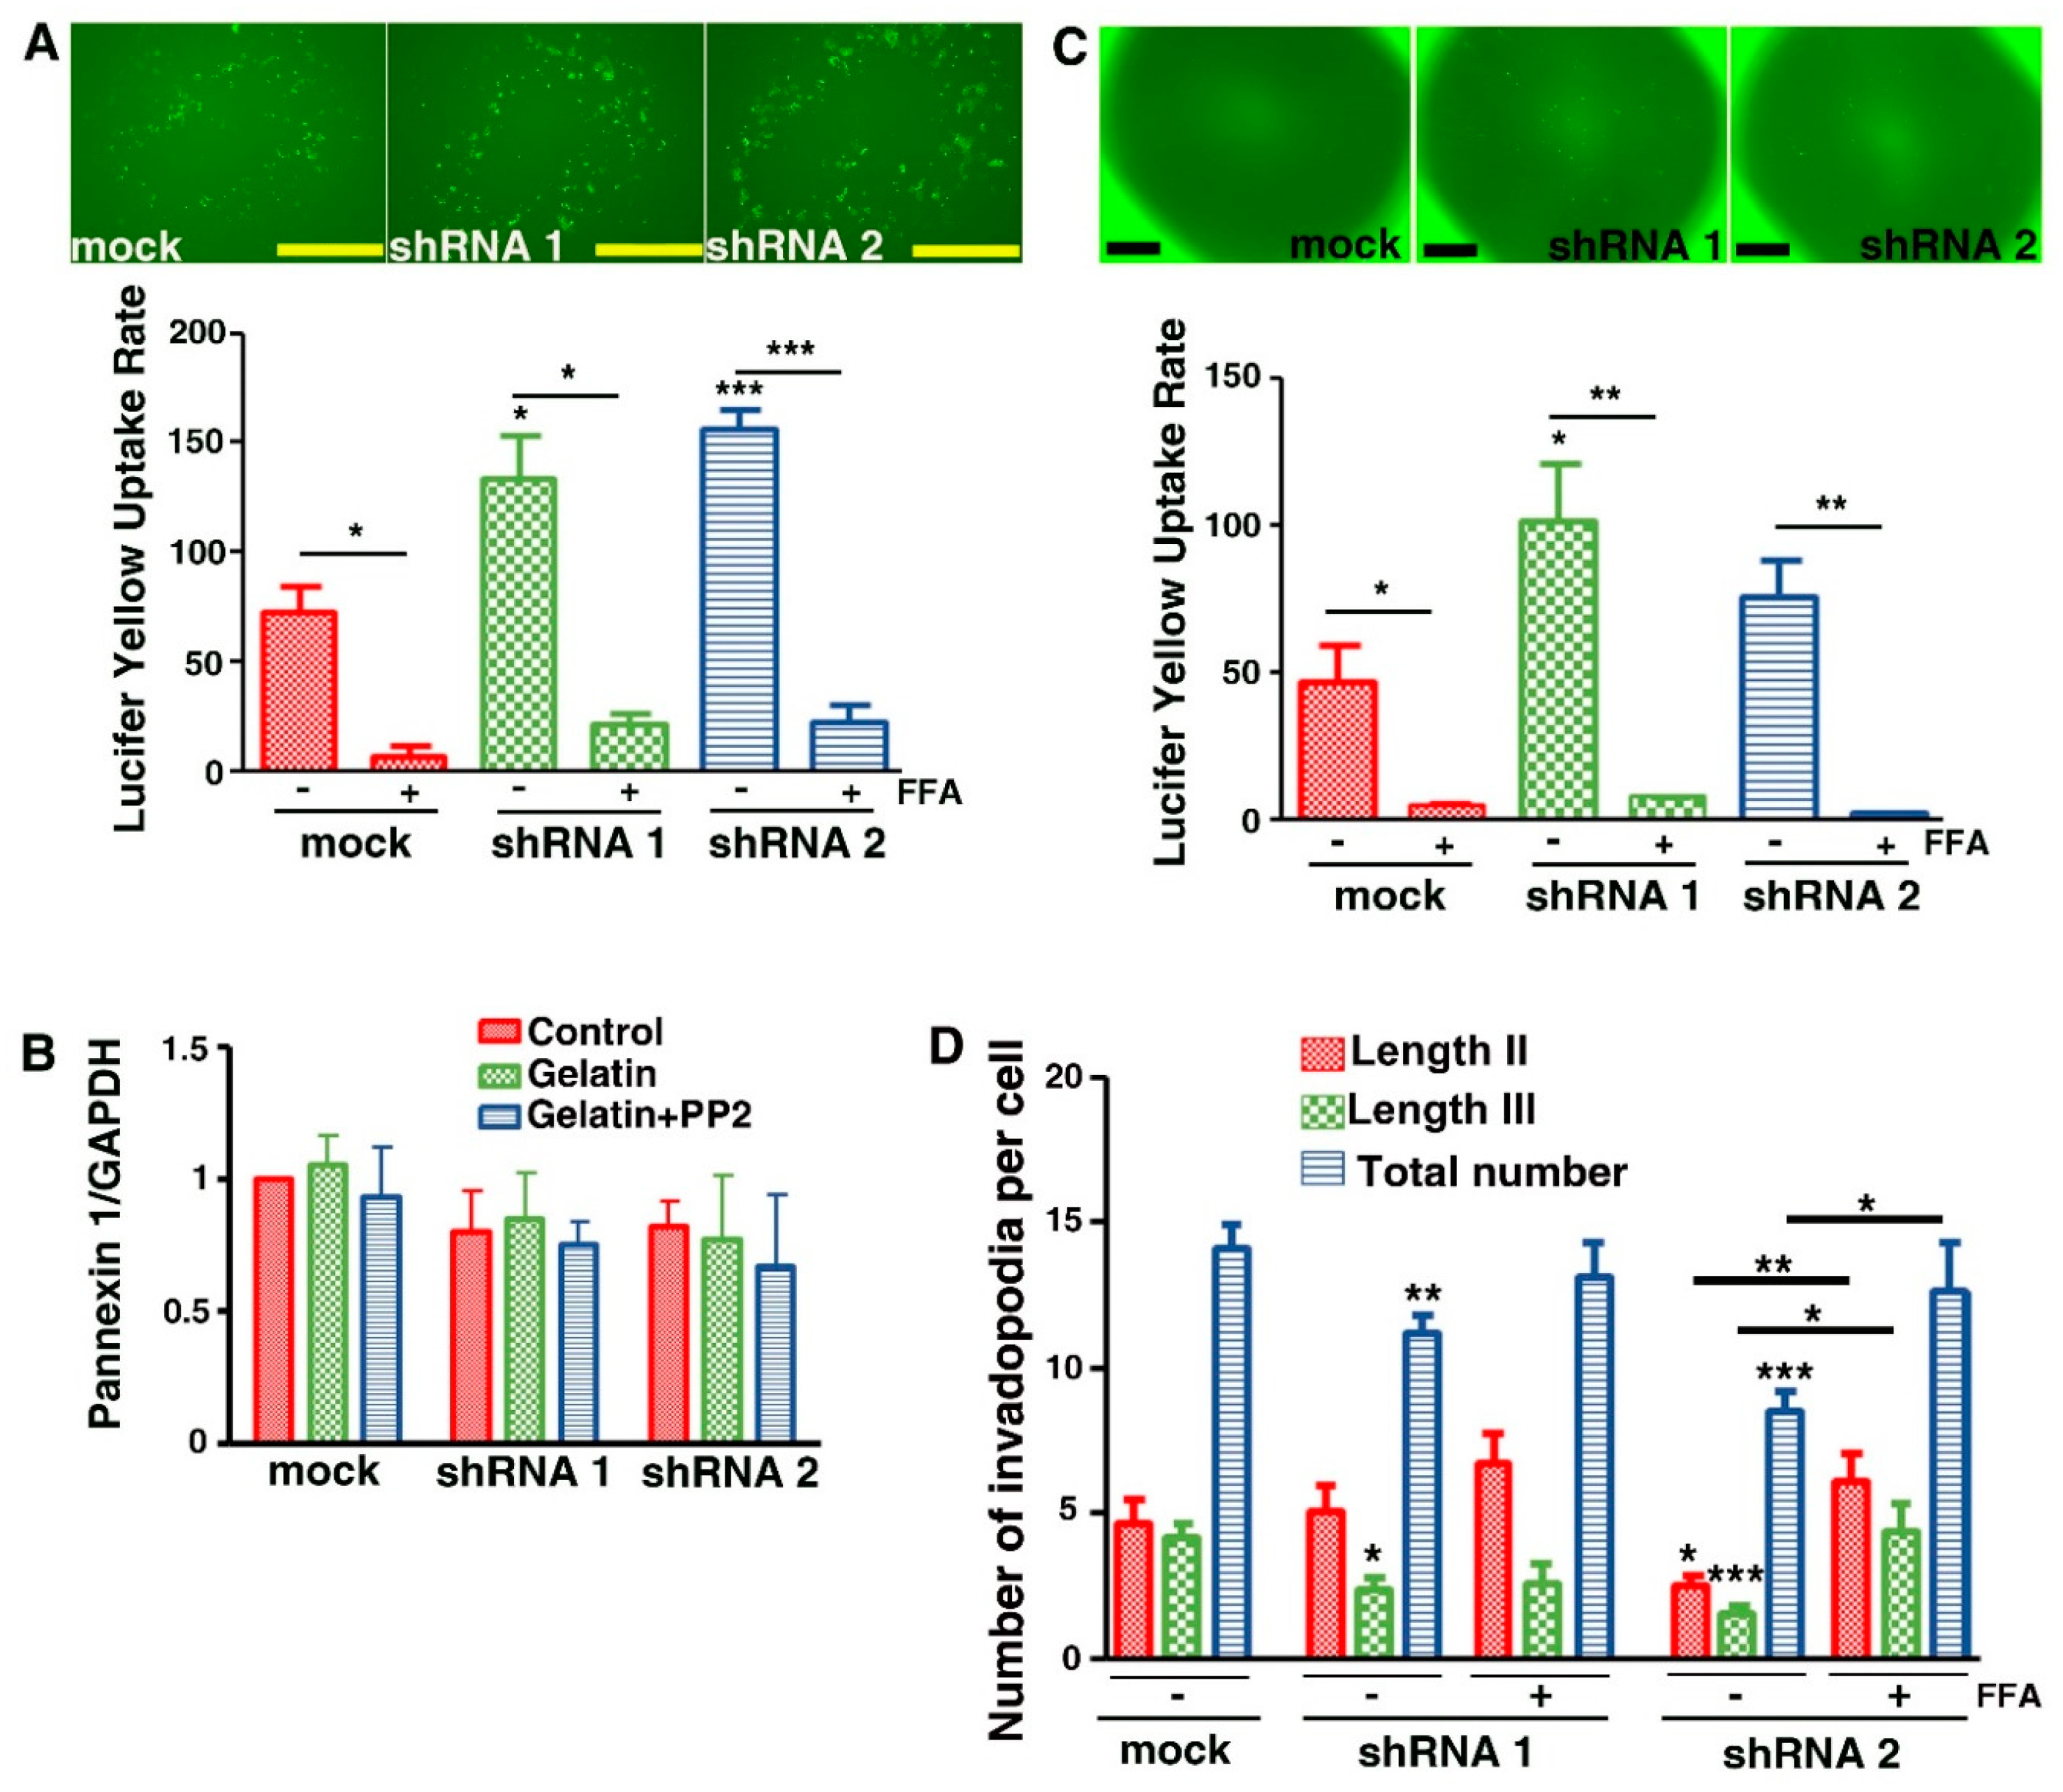
3.7. Evidence That Cx43 Hemichannels Inhibit Formation of Invadopodia
4. Discussion
Supplementary Materials
Author Contributions
Funding
Acknowledgments
Conflicts of Interest
Abbreviations
| Cx43 | Connexin43 |
| Ct | Carboxy-terminus |
| ECM | Extracellular matrix |
| FA | Focal adhesion |
| FAK | Focal adhesion kinase |
| FFA | Flufenamic acid |
| FG-gelatin | Fluorescent green gelatin |
| GJIC | Gap junctional intercellular communication |
| LY | Lucifer Yellow |
| MMP | Matrix metallo-proteinase |
| MT1-MMP | Membrane-type 1 matrix metalloproteinase |
| N-WASP | N-Wiskott–Aldrich syndrome protein |
References
- Kleihues, P.; Barnoltz-Sloan, J.; Ohgaki, H. Tumours of the Nervous System; World Cancer Report; Stewart, B.W., Wild, C.P., Eds.; International Agency for Research on Cancer, WHO Press: Lyon, France, 2014; pp. 511–521. [Google Scholar]
- Lin, J.H.; Takano, T.; Cotrina, M.L.; Arcuino, G.; Kang, J.; Liu, S.; Gao, Q.; Jiang, L.; Li, F.; Lichtenberg-Frate, H.; et al. Connexin 43 enhances the adhesivity and mediates the invasion of malignant glioma cells. J. Neurosci. 2002, 22, 4302–4311. [Google Scholar] [CrossRef] [Green Version]
- Zhang, W.; Nwagwu, C.; Le, D.M.; Yong, V.W.; Song, H.; Couldwell, W.T. Increased invasive capacity of connexin43-overexpressing malignant glioma cells. J. Neurosurg. 2003, 99, 1039–1046. [Google Scholar] [CrossRef]
- Oliveira, R.; Christov, C.; Guillamo, J.S.; de Boüard, S.; Palfi, S.; Venance, L.; Tardy, M.; Peschanski, M. Contribution of gap junctional communication between tumor cells and astroglia to the invasion of the brain parenchyma by human glioblastomas. BMC Cell Biol. 2005, 6, 7. [Google Scholar] [CrossRef] [PubMed] [Green Version]
- Elias, L.A.; Wang, D.D.; Kriegstein, A.R. Gap junction adhesion is necessary for radial migration in the neocortex. Nature 2007, 448, 901–907. [Google Scholar] [CrossRef] [PubMed]
- Huang, G.Y.; Cooper, E.S.; Waldo, K.; Kirby, M.L.; Gilula, N.B.; Lo, C.W. Gap junction-mediated cell-cell communication modulates mouse neural crest migration. J. Cell Biol. 1998, 143, 1725–1734. [Google Scholar] [CrossRef] [PubMed] [Green Version]
- Lo, C.W.; Waldo, K.L.; Kirby, M.L. Gap junction communication and the modulation of cardiac neural crest cells. Trends Cardiovasc. Med. 1999, 9, 63–69. [Google Scholar] [CrossRef]
- Xu, X.; Francis, R.; Wei, C.J.; Linask, K.L.; Lo, C.W. Connexin 43-mediated modulation of polarized cell movement and the directional migration of cardiac neural crest cells. Development 2006, 133, 3629–3639. [Google Scholar] [CrossRef] [PubMed] [Green Version]
- Zhu, D.; Caveney, S.; Kidder, G.M.; Naus, C.C. Transfection of C6 glioma cells with connexin 43 cDNA: Analysis of expression, intercellular coupling, and cell proliferation. Proc. Natl. Acad. Sci. USA 1991, 88, 1883–1887. [Google Scholar] [CrossRef] [Green Version]
- Naus, C.C.; Elisevich, K.; Zhu, D.; Belliveau, D.J.; Del Maestro, R.F. In vivo growth of C6 glioma cells transfected with connexin43 cDNA. Cancer Res. 1992, 52, 4208–4213. [Google Scholar]
- Bond, S.L.; Bechberger, J.F.; Khoo, N.K.; Naus, C.C. Transfection of C6 glioma cells with connexin32: The effects of expression of a nonendogenous gap junction protein. Cell Growth Differ. 1994, 5, 179–186. [Google Scholar]
- Sin, W.C.; Crespin, S.; Mesnil, M. Opposing roles of connexin43 in glioma progression. Biochim. Biophys. Acta 2012, 1818, 2058–2067. [Google Scholar] [CrossRef] [PubMed]
- Bates, D.C.; Sin, W.C.; Aftab, Q.; Naus, C.C. Connexin43 enhances glioma invasion by a mechanism involving the carboxy terminus. Glia 2007, 55, 1554–1564. [Google Scholar] [CrossRef] [PubMed]
- Cina, C.; Maass, K.; Theis, M.; Willecke, K.; Bechberger, J.F.; Naus, C.C. Involvement of the cytoplasmic C-terminal domain of connexin43 in neuronal migration. J. Neurosci. 2009, 29, 2009–2021. [Google Scholar] [CrossRef] [PubMed] [Green Version]
- Crespin, S.; Bechberger, J.; Mesnil, M.; Naus, C.C.; Sin, W.C. The carboxy-terminal tail of connexin43 gap junction protein is sufficient to mediate cytoskeleton changes in human glioma cells. J. Cell Biochem. 2010, 110, 589–597. [Google Scholar] [CrossRef]
- Matsuuchi, L.; Naus, C.C. Gap junction proteins on the move: Connexins, the cytoskeleton and migration. Biochim. Biophys. Acta 2013, 1828, 94–108. [Google Scholar] [CrossRef] [Green Version]
- Belliveau, D.J.; Bani-Yaghoub, M.; McGirr, B.; Naus, C.C.; Rushlow, W.J. Enhanced neurite outgrowth in PC12 cells mediated by connexin hemichannels and ATP. J. Biol. Chem. 2006, 281, 20920–20931. [Google Scholar] [CrossRef] [Green Version]
- Schoenwaelder, S.M.; Burridge, K. Bidirectional signaling between the cytoskeleton and integrins. Curr. Opin. Cell Biol. 1999, 11, 274–286. [Google Scholar] [CrossRef] [Green Version]
- Carragher, N.O.; Frame, M.C. Focal adhesion and actin dynamics: A place where kinases and proteases meet to promote invasion. Trends Cell Biol. 2004, 14, 241–249. [Google Scholar] [CrossRef]
- Buccione, R.; Orth, J.D.; McNiven, M.A. Foot and mouth: Podosomes, invadopodia and cicular dorsal ruffles. Nat. Rev. Mol. Cell Biol. 2004, 5, 647–657. [Google Scholar] [CrossRef]
- Buccione, R.; Caldieri, G.; Ayala, I. Invadopodia: Specialized tumor cell structures for focal degradation of the extracellular matrix. Cancer Metastasis Rev. 2009, 28, 137–149. [Google Scholar] [CrossRef]
- Yamaguchi, H.; Pixley, F.; Condeelis, J. Invadopodia and podosomes in tumor invasion. Eur. J. Cell Biol. 2006, 85, 213–218. [Google Scholar] [CrossRef] [PubMed]
- Linder, S. The matrix corroded: Podosomes and invadopodia in extra-cellular matrix degradation. Trends Cell Biol. 2007, 17, 107–117. [Google Scholar] [CrossRef] [PubMed]
- Murphy, D.A.; Courtneige, S.A. The “ins” qand ‘outs’ of podosomes and invadopodia: Characteristics, formation and function. Nat. Rev. Mol. Cell Biol. 2011, 12, 413–426. [Google Scholar] [CrossRef] [PubMed] [Green Version]
- Webb, D.J.; Donais, K.; Whitmore, L.A.; Thomas, S.M.; Turner, C.E.; Parsons, J.T.; Horwitz, A.F. FAK-Src signaling through paxillin, ERK and MLCK regulates adhesion disassembly. Nat. Cell Biol. 2004, 6, 154–161. [Google Scholar] [CrossRef] [PubMed]
- Tilghman, R.W.; Slack-Davis, J.K.; Sergina, N.; Martin, K.H.; Iwanicki, M.; Hershey, E.D.; Beggs, H.E.; Reichardt, L.F.; Parsons, J.T. Focal adhesion kinase is required for the special organization of the leading edge in migrating cells. J. Cell Sci. 2005, 118, 2613–2623. [Google Scholar] [CrossRef] [PubMed] [Green Version]
- Schaller, M.D.; Hildebrand, J.D.; Parsons, J.T. Complex formation with focal adhesion kinase: A mechanism to regulate activity and subcellular localization of Src kinases. Mol. Biol. Cell 1999, 10, 3489–3505. [Google Scholar] [CrossRef] [Green Version]
- Chan, K.T.; Cortesio, C.L.; Huttenlocher, A. FAK alters invadopodia and focal adhesion composition and dynamics to regulate breast cancer invasion. J. Cell Biol. 2009, 185, 357–370. [Google Scholar] [CrossRef] [Green Version]
- Artym, V.V.; Zhang, Y.; Seillier-Moiseiwitsch, F.; Yamada, K.M.; Mueller, S.C. Dynamic interactions of cortactin and membrane type 1 matrix metalloproteinase at invadopodia: Defining the stages of invadopodia formation and function. Cancer Res. 2006, 66, 3034–3043. [Google Scholar] [CrossRef] [Green Version]
- Herve, J.C.; Bourmeyster, N.; Sarrouilhe, D. Diversity in protein–protein interactions of connexins: Emerging roles. Biochim. Biophys. Acta 2004, 1662, 22–41. [Google Scholar] [CrossRef] [Green Version]
- Olk, S.; Turchinovich, A.; Grzendowski, M.; Stühler, K.; Meyer, H.E.; Zoidl, G.; Dermietzel, R. Proteomic analysis of astroglial connexin43 silencing uncovers a cytoskeletal platform involved in process formation and migration. Glia 2010, 58, 494–505. [Google Scholar] [CrossRef]
- Strale, P.O.; Clarhaut, J.; Lamiche, C.; Cronier, L.; Mesnil, M.; Defamie, N. Down-regulation of connexin43 expression reveals the involvement of caveolin-1 containing lipid rafts in human U251 glioblastoma cell invasion. Mol. Carcinog. 2012, 51, 845–860. [Google Scholar] [CrossRef] [PubMed]
- Ayala, I.; Baldassarre, M.; Giacchetti, G.; Caldieri, G.; Tetè, S.; Luini, A.; Buccione, R. Multiple regulatory inputs converge on cortactin to control invadopodia biogenesis and extracellular matrix degradation. J. Cell Sci. 2008, 121, 369–378. [Google Scholar] [CrossRef] [PubMed] [Green Version]
- Contreras, J.E.; Sanchez, H.A.; Eugenin, E.A.; Speidel, D.; Theis, M.; Willecke, K.; Bukauskas, F.F.; Bennett, M.V.; Sáez, J.C. Metabolic inhibition induces opening of unapposed connexin 43 gap junction hemichannels and reduces gap junctional communication in cortical astrocytes in culture. Proc. Natl. Acad. Sci. USA 2002, 99, 495–500. [Google Scholar] [CrossRef] [PubMed] [Green Version]
- Beaty, B.T.; Wang, Y.; Bravo-Cordero, J.J.; Sharma, V.P.; Miskolci, V.; Hodgson, L.; Condeelis, J. Talin regulates moesin-NHE-1 recruitment to invadopodia and promotes mammary tumor metastasis. J. Cell Biol. 2014, 205, 737–751. [Google Scholar] [CrossRef] [Green Version]
- Cea, L.A.; Cisterna, B.A.; Puebla, C.; Frank, M.; Figueroa, X.F.; Cardozo, C.; Willecke, K.; Latorre, R.; Sáez, J.C. De novo expression of connexin hemichannels in denervated fast skeletal muscles leads to atrophy. Proc. Natl. Acad. Sci. USA 2013, 110, 16229–16234. [Google Scholar] [CrossRef] [Green Version]
- Wang, Y.; Cao, H.; Chen, J.; McNiven, M.A. A direct interaction between the large GTPase dynamin-2 and FAK regulates focal adhesion dynamics in response to active Src. Mol. Biol. Cell 2011, 22, 1529–1538. [Google Scholar] [CrossRef]
- Yu, H.G.; Nam, J.O.; Miller, N.L.; Tanjoni, I.; Walsh, C.; Shi, L.; Kim, L.; Chen, X.L.; Tomar, A.; Lim, S.T.; et al. p190RhoGEF (Rgnef) promotes colon carcinoma tumor progression via interaction with focal adhesion kinase. Cancer Res. 2011, 71, 360–370. [Google Scholar] [CrossRef] [Green Version]
- Karginov, A.V.; Tsygankov, D.; Berginski, M.; Chu, P.H.; Trudeau, E.D.; Yi, J.J.; Gomez, S.; Elston, T.C.; Hahn, K.M. Dissecting motility signaling through activation of specific Src-effector complexes. Nat. Chem. Biol. 2014, 10, 286–290. [Google Scholar] [CrossRef] [Green Version]
- Batra, N.; Riquelme, M.A.; Burra, S.; Jiang, J.X. 14-3-3θ facilitates plasma membrane delivery and function of mechanosensitive connexin 43 hemichannels. J. Cell Sci. 2014, 127, 137–146. [Google Scholar] [CrossRef] [Green Version]
- Mueller, S.C.; Ghersi, G.; Akiyama, S.K.; Sang, Q.X.; Howard, L.; Pineiro-Sanchez, M.; Nakahara, H.; Yeh, Y.; Chen, W.T. A novel protease-docking function of integrin at invadopodia. J. Biol. Chem. 1999, 274, 24947–24952. [Google Scholar] [CrossRef] [Green Version]
- Giepmans, B.N.; Hengeveld, T.; Postma, F.R.; Moolenaar, W.H. Interaction of c-Src with gap junction protein connexin-43. Role in the regulation of cell-cell communication. J. Biol. Chem. 2001, 276, 8544–8549. [Google Scholar] [CrossRef] [Green Version]
- Tabernero, A.; Gangoso, E.; Jaraiz-rodriguez, M.; Medina, J.M. The role of connexin43-Src interaction in astrocytomas: A molecular puzzle. Neuroscience 2016, 323, 183–194. [Google Scholar] [CrossRef] [PubMed]
- Sorgen, P.L.; Duffy, H.S.; Sahoo, P.; Coombs, W.; Delmar, M.; Spray, D.C. Structural changes in the carboxyl terminus of the gap junction protein connexin43 indicates signaling between binding domains for c-Src and zonula occludens-1. J. Biol. Chem. 2004, 279, 54695–54701. [Google Scholar] [CrossRef] [PubMed] [Green Version]
- Aftab, Q.; Sin, W.C.; Naus, C.C. Reduction in gap junction intercellular communication promotes glioma migration. Oncotarget 2015, 6, 11447–11464. [Google Scholar] [CrossRef] [PubMed] [Green Version]
- Iyyathurai, J.; Wang, N.; D’hondt, C.; Jiang, J.X.; Leybaert, L.; Bultynck, G. The SH3-binding domain of Cx43 participates in loop/tail interactions critical for Cx43-hemichannel activity. Cell. Mol. Life Sci. 2018, 75, 2059–2073. [Google Scholar] [CrossRef] [PubMed]
- Gangoso, E.; Talaverón, R.; Jaraíz-Rodríguez, M.; Domínguez-Prieto, M.; Ezan, P.; Koulakoff, A.; Medina, J.M.; Giaume, C.; Tabernero, A. A c-Src Inhibitor Peptide Based on Connexin43 Exerts Neuroprotective Effects through the Inhibition of Glial Hemichannel Activity. Front. Mol. Neurosci. 2017, 10, 418. [Google Scholar] [CrossRef] [PubMed] [Green Version]
- Busco, G.; Cardone, R.A.; Greco, M.R.; Bellizzi, A.; Colella, M.; Antelmi, E.; Mancini, M.T.; Dell’Aquila, M.E.; Casavola, V.; Paradiso, A.; et al. NHE1 promotes invadopodial ECM proteolysis through acidification of the peri-invadopodial space. FASEB J. 2010, 24, 3903–3915. [Google Scholar] [CrossRef]
- Brisson, L.; Driffort, V.; Benoist, L.; Poet, M.; Counillon, L.; Antelmi, E.; Rubino, R.; Besson, P.; Labbal, F.; Chevalier, S.; et al. NaV1.5 Na+ channels allosterically regulate the NHE-1 exchanger and promote the activity of breast cancer cell invadopodia. J. Cell Sci. 2013, 126, 4835–4842. [Google Scholar] [CrossRef] [Green Version]
- Petrecca, K.; Atanasiu, R.; Grinstein, S.; Orlowski, J.; Shrier, A. Subcellular localization of the Na+/H+ exchanger NHE1 in rat myocardium. Am. J. Physiol. 1999, 276, H709–H717. [Google Scholar] [CrossRef]
- Frantz, C.; Barreiro, G.; Dominguez, L.; Chen, X.; Eddy, R.; Condeelis, J.; Kelly, M.J.; Jacobson, M.P.; Barber, D.L. Cofilin is a pH sensor for actin free barbed end formation: Role of phosphoinositide binding. J. Cell Biol. 2008, 183, 865–879. [Google Scholar] [CrossRef] [Green Version]


© 2020 by the authors. Licensee MDPI, Basel, Switzerland. This article is an open access article distributed under the terms and conditions of the Creative Commons Attribution (CC BY) license (http://creativecommons.org/licenses/by/4.0/).
Share and Cite
Chepied, A.; Daoud-Omar, Z.; Meunier-Balandre, A.-C.; Laird, D.W.; Mesnil, M.; Defamie, N. Involvement of the Gap Junction Protein, Connexin43, in the Formation and Function of Invadopodia in the Human U251 Glioblastoma Cell Line. Cells 2020, 9, 117. https://doi.org/10.3390/cells9010117
Chepied A, Daoud-Omar Z, Meunier-Balandre A-C, Laird DW, Mesnil M, Defamie N. Involvement of the Gap Junction Protein, Connexin43, in the Formation and Function of Invadopodia in the Human U251 Glioblastoma Cell Line. Cells. 2020; 9(1):117. https://doi.org/10.3390/cells9010117
Chicago/Turabian StyleChepied, Amandine, Zeinaba Daoud-Omar, Annie-Claire Meunier-Balandre, Dale W. Laird, Marc Mesnil, and Norah Defamie. 2020. "Involvement of the Gap Junction Protein, Connexin43, in the Formation and Function of Invadopodia in the Human U251 Glioblastoma Cell Line" Cells 9, no. 1: 117. https://doi.org/10.3390/cells9010117