miR-371a-3p, miR-373-3p and miR-367-3p as Serum Biomarkers in Metastatic Testicular Germ Cell Cancers Before, During and After Chemotherapy

 ,
,
Abstract
:1. Introduction
2. Methods
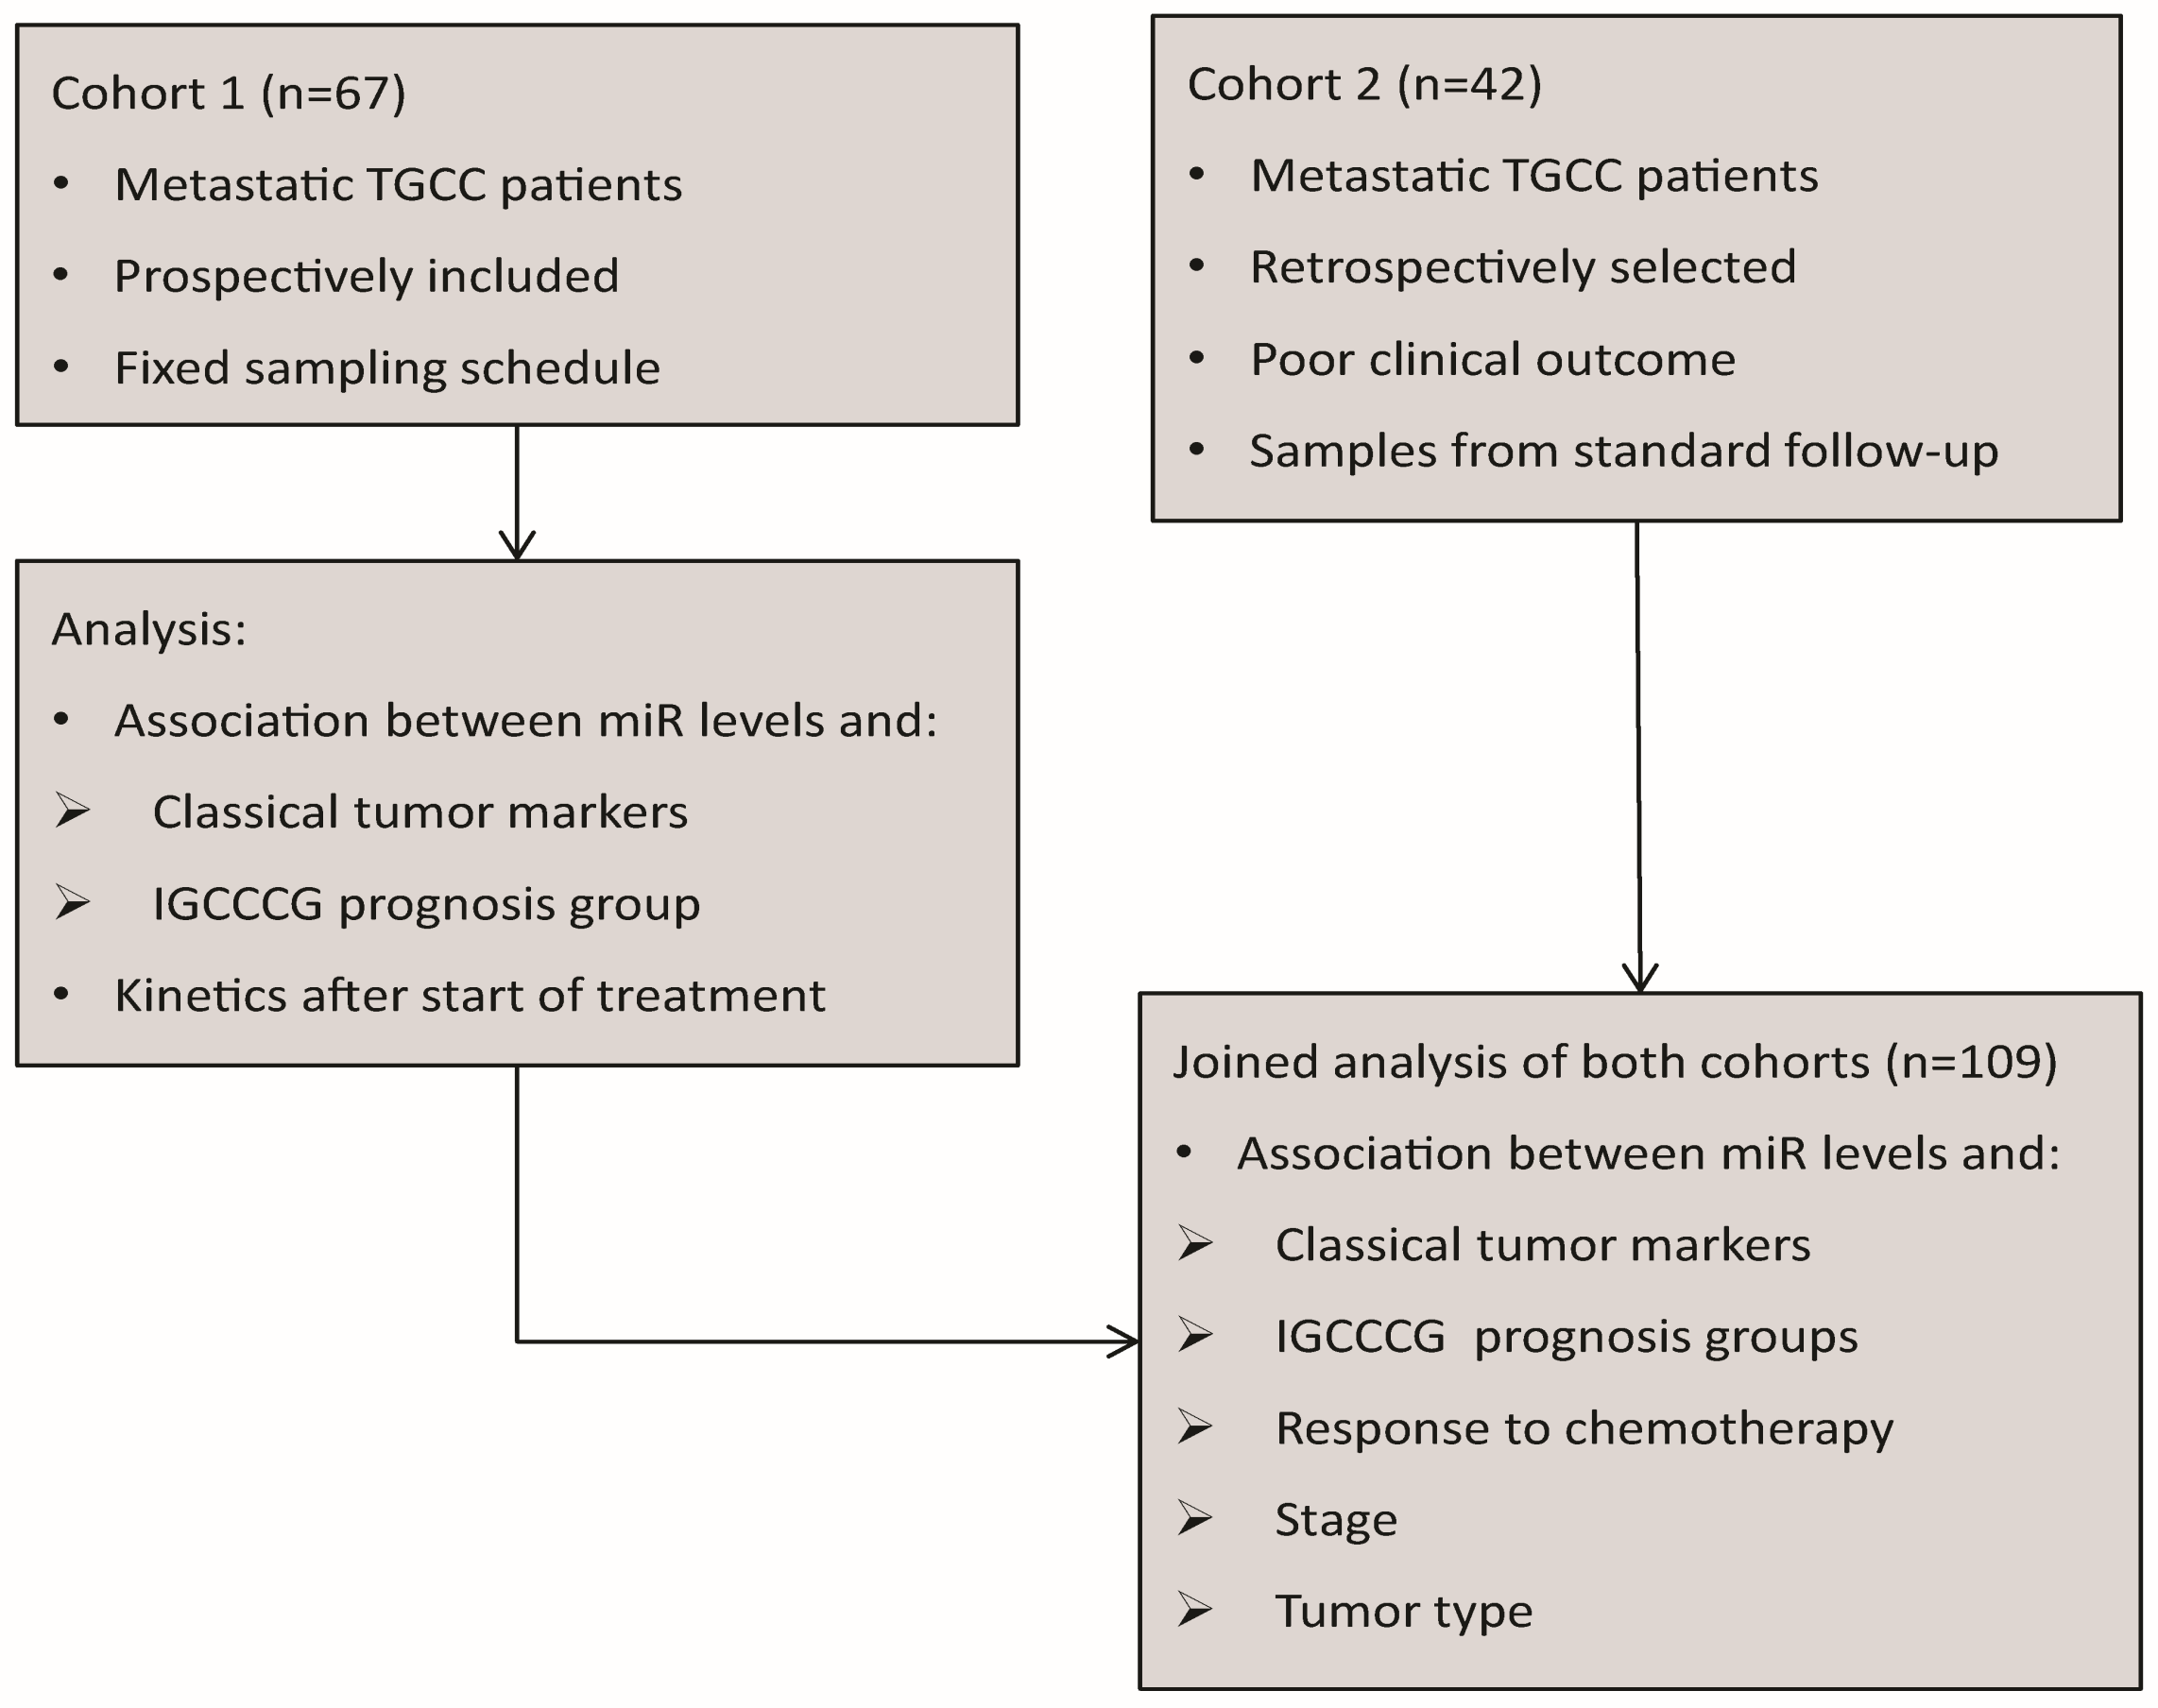
2.1. Patients
2.2. Measurement of miR Levels by ampTSmiR Test
2.3. Quality Control
2.4. Evaluation
2.5. Statistical Analysis
3. Results
3.1. Patients
3.2. Association between miR Levels, Tumor Markers and IGCCCG Risk Groups in Cohort 1
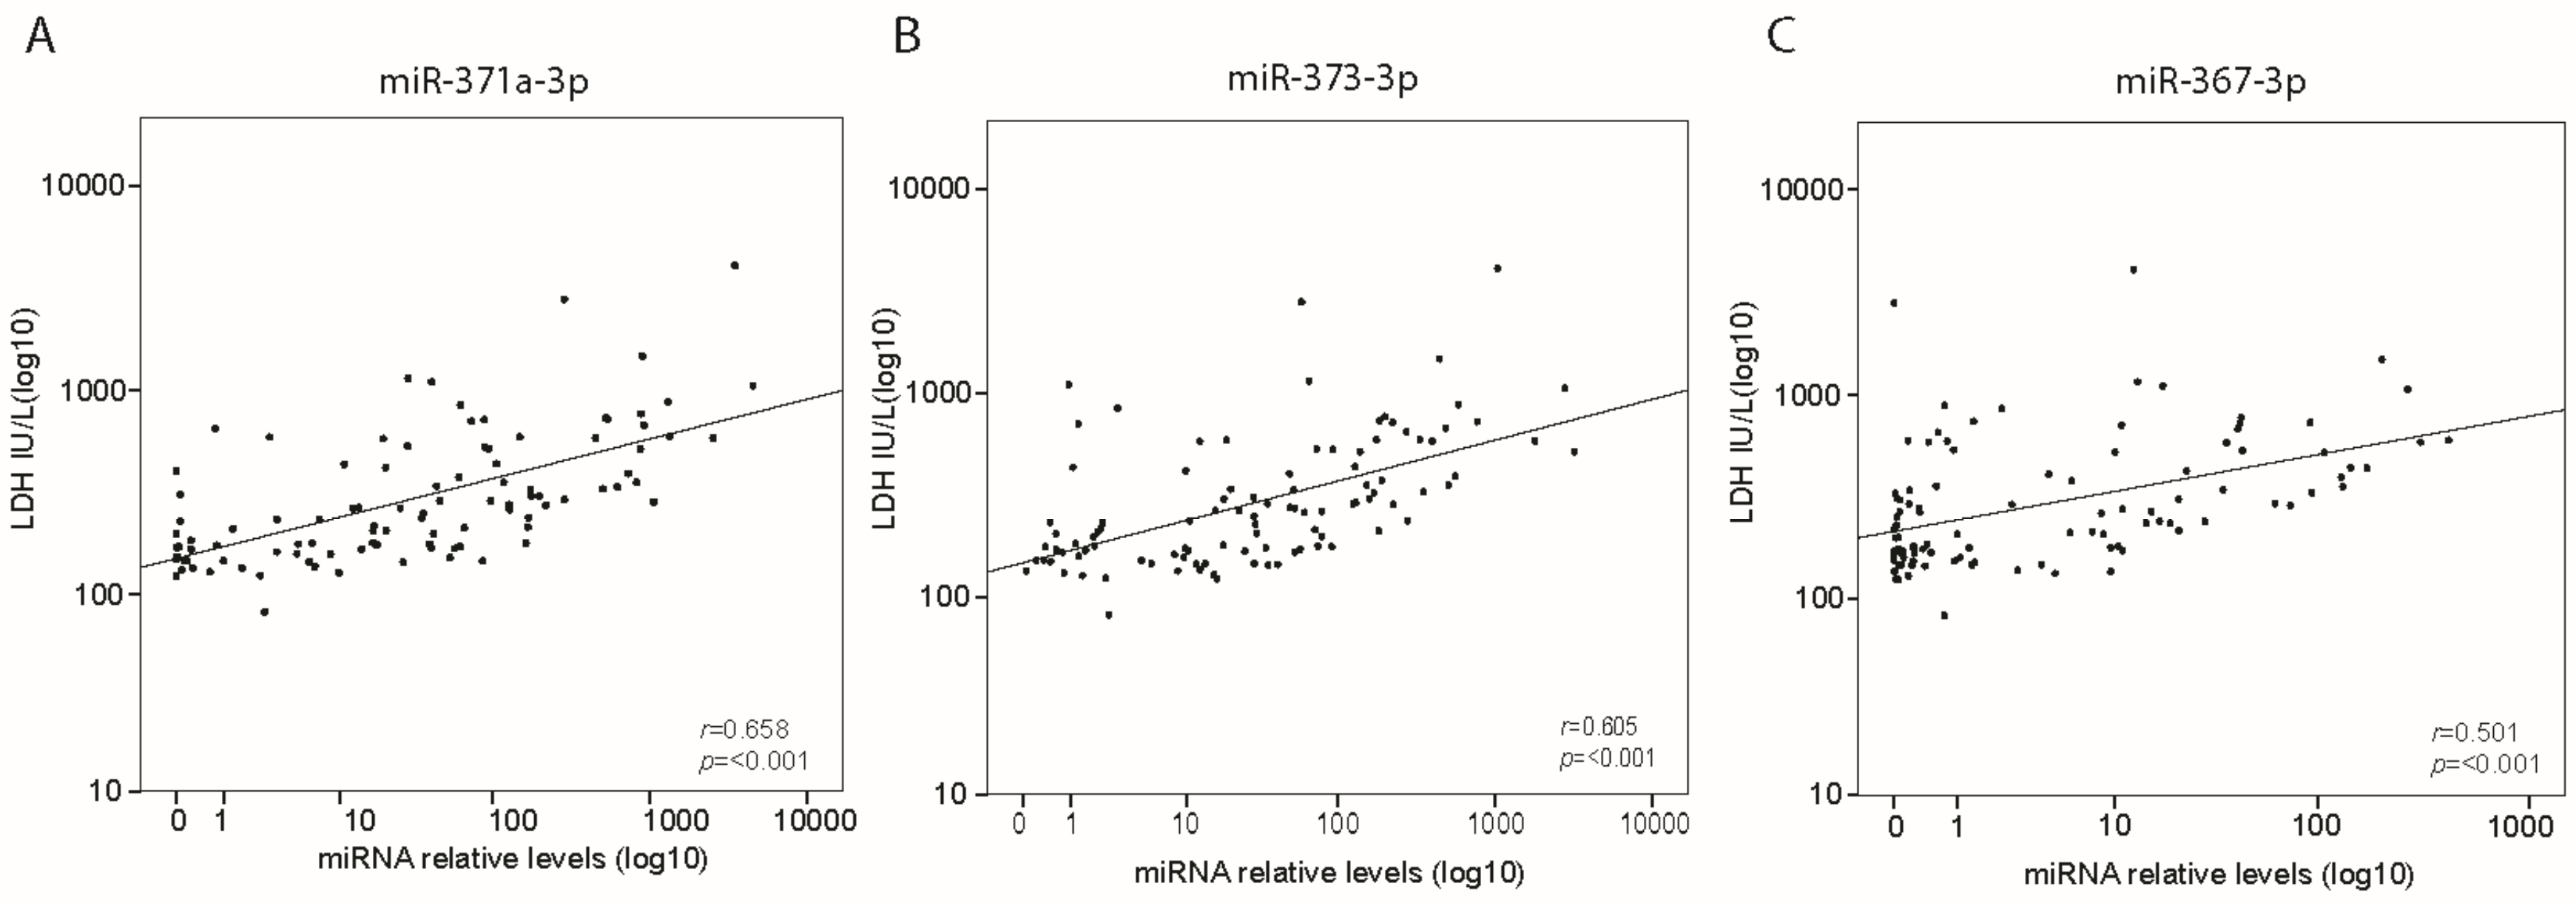
3.3. Association between miR Levels, Classical Tumor Markers and Clinical Features in Cohort 1 and 2 Combined
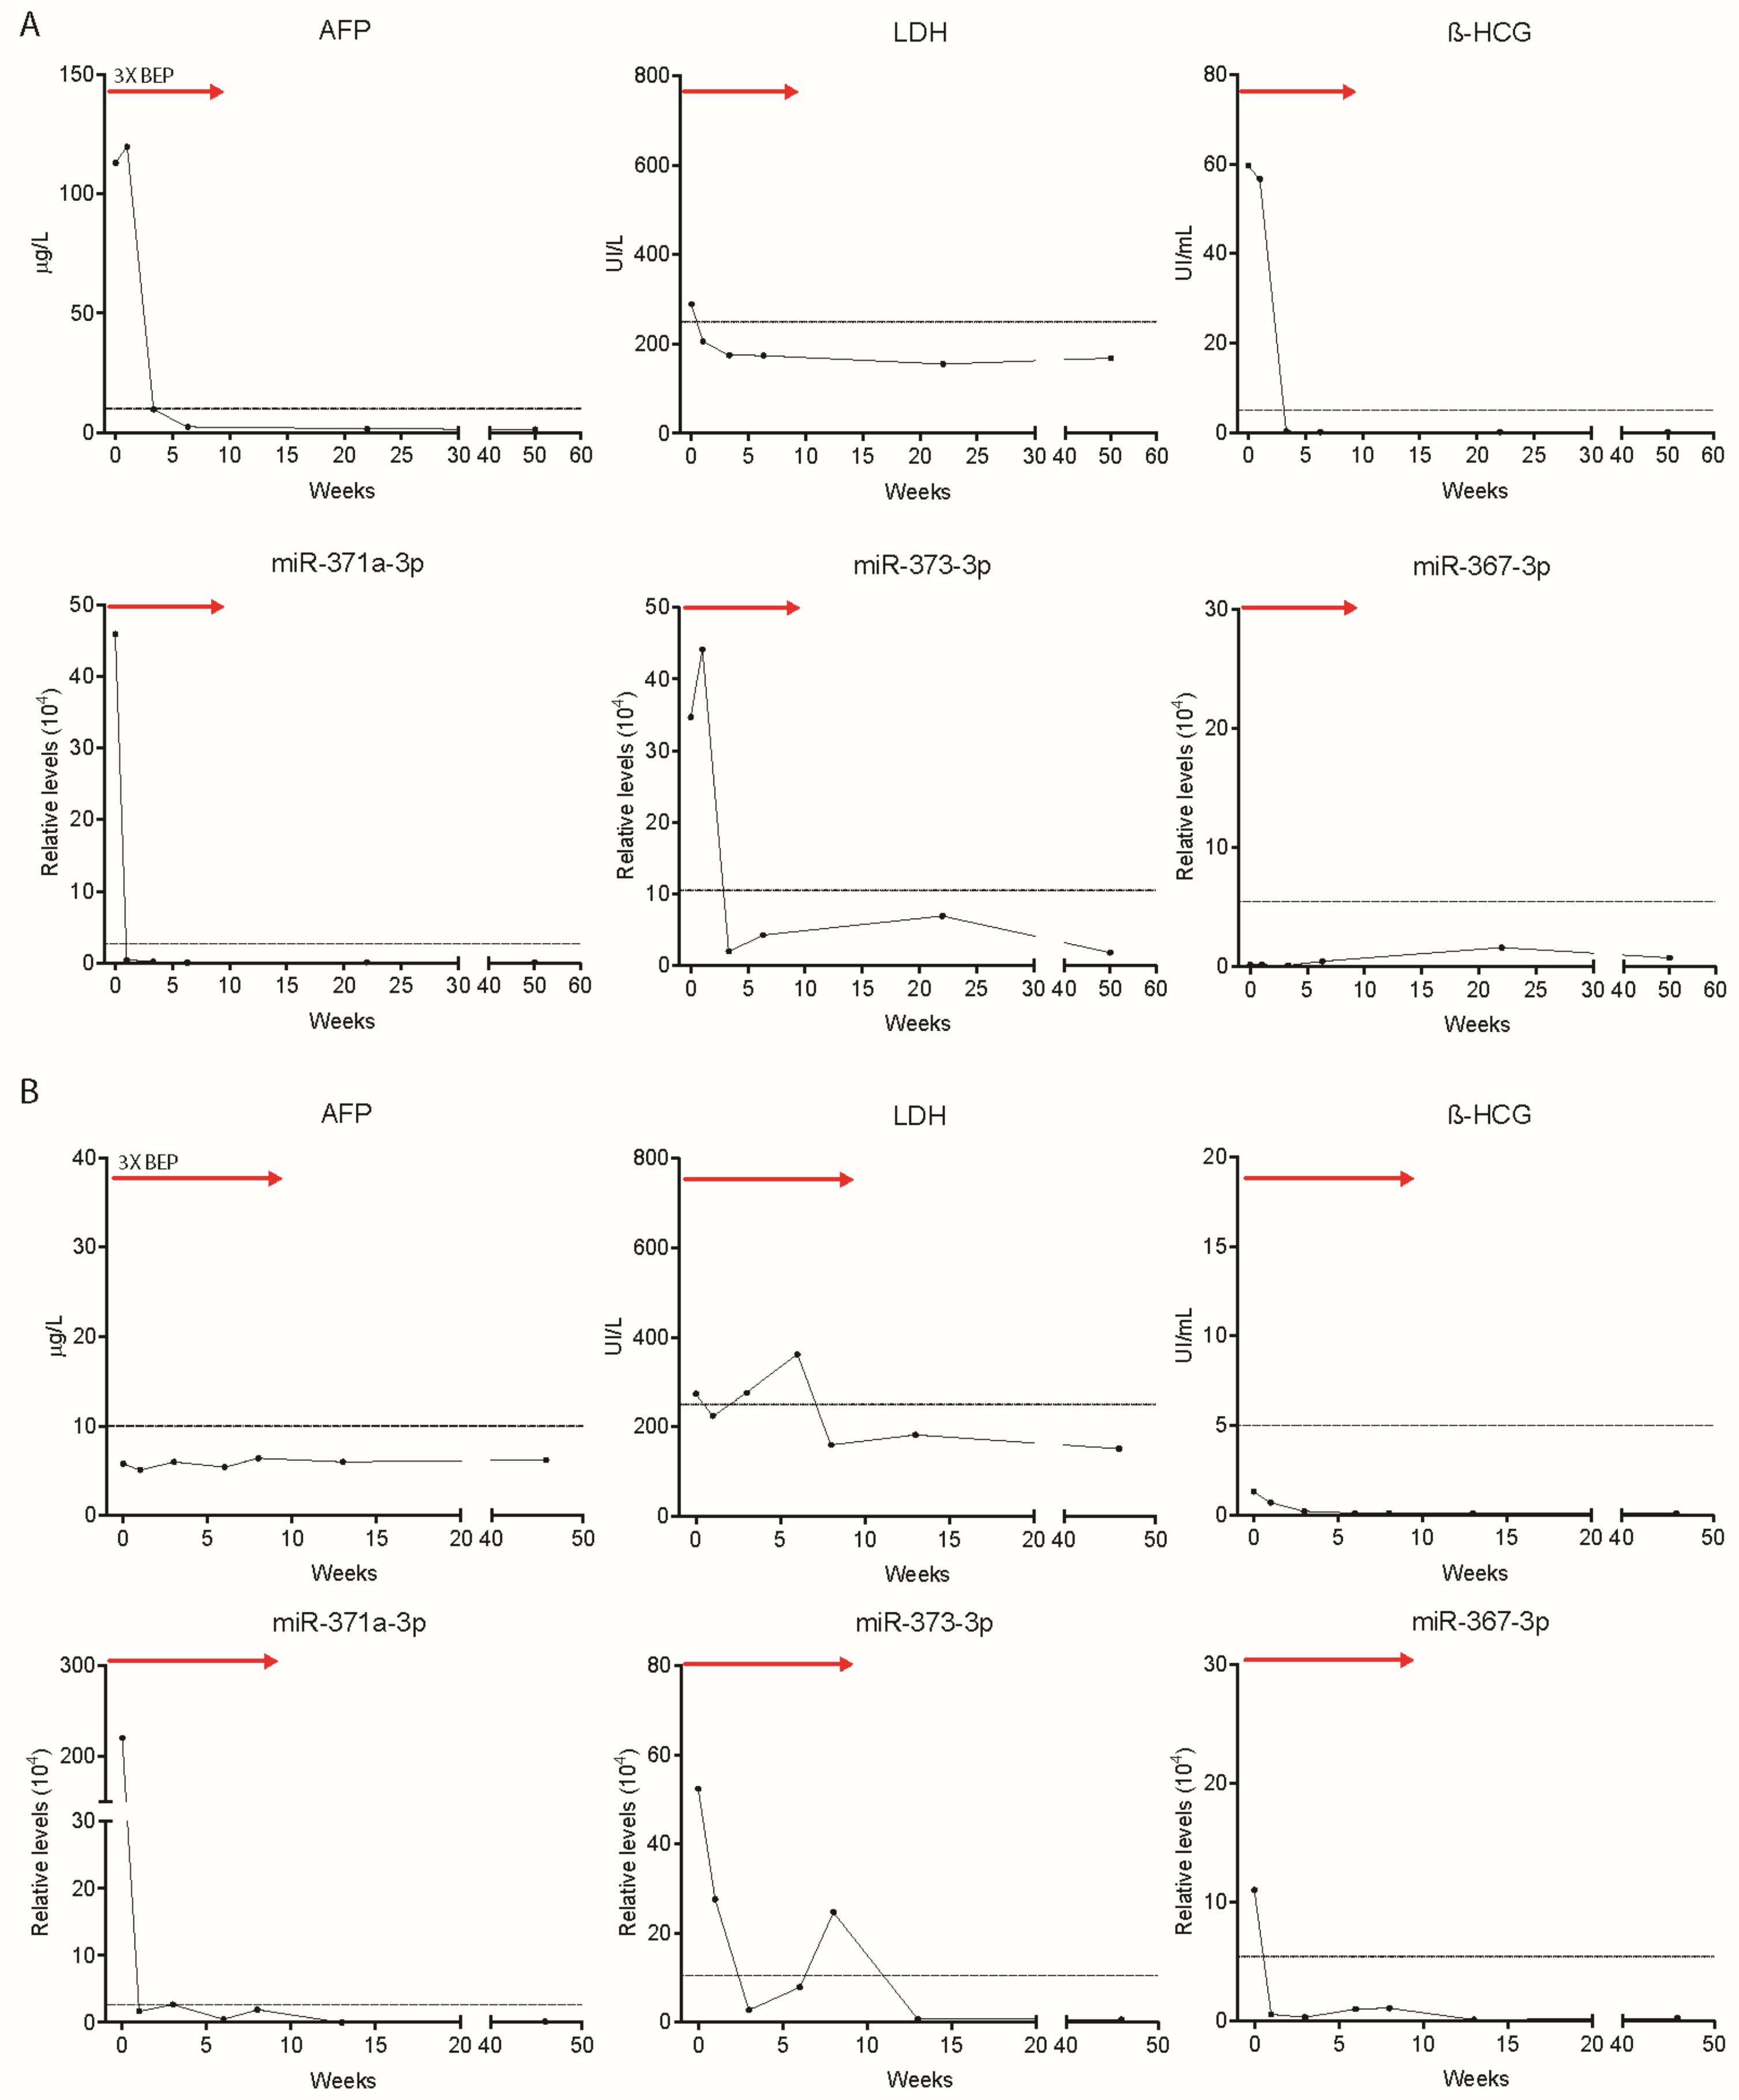
3.4. Use of miR Levels to Predict Relapse after a Complete Response, or Refractory Disease
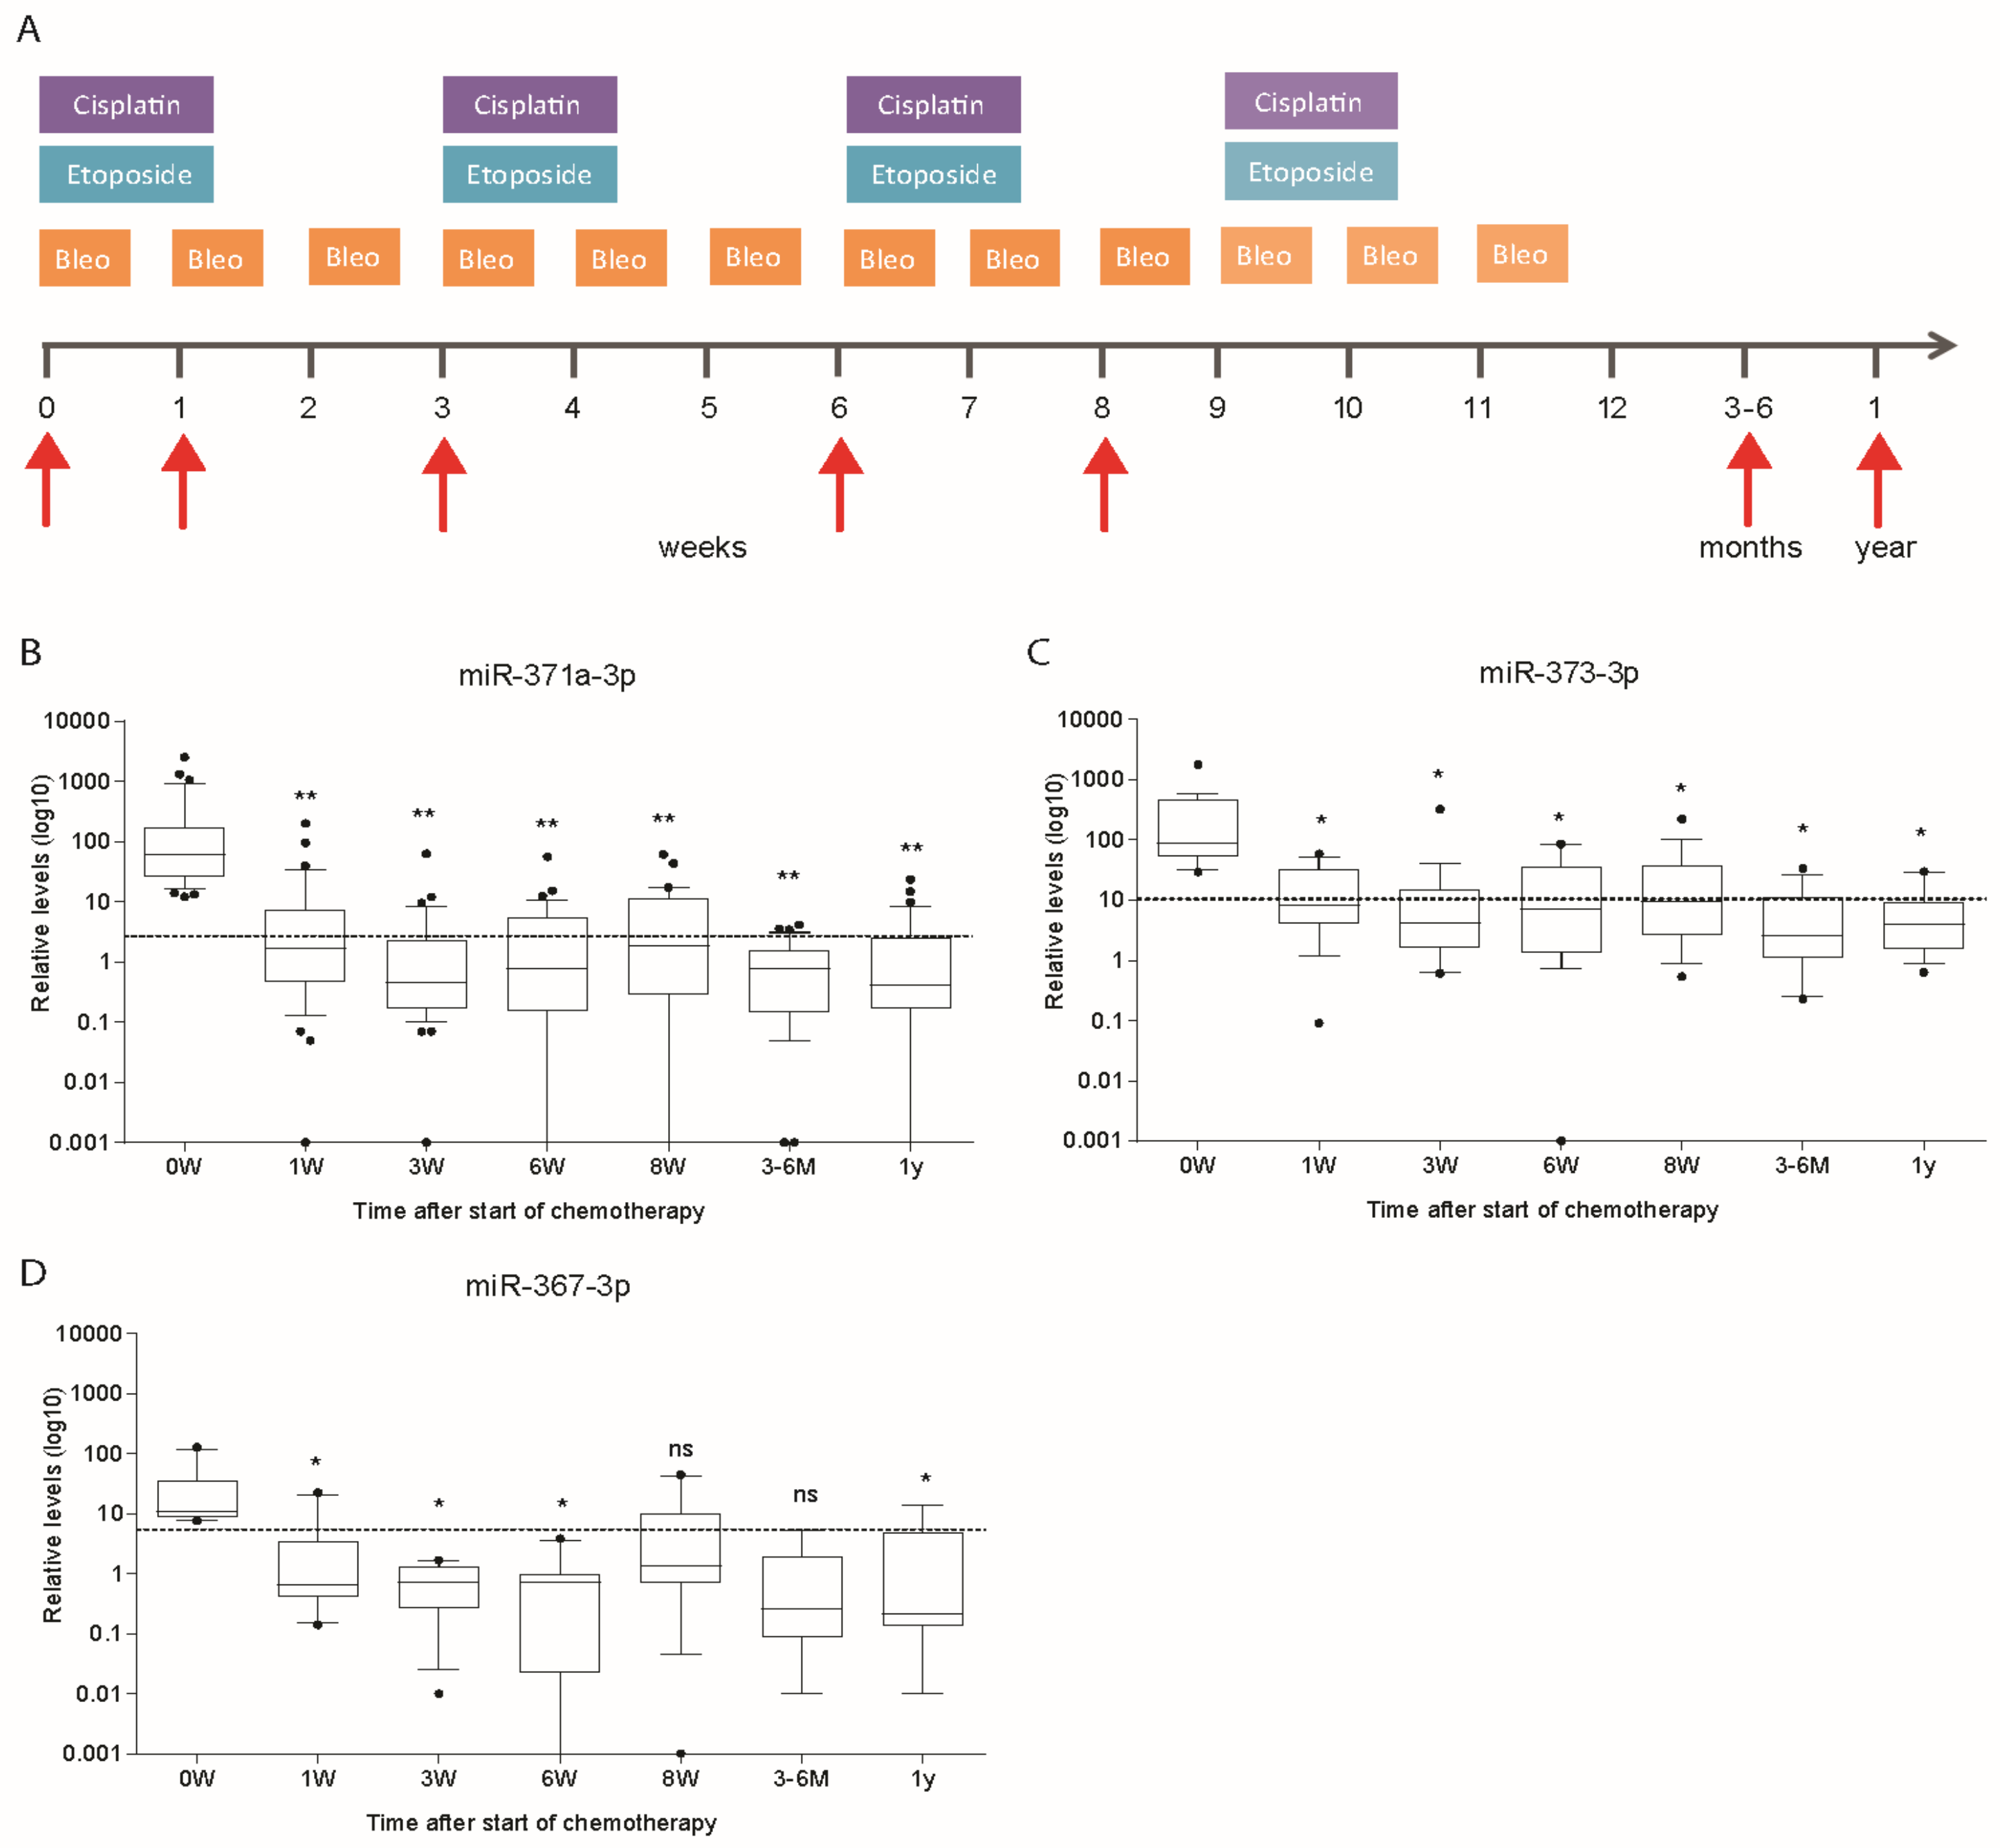
3.5. Kinetics of miR Levels during Chemotherapy in Cohort 1
3.6. The MiR Levels during Follow-up of Patients
4. Discussion
Supplementary Materials
Author Contributions
Funding
Conflicts of Interest
References
- Murray, M.J.; Huddart, R.A.; Coleman, N. The present and future of serum diagnostic tests for testicular germ cell tumours. Nat. Rev. Urol. 2016, 13, 715–725. [Google Scholar] [CrossRef] [PubMed] [Green Version]
- Albers, P.; Albrecht, W.; Algaba, F.; Bokemeyer, C.; Cohn-Cedermark, G.; Fizazi, K.; Horwich, A.; Laguna, M.P.; Nicolai, N.; Oldenburg, J. European Association of Urology. Guidelines on Testicular Cancer: 2015 Update. Eur. Urol. 2015, 68, 1054–1068. [Google Scholar] [CrossRef] [PubMed]
- Gilligan, T.D.; Seidenfeld, J.; Basch, E.M.; Einhorn, L.H.; Fancher, T.; Smith, D.C.; Stephenson, A.J.; Vaughn, D.J.; Cosby, R.; Hayes, D.F. American Society of Clinical Oncology Clinical Practice Guideline on uses of serum tumor markers in adult males with germ cell tumors. J. Clin. Oncol. 2010, 28, 3388–3404. [Google Scholar] [CrossRef] [PubMed]
- International Germ Cell Cancer Collaborative Group. International Germ Cell Consensus Classification: A prognostic factor-based staging system for metastatic germ cell cancers. J. Clin. Oncol. 1997, 15, 594–603. [Google Scholar] [CrossRef] [PubMed]
- van Dijk, M.R.; Steyerberg, E.W.; Habbema, J.D.F. Survival of non-seminomatous germ cell cancer patients according to the IGCC classification: An update based on meta-analysis. Eur. J. Cancer 2006, 42, 820–826. [Google Scholar] [CrossRef] [PubMed]
- Adra, N.; Althouse, S.K.; Liu, H.; Brames, M.J.; Hanna, N.H.; Einhorn, L.H.; Albany, C. Prognostic factors in patients with poor-risk germ-cell tumors: A retrospective analysis of the Indiana University experience from 1990 to 2014. Ann. Oncol. 2016, 27, 875–879. [Google Scholar] [CrossRef] [PubMed]
- Santarpia, M.; Liguori, A.; D’Aveni, A.; Karachaliou, N.; Gonzalez-Cao, M.; Daffinà, M.G.; Lazzari, C.; Altavilla, G.; Rosell, R. Liquid biopsy for lung cancer early detection. J. Thorac. Dis. 2018, 10, S882–897. [Google Scholar] [CrossRef] [PubMed]
- Voorhoeve, P.M.; le Sage, C.; Schrier, M.; Gillis, A.J.M.; Stoop, H.; Nagel, R.; Liu, Y.P.; van Duijse, J.; Drost, J.; Griekspoor, A.; et al. A genetic screen implicates miRNA-372 and miRNA-373 as oncogenes in testicular germ cell tumors. Cell 2006, 124, 1169–1181. [Google Scholar] [CrossRef] [PubMed]
- Chen, L.; Heikkinen, L.; Knott, K.E.; Liang, Y.; Wong, G. Evolutionary conservation and function of the human embryonic stem cell specific miR-302/367 cluster. Comp. Biochem. Physiol. Part D Genom. Proteom. 2015, 16, 83–98. [Google Scholar] [CrossRef] [PubMed] [Green Version]
- van Agthoven, T.; Looijenga, L.H.J. Accurate primary germ cell cancer diagnosis using serum based microRNA detection (ampTSmiR test). Oncotarget 2017, 8, 58037–58049. [Google Scholar] [CrossRef]
- Murray, M.J.; Bell, E.; Raby, K.L.; Rijlaarsdam, M.A.; Gillis, A.J.M.; Looijenga, L.H.J.; Brown, H.; Destenaves, B.; Nicholson, J.C.; Coleman, N. A pipeline to quantify serum and cerebrospinal fluid microRNAs for diagnosis and detection of relapse in paediatric malignant germ-cell tumours. Br. J. Cancer 2016, 114, 151–162. [Google Scholar] [CrossRef] [PubMed]
- Dieckmann, K.P.; Radtke, A.; Geczi, L.; Matthies, C.; Anheuser, P.; Eckardt, U.; Sommer, J.; Zengerling, F.; Trenti, E.; Pichler, R.; et al. Serum Levels of MicroRNA miR-371a-3p(M371 Test) as a new biomarker of testicular germ cell tumors: Results of a prospective multicentric study. J. Clin. Oncol. 2019, 37, 1412–1423. [Google Scholar] [CrossRef] [PubMed]
- Gillis, A.; Stoop, H.; Hersmus, R.; Oosterhuis, J.; Sun, Y.; Chen, C.; Guenther, S.; Sherlock, J.; Veltman, I.; Baeten, J.; et al. High-throughput microRNAome analysis in human germ cell tumours. J. Pathol. 2007, 213, 319–328. [Google Scholar] [CrossRef] [PubMed]
- Palmer, R.D.; Murray, M.J.; Saini, H.K.; van Dongen, S.; Abreu-Goodger, C.; Muralidhar, B.; Pett, M.R.; Thornton, C.M.; Nicholson, J.C.; Enright, A.J.; et al. Malignant germ cell tumors display common microRNA profiles resulting in global changes in expression of messenger RNA targets. Cancer Res. 2010, 70, 2911–2923. [Google Scholar] [CrossRef] [PubMed]
- Radtke, A.; Cremers, J.F.; Kliesch, S.; Riek, S.; Junker, K.; Mohamed, S.A.; Anheuser, P.; Belge, G.; Dieckmann, K.P. Can germ cell neoplasia in situ be diagnosed by measuring serum levels of microRNA371a-3p? J. Cancer Res. Clin. Oncol. 2017, 143, 2383–2392. [Google Scholar] [CrossRef] [PubMed] [Green Version]
- Leão, R.; van Agthoven, T.; Figueiredo, A.; Jewett, M.A.S.; Fadaak, K.; Sweet, J.; Ahmad, A.E.; Anson-Cartwright, L.; Chung, P.; Hansen, A.; et al. Serum miRNA predicts viable disease after chemotherapy in patients with testicular nonseminoma germ cell tumor. J. Urol. 2018, 200, 126–135. [Google Scholar] [CrossRef] [PubMed]
- van Agthoven, T.; Eijkenboom, W.M.H.; Looijenga, L.H.J. microRNA-371a-3p as informative biomarker for the follow-up of testicular germ cell cancer patients. Cell. Oncol. 2017, 40, 379–388. [Google Scholar] [CrossRef] [PubMed]
- Nappi, L.; O Neil, B.; Daneshmand, S.; Hamilton, R.J.; Leao, R.R.N.; Thi, M.; Chi, K.N.; Gleave, M.; Eigl, B.J.; Black, P.C.; et al. Circulating miR-371a-3p for the detection of low volume viable germ cell tumor: Expanded pilot data, clinical implications and future study. J. Clin. Oncol. 2018, 36, S4549. [Google Scholar] [CrossRef]
- Mego, M.; Agthoven, T.; Gronesova, P.; Chovanec, M.; Miskovska, V.; Mardiak, J.; Looijenga, L.H.J. Clinical utility of plasma miR-371a-3p in germ cell tumors. J. Cell. Mol. Med. 2019, 23, 1128–1136. [Google Scholar] [CrossRef]
- Jones, R.H.; Vasey, P.A. Part I: Testicular cancer—Management of early disease. Lancet Oncol. 2003, 4, 730–737. [Google Scholar] [CrossRef]
- Lubberts, S.; Boer, H.; Altena, R.; Meijer, C.; van Roon, A.M.; Zwart, N.; Oosting, S.F.; Kamphuisen, P.W.; Nuver, J.; Smit, A.J.; et al. Vascular fingerprint and vascular damage markers associated with vascular events in testicular cancer patients during and after chemotherapy. Eur. J. Cancer 2016, 63, 180–188. [Google Scholar] [CrossRef] [PubMed]
- Donohue, J.P.; Thornhill, J.A.; Foster, R.S.; Rowland, R.G.; Bihrle, R. Clinical stage B non-seminomatous germ cell testis cancer: The Indiana University experience (1965–1989) using routine primary retroperitoneal lymph node dissection. Eur. J. Cancer 1995, 31A, 1599–1604. [Google Scholar] [CrossRef]
- Ackers, C.; Rustin, G.J.S. Lactate dehydrogenase is not a useful marker for relapse in patients on surveillance for stage I germ cell tumours. Br. J. Cancer 2006, 94, 1231–1232. [Google Scholar] [CrossRef] [PubMed] [Green Version]


| Variable | Number (%) | |
|---|---|---|
| All Patients | Cohort 1 67 (100%) | Cohort 2 42 (100%) |
| Tumor type (histology) | ||
| -Non seminoma | 54 (80.3) | 31 (73.8) |
| Embryonal carcinoma $ | 44 | 19 |
| Choriocarcinoma | 6 | 9 |
| Yolk sac | 23 | 17 |
| Teratoma | 26 | 25 |
| Seminoma | 30 | 17 |
| -Pure Seminoma | 13 (19.7) | 10 (23.8) |
| -Extragonadal | 1 (2.4) | |
| IGCCCG Risk Group | ||
| -Good | 56 (83.6) | 11 (26.2) |
| -Intermediate | 10 (14.9) | 15 (35.7) |
| -Poor | 1 (1.5) | 16 (38.1) |
| Response to Chemotherapy | ||
| -Durable complete response (NED) | 60 (89.5) | - |
| -Relapse after complete response (NED) | 6 (9) | 28 (66.7) |
| -Refractory disease | 1 (1.5) | 14 (33.3) |
| Stage (Metastatic Disease) | ||
| -II | 54 (80.6) | 12 (28.6) |
| -III | 6 (9) | 6 (14.3) |
| -IV | 7 (10.4) | 24 (57.1) |
| RPLND [Post Chemotherapy] | ||
| -Yes | 32 (47.8) | 16 (38.1) |
| Necrosis/fibrosis | 11 | 5 |
| Teratoma | 20 | 8 |
| Vital carcinoma | 1 | 3 |
| -No | 35 (52.2) | 26 (61.8) |
| β-HCG Measurements | 61 (91) | 41 (98) |
| -Positive | 33 (54) | 31 (76) |
| -Negative | 28 (46) | 10 (24) |
| AFP Measurements | 62 (93) | 42 (100) |
| -Positive | 34 (55) | 27 (64) |
| -Negative | 28 (45) | 15 (36) |
| LDH Measurements | 60 (90) | 41 (98) |
| -Positive | 19 (32) | 32 (78) |
| -Negative | 41 (68) | 9 (22) |
© 2019 by the authors. Licensee MDPI, Basel, Switzerland. This article is an open access article distributed under the terms and conditions of the Creative Commons Attribution (CC BY) license (http://creativecommons.org/licenses/by/4.0/).
Share and Cite
Rosas Plaza, X.; van Agthoven, T.; Meijer, C.; van Vugt, M.A.T.M.; de Jong, S.; Gietema, J.A.; Looijenga, L.H.J. miR-371a-3p, miR-373-3p and miR-367-3p as Serum Biomarkers in Metastatic Testicular Germ Cell Cancers Before, During and After Chemotherapy. Cells 2019, 8, 1221. https://doi.org/10.3390/cells8101221
Rosas Plaza X, van Agthoven T, Meijer C, van Vugt MATM, de Jong S, Gietema JA, Looijenga LHJ. miR-371a-3p, miR-373-3p and miR-367-3p as Serum Biomarkers in Metastatic Testicular Germ Cell Cancers Before, During and After Chemotherapy. Cells. 2019; 8(10):1221. https://doi.org/10.3390/cells8101221
Chicago/Turabian StyleRosas Plaza, Ximena, Ton van Agthoven, Coby Meijer, Marcel A. T. M. van Vugt, Steven de Jong, Jourik A. Gietema, and Leendert H. J. Looijenga. 2019. "miR-371a-3p, miR-373-3p and miR-367-3p as Serum Biomarkers in Metastatic Testicular Germ Cell Cancers Before, During and After Chemotherapy" Cells 8, no. 10: 1221. https://doi.org/10.3390/cells8101221