mTOR: A Cellular Regulator Interface in Health and Disease

Biochemie Intrazellulärer Transportprozesse, Ruhr-Universität Bochum, 44801 Bochum, Germany
*
Author to whom correspondence should be addressed.
Cells 2019, 8(1), 18; https://doi.org/10.3390/cells8010018
Submission received: 10 December 2018
/
Revised: 25 December 2018
/
Accepted: 1 January 2019
/
Published: 2 January 2019
(This article belongs to the Special Issue 2018 Select Papers by Cells’ Editorial Board Members)
Abstract
:The mechanistic target of Rapamycin (mTOR) is a ubiquitously-conserved serine/threonine kinase, which has a central function in integrating growth signals and orchestrating their physiologic effects on cellular level. mTOR is the core component of differently composed signaling complexes that differ in protein composition and molecular targets. Newly identified classes of mTOR inhibitors are being developed to block autoimmune diseases and transplant rejections but also to treat obesity, diabetes, and different types of cancer. Therefore, the selective and context-dependent inhibition of mTOR activity itself might come into the focus as molecular target to prevent severe diseases and possibly to extend life span. This review provides a general introduction to the molecular composition and physiologic function of mTOR complexes as part of the Special Issue “2018 Select Papers by Cells’ Editorial Board Members”.
1. Assembly of the mTOR Signaling Complexes TORC1 and TORC2
The coordination of cell growth, cell size, organ shape and body plan is largely controlled by one serine/threonine kinase, the mechanistic target of Rapamycin (mTOR), which is, historically, also known as a mammalian target of rapamycin [1]. It has been described as an atypical protein kinase, because it is closely related to the phosphatidylinositol 3-kinase (PI3K) family of lipid kinases and represents the founding member of the small family of PI3K-related kinases (PIKK) [2]. Its name is based on the experimental approach that lead to the discovery of the two yeast proteins Tor1 and Tor2, which were found in a screen with the anti-fungal, bacterial macrolite rapamycin in Saccharomyces cerevisiae [3]. Rapamycin acts as an immunosuppressant in mammals and is used as prevention against the rejection of organ transplants. The name is derived from the fact that it was isolated for the first time from the bacterium Streptomyces hygroscopicus found on Easter Island (Rapa Nui) [4,5].
Mammals exhibit one mTOR protein, which represents the core component of two multi-subunit complexes. The TOR complex 1 (TORC1) integrates signals that sense the availability of amino acids, oxygen, growth factors as well as the cellular energy or stress levels (Figure 1). As a result, TORC1 promotes cell growth via its support of protein biosynthesis, cell cycle and cellular metabolism as well as the inhibition of autophagy. The TOR complex 2 (TORC2) functions mainly in the organization of the cytoskeleton [6,7] (Figure 1). The activity of TORC1 can be blocked by Rapamycin via an indirect mechanism. In this case, rapamycin forms an inhibitory complex by binding to the TOR-associated immunophilin FKBP12 (FK506 binding protein 12 kDa) [8,9]. TORC2 is rapamycin-insensitive. The binding site for Rapamycin-bound FKB12, the FRB domain (Figure 2), in mTOR is blocked by the TORC2-specific protein Avo3 in S. cerevisiae [10] and the mSIN1-RICTOR unit in mammals [11,12]. However, in mammalian systems it was shown that a long-term exposure to rapamycin abrogates mTORC2 signaling as a secondary effect. The rapamycin-associated mTOR may not be able to recycle from TORC1 in order to be incorporated into new TORC2 complexes [13,14].
The core complex of TORC1 consists of mTOR, RAPTOR (regulatory protein with mTOR) and mLST8 (mammalian lethal with Sec13 protein 8) [15,16,17] (Figure 2). RAPTOR binds to the HEAT repeat region in the amino-terminal half of mTOR. It functions as substrate adaptor, because it binds to the TOS (TOR signaling) motif that is present in several TORC1 substrates. Moreover, it is also involved in the correct lysosomal targeting of TORC1 [18,19]. Due to its important role, RAPTOR is the target of the endogenous negative-regulator protein PRAS40 (proline-rich AKT substrate of 40 kDa), which is together with DEPTOR (DEP domain containing mTOR interacting protein) [20,21,22] one of the two negative regulators of mTOR activity. mLST8 binds to the kinase domain of mTOR and is thought to support mTOR activity by stabilizing the kinase activation loop [23,24,25]. Therefore, it has been suggested that the mTOR and mLST8 hetero-dimer represents the core complex of TORC1 [26]. Several structural studies with mammalian and yeast TORC1 have addressed the composition of the complex as well as the inhibition mode used by Rapamycin to inhibit mTOR activity. Cryo-EM data have revealed that TORC1 forms a 1 mDa ‘lozenge’-shaped dimer. The contact sites that form the dimerization interface comprise the interaction between the HEAT domains of the two mTOR molecules as well as the association of mTOR of the first monomer-part with the RAPTOR of the second part [26,27,28]. The work with crystal structures has revealed that the FRB domain of mTOR is directly involved in the interaction with mTOR substrates. This kinase-substrate interaction is blocked when rapamycin-FKB12 binds to the FRB domain. Therefore, FRB functions as a gatekeeper, as FRB-bound rapamycin-FKBP12 inhibits mTOR activity by directly blocking substrate recruitment and restricting active-site access [24,29]. The TTT (TEL2-TTI1-TTI2)-complex functions as a chaperone for several PIKK family members and is also important as assembly factor and scaffold that stabilize TORC1 [30,31].
TORC2 also contains the constituents mTOR, mLST8, DEPTOR as well as the associated TTT-complex [30,32]. In contrast to TORC1, the adaptor protein RAPTOR is replaced by RICTOR (rapamycin insensitive companion of mTOR) as HEAT-domain binding module of TORC2 [20,33,34,35]. Moreover, RICTOR also binds to the regulatory factors PROTOR1/2 [36,37,38] and mSIN1 [39,40,41]. A recently published structures of the mammalian TORC2 reveal that mSIN1-RICTOR are located close to the FRB-domain of mTOR and, therefore, mediate the rapamycin-insensitivity of TORC2 [11,12].
The mTOR pathway is well conserved from yeast to man and, therefore, can be regarded as a major growth regulator in virtually all eukaryotic cells. S. cerevisiae has also two distinct mTOR-containing complexes (Table 1). In this case, TORC1 can contain either Tor1 or Tor2, while TORC2 contains Tor2 only. Moreover, homologs of RAPTOR (Kog1), mLST8 (Lst8), RICTOR (Avo3), as well as mSIN1 (Avo1) have been described for yeast. However, several additional complex constituents and regulating factors are specific for mammals or yeast (Table 1), based on the different requirements in the sensing of the vastly different environmental conditions that are relevant for unicellular and multicellular organisms [42,43].
2. Upstream Factors: Integration of Environmental Signals
In general, TORC1 supports anabolism-linked reaction pathways. Therefore, the presence of enough energy equivalents and molecular building blocks within the cell stimulates TORC1 activity, which then promotes cellular growth. In contrast, inhibiting factors should signal the contrary information during fasting or cellular stress, namely the lack of enough resources required for further cell growth and proliferation, resulting in a block of TORC1 activity. This is the basic form that also more divergent and complex signaling TOR pathways are related to. Upstream signaling factors include growth indicators, energy level, oxygen status, DNA homeostasis, and amino acid concentrations (Figure 3).
Most growth factors that stimulate TORC1 are blocked by the tuberous sclerosis complex (TSC). TSC is a trimeric complex that comprises TSC1, TSC2 and TBC1D7 (TBC 1 domain family member 7) [44]. TSC2 functions as a GTPase activating protein (GAP), which is structurally stabilized and enzymatically stimulated by TSC1 and TBC1D7 [44,45,46]. TSC acts as GAP for the small GTPase RHEB (RAS homolog enriched in brain). On its own, the GTP-bound form of RHEB directly interacts with the catalytic domain of mTOR and, therefore, activates TORC1 [21,47,48,49]. In general, GTPases bind their interaction partners in the GTP-bound form. The stimulation of the GTPase activity by a GAP protein results in the hydrolysis of GTP and dissociation of the GTPase from the interacting partners, which ends the physiologic signaling output of the GTPase [50]. Here, TSC stimulates the GTPase activity of RHEB and, therefore, inactivates it, resulting in a downregulation of the RHEB-dependent support of TORC1 function.
On the other hand, TSC itself can be inactivated, when an upregulation of TORC1 signaling is again required. This relieve of the TSC-dependent inhibition of TORC1 is mediated via different growth factor pathways. The TSC2 subunit is phosphorylated and inactivated by the kinase AKT1 (Ak strain transforming 1), which was stimulated by the insulin/insulin-like growth factor-1 (IGF-1) pathway [51,52,53]. Moreover, AKT1 can also directly phosphorylate and inactivate the negative regulatory TORC1 subunit PRAS40 [21]. TSC2 can also be phosphorylated by the MAP kinase ERK (extracellular signal-regulated kinase), which had been activated via the receptor tyrosine kinase-dependent RAS pathway [54,55]. In summary, in many cases growth factors activate TORC1 by inhibiting the TORC1-negative regulator TSC.
In the context of the influence of the energy and oxygen status in TORC1 signaling, the central enzyme is the AMP-activated protein kinase (AMPK). It is activated during intracellular or environmental stress conditions that are caused by low ATP levels, DNA damage, or hypoxia. Therefore, AMPK acts as a metabolic regulator under stress conditions when cell growth is not favorable and should be limited.
The tumor suppressor LKB1 (liver kinase B1) is activated during energy stress, resulting in the phosphorylation and activation of AMPK [56]. Subsequently, AMPK can inhibit TORC1 indirectly by phosphorylating and activating TSC2 [57,58]. It also acts on TORC1 directly by phosphorylating and inactivating RAPTOR [59]. AMPK is indirectly activated during hypoxia, which is caused by the decreasing ATP-level [60]. Moreover, an additional layer of TORC1 inhibition is specifically mediated by the hypoxia-induced REDD1 (regulated in DNA damage and development 1), which binds and activates TSC [60,61].
The DNA damage-response is related to the cellular stress pathways. TORC1 is thought to be inhibited via the induction of p53 target genes, including the AMPK regulatory subunit (AMPKβ), PTEN and TSC2, resulting in an increase in TSC activity and therefore TORC1 inhibition [62].
TORC1 activation is tightly coupled to diet-induced changes in amino acid concentrations, because amino acids are not only essential building blocks of proteins, but also sources of energy and carbon for many other metabolic pathways [25]. Moreover, recent work from the fungus Neurospora crassa shows that a RAGULATOR-like protein is involved in amino acid sensing, as well as in the regulation of the circadian clock, strongly suggesting a coordinated link between circadian rhythms and TOR-dependent metabolism [63].
The RAG GTPase complex plays a central role in amino acid-based activation of TORC1 [64,65]. The RAG core complex consists of an obligate GTPase heterodimer, which can be formed by different combinations of either RAG A or RAG B with either RAG C or RAG D [66,67]. The RAG complex is bound to the lysosomal membrane through the pentameric RAGULATOR (LAMTOR) complex [68,69]. Upon stimulation with amino acids, the RAG proteins are converted into their GTP-bound state, which enables them to recruit TORC1 to the lysosome via an interaction with the RAPTOR subunit. This assembly also allows the interaction of TORC1 to lysosomal RHEB. This explains why both RHEB and RAG have to be activated in order to start TORC1 signaling and why both growth factors as well as amino acids have to be present for full activation of TORC1.
TORC1 senses cytosolic as well as intra-lysosomal amino acids via different mechanisms. The lysosomal amino acid transporter SLC38A9 functions as an arginine sensor for TORC1 [70,71,72,73]. SLC38A9 interacts with the v-ATPase associated RAGULATOR complex, which then functions as a guanine-nucleotide exchange factor (GEF) and therefore as activator of the RAG GTPase complex [68,74].
Cytosolic amino acids, as demonstrated for arginine and leucine, are sensed by TORC1 through the dynamic interplay of the GATOR1 and GATOR2 complexes [75]. The GATOR1 complex is tethered to the lysosomal membrane by the KICSTOR complex. GATOR1 functions as a GAP for the RAG A/B GTPases and, therefore, as an inhibitor of TORC1 [76,77]. In contrast, the GATOR2 complex acts as a positive regulator of TORC1. It does so by binding and inhibiting GATOR1 at the lysosome [75]. GATOR2 itself is blocked by CASTOR1 and SESTRIN2 under amino acid deprivation [78,79]. The association of arginine with CASTOR1 prevents the interaction of CASTOR1 with GATOR2. Similarly, leucine blocks the interaction of SESTRIN2 with GATOR2. Therefore, CASTOR1 functions as arginine sensor, while SESTRIN2 acts as leucine sensor in the context of TORC1 signaling [80,81,82,83,84]. Thus, both arginine and leucine stimulate TORC1 activity at least in part by releasing inhibitors from GATOR2, establishing GATOR2 as a central node in the sensing of amino acids by TORC1 [25]. However, there are also GATOR2-independent amino acid sensing modes. Glutamine is sensed via the RAG-related ARF family GTPases [85]. Another example is the FOLLICULIN-FNIP2 complex, which acts as a GAP for RAG C/D. RAG C/D is an unusual GTPase dimer, as it binds TORC1 not in its GTP-, but in its GDP-bound form [86]. Therefore, FOLLICULIN-FNIP2 acts as an amino acid-dependent positive regulator of TORC1 [86,87,88].
TORC2 is mainly regulated by the insulin/PI3K signaling pathway [25]. The presence of insulin and the downstream formation of the signaling lipid PtdIns(3,4,5)P3 (PIP3) activates TORC2. The TORC2 subunit mSIN1 exhibits the phosphoinositide-binding PH-domain, which is required for the insulin-dependent regulation of TORC2. The PH-domain of mSIN1 inhibits the catalytic activity of TORC2 in the absence of insulin [89]. Moreover, mSIN1 can be phosphorylated and activated by AKT1. This interdependence is an example for the existence of a positive-feedback loop. Partial activation of AKT1 promotes the activation of TORC2, which results in a phosphorylation of AKT1 by TORC2 [90].
Interestingly enough, TORC2 signaling can be inhibited by TORC1. GRB10, which is a negative regulator of insulin/IGF-1 receptor signaling upstream of AKT1, is phosphorylated and activated by TORC1 [91,92]. GRB10 disrupts the interaction of the insulin receptor with the downstream insulin receptor substrate 1 (IRS1). Moreover, IRS1 can be phosphorylated and inactivated by the TORC1 target S6K1, which results in a negative feedback loop of both TORC1 and TORC2 signaling [93].
3. Downstream Factors of mTOR Signaling
TORC1 has a central role in controlling the balance of anabolism and catabolism in response to environmental conditions [32]. Since one of the main functions of TORC1 is to support cell growth, it also regulates the increased production of the required proteins, lipids and nucleotides. In line with this, it downregulates catabolic pathways like autophagy. In general, TORC1 regulates many of these processes via phosphorylation of translation-linked proteins (Figure 4).
Protein biosynthesis is promoted by TORC1 mainly through the direct phosphorylation of two key effectors, namely the ribosomal protein S6 kinase 1 (S6K1) and the eukaryotic translation Initiation factor 4B (eIF4E) binding protein (4EBP) [94].
S6K1 is a serine/threonine protein kinase that phosphorylates and activates eIF4B, which functions as a positive regulator of the 5’ cap binding eIF4F complex, as well as several other substrates that promote mRNA translation initiation [95]. Another S6K1 target is the eIF4B-inhibitor PDCD4. The phosphorylation by S6K1 results in the proteasomal degradation of PDCD4 [96]. While translation is supported by S6K1, it is inhibited by 4EBP, which binds the translation initiation factor eIF4E in order to prevent the assembly of the eIF4F complex. Like S6K1, 4EBP is also a direct target of TORC1. In this case the phosphorylation results in an inhibition of the target, as phosphorylated 4EBP dissociates from eIF4E and, therefore, allows the 5’ cap-dependent translation to occur [97,98]. Therefore, many pathways are regulated by TORC1 on translational level. While acute inhibition of TORC1 moderately downregulates mRNA translation in general, mRNAs containing the TOP (5’ terminal oligopyrimidine) or TOP-like motifs are affected in particular [99,100].
Since growing cells require sufficient amounts of lipids for the extension of their membranes, TORC1 promotes de novo lipid synthesis. TORC1 activates the sterol responsive element binding protein (SREBP) transcription factors, which control the expression of genes involved in lipogenesis [101]. Normally, low sterol levels activate SREBP. However, TORC1 signaling can also support SREBP independently of sterol levels via two distinct mechanisms: TORC1 activates S6K1, which then mobilizes SREBP [102], or alternatively, TORC1 phosphorylates and inactivates the SREBP-inhibitor LIPIN1 [103]. Growing and proliferating cells rely on an enhanced biosynthesis of nucleotides. TORC1 supports this process as well as the biogenesis of ribosomes [104,105]. Purine synthesis is supported by TORC1 via the phosphorylation of the activating transcription factor 4 (AFT4), which then mediates the expression of the enzyme methylenetetrahydrofolate dehydrogenase 2 (MTHFD2) as a central component of the mitochondrial tetrahydrofolate cycle that provides one-carbon units for this process [106]. Pyrimidine synthesis is promoted by TORC1 via S6K1, which phosphorylates and activates the carbamoyl-phosphate synthetase (CAD), a critical component of the de novo pyrimidine synthesis pathway [107,108].
Cellular growth is supported by TORC1 by the facilitation of the incorporation of nutrients into new biomass. This requires a TORC1-dependent shift in glucose metabolism from oxidative phosphorylation to glycolysis. TORC1 enhances the translation of the transcription factor HIF1a, which is involved in the expression of several glycolytic enzymes such as phosphofructokinase (PFK) [102]. Moreover, TORC1-dependent activation of SREBP results in an enhanced influx of glucose to the oxidative part of the pentose phosphate pathway. This pathway utilizes glucose in order to generate NADPH and, depending on the environmental fine tuning, either glycolysis intermediates or pentoses for nucleotide synthesis [109].
In contrast, TORC1 suppresses protein turnover mainly via the inhibition of autophagy. This is accomplished via posttranslational modification of autophagy key factors required for the formation of the autophagosome. ULK1 and ATG13 are early acting factors that are required for the initiation of autophagy and which are therefore phosphorylated and inhibited by TORC1 [110,111,112]. ULK1, for instance, is phosphorylated by TORC1 under conditions when enough nutrients are available. This inhibiting phosphorylation prevents the binding of ULK1 to and the activation by AMPK [111]. TORC1 inhibits autophagy also via transcription control. Under nutrient replete conditions, TORC1 phosphorylates the transcription factor EB (TFEB) and thereby blocks its nuclear translocation and therefore inhibits expression of genes for lysosomal and autophagosomal biogenesis [113,114,115].
The ubiquitin-proteasome system (UPS) is the other important pathway for protein turnover in the cell. Proteins that should be degraded are selectively marked by ubiquitination, which functions as recognition signal for the 26S proteasome. The different observations of the involvement do not fit into one coherent model yet. Acute TORC1 inhibition by rapamycin promotes proteolysis via ERK5 [116,117] in order to gain free amino acids for TOR1 re-activation, while prolonged TORC1 activation also seems to trigger an increased protein turnover via the transcription factor erythroid-derived 2-related factor 1 (NRF1) [118,119,120] in order to balance the increased rate of protein synthesis.
TORC2 controls cellular function and proliferation via the phosphorylation of several members of the AGC (PKA/PKG/PKC) family of protein kinases. Especially, members of the PKC subfamily, which regulate various aspects of cytoskeletal remodeling and cell migration, are TORC2 targets [33,34,121,122,123], like e.g., PKCδ, which has a central role in the upregulation of β1 integrin levels [124] (Figure 5). Another target of the AGC-kinase family is SGK (serum and glucocorticoid kinase), which regulates ion transport as well as cell survival, e.g., via the stabilization of the E3 ligase MDM2, which then blocks pro-apoptotic signaling by ubiquitinating p53 [125,126].
AKT1, which is a key effector of insulin/PI3K signaling [127], is phosphorylated and activated by TORC2 (Figure 3 and Figure 5). AKT1 supports cell survival, cell growth and proliferation via the phosphorylation and inactivation of several key factors, like the FOXO1/3a transcription factors or the TORC1 inhibitor TSC2 [40,128].
4. mTOR Activity Is a Metabolic Marker for the Potential Survival of Cancer Cells
Hyperactivation of TORC1 is linked to carcinogenesis via different mechanisms. Potential upstream factors are the tuberous sclerosis genes TSC1 and TSC2. Inherited mutations can cause autosomal-dominant hamartomas [129,130] and lymphangioleiomyomatosis [131]. Another important factor in this context is mutated and inactivated p53, which is in its active form a well described tumor-suppressor that downregulates cell division [132,133,134]. p53 acts against TORC1 by transactivating its negative regulators AMPK and TSC2 [62].
The downstream effects of mTOR in carcinogenesis are linked to the activation of a signaling network that enhances glycolysis via the upregulated expression of pyruvate kinase [135]. Pyruvate kinase (isoenzyme M2) is a well-described mediator of the so-called Warburg effect. The Warburg effect is a central metabolic characteristic of cancer cells that rely mostly on cytosolic substrate-level phosphorylation during anaerobic glycolysis and less on mitochondrial oxidative phosphorylation for ATP production [136,137]. Therefore, the survival of tumor cells under hypoxic conditions relies on a HIFa-dependent upregulation of glycolytic gene expression, resulting in energy production under nearly anaerobic glycolysis conditions [138,139]. Another important glycolytic enzyme is hexokinase isoform II (HK II), which is upregulated in several malignant tumors. The synthesis of HK II is stimulated by TORC1 via HIF1a in the presence of glucose and insulin, allowing the support of anaerobic glycolysis in cancer cells. However, under conditions when this pathway is hampered, e.g., under glucose deprivation or in insulin-resistant cells, HK II can bind directly to TORC1 and inhibit its function. As a result, the TORC1-mediated block of autophagy is relieved and the cells can use nutrients recycled from the lysosome, e.g., for gluconeogenesis [140,141].
The role of autophagy in health and disease has been described as a double-edged sword [142,143]. One the on hand, it enables tumor cell survival under stress conditions, while on the other hand it protects healthy cells against oncogenic transformation. Therefore, another downstream effect of TORC1 signaling in promoting carcinogenesis is based on its inhibition of autophagy [110,144]. In general, autophagy protects healthy cells by lowering the risk of genomic mutation via the removal of damaged ROS-producing organelles, like mitochondria and peroxisomes [145,146,147]. Recent meta-analyses strongly indicate that the defined and controlled inhibition of mTOR activity reduces the incidence of a variety of cancers [148,149].
In summary, TORC1 raises the possibility for the oncogenic transformation of cells via the inhibition of autophagy and it supports the survival of cancer cells via the promotion of glycolysis.
TORC2 activation has been shown to support tumor growth in combination with a loss of function of PTEN (phosphatase and tensin homolog), which antagonizes PI3K signaling [150]. Especially the support of lipogenesis by TORC2 has been shown to be associated with steatosis and certain kinds of cancers [151,152].
5. Involvement of mTOR Activity in Obesity and Diabetes
Enhanced activation of TORC1 and increased downstream signaling has been implicated in important metabolic diseases, such as obesity and diabetes. Prolonged activation of the mTOR signaling pathway in liver and skeletal muscle of obese rats suggested a possible role of mTOR in obesity-linked insulin resistance [153]. Moreover, TORC1 contributes to amino acid-induced insulin resistance via its direct target S6K1. Phosphorylated and activated S6K1 as well as phosphorylated and inactivated IRS1 can be detected in hyperaminoacidemia and postprandial hyperinsulinemia [154]. In principle, insulin activates TORC1 signaling via AKT1. After a threshold of TORC1 activity is reached, IRS1 is phosphorylated and inactivated, which finally downregulates insulin sensitivity in a negative feedback loop [155].
The activity of TORC1 has been shown to be required for the differentiation of adipocytes in mice and humans [156,157]. Interestingly, this effect was shown to be time- and context-dependent. While short-term inhibition of TORC1 by rapamycin causes TORC2-mediated insulin resistance [13,158], the long-term blockade of TORC1 was reported to reduce high-fat diet-induced obesity in mice [159,160].
These findings are important in the context of type 2 diabetes, which is characterized by insulin resistance in the expanding adipose tissue of obesity. The downregulation of the FOXO1 transcription factor, which is a TORC2 target, mimics the insulin-resistant state of type 2 diabetes in human primary adipocytes [161]. Moreover, TORC2 phosphorylates and stabilizes the ubiquitin-ligase FBW8 (F-box/WD repeat containing protein 8), which then marks IRS1 for degradation, resulting in insulin-resistance by prolonged TORC2 activation [93,162].
6. mTOR Signaling in Aging
The regulation of mTOR is a central factor during the aging process of diverse organisms. The reduction of mTOR signaling has been demonstrated to extend lifespan in Caenorhabditis elegans [163], Drosophila melanogaster [164,165], Saccharomyces cerevisiae [166,167], as well as Mus musculus [168]. Similarly, inhibition of proteins that are tightly associated with a positive signaling output of mTOR, like RAGULATOR of C. elegans or S6K1 of mice [169], also results in extended lifespan under the tested conditions. Therefore, mTOR is often regarded as the currently best studied target for pharmacological treatment to extend lifespan [170,171,172,173]. Interestingly enough, the other important factor that influences longevity is caloric restriction, which is defined as a reduction in nutrient intake without incurring malnutrition. Different tested caloric restriction conditions do not further extend lifespan in S. cerevisiae, C. elegans, or D. melanogaster when combined with a reduction in mTOR signaling, which strongly suggests that both share overlapping mechanisms [164,166,174]. The pivotal mediator of the TORC1-dependent nutrient-signaling network underlying longevity is the RNA polymerase III (POL III) [175], which is required for the synthesis of tRNAs needed for translation.
However, it seems the situation is more complex in mammals. Inhibition of mTOR was suggested to reduce S6K1-dependent transcription and general mRNA translation, resulting in a lower level of potential proteotoxic and oxidative stress on cellular level [169]. Moreover, downregulation of mTOR could be beneficial against aging by lifting the mTOR-dependent block of autophagy. This would allow a better clearance of protein aggregates or damaged organelles, which have been implicated in age-related processes [176,177]. Finally, it is assumed that the attenuation of adult stem cells plays a crucial role in aging, because the inhibition of mTOR pathways was shown to enhance the self-renewal capacity of both intestinal and hematopoietic stem cells in M. musculus [178,179], as well as germline stem cells in D. melanogaster [180].
The described observations have led to speculations that mTOR inhibition might extend lifespan and delay age-associated diseases also in humans. However, prolonged treatment of humans with Rapamycin leads to side effects such as immunosuppression and glucose intolerance. While the potential anti-aging effects are related to TORC1, the negative metabolic side effects are mainly due to the indirect inhibition of TORC2 after long time treatment. However, alternative dosing regiments of rapamycin, as well as the invention alternative drugs against TORC1 are under development [181].
7. mTOR and Age-Related Diseases
Promising results were obtained with mTOR inhibitors in the context of certain age-related diseases. Several therapeutic concepts for the treatment of neurodegenerative diseases are based on the upregulation of autophagy via the inhibition of TORC1 in order to induce the removal of harmful protein aggregates [182,183]. Pharmacological inhibition of TORC1 via Rapamycin or the chemically-synthesized analogue Temsirolimus (CCI-779) were demonstrated to upregulate autophagy in model cells for neurodegeneration [182]. A corresponding decrease in cytotoxicity was detected in mouse, zebrafish, and Drosophila studies [184]. Publications about neurodegenerative diseases like Alzheimer`s disease (AD) suggest a promising treatment via the inhibition of TORC1 by rapamycin or rapamycin-analogues like Temsirolimus, resulting in a stimulated autophagy [185,186,187].
For the treatment of Parkinson`s disease (PD), several natural compounds, like curcumin derived from the curry spice turmeric, were shown to downregulate mTOR signaling. As a consequence, the elevated activity of autophagy cleared α-synuclein in animal and human cell models [188]. Curcumin is supposed to activate the protein phosphatase 2 and a calyculin A-sensitive phosphatase, which target and inhibit AKT, mTOR, and certain downstream factors like 4E-BP1 [188,189,190].
Inhibitors of mTOR are also used for the treatment of cardiovascular diseases. The functional role of mTOR in the cardiovascular system is context dependent. The mTOR complexes have been described as essential regulators of cardiovascular embryonic development and are also required for the postnatal preservation of cardiac structure and its adaptation to stress. This includes the cardiac adaptation to mechanical stress, which limits cardiomyocyte death and contributes to the development of compensatory hypertrophy. However, TORC1 activity in the heart during chronic stress has also been shown to have multiple maladaptive effects, which results in the pathological hypertrophy [191]. The treatment of cardiac hypertrophy can be supported by mTOR inhibition. Rapamycin was shown to reduce cardiac hypertrophy and improve cardiac function in mice [192,193]. Moreover, inhibition of mTOR signaling via AKT during eccentric hypertrophy was blocked by additional use of AKT inhibitors [194].
Another cardiovascular topic linked to mTOR function is atherosclerosis. In order to reduce the risk of atherosclerosis, inhibition of mTOR induces autophagy and depletes plaque macrophages. However, because the roles of mTOR in lipogenesis and insulin signaling are also blocked, common side effects of their use are dyslipidemia and insulin resistance, which are both risk factors for atherosclerosis. In order to minimize these effects, which would lead to an increase of low-density lipoprotein cholesterol levels, additional use of cholesterol lowering drugs is a recommended strategy [195,196,197].
8. Pharmacological Use of Different mTOR Inhibitor Families
After the discovery of Rapamycin, this macrolide compound was used as an antifungal drug against infections with Aspergillus fumigatus, Candida albicans and Cryptococcus neoformans [198]. When the important functional role of mTOR became evident during the basic research work with rapamycin, the combination of rapamycin with cyclosporine A was established as an important immunosuppressant against transplant rejection because of the inhibition of T-cell proliferation [199]. Moreover, based on its cytostatic activity, rapamycin could be used as an anti-cancer agent. More recently, rapamycin has also shown to contribute to the prevention of coronary artery restenosis [200] as well as to the treatment of neurodegenerative diseases [201]. New inhibitors of mTOR are being designed.
The so called first generation of mTOR inhibitors (Table 2) comprises the natural compound rapamycin (generic name: Sirolimus) and its engineered derivates, the so called rapalogs [202]. They have in common that they also bind to FKBP12, but they are supposed to have context-dependent and more favorable pharmacokinetic profile when compared to rapamycin.
Temsirolimus (Torisel) is the prodrug of rapamycin and is often used against renal cell carcinoma [149]. Everolimus is a rapalog that is used in transplantation medicine under the names Zortress or Certican, as well as in oncology for general tumor under the names Afinitor or Biocon.
The second generation of inhibitors targets both TORC1 as well as TORC2 by competing with ATP at the catalytic site of the mTOR kinase, which is present in both complexes [202,203]. Similar to rapalogs, they can decrease protein translation and attenuate cell proliferation in several cancer cell lines [204,205]. Along with the directly kinase-dependent functions of mTOR, the second generation inhibitors also block the feedback activation of the PI3K and AKT signaling pathways. Therefore, in addition to the optimized inhibition of TORC1 in rapamycin-resistant cell lines, these inhibitors are thought to block TORC2 as well as interfere with the interplay with the PI3K and AKT [206,207]. Another approach is to target mTOR associated proteins, like the inhibition of RHEB by the small molecule NR1, which inhibits TORC1-dependent phosphorylation of S6K1 [208].
The third generation of mTOR inhibitors is supposed to be used in cells that have developed a resistance against both first- and second generation inhibitors [209]. Theses inhibitors are bivalent molecules that exploit the juxtaposition of the corresponding two drug-binding pockets. RapaLink-1 consists of a rapamycin-FRB compound linked to the mTOR kinase inhibitor TORKi [210,211]. Therefore, exploitation of both the kinase domain as well as FRB domain of mTOR should potentially inhibit mTOR-related dysfunctions in the context of tumor growth [210,212]. Moreover, the methodological approach to design novel bivalent inhibitors could be applied to resistances in other disease-relevant signaling pathways.
9. Conclusions
The PIKK-type kinase mTOR plays a central role as coordinator of cellular metabolism by integrating distinct extracellular stimuli and intracellular signals for the initiation of a concerted and adjusted response. Because of its crucial role in normal physiology, the dysregulation of mTOR signaling is often associated with certain diseases as well as the molecular process of aging. For example, its function in glucose and lipid metabolism links it to the occurrence of obesity and diabetes, while its function in promoting cell proliferation and inhibiting autophagy often associates it with tumor formation. Therefore, several key factor in the downregulation of mTOR signaling, like the TSC complex, have been described as tumor suppressors. A better understanding of the different TORC1 and TORC2 signaling pathways will be of importance for the further development of drugs that modulate mTOR functions. This could involve two basic strategies. The first concerns the identification and characterization of further cross-talk between different mTOR-dependent pathways and their effectors. Moreover, it will be beneficial to be able to discriminate different pathway-selective domains in mTOR itself or in individual complex components that could be targeted selectively by then pathway-specific drugs. With this information as a prerequisite, the second approach based on clinically-oriented research will pursue the search for the synergistic combination of distinct drugs that might modulate mTOR signaling by acting both on mTOR itself, as well as on individual TORC1 or TORC2 effector proteins in addition. Moreover, it has to be taken into account that the drug-dependent modulation of mTOR activity has to differ between acute and chronic disorders. Therefore, the identification of candidate inhibitors with novel mechanisms of action as well as the definition of prognostic and predictive biomarkers associated with different mTOR activity levels will enable the chance on a new generation of effective and personalized disease treatment in the context of a “bench-to-bedside” approach.
Funding
This work was supported by the DFG-funded FOR1905 for HWP and the Konrad-Adenauer-Stiftung scholarship for CMS.
Conflicts of Interest
The authors declare no conflict of interest, financial or otherwise.
References
- Dann, S.G.; Thomas, G. The amino acid sensitive TOR pathway from yeast to mammals. FEBS Lett. 2006, 580, 2821–2829. [Google Scholar] [CrossRef] [Green Version]
- Imseng, S.; Aylett, C.H.; Maier, T. Architecture and activation of phosphatidylinositol 3-kinase related kinases. Curr. Opin. Struct. Biol. 2018, 49, 177–189. [Google Scholar] [CrossRef] [PubMed]
- Heitman, J.; Movva, N.R.; Hall, M.N. Targets for cell cycle arrest by the immunosuppressant rapamycin in yeast. Science 1991, 253, 905–909. [Google Scholar] [CrossRef] [PubMed]
- Sehgal, S.N.; Baker, H.; Vézina, C. Rapamycin (AY-22,989), a new antifungal antibiotic. II. Fermentation, isolation and characterization. J. Antibiot. (Tokyo) 1975, 28, 727–732. [Google Scholar] [CrossRef]
- Seto, B. Rapamycin and mTOR: A serendipitous discovery and implications for breast cancer. Clin. Transl. Med. 2012, 15, 29. [Google Scholar] [CrossRef] [PubMed]
- Dechant, R.; Peter, M. Nutrient signals driving cell growth. Curr. Opin. Cell Biol. 2008, 20, 678–687. [Google Scholar] [CrossRef] [PubMed]
- Wu, D.; Yu, D.; Wang, X.; Yu, B. F-actin rearrangement is regulated by mTORC2/Akt/Girdin in mouse fertilized eggs. Cell Prolif. 2016, 49, 740–750. [Google Scholar] [CrossRef] [Green Version]
- Dennis, P.B.; Thomas, G. Quick guide: Target of rapamycin. Curr. Biol. 2002, 12, R269. [Google Scholar] [CrossRef]
- McMahon, L.P.; Choi, K.M.; Lin, T.A.; Abraham, R.T.; Lawrence, J.C.J. The rapamycin-binding domain governs substrate selectivity by the mammalian target of rapamycin. Mol. Cell. Biol. 2002, 22, 7428–7438. [Google Scholar] [CrossRef] [PubMed]
- Gaubitz, C.; Oliveira, T.M.; Prouteau, M.; Leitner, A.; Karuppasamy, M.; Konstantinidou, G.; Rispal, D.; Eltschinger, S.; Robinson, G.C.; Thore, S.; et al. Molecular basis of the rapamycin insensitivity of target of rapamycin complex 2. Mol. Cell 2015, 58, 977–988. [Google Scholar] [CrossRef]
- Chen, X.; Liu, M.; Tian, Y.; Li, J.; Qi, Y.; Zhao, D.; Wu, Z.; Huang, M.; Wong, C.C.L.; Wang, H.W.; et al. Cryo-EM structure of human mTOR complex 2. Cell Res. 2018, 28, 518–528. [Google Scholar] [CrossRef] [PubMed]
- Stuttfeld, E.; Aylett, C.H.; Imseng, S.; Boehringer, D.; Scaiola, A.; Sauer, E.; Hall, M.N.; Maier, T.; Ban, N. Architecture of the human mTORC2 core complex. Elife 2018, 7, e33101. [Google Scholar] [CrossRef] [PubMed]
- Lamming, D.W.; Ye, L.; Katajisto, P.; Goncalves, M.D.; Saitoh, M.; Stevens, D.M.; Davis, J.G.; Salmon, A.B.; Richardson, A.; Ahima, R.S.; et al. Rapamycin-induced insulin resistance is mediated by mTORC2 loss and uncoupled from longevity. Science 2012, 335, 1638–1643. [Google Scholar] [CrossRef] [PubMed]
- Sarbassov, D.D.; Ali, S.M.; Sengupta, S.; Sheen, J.H.; Hsu, P.P.; Bagley, A.F.; Markhard, A.L.; Sabatini, D.M. Prolonged rapamycin treatment inhibits mTORC2 assembly and Akt/PKB. Mol. Cell 2006, 22, 159–168. [Google Scholar] [CrossRef] [PubMed]
- Hara, K.; Maruki, Y.; Long, X.; Yoshino, K.; Oshiro, N.; Hidayat, S.; Tokunaga, C.; Avruch, J.; Yonezawa, K. Raptor, a binding partner of target of rapamycin (TOR), mediates TOR action. Cell 2002, 110, 177–189. [Google Scholar] [CrossRef]
- Kim, D.H.; Sarbassov, D.D.; Ali, S.M.; King, J.E.; Latek, R.R.; Erdjument-Bromage, H.; Tempst, P.; Sabatini, D.M. mTOR interacts with raptor to form a nutrient-sensitive complex that signals to the cell growth machinery. Cell 2002, 110, 163–175. [Google Scholar] [CrossRef]
- Kim, D.H.; Sarbassov, D.D.; Ali, S.M.; Latek, R.R.; Guntur, K.V.; Erdjument-Bromage, H.; Tempst, P.; Sabatini, D.M. GbetaL, a positive regulator of the rapamycin-sensitive pathway required for the nutrient-sensitive interaction between raptor and mTOR. Mol. Cell 2003, 11, 895–904. [Google Scholar] [CrossRef]
- Nojima, H.; Tokunaga, C.; Eguchi, S.; Oshiro, N.; Hidayat, S.; Yoshino, K.; Hara, K.; Tanaka, N.; Avruch, J.; Yonezawa, K. The mammalian target of rapamycin (mTOR) partner, raptor, binds the mTOR substrates p70 S6 kinase and 4E-BP1 through their TOR signaling (TOS) motif. J. Biol. Chem. 2003, 278, 15461–15464. [Google Scholar] [CrossRef]
- Schalm, S.S.; Fingar, D.C.; Sabatini, D.M.; Blenis, J. TOS motif-mediated raptor binding regulates 4E-BP1 multisite phosphorylation and function. Curr. Biol. 2003, 13, 797–806. [Google Scholar] [CrossRef]
- Peterson, T.R.; Laplante, M.; Thoreen, C.C.; Sancak, Y.; Kang, S.A.; Kuehl, W.M.; Gray, N.S.; Sabatini, D.M. DEPTOR is an mTOR inhibitor frequently overexpressed in multiple myeloma cells and required for their survival. Cell 2009, 137, 873–886. [Google Scholar] [CrossRef]
- Sancak, Y.; Thoreen, C.C.; Peterson, T.R.; Lindquist, R.A.; Kang, S.A.; Spooner, E.; Carr, S.A.; Sabatini, D.M. PRAS40 is an insulin-regulated inhibitor of the mTORC1 protein kinase. Mol. Cell 2007, 25, 903–915. [Google Scholar] [CrossRef] [PubMed]
- Vander Haar, E.; Lee, S.I.; Bandhakavi, S.; Griffin, T.J.; Kim, D.H. Insulin signalling to mTOR mediated by the Akt/PKB substrate PRAS40. Nat. Cell Biol. 2007, 9, 316–323. [Google Scholar] [CrossRef] [PubMed]
- Kakumoto, K.; Ikeda, J.; Okada, M.; Morii, E.; Oneyama, C. mLST8 promotes mTOR-mediated tumor progression. PLoS One 2015, 10, e0119015. [Google Scholar] [CrossRef] [PubMed]
- Yang, H.; Rudge, D.G.; Koos, J.D.; Vaidialingam, B.; Yang, H.J.; Pavletich, N.P. mTOR kinase structure, mechanism and regulation. Nature 2013, 497, 217–223. [Google Scholar] [CrossRef] [PubMed]
- Saxton, R.A.; Sabatini, D.M. mTOR signaling in growth, metabolism, and disease. Cell 2017, 169, 361–371. [Google Scholar] [CrossRef]
- Aylett, C.H.; Sauer, E.; Imseng, S.; Boehringer, D.; Hall, M.N.; Ban, N.; Maier, T. Architecture of human mTOR complex 1. Science 2016, 351, 48–52. [Google Scholar] [CrossRef]
- Baretić, D.; Berndt, A.; Ohashi, Y.; Johnson, C.M.; Williams, R.L. Tor forms a dimer through an N-terminal helical solenoid with a complex topology. Nat. Commun. 2016, 7, 11016. [Google Scholar] [CrossRef] [Green Version]
- Yip, C.K.; Murata, K.; Walz, T.; Sabatini, D.M.; Kang, S.A. Structure of the human mTOR complex I and its implications for rapamycin inhibition. Mol. Cell 2010, 38, 768–774. [Google Scholar] [CrossRef]
- Baretić, D.; Williams, R.L. The structural basis for mTOR function. Semin. Cell Dev. Biol. 2014, 36, 91–101. [Google Scholar] [CrossRef]
- Kaizuka, T.; Hara, T.; Oshiro, N.; Kikkawa, U.; Yonezawa, K.; Takehana, K.; Iemura, S.; Natsume, T.; Mizushima, N. Tti1 and Tel2 are critical factors in mammalian target of rapamycin complex assembly. J. Biol. Chem. 2010, 285, 20109–20116. [Google Scholar] [CrossRef]
- Sugimoto, K. Branching the Tel2 pathway for exact fit on phosphatidylinositol 3-kinase-related kinases. Curr. Genet. 2018. [Google Scholar] [CrossRef] [PubMed]
- Laplante, M.; Sabatini, D.M. mTOR signaling in growth control and disease. Cell 2012, 149, 274–293. [Google Scholar] [CrossRef] [PubMed]
- Jacinto, E.; Loewith, R.; Schmidt, A.; Lin, S.; Rüegg, M.A.; Hall, A.; Hall, M.N. Mammalian TOR complex 2 controls the actin cytoskeleton and is rapamycin insensitive. Nat. Cell Biol. 2004, 6, 1122–1128. [Google Scholar] [CrossRef] [PubMed]
- Sarbassov, D.D.; Ali, S.M.; Kim, D.H.; Guertin, D.A.; Latek, R.R.; Erdjument-Bromage, H.; Tempst, P.; Sabatini, D.M. Rictor, a novel binding partner of mTOR, defines a rapamycin-insensitive and raptor-independent pathway that regulates the cytoskeleton. Curr. Biol. 2004, 14, 1296–1302. [Google Scholar] [CrossRef]
- Varusai, T.M.; Nguyen, L.K. Dynamic modelling of the mTOR signalling network reveals complex emergent behaviours conferred by DEPTOR. Sci. Rep. 2018, 8, 643. [Google Scholar] [CrossRef] [PubMed] [Green Version]
- Pearce, L.R.; Huang, X.; Boudeau, J.; Pawłowski, R.; Wullschleger, S.; Deak, M.; Ibrahim, A.F.; Gourlay, R.; Magnuson, M.A.; Alessi, D.R. Identification of Protor as a novel Rictor-binding component of mTOR complex-2. Biochem. J. 2007, 405, 513–522. [Google Scholar] [CrossRef] [PubMed]
- Thedieck, K.; Polak, P.; Kim, M.L.; Molle, K.D.; Cohen, A.; Jenö, P.; Arrieumerlou, C.; Hall, M.N. PRAS40 and PRR5-like protein are new mTOR interactors that regulate apoptosis. PLoS One 2007, 2, e1217. [Google Scholar] [CrossRef] [PubMed]
- Woo, S.Y.; Kim, D.H.; Jun, C.B.; Kim, Y.M.; Haar, E.V.; Lee, S.I.; Hegg, J.W.; Bandhakavi, S.; Griffin, T.J.; Kim, D.H. PRR5, a novel component of mTOR complex 2, regulates platelet-derived growth factor receptor beta expression and signaling. J. Biol. Chem. 2007, 282, 25604–25612. [Google Scholar] [CrossRef] [PubMed]
- Frias, M.A.; Thoreen, C.C.; Jaffe, J.D.; Schroder, W.; Sculley, T.; Carr, S.A.; Sabatini, D.M. mSin1 is necessary for Akt/PKB phosphorylation, and its isoforms define three distinct mTORC2s. Curr. Biol. 2006, 16, 1865–1870. [Google Scholar] [CrossRef] [PubMed]
- Jacinto, E.; Facchinetti, V.; Liu, D.; Soto, N.; Wei, S.; Jung, S.Y.; Huang, Q.; Qin, J.; Su, B. SIN1/MIP1 maintains rictor-mTOR complex integrity and regulates Akt phosphorylation and substrate specificity. Cell 2006, 127, 125–137. [Google Scholar] [CrossRef]
- Yang, Q.; Inoki, K.; Ikenoue, T.; Guan, K.L. Identification of Sin1 as an essential TORC2 component required for complex formation and kinase activity. Genes Dev. 2006, 20, 2820–2832. [Google Scholar] [CrossRef] [PubMed] [Green Version]
- De Virgilio, C.; Loewith, R. The TOR signalling network from yeast to man. Int. J. Biochem. Cell Biol. 2006, 38, 1476–1481. [Google Scholar] [CrossRef] [PubMed] [Green Version]
- González, A.; Hall, M.N. Nutrient sensing and TOR signaling in yeast and mammals. EMBO J. 2017, 36, 397–408. [Google Scholar] [CrossRef] [PubMed]
- Dibble, C.C.; Elis, W.; Menon, S.; Qin, W.; Klekota, J.; Asara, J.M.; Finan, P.M.; Kwiatkowski, D.J.; Murphy, L.O.; Manning, B.D. TBC1D7 is a third subunit of the TSC1-TSC2 complex upstream of mTORC1. Mol. Cell 2012, 47, 535–546. [Google Scholar] [CrossRef]
- Demetriades, C.; Plescher, M.; Teleman, A.A. Lysosomal recruitment of TSC2 is a universal response to cellular stress. Nat. Commun. 2016, 7, 10662. [Google Scholar] [CrossRef] [PubMed] [Green Version]
- Garami, A.; Zwartkruis, F.J.; Nobukuni, T.; Joaquin, M.; Roccio, M.; Stocker, H.; Kozma, S.C.; Hafen, E.; Bos, J.L.; Thomas, G. Insulin activation of Rheb, a mediator of mTOR/S6K/4E-BP signaling, is inhibited by TSC1 and 2. Mol. Cell 2003, 11, 1457–1466. [Google Scholar] [CrossRef]
- Inoki, K.; Li, Y.; Xu, T.; Guan, K.L. Rheb GTPase is a direct target of TSC2 GAP activity and regulates mTOR signaling. Genes Dev. 2003, 17, 1829–1834. [Google Scholar] [CrossRef] [Green Version]
- Long, X.; Lin, Y.; Ortiz-Vega, S.; Yonezawa, K.; Avruch, J. Rheb binds and regulates the mTOR kinase. Curr. Biol. 2005, 15, 702–713. [Google Scholar] [CrossRef]
- Tee, A.R.; Manning, B.D.; Roux, P.P.; Cantley, L.C.; Blenis, J. Tuberous sclerosis complex gene products, Tuberin and Hamartin, control mTOR signaling by acting as a GTPase-activating protein complex toward Rheb. Curr. Biol. 2003, 13, 1259–1268. [Google Scholar] [CrossRef]
- Schöpel, M.; Potheraveedu, V.N.; Al-Harthy, T.; Abdel-Jalil, R.; Heumann, R.; Stoll, R. The small GTPases Ras and Rheb studied by multidimensional NMR spectroscopy: Structure and function. Biol. Chem. 2017, 398, 577–588. [Google Scholar] [CrossRef]
- Inoki, K.; Li, Y.; Zhu, T.; Wu, J.; Guan, K.L. TSC2 is phosphorylated and inhibited by Akt and suppresses mTOR signalling. Nat. Cell Biol. 2002, 4, 648–657. [Google Scholar] [CrossRef]
- Manning, B.D.; Tee, A.R.; Logsdon, M.N.; Blenis, J.; Cantley, L.C. Identification of the tuberous sclerosis complex-2 tumor suppressor gene product tuberin as a target of the phosphoinositide 3-kinase/akt pathway. Mol. Cell 2002, 10, 151–162. [Google Scholar] [CrossRef]
- Menon, S.; Dibble, C.C.; Talbott, G.; Hoxhaj, G.; Valvezan, A.J.; Takahashi, H.; Cantley, L.C.; Manning, B.D. Spatial control of the TSC complex integrates insulin and nutrient regulation of mTORC1 at the lysosome. Cell 2014, 156, 771–785. [Google Scholar] [CrossRef] [PubMed]
- Ma, L.; Chen, Z.; Erdjument-Bromage, H.; Tempst, P.; Pandolfi, P.P. Phosphorylation and functional inactivation of TSC2 by Erk implications for tuberous sclerosis and cancer pathogenesis. Cell 2005, 121, 179–193. [Google Scholar] [CrossRef] [PubMed]
- Roux, P.P.; Ballif, B.A.; Anjum, R.; Gygi, S.P.; Blenis, J. Tumor-promoting phorbol esters and activated Ras inactivate the tuberous sclerosis tumor suppressor complex via p90 ribosomal S6 kinase. Proc. Natl. Acad. Sci. USA 2004, 101, 13489–13494. [Google Scholar] [CrossRef] [PubMed] [Green Version]
- Mihaylova, M.M.; Shaw, R.J. The AMPK signalling pathway coordinates cell growth, autophagy and metabolism. Nat. Cell Biol. 2011, 13, 1016–1023. [Google Scholar] [CrossRef] [PubMed] [Green Version]
- Inoki, K.; Zhu, T.; Guan, K.L. TSC2 mediates cellular energy response to control cell growth and survival. Cell 2003, 115, 577–590. [Google Scholar] [CrossRef]
- Shaw, R.J.; Bardeesy, N.; Manning, B.D.; Lopez, L.; Kosmatka, M.; DePinho, R.A.; Cantley, L.C. The LKB1 tumor suppressor negatively regulates mTOR signaling. Cancer Cell 2004, 6, 91–99. [Google Scholar] [CrossRef] [Green Version]
- Gwinn, D.M.; Shackelford, D.B.; Eganm, D.F.; Mihaylova, M.M.; Mery, A.; Vasquez, D.S.; Turk, B.E.; Shaw, R.J. AMPK phosphorylation of raptor mediates a metabolic checkpoint. Cell 2008, 30, 214–226. [Google Scholar] [CrossRef]
- Schneider, A.; Younis, R.H.; Gutkind, J.S. Hypoxia-induced energy stress inhibits the mTOR pathway by activating an AMPK/REDD1 signaling axis in head and neck squamous cell carcinoma. Neoplasia 2008, 10, 1295–1302. [Google Scholar] [CrossRef]
- Brugarolas, J.; Lei, K.; Hurley, R.L.; Manning, B.D.; Reiling, J.H.; Hafen, E.; Witters, L.A.; Ellisen, L.W.; Kaelin, W.G.J. Regulation of mTOR function in response to hypoxia by REDD1 and the TSC1/TSC2 tumor suppressor complex. Genes Dev. 2004, 18, 2893–2904. [Google Scholar] [CrossRef] [PubMed] [Green Version]
- Feng, Z.; Hu, W.; de Stanchina, E.; Teresky, A.K.; Jin, S.; Lowe, S.; Levine, A.J. The regulation of AMPK beta1, TSC2, and PTEN expression by p53: Stress, cell and tissue specificity, and the role of these gene products in modulating the IGF-1-AKT-mTOR pathways. Cancer Res. 2007, 67, 3043–3053. [Google Scholar] [CrossRef] [PubMed]
- Ratnayake, L.; Adhvaryu, K.K.; Kafes, E.; Motavaze, K.; Lakin-Thomas, P. A component of the TOR (Target of Rapamycin) nutrient-sensing pathway plays a role in circadian rhythmicity in Neurospora crassa. PLoS Genet 2018, 14, e1007457. [Google Scholar] [CrossRef] [PubMed]
- Kim, E.; Goraksha-Hicks, P.; Li, L.; Neufeld, T.P.; Guan, K.L. Regulation of TORC1 by Rag GTPases in nutrient response. Nat. Cell Biol. 2008, 10, 935–945. [Google Scholar] [CrossRef] [PubMed] [Green Version]
- Sancak, Y.; Peterson, T.R.; Shaul, Y.D.; Lindquist, R.A.; Thoreen, C.C.; Bar-Peled, L.; Sabatini, D.M. The Rag GTPases bind raptor and mediate amino acid signaling to mTORC1. Science 2008, 320, 1496–1501. [Google Scholar] [CrossRef] [PubMed]
- Kim, J.; Kim, E. Rag GTPase in amino acid signaling. Amino Acids 2016, 48, 915–928. [Google Scholar] [CrossRef] [PubMed]
- Su, M.Y.; Morris, K.L.; Kim, D.J.; Fu, Y.; Lawrence, R.; Stjepanovic, G.; Zoncu, R.; Hurley, J.H. Hybrid structure of the RagA/C-ragulator mTORC1 activation complex. Mol. Cell 2017, 68, 835–846. [Google Scholar] [CrossRef]
- Bar-Peled, L.; Schweitzer, L.D.; Zoncu, R.; Sabatini, D.M. Ragulator is a GEF for the rag GTPases that signal amino acid levels to mTORC1. Cell 2012, 150, 1196–1208. [Google Scholar] [CrossRef]
- Sancak, Y.; Bar-Peled, L.; Zoncu, R.; Markhard, A.L.; Nada, S.; Sabatini, D.M. Ragulator-Rag complex targets mTORC1 to the lysosomal surface and is necessary for its activation by amino acids. Cell 2010, 141, 290–303. [Google Scholar] [CrossRef]
- Jung, J.; Genau, H.M.; Behrends, C. Amino acid-dependent mTORC1 regulation by the lysosomal membrane protein SLC38A9. Mol. Cell. Biol. 2015, 35, 2479–2494. [Google Scholar] [CrossRef]
- Rebsamen, M.; Pochini, L.; Stasyk, T.; de Araújo, M.E.; Galluccio, M.; Kandasamy, R.K.; Snijder, B.; Fauster, A.; Rudashevskaya, E.L.; Bruckner, M.; et al. SLC38A9 is a component of the lysosomal amino acid sensing machinery that controls mTORC1. Nature 2015, 519, 477–481. [Google Scholar] [CrossRef] [PubMed]
- Wang, S.; Tsun, Z.Y.; Wolfson, R.L.; Shen, K.; Wyant, G.A.; Plovanich, M.E.; Yuan, E.D.; Jones, T.D.; Chantranupong, L.; Comb, W.; et al. Metabolism. lysosomal amino acid transporter SLC38A9 signals arginine sufficiency to mTORC1. Science 2015, 347, 188–194. [Google Scholar] [CrossRef] [PubMed]
- Wyant, G.A.; Abu-Remaileh, M.; Wolfson, R.L.; Chen, W.W.; Freinkman, E.; Danai, L.V.; Vander Heiden, M.G.; Sabatini, D.M. mTORC1 activator SLC38A9 is required to efflux essential amino acids from lysosomes and use protein as a nutrient. Cell 2017, 171, 642–654. [Google Scholar] [CrossRef] [PubMed]
- Zoncu, R.; Bar-Peled, L.; Efeyan, A.; Wang, S.; Sancak, Y.; Sabatini, D.M. mTORC1 senses lysosomal amino acids through an inside-out mechanism that requires the vacuolar H(+)-ATPase. Science 2011, 334, 678–683. [Google Scholar] [CrossRef]
- Bar-Peled, L.; Chantranupong, L.; Cherniack, A.D.; Chen, W.W.; Ottina, K.A.; Grabiner, B.C.; Spear, E.D.; Carter, S.L.; Meyerson, M.; Sabatini, D.M. A Tumor suppressor complex with GAP activity for the Rag GTPases that signal amino acid sufficiency to mTORC1. Science 2013, 340, 1100–1106. [Google Scholar] [CrossRef]
- Peng, M.; Yin, N.; Li, M.O. SZT2 dictates GATOR control of mTORC1 signalling. Nature 2017, 543, 433–437. [Google Scholar] [CrossRef]
- Wolfson, R.L.; Chantranupong, L.; Wyant, G.A.; Gu, X.; Orozco, J.M.; Shen, K.; Condon, K.J.; Petri, S.; Kedir, J.; Scaria, S.M.; et al. KICSTOR recruits GATOR1 to the lysosome and is necessary for nutrients to regulate mTORC1. Nature 2017, 543, 438–442. [Google Scholar] [CrossRef] [Green Version]
- Chantranupong, L.; Wolfson, R.L.; Orozco, J.M.; Saxton, R.A.; Scaria, S.M.; Bar-Peled, L.; Spooner, E.; Isasa, M.; Gygi, S.P.; Sabatini, D.M. The Sestrins interact with GATOR2 to negatively regulate the amino-acid-sensing pathway upstream of mTORC1. Cell Rep. 2014, 9, 1–8. [Google Scholar] [CrossRef]
- Parmigiani, A.; Nourbakhsh, A.; Ding, B.; Wang, W.; Kim, Y.C.; Akopiants, K.; Guan, K.L.; Karin, M.; Budanov, A.V. Sestrins inhibit mTORC1 kinase activation through the GATOR complex. Cell Rep. 2014, 9, 1281–1291. [Google Scholar] [CrossRef]
- Chantranupong, L.; Scaria, S.M.; Saxton, R.A.; Gygi, M.P.; Shen, K.; Wyant, G.A.; Wang, T.; Harper, J.W.; Gygi, S.P.; Sabatini, D.M. The CASTOR proteins are arginine sensors for the mTORC1 pathway. Cell 2016, 165, 153–164. [Google Scholar] [CrossRef]
- Saxton, R.A.; Chantranupong, L.; Knockenhauer, K.E.; Schwartz, T.U.; Sabatini, D.M. Mechanism of arginine sensing by CASTOR1 upstream of mTORC1. Nature 2016, 536, 229–233. [Google Scholar] [CrossRef] [PubMed]
- Saxton, R.A.; Knockenhauer, K.E.; Wolfson, R.L.; Chantranupong, L.; Pacold, M.E.; Wang, T.; Schwartz, T.U.; Sabatini, D.M. Structural basis for leucine sensing by the Sestrin2-mTORC1 pathway. Science 2016, 351, 53–58. [Google Scholar] [CrossRef] [PubMed]
- Wolfson, R.L.; Chantranupong, L.; Saxton, R.A.; Shen, K.; Scaria, S.M.; Cantor, J.R.; Sabatini, D.M. Sestrin2 is a leucine sensor for the mTORC1 pathway. Science 2016, 351, 43–48. [Google Scholar] [CrossRef] [PubMed]
- Ye, J.; Palm, W.; Peng, M.; King, B.; Lindsten, T.; Li, M.O.; Koumenis, C.; Thompson, C.B. GCN2 sustains mTORC1 suppression upon amino acid deprivation by inducing Sestrin2. Genes Dev. 2015, 29, 2331–2336. [Google Scholar] [CrossRef] [PubMed] [Green Version]
- Jewell, J.L.; Kim, Y.C.; Russell, R.C.; Yu, F.X.; Park, H.W.; Plouffe, S.W.; Tagliabracci, V.S.; Guan, K.L. Metabolism. Differential regulation of mTORC1 by leucine and glutamine. Science 2015, 347, 194–198. [Google Scholar] [CrossRef] [PubMed]
- Tsun, Z.Y.; Bar-Peled, L.; Chantranupong, L.; Zoncu, R.; Wang, T.; Kim, C.; Spooner, E.; Sabatini, D.M. The folliculin tumor suppressor is a GAP for the RagC/D GTPases that signal amino acid levels to mTORC1. Mol. Cell 2013, 52, 495–505. [Google Scholar] [CrossRef] [PubMed]
- Petit, C.S.; Roczniak-Ferguson, A.; Ferguson, S.M. Recruitment of folliculin to lysosomes supports the amino acid-dependent activation of Rag GTPases. J. Cell Biol. 2013, 202, 1107–1122. [Google Scholar] [CrossRef] [Green Version]
- Schmidt, L.S.; Linehan, W.M. FLCN: The causative gene for Birt-Hogg-Dubé syndrome. Gene 2018, 640, 28–42. [Google Scholar] [CrossRef]
- Liu, P.; Gan, W.; Chin, Y.R.; Ogura, K.; Guo, J.; Zhang, J.; Wang, B.; Blenis, J.; Cantley, L.C.; Toker, A.; et al. PtdIns(3,4,5)P3-dependent activation of the mTORC2 kinase complex. Cancer Discov. 2015, 5, 1194–1209. [Google Scholar] [CrossRef]
- Yang, G.; Murashige, D.S.; Humphrey, S.J.; James, D.E. A positive feedback loop between Akt and mTORC2 via SIN1 phosphorylation. Cell Rep. 2015, 12, 937–943. [Google Scholar] [CrossRef]
- Hsu, P.P.; Kang, S.A.; Rameseder, J.; Zhang, Y.; Ottina, K.A.; Lim, D.; Peterson, T.R.; Choi, Y.; Gray, N.S.; Yaffe, M.B.; et al. The mTOR-regulated phosphoproteome reveals a mechanism of mTORC1-mediated inhibition of growth factor signaling. Science 2011, 332, 1317–1322. [Google Scholar] [CrossRef] [PubMed]
- Yu, Y.; Yoon, S.O.; Poulogiannis, G.; Yang, Q.; Ma, X.M.; Villén, J.; Kubica, N.; Hoffman, G.R.; Cantley, L.C.; Gygi, S.P.; et al. Phosphoproteomic analysis identifies Grb10 as an mTORC1 substrate that negatively regulates insulin signaling. Science 2011, 332, 1322–1326. [Google Scholar] [CrossRef] [PubMed]
- Yoon, M.S. The role of mammalian target of rapamycin (mTOR) in insulin signaling. Nutrients 2017, 9, E1176. [Google Scholar] [CrossRef] [PubMed]
- Razquin Navas, P.; Thedieck, K. Differential control of ageing and lifespan by isoforms and splice variants across the mTOR network. Essays Biochem. 2017, 61, 349–368. [Google Scholar] [CrossRef] [PubMed]
- Holz, M.K.; Ballif, B.A.; Gygi, S.P.; Blenis, J. mTOR and S6K1 mediate assembly of the translation preinitiation complex through dynamic protein interchange and ordered phosphorylation events. Cell 2005, 123, 569–580. [Google Scholar] [CrossRef] [PubMed]
- Dorrello, N.V.; Peschiaroli, A.; Guardavaccaro, D.; Colburn, N.H.; Sherman, N.E.; Pagano, M. S6K1- and betaTRCP-mediated degradation of PDCD4 promotes protein translation and cell growth. Science 2006, 314, 467–471. [Google Scholar] [CrossRef] [PubMed]
- Brunn, G.J.; Hudson, C.C.; Sekulić, A.; Williams, J.M.; Hosoi, H.; Houghton, P.J.; Lawrence, J.C.J.; Abraham, R.T.J. Phosphorylation of the translational repressor PHAS-I by the mammalian target of rapamycin. Science 1997, 277, 99–101. [Google Scholar] [CrossRef] [PubMed]
- Gingras, A.C.; Gygi, S.P.; Raught, B.; Polakiewicz, R.D.; Abraham, R.T.; Hoekstra, M.F.; Aebersold, R.; Sonenberg, N. Regulation of 4E-BP1 phosphorylation: A novel two-step mechanism. Genes Dev. 1999, 13, 1422–1437. [Google Scholar] [CrossRef]
- Hsieh, A.C.; Liu, Y.; Edlind, M.P.; Ingolia, N.T.; Janes, M.R.; Sher, A.; Shi, E.Y.; Stumpf, C.R.; Christensen, C.; Bonham, M.J.; et al. The translational landscape of mTOR signalling steers cancer initiation and metastasis. Nature 2012, 485, 55–61. [Google Scholar] [CrossRef]
- Thoreen, C.C.; Chantranupong, L.; Keys, H.R.; Wang, T.; Gray, N.S.; Sabatini, D.M. A unifying model for mTORC1-mediated regulation of mRNA translation. Nature 2012, 485, 109–113. [Google Scholar] [CrossRef] [Green Version]
- Porstmann, T.; Santos, C.R.; Griffiths, B.; Cully, M.; Wu, M.; Leevers, S.; Griffiths, J.R.; Chung, Y.L.; Schulze, A. SREBP activity is regulated by mTORC1 and contributes to Akt-dependent cell growth. Cell Metab. 2008, 8, 224–236. [Google Scholar] [CrossRef] [PubMed]
- Düvel, K.; Yecies, J.L.; Menon, S.; Raman, P.; Lipovsky, A.I.; Souza, A.L.; Triantafellow, E.; Ma, Q.; Gorski, R.; Cleaver, S.; et al. Activation of a metabolic gene regulatory network downstream of mTOR complex 1. Mol. Cell 2010, 39, 171–183. [Google Scholar] [CrossRef] [PubMed]
- Peterson, T.R.; Sengupta, S.S.; Harris, T.E.; Carmack, A.E.; Kang, S.A.; Balderas, E.; Guertin, D.A.; Madden, K.L.; Carpenter, A.E.; Finck, B.N.; et al. mTOR complex 1 regulates lipin 1 localization to control the SREBP pathway. Cell 2011, 146, 408–420. [Google Scholar] [CrossRef] [PubMed]
- Lippman, S.I.; Broach, J.R. Protein kinase A and TORC1 activate genes for ribosomal biogenesis by inactivating repressors encoded by Dot6 and its homolog Tod6. Proc. Natl. Acad. Sci. USA 2009, 106, 19928–19933. [Google Scholar] [CrossRef] [PubMed] [Green Version]
- Kos-Braun, I.C.; Jung, I.; Koš, M. Tor1 and CK2 kinases control a switch between alternative ribosome biogenesis pathways in a growth-dependent manner. PLoS Biol. 2017, 15, e2000245. [Google Scholar] [CrossRef] [PubMed]
- Ben-Sahra, I.; Hoxhaj, G.; Ricoult, S.J.H.; Asara, J.M.; Manning, B.D. mTORC1 induces purine synthesis through control of the mitochondrial tetrahydrofolate cycle. Science 2016, 351, 728–733. [Google Scholar] [CrossRef] [PubMed] [Green Version]
- Ben-Sahra, I.; Howell, J.J.; Asara, J.M.; Manning, B.D. Stimulation of de novo pyrimidine synthesis by growth signaling through mTOR and S6K1. Science 2013, 339, 1323–1328. [Google Scholar] [CrossRef] [PubMed]
- Robitaille, A.M.; Christen, S.; Shimobayashi, M.; Cornu, M.; Fava, L.L.; Moes, S.; Prescianotto-Baschong, C.; Sauer, U.; Jenoe, P.; Hall, M.N. Quantitative phosphoproteomics reveal mTORC1 activates de novo pyrimidine synthesis. Science 2013, 339, 1320–1323. [Google Scholar] [CrossRef] [PubMed]
- Tsouko, E.; Khan, A.S.; White, M.A.; Han, J.J.; Shi, Y.; Merchant, F.A.; Sharpe, M.A.; Xin, L.; Frigo, D.E. Regulation of the pentose phosphate pathway by an androgen receptor-mTOR-mediated mechanism and its role in prostate cancer cell growth. Oncogenesis 2014, 26, e103. [Google Scholar] [CrossRef] [PubMed]
- Boutouja, F.; Brinkmeier, R.; Mastalski, T.; El Magraoui, F.; Platta, H.W. Regulation of the tumor-suppressor BECLIN 1 by distinct ubiquitination cascades. Int. J. Mol. Sci. 2017, 18, e2541. [Google Scholar] [CrossRef] [PubMed]
- Kim, J.; Kundu, M.; Viollet, B.; Guan, K.L. AMPK and mTOR regulate autophagy through direct phosphorylation of Ulk1. Nat. Cell Biol. 2011, 13, 132–141. [Google Scholar] [CrossRef] [PubMed] [Green Version]
- Alers, S.; Wesselborg, S.; Stork, B. ATG13: Just a companion, or an executor of the autophagic program? Autophagy 2014, 10, 944–956. [Google Scholar] [CrossRef] [PubMed]
- Martina, J.A.; Chen, Y.; Gucek, M.; Puertollano, R. MTORC1 functions as a transcriptional regulator of autophagy by preventing nuclear transport of TFEB. Autophagy 2012, 8, 903–914. [Google Scholar] [CrossRef] [PubMed] [Green Version]
- Roczniak-Ferguson, A.; Petit, C.S.; Froehlich, F.; Qian, S.; Ky, J.; Angarola, B.; Walther, T.C.; Ferguson, S.M. The transcription factor TFEB links mTORC1 signaling to transcriptional control of lysosome homeostasis. Sci. Signal. 2012, 5, ra42. [Google Scholar] [CrossRef]
- Settembre, C.; Zoncu, R.; Medina, D.L.; Vetrini, F.; Erdin, S.; Erdin, S.; Huynh, T.; Ferron, M.; Karsenty, G.; Vellard, M.C.; et al. A lysosome-to-nucleus signalling mechanism senses and regulates the lysosome via mTOR and TFEB. EMBO J. 2012, 31, 1095–1108. [Google Scholar] [CrossRef] [PubMed] [Green Version]
- Rousseau, A.; Bertolotti, A. An evolutionarily conserved pathway controls proteasome homeostasis. Nature 2016, 536, 184–189. [Google Scholar] [CrossRef] [Green Version]
- Zhao, J.; Zhai, B.; Gygi, S.P.; Goldberg, A.L. mTOR inhibition activates overall protein degradation by the ubiquitin proteasome system as well as by autophagy. Proc. Natl. Acad. Sci. USA 2015, 112, 15790–15797. [Google Scholar] [CrossRef]
- Zhang, Y.; Manning, B.D. Zhang & Manning reply. Nature 2016, 529, E2–E3. [Google Scholar] [Green Version]
- Zhang, Y.; Nicholatos, J.; Dreier, J.R.; Ricoult, S.J.; Widenmaier, S.B.; Hotamisligil, G.S.; Kwiatkowski, D.J.; Manning, B.D. Coordinated regulation of protein synthesis and degradation by mTORC1. Nature 2014, 513, 440–443. [Google Scholar] [CrossRef] [Green Version]
- Zhao, J.; Garcia, G.A.; Goldberg, A.L. Control of proteasomal proteolysis by mTOR. Nature 2016, 529, E1–E2. [Google Scholar] [CrossRef] [Green Version]
- Gan, X.; Wang, J.; Wang, C.; Sommer, E.; Kozasa, T.; Srinivasula, S.; Alessi, D.; Offermanns, S.; Simon, M.I.; Wu, D. PRR5L degradation promotes mTORC2-mediated PKC-δ phosphorylation and cell migration downstream of Gα12. Nat. Cell Biol. 2012, 14, 686–696. [Google Scholar] [CrossRef] [PubMed] [Green Version]
- Li, X.; Gao, T. mTORC2 phosphorylates protein kinase Cζ to regulate its stability and activity. EMBO Rep. 2014, 15, 191–198. [Google Scholar] [CrossRef] [PubMed]
- Thomanetz, V.; Angliker, N.; Cloëtta, D.; Lustenberger, R.M.; Schweighauser, M.; Oliveri, F.; Suzuki, N.; Rüegg, M.A. Ablation of the mTORC2 component rictor in brain or Purkinje cells affects size and neuron morphology. J. Cell Biol. 2013, 201, 293–308. [Google Scholar] [CrossRef] [PubMed] [Green Version]
- Masri, J.; Bernath, A.; Martin, J.; Jo, O.D.; Vartanian, R.; Funk, A.; Gera, J. mTORC2 activity is elevated in gliomas and promotes growth and cell motility via overexpression of rictor. Cancer Res. 2007, 67, 11712–11720. [Google Scholar] [CrossRef] [PubMed]
- García-Martínez, J.M.; Alessi, D.R. mTOR complex 2 (mTORC2) controls hydrophobic motif phosphorylation and activation of serum- and glucocorticoid-induced protein kinase 1 (SGK1). Biochem. J. 2008, 416, 375–385. [Google Scholar] [CrossRef]
- Lyo, D.; Xu, L.; Foster, D.A. Phospholipase D stabilizes HDM2 through an mTORC2/SGK1 pathway. Biochem. Biophys. Res. Commun. 2010, 396, 562–565. [Google Scholar] [CrossRef] [Green Version]
- Sarbassov, D.D.; Guertin, D.A.; Ali, S.M.; Sabatini, D.M. Phosphorylation and regulation of Akt/PKB by the rictor-mTOR complex. Science 2005, 307, 1098–1101. [Google Scholar] [CrossRef]
- Guertin, D.A.; Stevens, D.M.; Thoreen, C.C.; Burds, A.A.; Kalaany, N.Y.; Moffat, J.; Brown, M.; Fitzgerald, K.J.; Sabatini, D.M. Ablation in mice of the mTORC components raptor, rictor, or mLST8 reveals that mTORC2 is required for signaling to Akt-FOXO and PKCalpha, but not S6K1. Dev. Cell 2006, 11, 859–871. [Google Scholar] [CrossRef]
- Kwiatkowski, D.J. Tuberous sclerosis: From tubers to mTOR. Ann. Hum. Genet. 2003, 67, 87–96. [Google Scholar] [CrossRef]
- Roberts, P.S.; Ramesh, V.; Dabora, S.; Kwiatkowski, D.J. A 34 bp deletion within TSC2 is a rare polymorphism, not a pathogenic mutation. Ann. Hum. Genet. 2003, 67, 495–503. [Google Scholar] [CrossRef]
- Li, C.; Lee, P.S.; Sun, Y.; Gu, X.; Zhang, E.; Guo, Y.; Wu, C.L.; Auricchio, N.; Priolo, C.; Li, J.; et al. Estradiol and mTORC2 cooperate to enhance prostaglandin biosynthesis and tumorigenesis in TSC2-deficient LAM cells. J. Exp. Med. 2014, 211, 15–28. [Google Scholar] [CrossRef] [PubMed] [Green Version]
- Feng, Z.; Zhang, H.; Levine, A.J.; Jin, S. The coordinate regulation of the p53 and mTOR pathways in cells. Proc. Natl. Acad. Sci. USA 2005, 102, 8204–8209. [Google Scholar] [CrossRef] [PubMed] [Green Version]
- Sato, M.; Dehvari, N.; Oberg, A.I.; Dallner, O.S.; Sandström, A.L.; Olsen, J.M.; Csikasz, R.I.; Summers, R.J.; Hutchinson, D.S.; Bengtsson, T. Improving type 2 diabetes through a distinct adrenergic signaling pathway involving mTORC2 that mediates glucose uptake in skeletal muscle. Diabetes 2014, 63, 4115–4129. [Google Scholar] [CrossRef] [PubMed]
- Vogelstein, B.; Lane, D.; Levine, A.J. Surfing the p53 network. Nature 2000, 408, 307–310. [Google Scholar] [CrossRef] [PubMed]
- Sun, Q.; Chen, X.; Ma, J.; Peng, H.; Wang, F.; Zha, X.; Wang, Y.; Jing, Y.; Yang, H.; Chen, R.; et al. Mammalian target of rapamycin up-regulation of pyruvate kinase isoenzyme type M2 is critical for aerobic glycolysis and tumor growth. Proc. Natl. Acad. Sci. USA 2011, 108, 4129–4134. [Google Scholar] [CrossRef] [Green Version]
- Warburg, O. On the origin of cancer cells. Science 1956, 123, 309–314. [Google Scholar] [CrossRef]
- Burns, J.S.; Manda, G. Metabolic pathways of the warburg effect in health and disease: Perspectives of choice, chain or chance. Int. J. Mol. Sci. 2017, 18, E2755. [Google Scholar] [CrossRef]
- Liu, G.; Bi, Y.; Shen, B.; Yang, H.; Zhang, Y.; Wang, X.; Liu, H.; Lu, Y.; Liao, J.; Chen, X.; et al. SIRT1 limits the function and fate of myeloid-derived suppressor cells in tumors by orchestrating HIF-1α-dependent glycolysis. Cancer Res. 2014, 74, 727–737. [Google Scholar] [CrossRef]
- Semenza, G.L. HIF-1 mediates metabolic responses to intratumoral hypoxia and oncogenic mutations. J. Clin. Invest. 2013, 123, 3664–3671. [Google Scholar] [CrossRef] [Green Version]
- Mathupala, S.P.; Ko, Y.H.; Pedersen, P.L. Hexokinase II: cancer’s double-edged sword acting as both facilitator and gatekeeper of malignancy when bound to mitochondria. Oncogenesis 2006, 25, 4777–4786. [Google Scholar] [CrossRef]
- Roberts, D.J.; Miyamoto, S. Hexokinase II integrates energy metabolism and cellular protection: Akting on mitochondria and TORCing to autophagy. Cell Death Differ. 2015, 22, 248–257. [Google Scholar] [CrossRef] [PubMed]
- Shintani, T.; Klionsky, D.J. Autophagy in health and disease: A double-edged sword. Science 2004, 306, 990–995. [Google Scholar] [CrossRef] [PubMed]
- Thorburn, A. Autophagy and its effects: Making sense of double-edged swords. PLoS Biol. 2014, 12, e1001967. [Google Scholar] [CrossRef]
- Nazio, F.; Strappazzon, F.; Antonioli, M.; Bielli, P.; Cianfanelli, V.; Bordi, M.; Gretzmeier, C.; Dengjel, J.; Piacentini, M.; Fimia, G.M.; et al. mTOR inhibits autophagy by controlling ULK1 ubiquitylation, self-association and function through AMBRA1 and TRAF6. Nat. Cell Biol. 2013, 15, 406–416. [Google Scholar] [CrossRef] [PubMed]
- Abrahamsen, H.; Stenmark, H.; Platta, H.W. Ubiquitination and phosphorylation of Beclin 1 and its binding partners: Tuning class III phosphatidylinositol 3-kinase activity and tumor suppression. FEBS Lett. 2012, 586, 1584–1591. [Google Scholar] [CrossRef] [Green Version]
- Stenmark, H. The Sir Hans Krebs Lecture. How a lipid mediates tumour suppression. In Proceedings of the 35th FEBS Congress in Gothenburg, Gothenburg, Sweden, 29 June 2010; pp. 4837–4848. [Google Scholar]
- Janji, B.; Viry, E.; Moussay, E.; Paggetti, J.; Arakelian, T.; Mgrditchian, T.; Messai, Y.; Noman, M.Z.; Van Moer, K.; Hasmim, M.; et al. The multifaceted role of autophagy in tumor evasion from immune surveillance. Oncotarget 2016, 7, 17591–17607. [Google Scholar] [CrossRef] [PubMed] [Green Version]
- Perl, A. mTOR activation is a biomarker and a central pathway to autoimmune disorders, cancer, obesity, and aging. Ann. NY. Acad. Sci. 2015, 1346, 33–44. [Google Scholar] [CrossRef] [Green Version]
- Qi, W.X.; Huang, Y.J.; Yao, Y.; Shen, Z.; Min, D.L. Incidence and risk of treatment-related mortality with mTOR inhibitors everolimus and temsirolimus in cancer patients: A meta-analysis. PLoS ONE 2013, 8, e65166. [Google Scholar] [CrossRef] [PubMed]
- Guertin, D.A.; Stevens, D.M.; Saitoh, M.; Kinkel, S.; Crosby, K.; Sheen, J.H.; Mullholland, D.J.; Magnuson, M.A.; Wu, H.; Sabatini, D.M. mTOR complex 2 is required for the development of prostate cancer induced by Pten loss in mice. Cancer Cell 2009, 15, 148–159. [Google Scholar] [CrossRef]
- Guri, Y.; Colombi, M.; Dazert, E.; Hindupur, S.K.; Roszik, J.; Moes, S.; Jenoe, P.; Heim, M.H.; Riezman, I.; Riezman, H.; et al. mTORC2 promotes tumorigenesis via lipid synthesis. Cancer Cell 2017, 32, 807–823. [Google Scholar] [CrossRef]
- Chen, Y.; Qian, J.; He, Q.; Zhao, H.; Toral-Barza, L.; Shi, C.; Zhang, X.; Wu, J.; Yu, K. mTOR complex-2 stimulates acetyl-CoA and de novo lipogenesis through ATP citrate lyase in HER2/PIK3CA-hyperactive breast cancer. Oncotarget 2016, 7, 25224–25240. [Google Scholar] [CrossRef] [PubMed] [Green Version]
- Khamzina, L.; Veilleux, A.; Bergeron, S.; Marette, A. Increased activation of the mammalian target of rapamycin pathway in liver and skeletal muscle of obese rats: Possible involvement in obesity-linked insulin resistance. Endocrinology 2005, 146, 1473–1481. [Google Scholar] [CrossRef] [PubMed]
- Krebs, M.; Brunmair, B.; Brehm, A.; Artwohl, M.; Szendroedi, J.; Nowotny, P.; Roth, E.; Fürnsinn, C.; Promintzer, M.; Anderwald, C.; et al. The Mammalian target of rapamycin pathway regulates nutrient-sensitive glucose uptake in man. Diabetes 2007, 56, 1600–1607. [Google Scholar] [CrossRef] [PubMed]
- Dibble, C.C.; Asara, J.M.; Manning, B.D. Characterization of Rictor phosphorylation sites reveals direct regulation of mTOR complex 2 by S6K1. Mol. Cell. Biol. 2009, 29, 5657–5670. [Google Scholar] [CrossRef] [PubMed]
- Bell, A.; Grunder, L.; Sorisky, A. Rapamycin inhibits human adipocyte differentiation in primary culture. Obes. Res. 2000, 8, 249–254. [Google Scholar] [CrossRef]
- Yeh, W.C.; Bierer, B.E.; McKnight, S.L. Rapamycin inhibits clonal expansion and adipogenic differentiation of 3T3-L1 cells. Proc. Natl. Acad. Sci. USA 1995, 92, 11086–11090. [Google Scholar] [CrossRef] [PubMed]
- Houde, V.P.; Brûlé, S.; Festuccia, W.T.; Blanchard, P.G.; Bellmann, K.; Deshaies, Y.; Marette, A. Chronic rapamycin treatment causes glucose intolerance and hyperlipidemia by upregulating hepatic gluconeogenesis and impairing lipid deposition in adipose tissue. Diabetes 2010, 59, 1338–1348. [Google Scholar] [CrossRef] [PubMed]
- Chang, G.R.; Chiu, Y.S.; Wu, Y.Y.; Chen, W.Y.; Liao, J.W.; Chao, T.H.; Mao, F.C. Rapamycin protects against high fat diet-induced obesity in C57BL/6J mice. J. Pharmacol. Sci. 2009, 109, 496–503. [Google Scholar] [CrossRef] [PubMed]
- Fang, Y.; Westbrook, R.; Hill, C.; Boparai, R.K.; Arum, O.; Spong, A.; Wang, F.; Javors, M.A.; Chen, J.; Sun, L.Y.; et al. Duration of rapamycin treatment has differential effects on metabolism in mice. Cell Metab. 2013, 17, 456–462. [Google Scholar] [CrossRef] [PubMed]
- Rajan, M.R.; Nyman, E.; Brännmark, C.; Olofsson, C.S.; Strålfors, P. Inhibition of FOXO1 transcription factor in primary human adipocytes mimics the insulin resistant state of type 2 diabetes. Biochem. J. 2018, 475, 1807–1820. [Google Scholar] [CrossRef] [PubMed]
- Kim, S.J.; DeStefano, M.A.; Oh, W.J.; Wu, C.C.; Vega-Cotto, N.M.; Finlan, M.; Liu, D.; Su, B.; Jacinto, E. mTOR complex 2 regulates proper turnover of insulin receptor substrate-1 via the ubiquitin ligase subunit Fbw8. Mol. Cell 2012, 48, 875–887. [Google Scholar] [CrossRef] [PubMed]
- Vellai, T.; Takacs-Vellai, K.; Zhang, Y.; Kovacs, A.L.; Orosz, L.; Müller, F. Genetics: Influence of TOR kinase on lifespan in C. elegans. Nature 2003, 426, 620. [Google Scholar] [CrossRef] [PubMed]
- Kapahi, P.; Zid, B.M.; Harper, T.; Koslover, D.; Sapin, V.; Benzer, S. Regulation of lifespan in Drosophila by modulation of genes in the TOR signaling pathway. Curr. Biol. 2004, 14, 885–890. [Google Scholar] [CrossRef] [PubMed]
- Bai, H.; Post, S.; Kang, P.; Tatar, M. drosophila longevity assurance conferred by reduced insulin receptor substrate chico partially requires d4eBP. PLoS ONE 2015, 10, e0134415. [Google Scholar] [CrossRef] [PubMed]
- Kaeberlein, M.; Powers, R.W.r.; Steffen, K.K.; Westman, E.A.; Hu, D.; Dang, N.; Kerr, E.O.; Kirkland, K.T.; Fields, S.; Kennedy, B.K. Regulation of yeast replicative life span by TOR and Sch9 in response to nutrients. Science 2005, 310, 1193–1196. [Google Scholar] [CrossRef] [PubMed]
- Deprez, M.A.; Eskes, E.; Winderickx, J.; Wilms, T. The TORC1-Sch9 pathway as a crucial mediator of chronological lifespan in the yeast Saccharomyces cerevisiae. FEMS Yeast Res. 2018, 18, 18. [Google Scholar] [CrossRef] [PubMed]
- Wu, J.J.; Liu, J.; Chen, E.B.; Wang, J.J.; Cao, L.; Narayan, N.; Fergusson, M.M.; Rovira, I.I.; Allen, M.; Springer, D.A.; et al. Increased mammalian lifespan and a segmental and tissue-specific slowing of aging after genetic reduction of mTOR expression. Cell Rep. 2013, 4, 913–920. [Google Scholar] [CrossRef]
- Selman, C.; Tullet, J.M.; Wieser, D.; Irvine, E.; Lingard, S.J.; Choudhury, A.I.; Claret, M.; Al-Qassab, H.; Carmignac, D.; Ramadani, F.; et al. Ribosomal protein S6 kinase 1 signaling regulates mammalian life span. Science 2009, 326, 140–144. [Google Scholar] [CrossRef]
- Bjedov, I.; Toivonen, J.M.; Kerr, F.; Slack, C.; Jacobson, J.; Foley, A.; Partridge, L. Mechanisms of life span extension by rapamycin in the fruit fly Drosophila melanogaster. Cell Metab. 2010, 11, 35–46. [Google Scholar] [CrossRef]
- Harrison, D.E.; Strong, R.; Sharp, Z.D.; Nelson, J.F.; Astle, C.M.; Flurkey, K.; Nadon, N.L.; Wilkinson, J.E.; Frenkel, K.; Carter, C.S.; et al. Rapamycin fed late in life extends lifespan in genetically heterogeneous mice. Nature 2009, 460, 392–395. [Google Scholar] [CrossRef] [Green Version]
- Powers, R.W.r.; Kaeberlein, M.; Caldwell, S.D.; Kennedy, B.K.; Fields, S. Extension of chronological life span in yeast by decreased TOR pathway signaling. Genes Dev. 2006, 20, 174–184. [Google Scholar] [CrossRef] [PubMed] [Green Version]
- Robida-Stubbs, S.; Glover-Cutter, K.; Lamming, D.W.; Mizunuma, M.; Narasimhan, S.D.; Neumann-Haefelin, E.; Sabatini, D.M.; Blackwell, T.K. TOR signaling and rapamycin influence longevity by regulating SKN-1/Nrf and DAF-16/FoxO. Cell Metab. 2012, 15, 713–724. [Google Scholar] [CrossRef] [PubMed]
- Hansen, M.; Taubert, S.; Crawford, D.; Libina, N.; Lee, S.J.; Kenyon, C. Lifespan extension by conditions that inhibit translation in Caenorhabditis elegans. Aging Cell 2007, 6, 95–110. [Google Scholar] [CrossRef] [PubMed] [Green Version]
- Filer, D.; Thompson, M.A.; Takhaveev, V.; Dobson, A.J.; Kotronaki, I.; Green, J.W.M.; Heinemann, M.; Tullet, J.M.A.; Alic, N. DNA polymerase III limits longevity downstream of TORC1. Nature 2017, 552, 263–267. [Google Scholar] [PubMed]
- Nakamura, S.; Yoshimori, T. Autophagy and Longevity. Mol. Cells 2018, 41, 65–72. [Google Scholar] [PubMed]
- El Magraoui, E.; Reidick, C.; Meyer, H.E.; Platta, H.W. Autophagy-related deubiquitinating enzymes involved in health and disease. Cells 2015, 4, 596–621. [Google Scholar] [CrossRef]
- Chen, C.; Liu, Y.; Liu, Y.; Zheng, P. mTOR regulation and therapeutic rejuvenation of aging hematopoietic stem cells. Sci. Signal. 2009, 2, ra75. [Google Scholar] [CrossRef]
- Yilmaz, Ö.H.; Katajisto, P.; Lamming, D.W.; Gültekin, Y.; Bauer-Rowe, K.E.; Sengupta, S.; Birsoy, K.; Dursun, A.; Yilmaz, V.O.; Selig, M.; Nielsen, G.P.; et al. mTORC1 in the Paneth cell niche couples intestinal stem-cell function to calorie intake. Nature 2012, 486, 490–495. [Google Scholar] [CrossRef] [Green Version]
- Artoni, F.; Kreipke, R.E.; Palmeira, O.; Dixon, C.; Goldberg, Z.; Ruohola-Baker, H. Loss of foxo rescues stem cell aging in Drosophila germ line. Elife 2017, 6, e27842. [Google Scholar] [CrossRef]
- Arriola Apelo, S.I.; Neuman, J.C.; Baar, E.L.; Syed, F.A.; Cummings, N.E.; Brar, H.K.; Pumper, C.P.; Kimple, M.E.; Lamming, D.W. Alternative rapamycin treatment regimens mitigate the impact of rapamycin on glucose homeostasis and the immune system. Aging Cell 2016, 15, 28–38. [Google Scholar] [CrossRef]
- Benjamin, D.; Colombi, M.; Moroni, C.; Hall, M.N. Rapamycin passes the torch: A new generation of mTOR inhibitors. Nat. Rev. Drug Discov. 2011, 10, 868–880. [Google Scholar] [CrossRef]
- Pierzynowska, K.; Gaffke, L.; Cyske, Z.; Puchalski, M.; Rintz, E.; Bartkowski, M.; Osiadły, M.; Pierzynowski, M.; Mantej, J.; Piotrowska, E.; et al. Autophagy stimulation as a promising approach in treatment of neurodegenerative diseases. Metab. Brain Dis. 2018, 33, 989–1008. [Google Scholar] [CrossRef]
- Frake, R.A.; Ricketts, T.; Menzies, F.M.; Rubinsztein, D.C. Autophagy and neurodegeneration. J. Clin. Invest. 2015, 125, 65–74. [Google Scholar] [CrossRef] [PubMed] [Green Version]
- Caccamo, A.; Majumder, S.; Richardson, A.; Strong, R.; Oddo, S. Molecular interplay between mammalian target of rapamycin (mTOR), amyloid-beta, and Tau: Effects on cognitive impairments. J. Biol. Chem. 2010, 285, 13107–13120. [Google Scholar] [CrossRef] [PubMed]
- Majumder, S.; Richardson, A.; Strong, R.; Oddo, S. Inducing autophagy by rapamycin before, but not after, the formation of plaques and tangles ameliorates cognitive deficits. PLoS ONE 2011, 6, e25416. [Google Scholar] [CrossRef] [PubMed]
- Rahman, M.A.; Rhim, H. Therapeutic implication of autophagy in neurodegenerative diseases. BMB Rep. 2017, 50, 345–354. [Google Scholar] [CrossRef] [PubMed] [Green Version]
- Jiang, T.F.; Zhang, Y.J.; Zhou, H.Y.; Wang, H.M.; Tian, L.P.; Liu, J.; Ding, J.Q.; Chen, S.D. Curcumin ameliorates the neurodegenerative pathology in A53T α-synuclein cell model of Parkinson’s disease through the downregulation of mTOR/p70S6K signaling and the recovery of macroautophagy. J. Neuroimmune. Pharmacol. 2013, 8, 356–369. [Google Scholar] [CrossRef]
- Lin, J.; Huo, X.; Liu, X. “mTOR Signaling Pathway”: A potential target of curcumin in the treatment of spinal cord injury. Biomed. Res. Int. 2017, 2017, 1634801. [Google Scholar] [CrossRef]
- Xu, X.Y.; Meng, X.; Li, S.; Gan, R.Y.; Li, Y.; Li, H.B. Bioactivity, health benefits, and related molecular mechanisms of curcumin: Current progress, challenges, and perspectives. Nutrients 2018, 10. [Google Scholar] [CrossRef]
- Sciarretta, S.; Forte, M.; Frati, G.; Sadoshima, J. New insights into the role of mtor signaling in the cardiovascular system. Circ. Res. 2018, 122, 489–505. [Google Scholar] [CrossRef]
- McMullen, J.R.; Sherwood, M.C.; Tarnavski, O.; Zhang, L.; Dorfman, A.L.; Shioi, T.; Izumo, S. Inhibition of mTOR signaling with rapamycin regresses established cardiac hypertrophy induced by pressure overload. Circulation 2004, 109, 3050–3055. [Google Scholar] [CrossRef] [PubMed]
- Shioi, T.; McMullen, J.R.; Tarnavski, O.; Converso, K.; Sherwood, M.C.; Manning, W.J.; Izumo, S. Rapamycin attenuates load-induced cardiac hypertrophy in mice. Circulation 2003, 107, 1664–1670. [Google Scholar] [CrossRef] [PubMed]
- Ikeda, M.; Ide, T.; Fujino, T.; Matsuo, Y.; Arai, S.; Saku, K.; Kakino, T.; Oga, Y.; Nishizaki, A.; Sunagawa, K. The Akt-mTOR axis is a pivotal regulator of eccentric hypertrophy during volume overload. Sci. Rep. 2015, 5, 15881. [Google Scholar] [CrossRef] [PubMed] [Green Version]
- Kurdi, A.; De Meyer, G.R.; Martinet, W. Potential therapeutic effects of mTOR inhibition in atherosclerosis. Br. J. Clin. Pharmacol. 2016, 82, 1267–1279. [Google Scholar] [CrossRef] [PubMed]
- Kurdi, A.; Martinet, W.; De Meyer, G.R.Y. mTOR inhibition and cardiovascular diseases: Dyslipidemia and atherosclerosis. Transplantation 2018, 102, S44–S46. [Google Scholar] [CrossRef] [PubMed]
- Zha, X.Q.; Zhang, W.N.; Peng, F.H.; Xue, L.; Liu, J.; Luo, J.P. Alleviating VLDL overproduction is an important mechanism for Laminaria japonica polysaccharide to inhibit atherosclerosis in LDLr-/- mice with diet-induced insulin resistance. Mol. Nutr. Food Res. 2017, 61. [Google Scholar] [CrossRef]
- Faivre, S.; Kroemer, G.; Raymond, E. Current development of mTOR inhibitors as anticancer agents. Nat. Rev. Drug Discov. 2006, 5, 671–688. [Google Scholar] [CrossRef]
- Fine, N.M.; Kushwaha, S.S. Recent advances in mammalian target of rapamycin inhibitor use in heart and lung transplantation. Transplantation 2016, 100, 2558–2568. [Google Scholar] [CrossRef]
- Giordano, A.; Romano, A. Inhibition of human in-stent restenosis: A molecular view. Curr. Opin. Pharmacol. 2011, 11, 372–377. [Google Scholar] [CrossRef]
- Shirooie, S.; Nabavi, S.F.; Dehpour, A.R.; Belwal, T.; Habtemariam, S.; Argüelles, S.; Sureda, A.; Daglia, M.; Tomczyk, M.; Sobarzo-Sanchez, E.; et al. Targeting mTORs by omega-3 fatty acids: A possible novel therapeutic strategy for neurodegeneration? Pharmacol. Res. 2018. [Google Scholar] [CrossRef]
- Zheng, Y.; Jiang, Y. mTOR inhibitors at a glance. Mol. Cell. Pharmacol. 2015, 7, 15–20. [Google Scholar] [PubMed]
- Neil, J.; Shannon, C.; Mohan, A.; Laurent, D.; Murali, R.; Jhanwar-Uniyal, M. ATP-site binding inhibitor effectively targets mTORC1 and mTORC2 complexes in glioblastoma. Int. J. Oncol. 2016, 48, 1045–1052. [Google Scholar] [CrossRef] [PubMed]
- Ballou, L.M.; Lin, R.Z. Rapamycin and mTOR kinase inhibitors. J. Chem. Biol. 2008, 1, 27–36. [Google Scholar] [CrossRef] [PubMed] [Green Version]
- Zaytseva, Y.Y.; Valentino, J.D.; Gulhati, P.; Evers, B.M. mTOR inhibitors in cancer therapy. Cancer Lett. 2012, 319, 1–7. [Google Scholar] [CrossRef] [PubMed]
- Vilar, E.; Perez-Garcia, J.; Tabernero, J. Pushing the envelope in the mTOR pathway: The second generation of inhibitors. J. Mol. Cancer Ther. 2011, 10, 395–403. [Google Scholar] [CrossRef] [PubMed]
- Conciatori, F.; Ciuffreda, L.; Bazzichetto, C.; Falcone, I.; Pilotto, S.; Bria, E.; Cognetti, F.; Milella, M. mTOR cross-talk in cancer and potential for combination therapy. Cancers (Basel) 2018, 10, E23. [Google Scholar] [CrossRef]
- Mahoney, S.J.; Narayan, S.; Molz, L.; Berstler, L.A.; Kang, S.A.; Vlasuk, G.P.; Saiah, E. A small molecule inhibitor of Rheb selectively targets mTORC1 signaling. Nat. Commun. 2018, 9, 548. [Google Scholar] [CrossRef]
- Rodrik-Outmezguine, V.S.; Okaniwa, M.; Yao, Z.; Novotny, C.J.; McWhirter, C.; Banaji, A.; Won, H.; Wong, W.; Berger, M.; de Stanchina, E.; et al. Overcoming mTOR resistance mutations with a new-generation mTOR inhibitor. Nature 2016, 534, 272–276. [Google Scholar] [CrossRef]
- Fan, Q.; Aksoy, O.; Wong, R.A.; Ilkhanizadeh, S.; Novotny, C.J.; Gustafson, W.C.; Truong, A.Y.; Cayanan, G.; Simonds, E.F.; Haas-Kogan, D.; et al. A kinase inhibitor targeted to mtorc1 drives regression in glioblastoma. Cancer Cell 2017, 31, 424–435. [Google Scholar] [CrossRef]
- Fan, Q.W.; Nicolaides, T.P.; Weiss, W.A. Inhibiting 4EBP1 in Glioblastoma. Clin. Cancer Res. 2018, 24, 14–21. [Google Scholar] [CrossRef]
- Renna, M. Commentary: Overcoming mTOR resistance mutations with a new-generation mTOR inhibitor. Front. Pharmacol. 2016, 7, 431. [Google Scholar] [CrossRef] [PubMed]
Figure 1.
Cellular functions of TORC1 and TORC2. Growth factors activate both TORC1 and TORC2. Moreover, TORC1 integrates information concerning oxygen concentration, amino acid availability and changing energy levels, while it is inhibited by cellular stress and rapamycin. TORC1 supports translation, cell cycle, and cellular metabolism, while it inhibits autophagy. TORC2 controls cellular metabolism and cytoskeleton dynamics.

Figure 2.
Composition of mTOR-complexes. The functional domains of the mTOR protein are depicted in the center. The binding factors present in both TORC1 and TORC2 are shown in boxes (TTT, DEPTOR, mLST8). The TORC1-specific factors are shown in ovals on top of the figure (RAPTOR, PRAS40, FKBP12-rapamycin), while the TORC2-specific factors are shown at the bottom (RICTOR, PROTOR1/2, mSIN1).

Figure 3.
Upstream factors of the TOR pathway. The most important factors required for the signal integration of different stimuli by TORC1 and TORC2 are shown. Factors that enhance TOR activity are shown in squares, while those that hamper TOR activity are shown in circles. Dashed lines: effect mediated via additional proteins that are not depicted in the figure.

Figure 4.
Downstream effectors of TORC1. The direct phosphorylation of targets by TORC1 has context-dependent results. Factors that interfere with the aims of TORC1 function are inactivated by phosphorylation, while supportive factors are stimulated by TORC1. Factors directly involved in transcription and translation are marked with hexagonal boxes.

Figure 5.
Downstream effectors of TORC2. The direct phosphorylation of the depicted kinases by TORC2 results in their activation. Factors that interfere with the aims of TORC2 (circles, hexagon) function are inactivated by phosphorylation, while supportive factors (squares) downstream of the TORC2 are stimulated by phosphorylation.


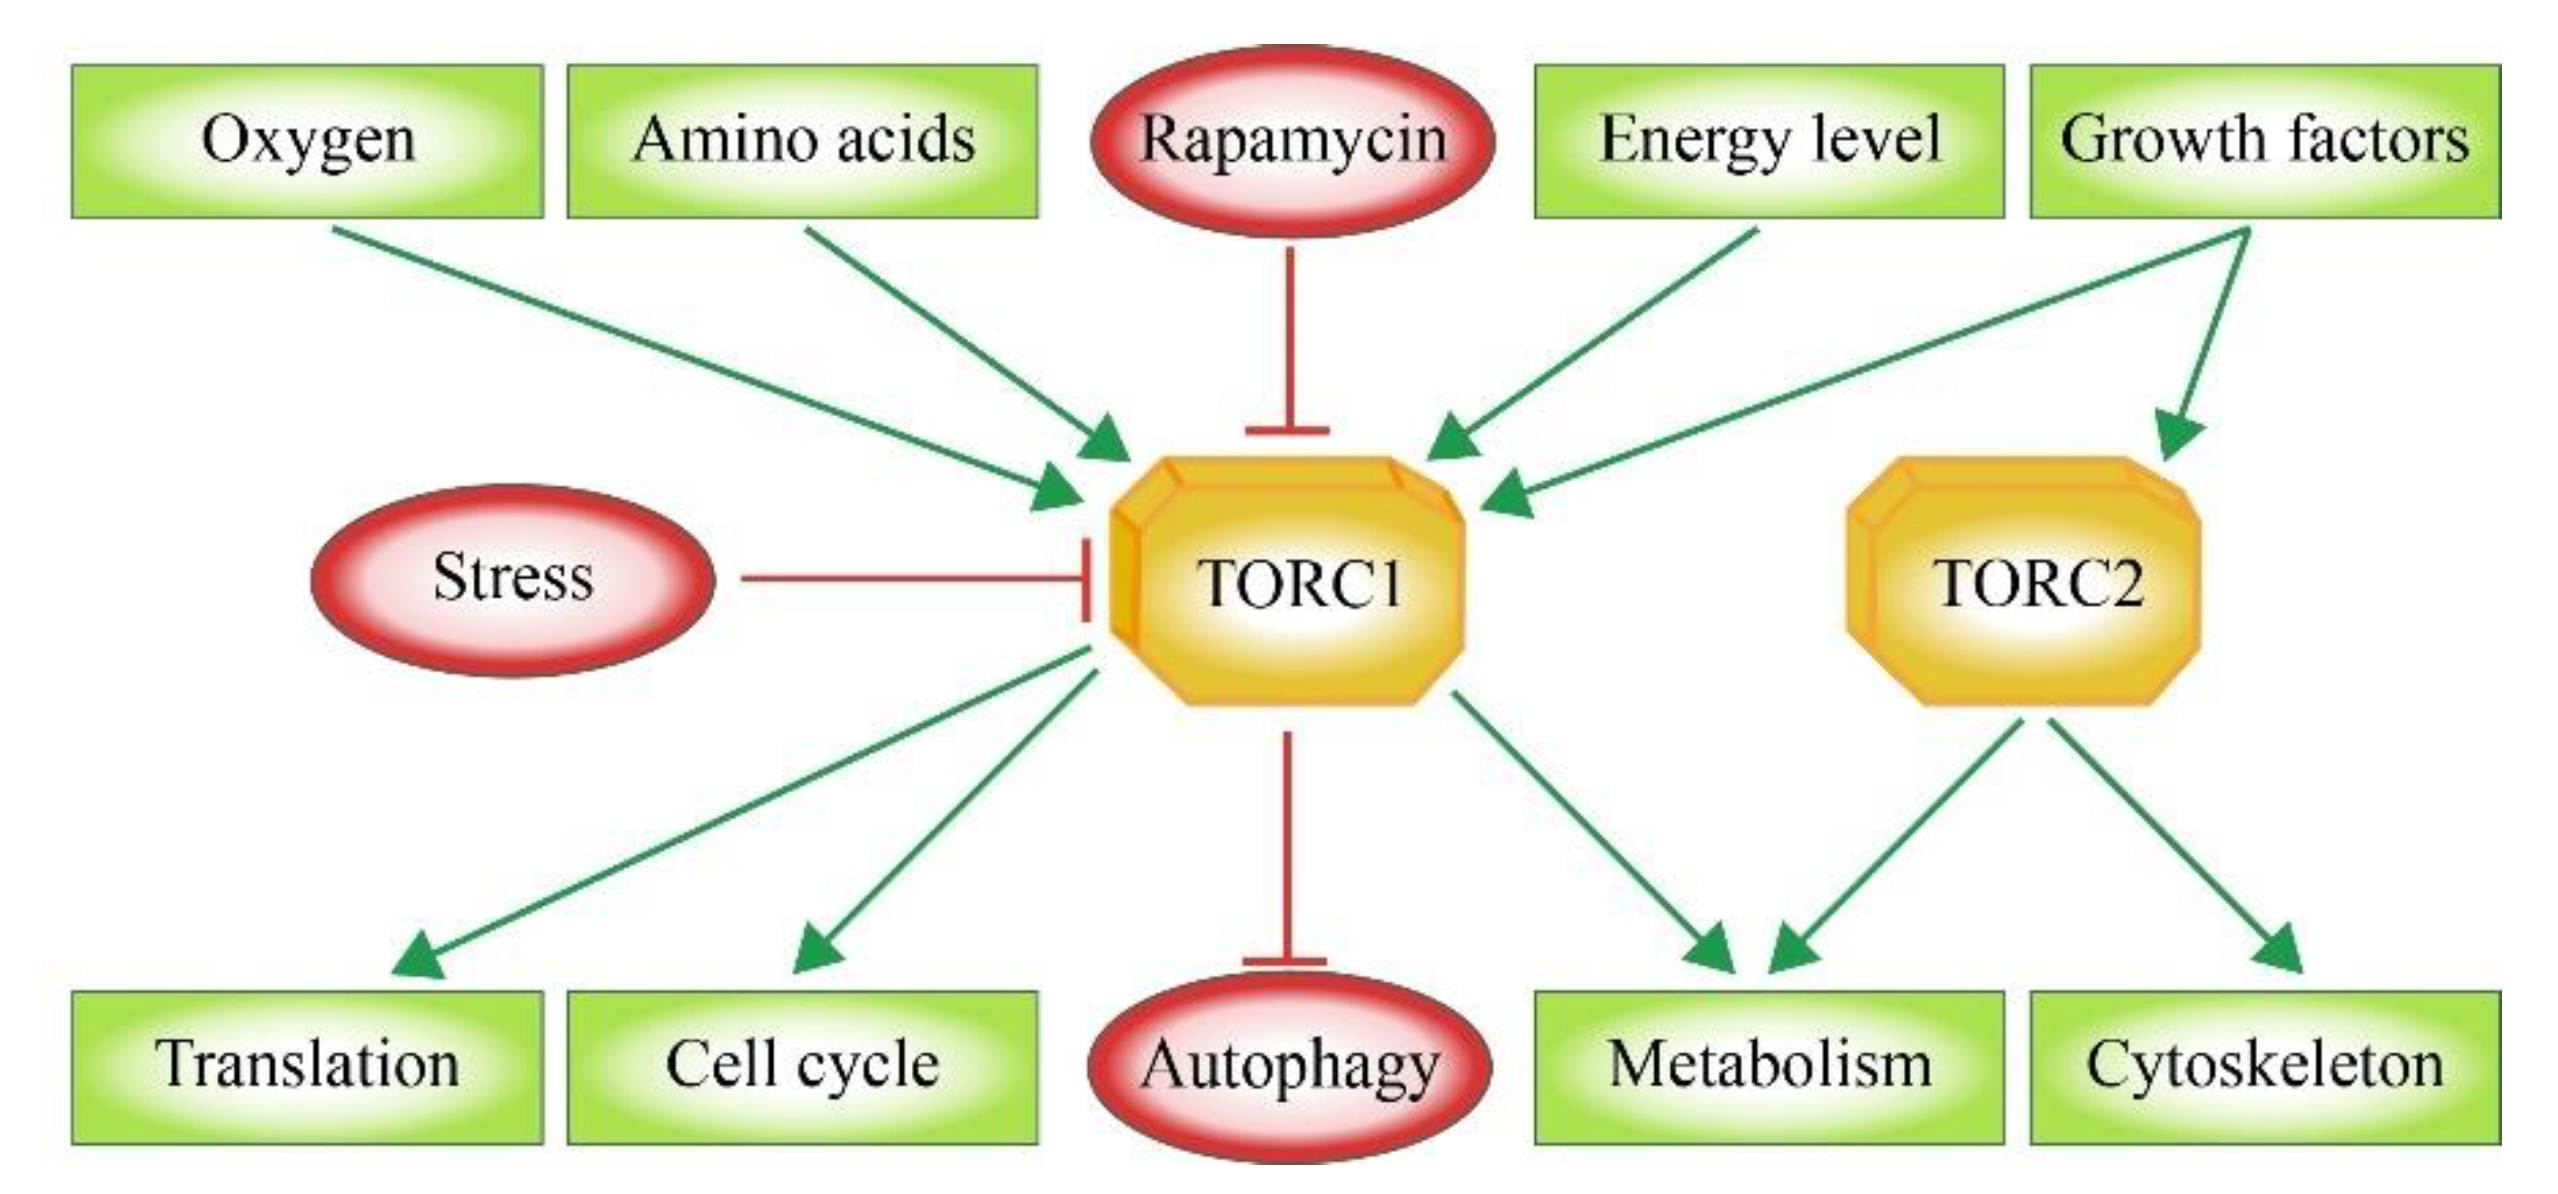
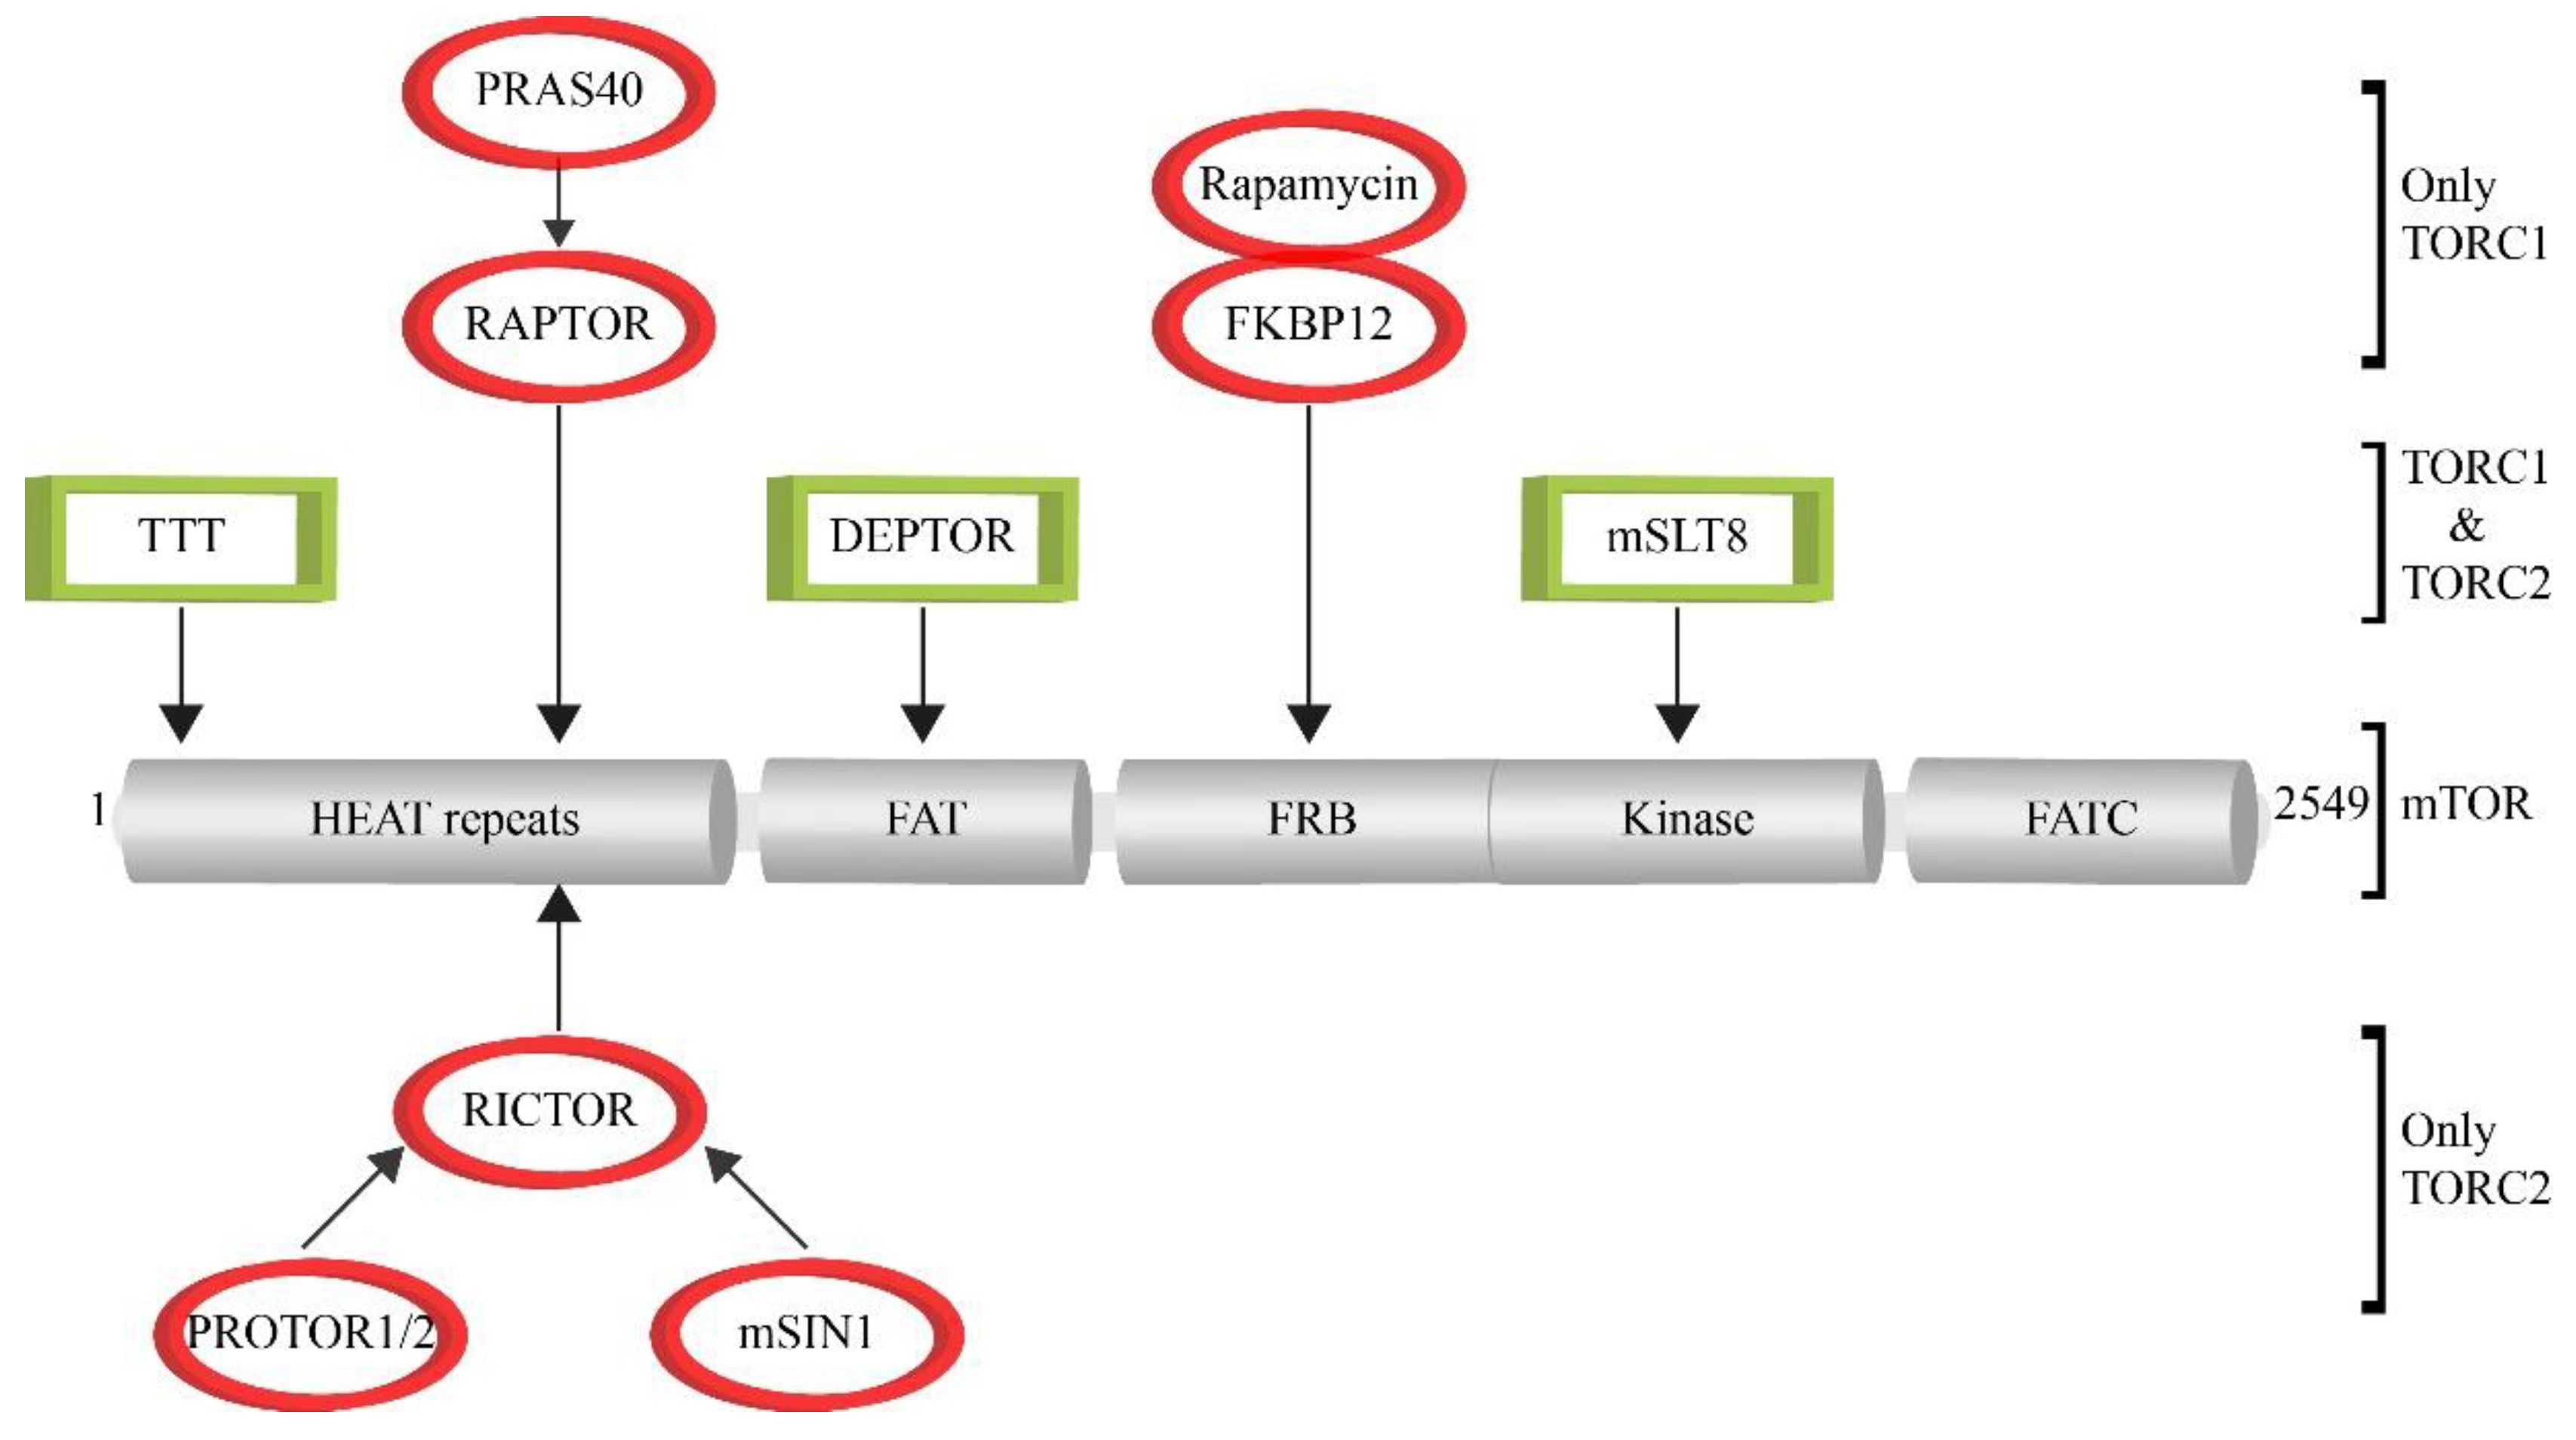
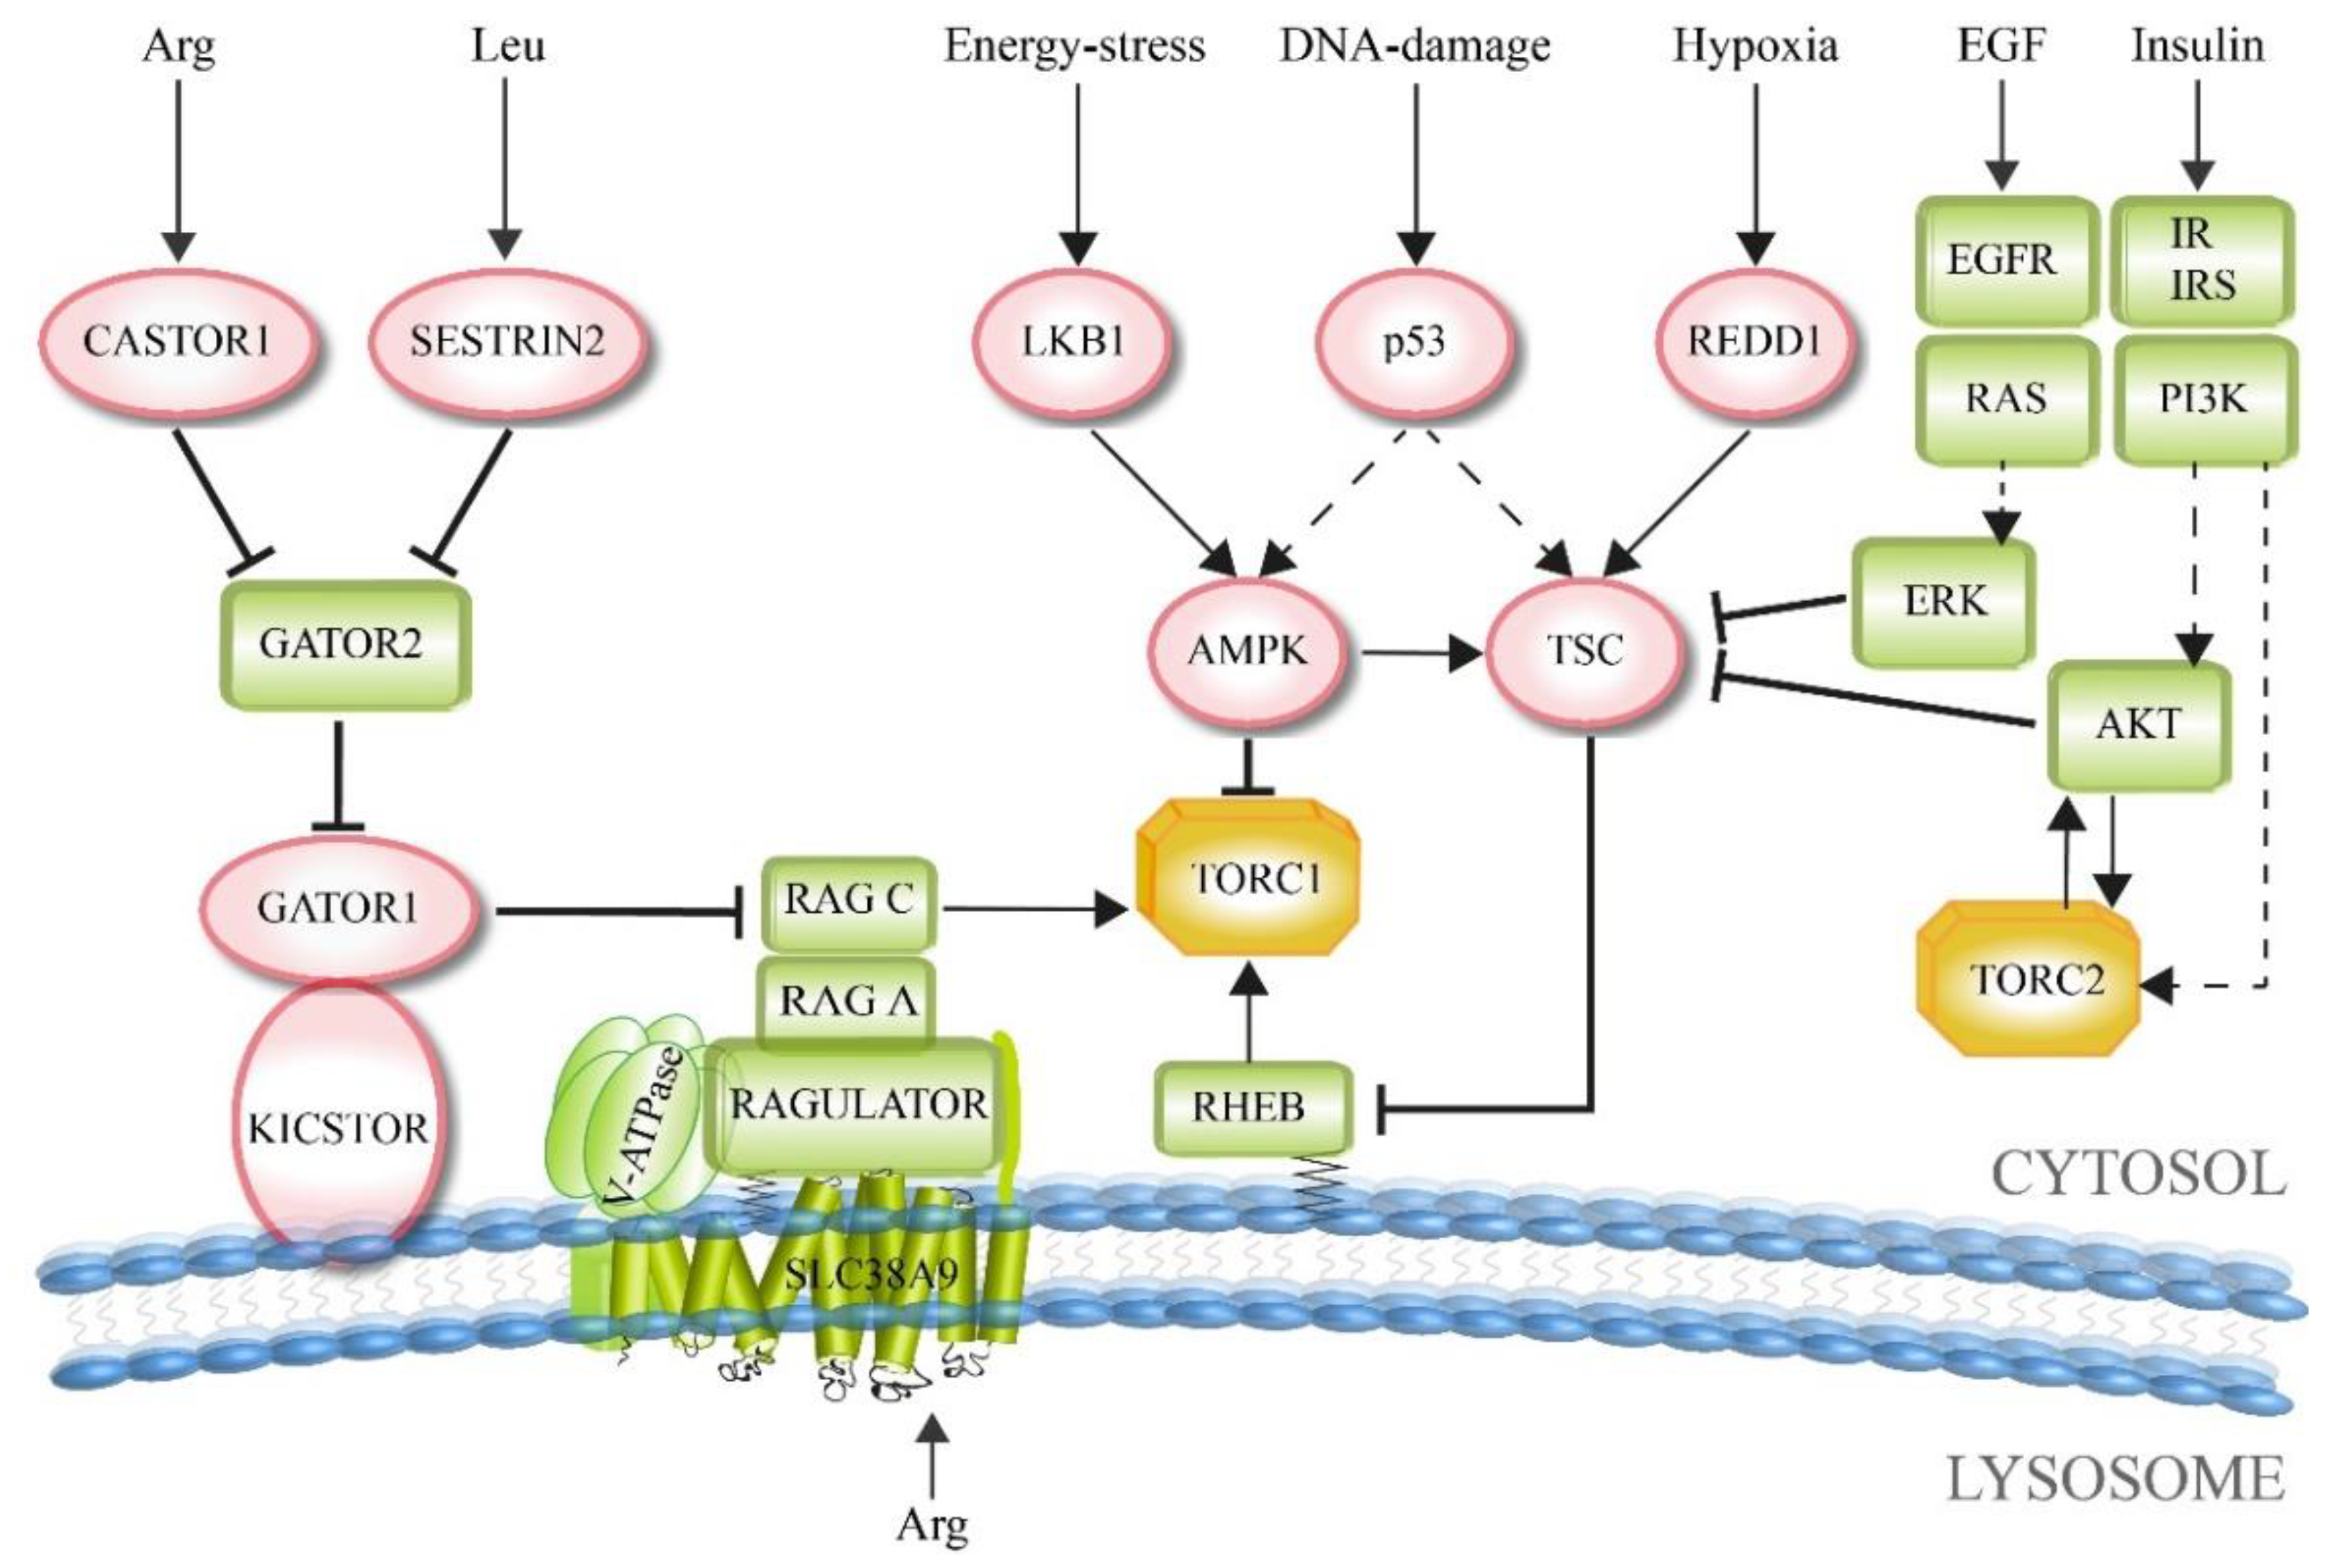
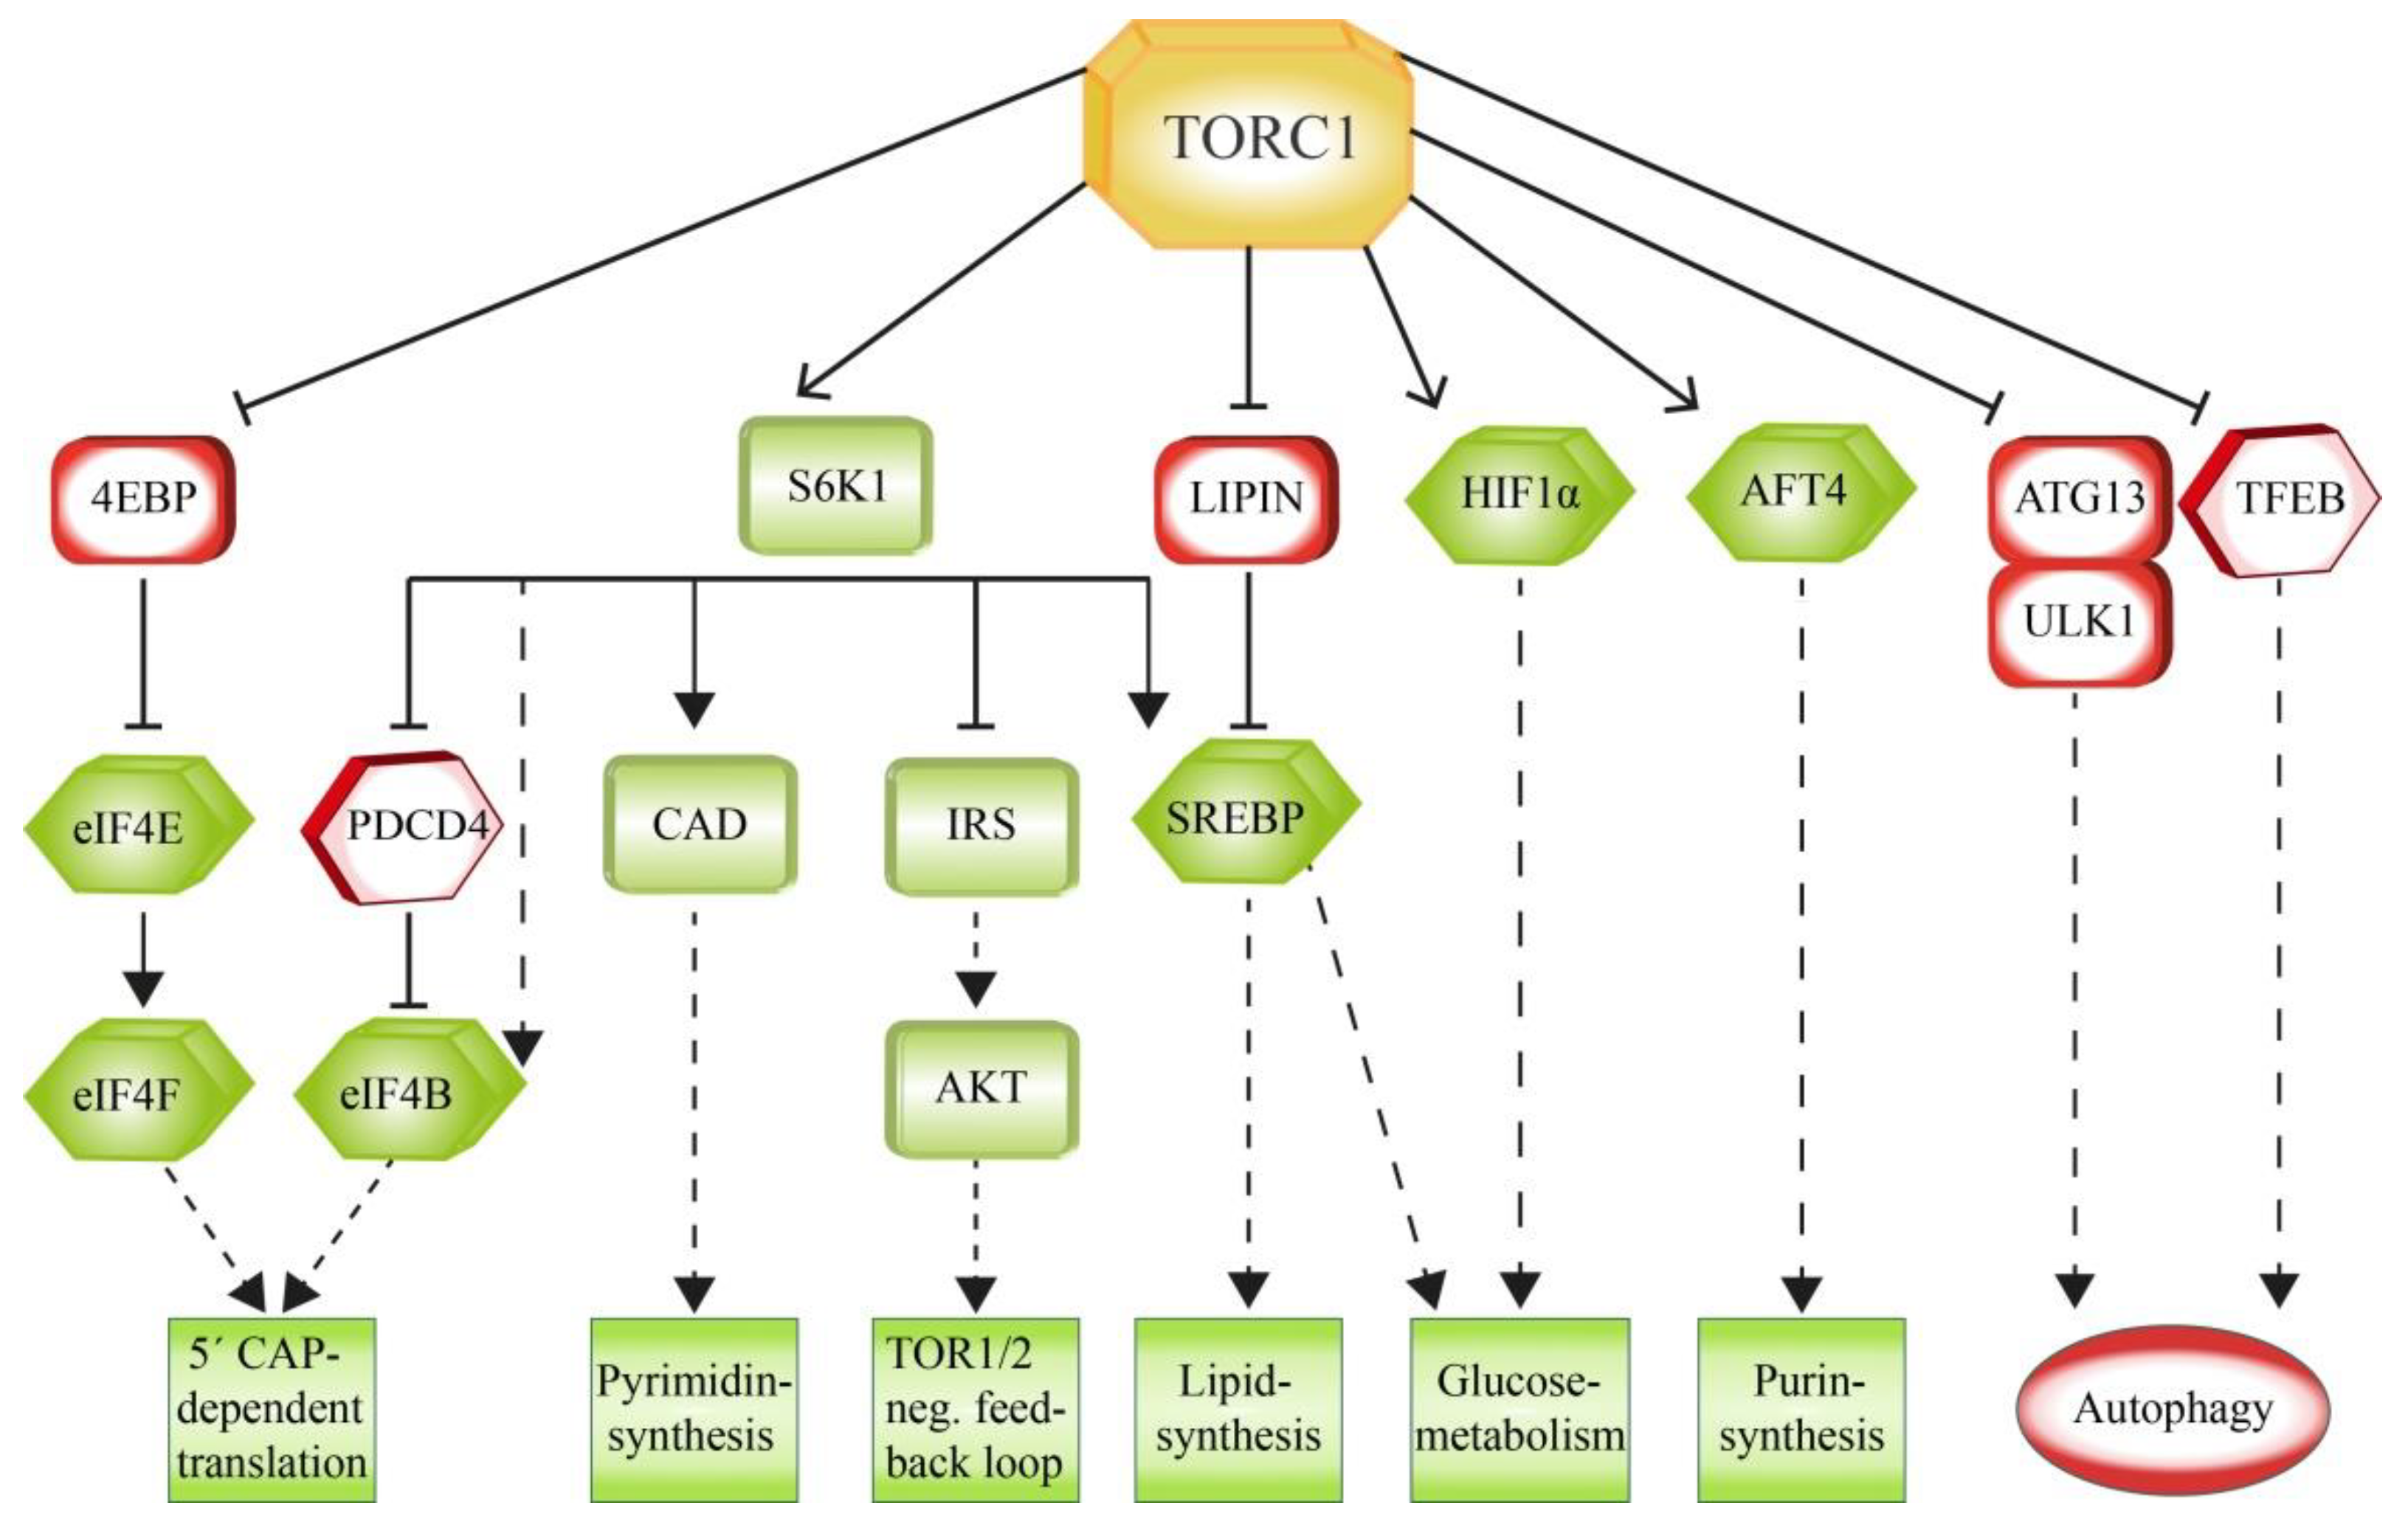
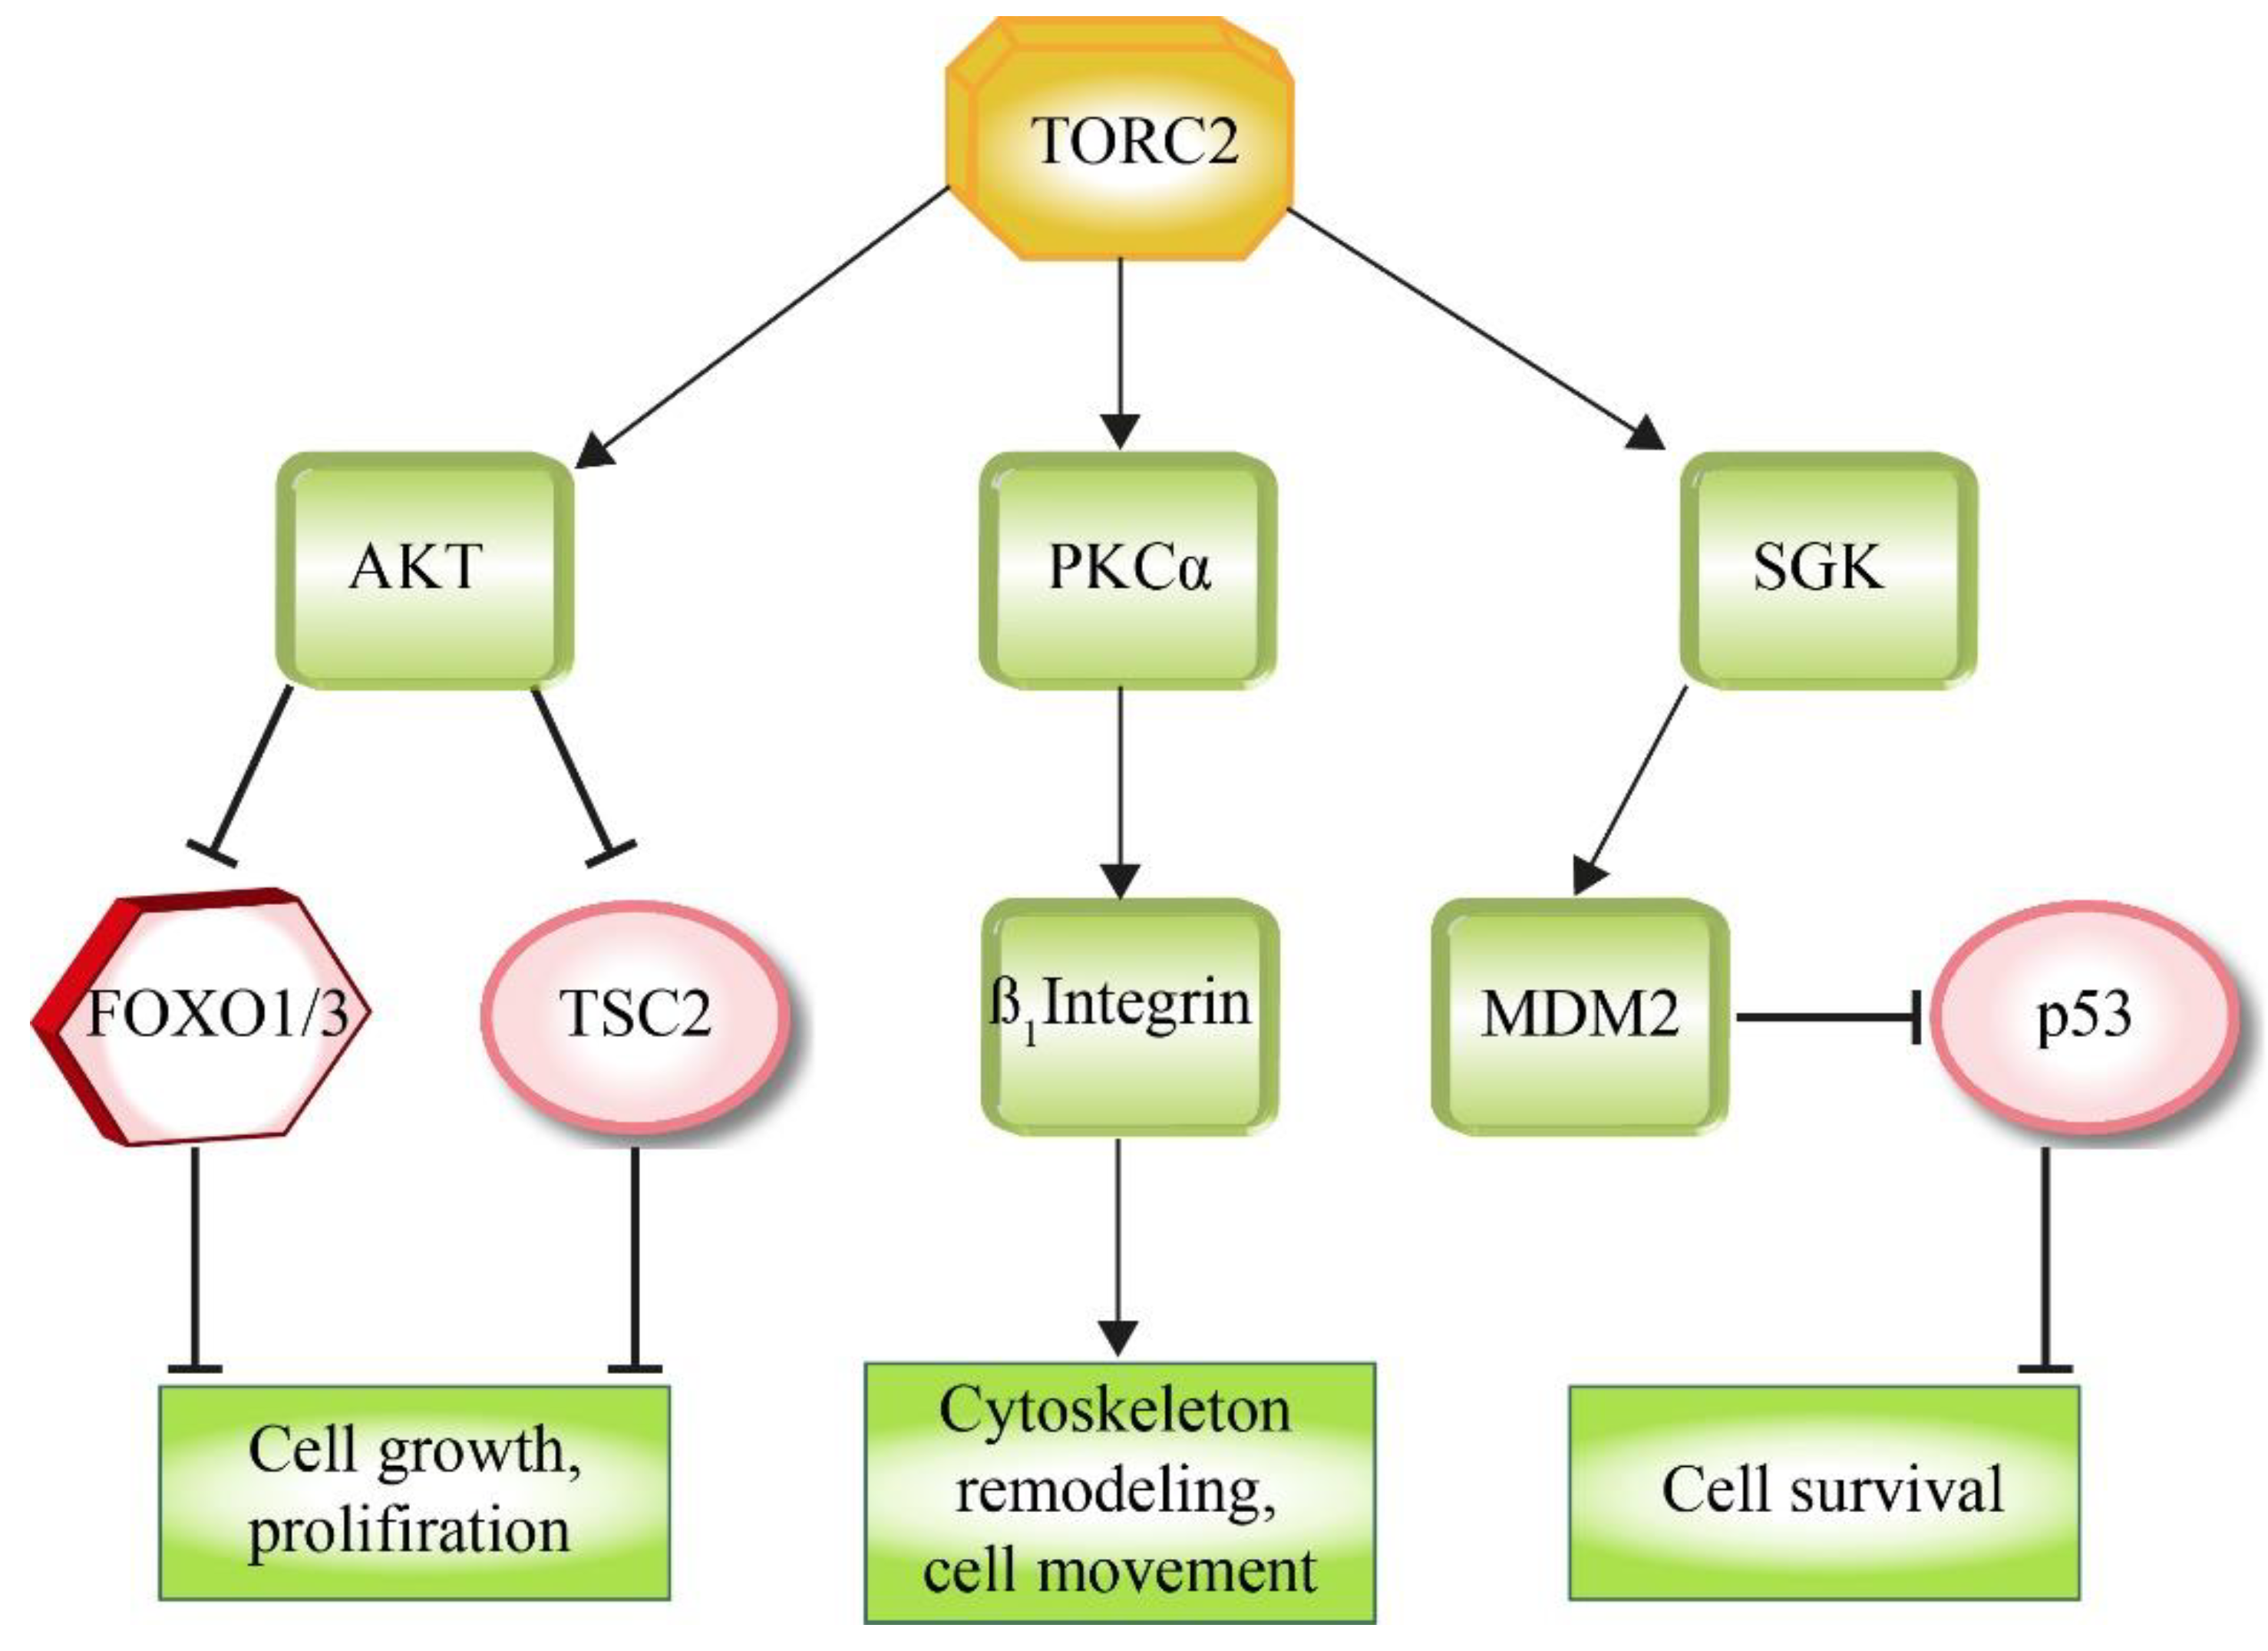
Table 1.
Function and evolutionary conservation of TOR complex constituents. The table lists the constituents of TORC1 and TORC2 in different species and describes their molecular function. Common factors are in green, while unique factors are in red.
Table 1.
Function and evolutionary conservation of TOR complex constituents. The table lists the constituents of TORC1 and TORC2 in different species and describes their molecular function. Common factors are in green, while unique factors are in red.
| H. sapiens | S. cerevisiae | D. melanogaster | C. elegans | Function | |
|---|---|---|---|---|---|
| TORC1 | mTOR | Tor1, Tor2 | TOR1 | TOR | Serine/threonine kinase |
| TEL2, TTI1, TTI2 | Tel2, Tti1, Tti2 | Tel2, Tti1, Tti2 | clk-2 | Assembly and stability | |
| mLST8 | Lst8 | Lst8 | lst-8 | Core complex | |
| DEPTOR | - | - | - | mTOR inhibitor | |
| RAPTOR | Kog1 | Raptor | daf-15 | Localization; substrate binding | |
| FKBP12 | Fpr1 | FKBP12 | fkbp-2 | PPlase; binds rapamycin | |
| PRAS40 | - | - | - | mTOR inhibitor | |
| - | Tco89 | - | - | unknown | |
| TORC2 | mTOR | Tor2 | TOR | TOR | Serine/threonine kinase |
| TEL2, TTI1, TTI2 | Tel2, Tti1, Tti2 | Tel2, Tti1, Tti2 | clk-2 | Assembly and stability | |
| mLST8 | Lst8 | Lst8 | lst-8 | Activator of TORC2 kinase activity | |
| DEPTOR | - | - | - | mTOR inhibitor | |
| RICTOR | Avo3 | Rictor | rict-15 | Interaction with substrates; blocks FKBP12/Rapa | |
| PROTOR | Bit61, Bit2 | - | - | Increase of SGK1 activation | |
| mSIN1 | Avo1 | Sin1 | sinh-1 | Interaction with SGK1 | |
| - | Avo2 | - | - | Cytoskeleton regulation |
Table 2.
Pharmacological use of different mTOR inhibitor classes. The table displays the characteristics of the corresponding inhibitor family and lists important examples.
Table 2.
Pharmacological use of different mTOR inhibitor classes. The table displays the characteristics of the corresponding inhibitor family and lists important examples.
| First Generation |
| Target: TORC1 (binding to FKBP1) |
Examples:
|
| Second Generation |
| Targets: TORC1,TORC2,PI3K (bind kinase domain) Examples:
|
| Third Generation |
| Targets: TORC1,TORC2 (bivalent binding to FRB domain and kinase domain) Example:
Status: Preclinical research |
© 2019 by the authors. Licensee MDPI, Basel, Switzerland. This article is an open access article distributed under the terms and conditions of the Creative Commons Attribution (CC BY) license (http://creativecommons.org/licenses/by/4.0/).
Share and Cite
MDPI and ACS Style
Boutouja, F.; Stiehm, C.M.; Platta, H.W. mTOR: A Cellular Regulator Interface in Health and Disease. Cells 2019, 8, 18. https://doi.org/10.3390/cells8010018
AMA Style
Boutouja F, Stiehm CM, Platta HW. mTOR: A Cellular Regulator Interface in Health and Disease. Cells. 2019; 8(1):18. https://doi.org/10.3390/cells8010018
Chicago/Turabian StyleBoutouja, Fahd, Christian M. Stiehm, and Harald W. Platta. 2019. "mTOR: A Cellular Regulator Interface in Health and Disease" Cells 8, no. 1: 18. https://doi.org/10.3390/cells8010018
Note that from the first issue of 2016, this journal uses article numbers instead of page numbers. See further details here.