


Transcriptional Control of Subcutaneous Adipose Tissue by the Transcription Factor CTCF Modulates Heterogeneity in Fat Distribution in Women
 , , , and
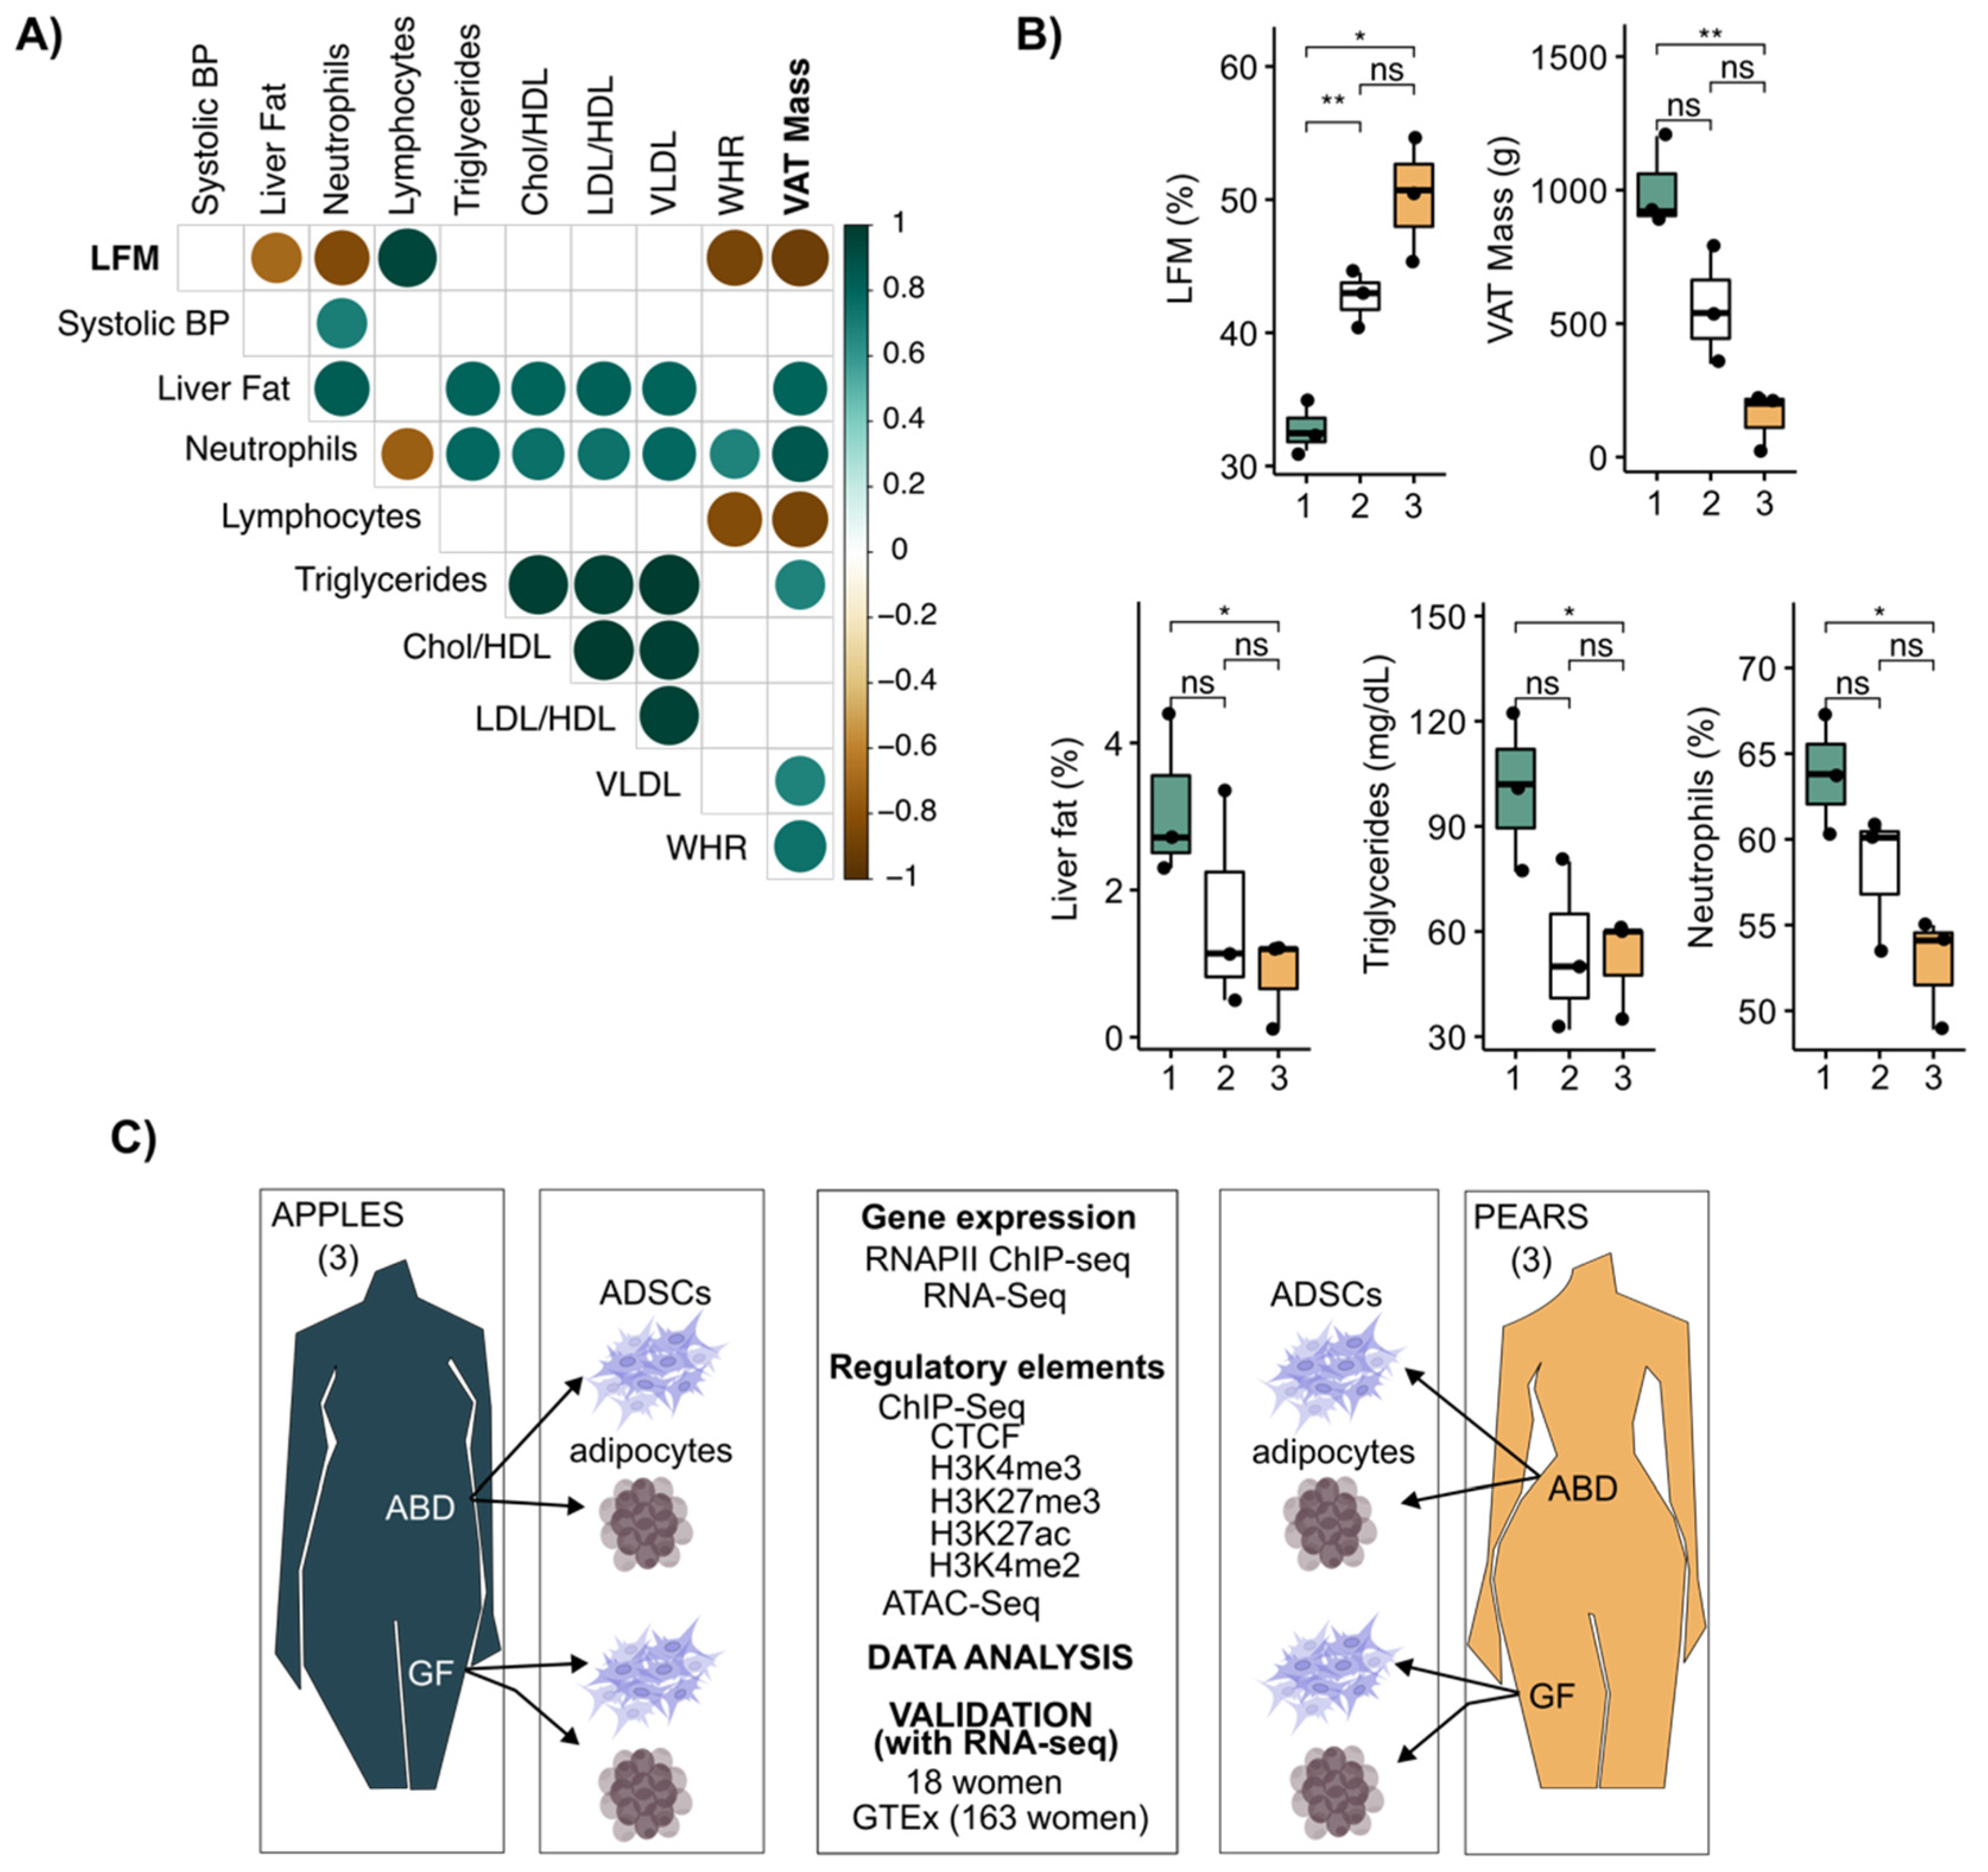
Abstract
:1. Introduction
2. Materials and Methods
3. Results
3.1. Leg Fat Mass Is Associated with Reduced Visceral Adipose Tissue and Healthier Clinical Profile in Premenopausal Women
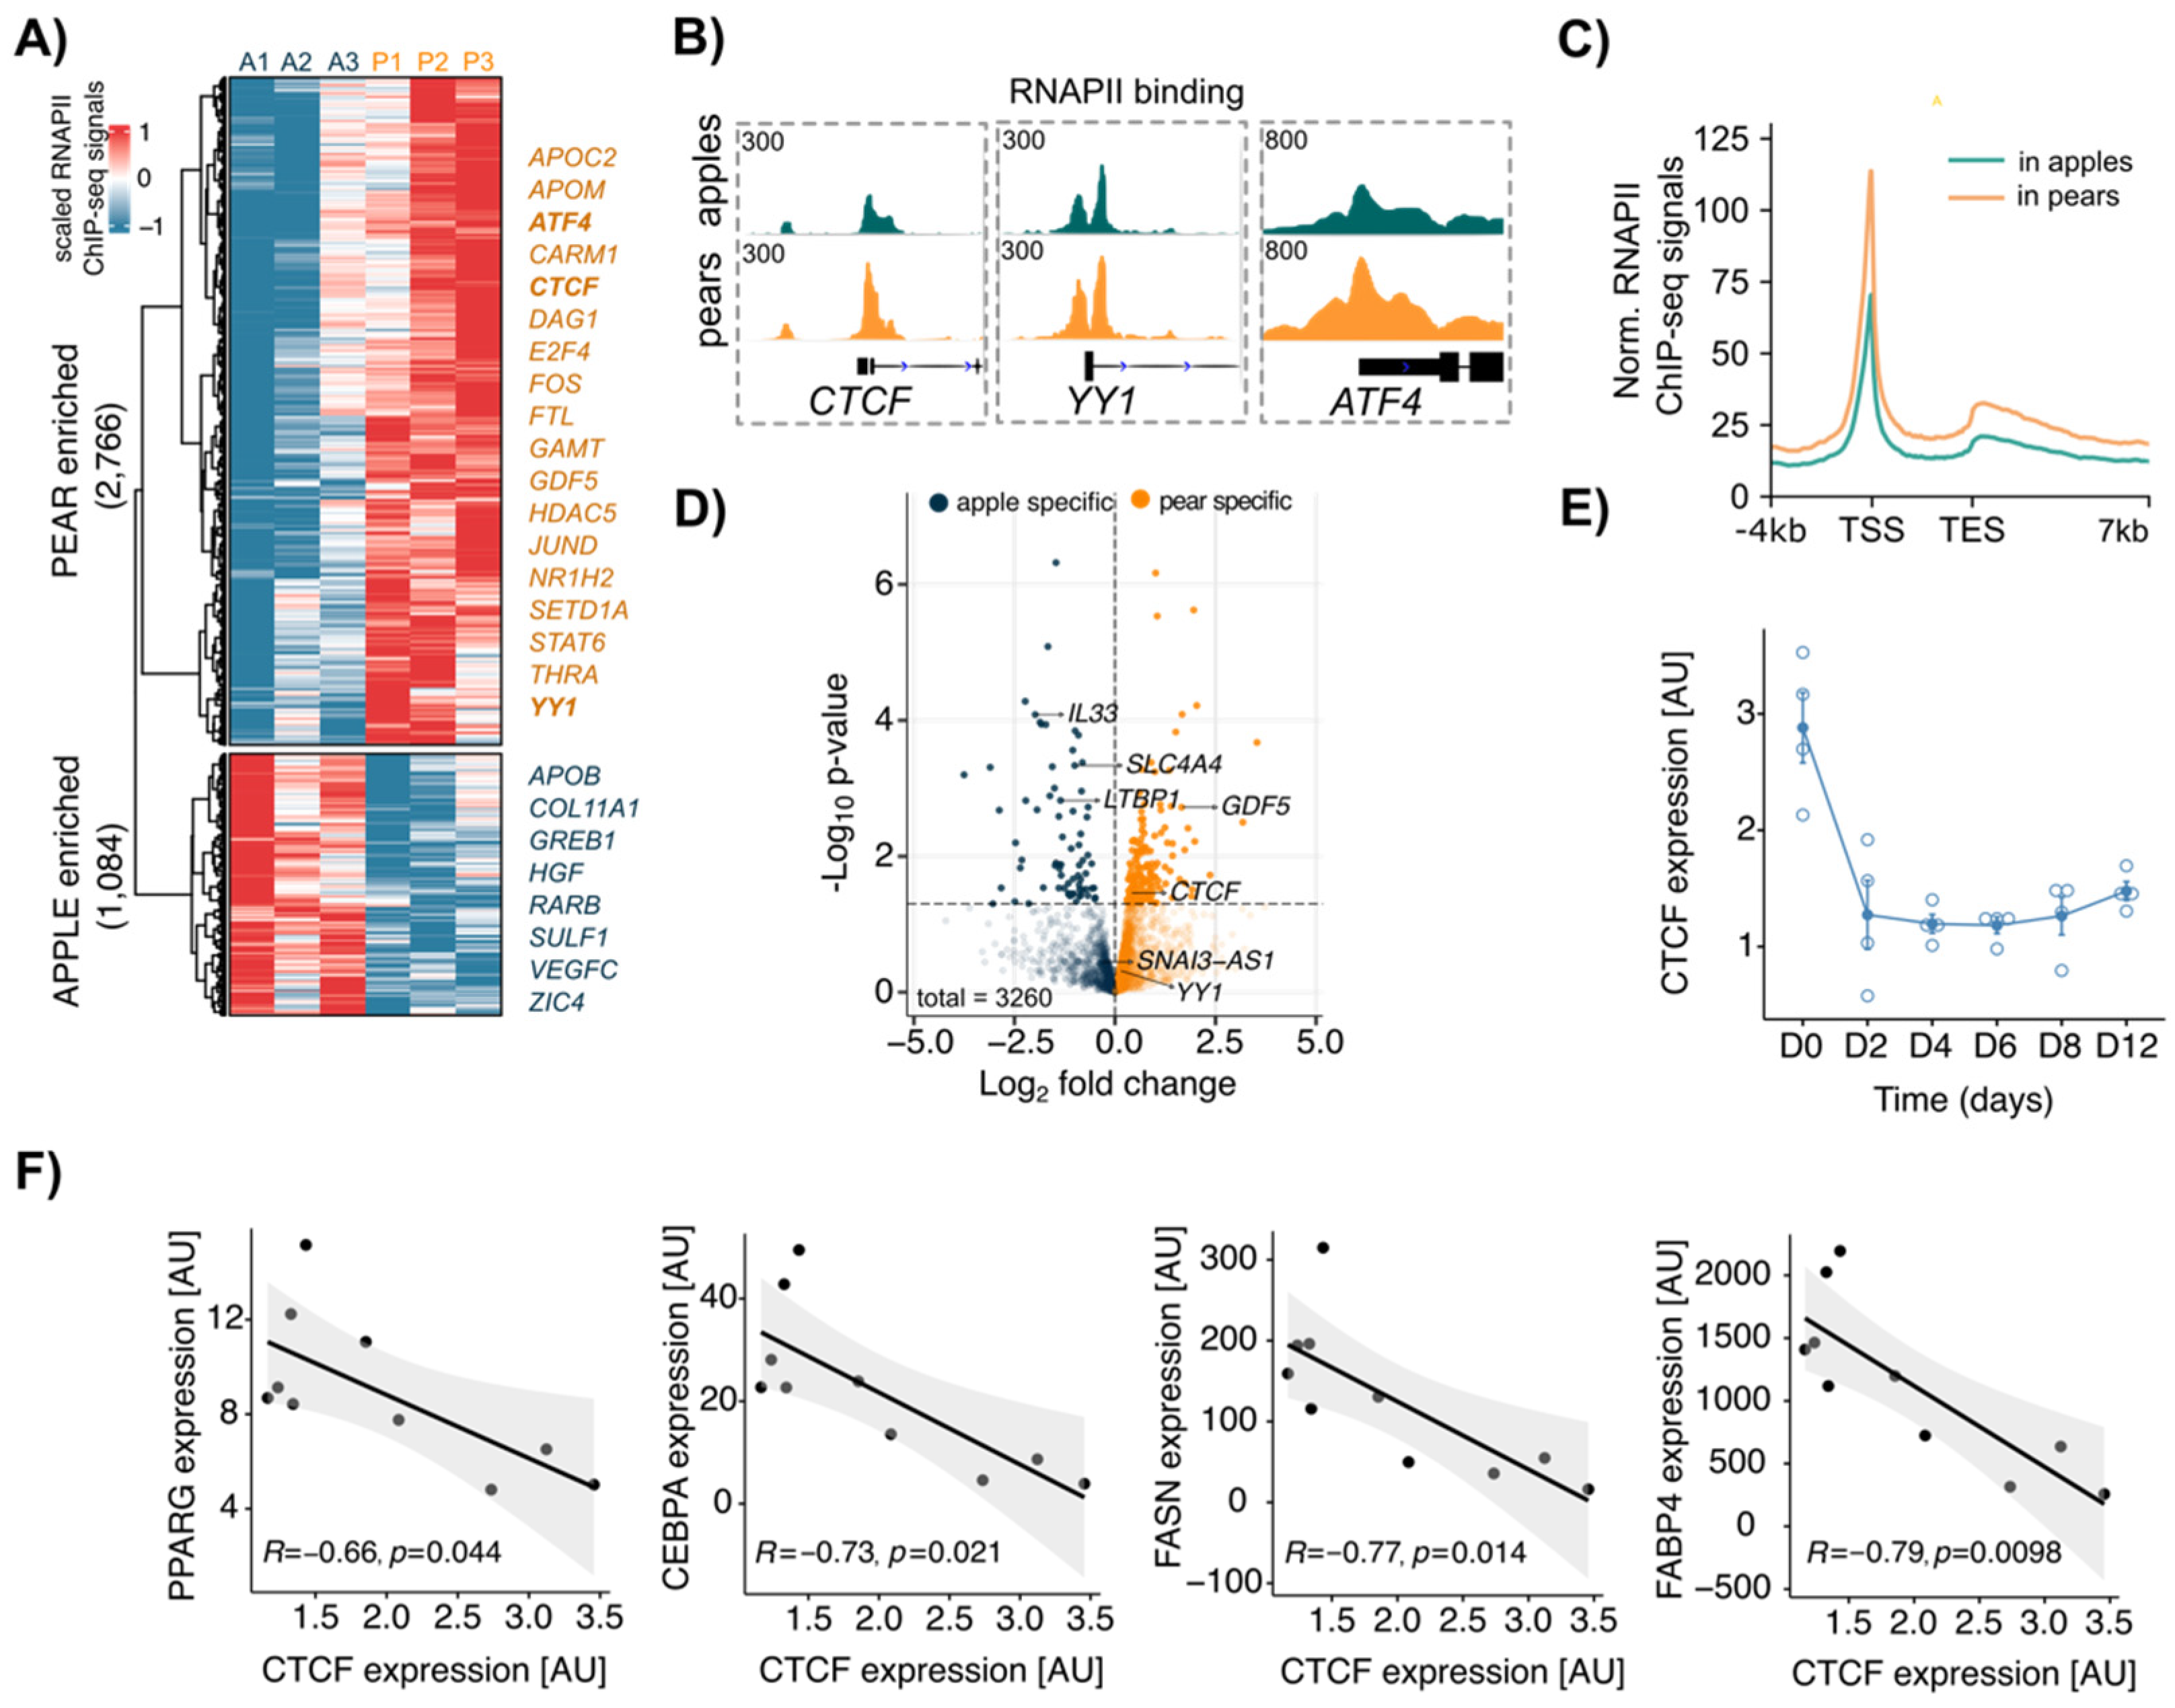
3.2. CTCF Is a Key Factor Involved in Body Shape-Specific Transcriptional Regulation in Human ADSCs
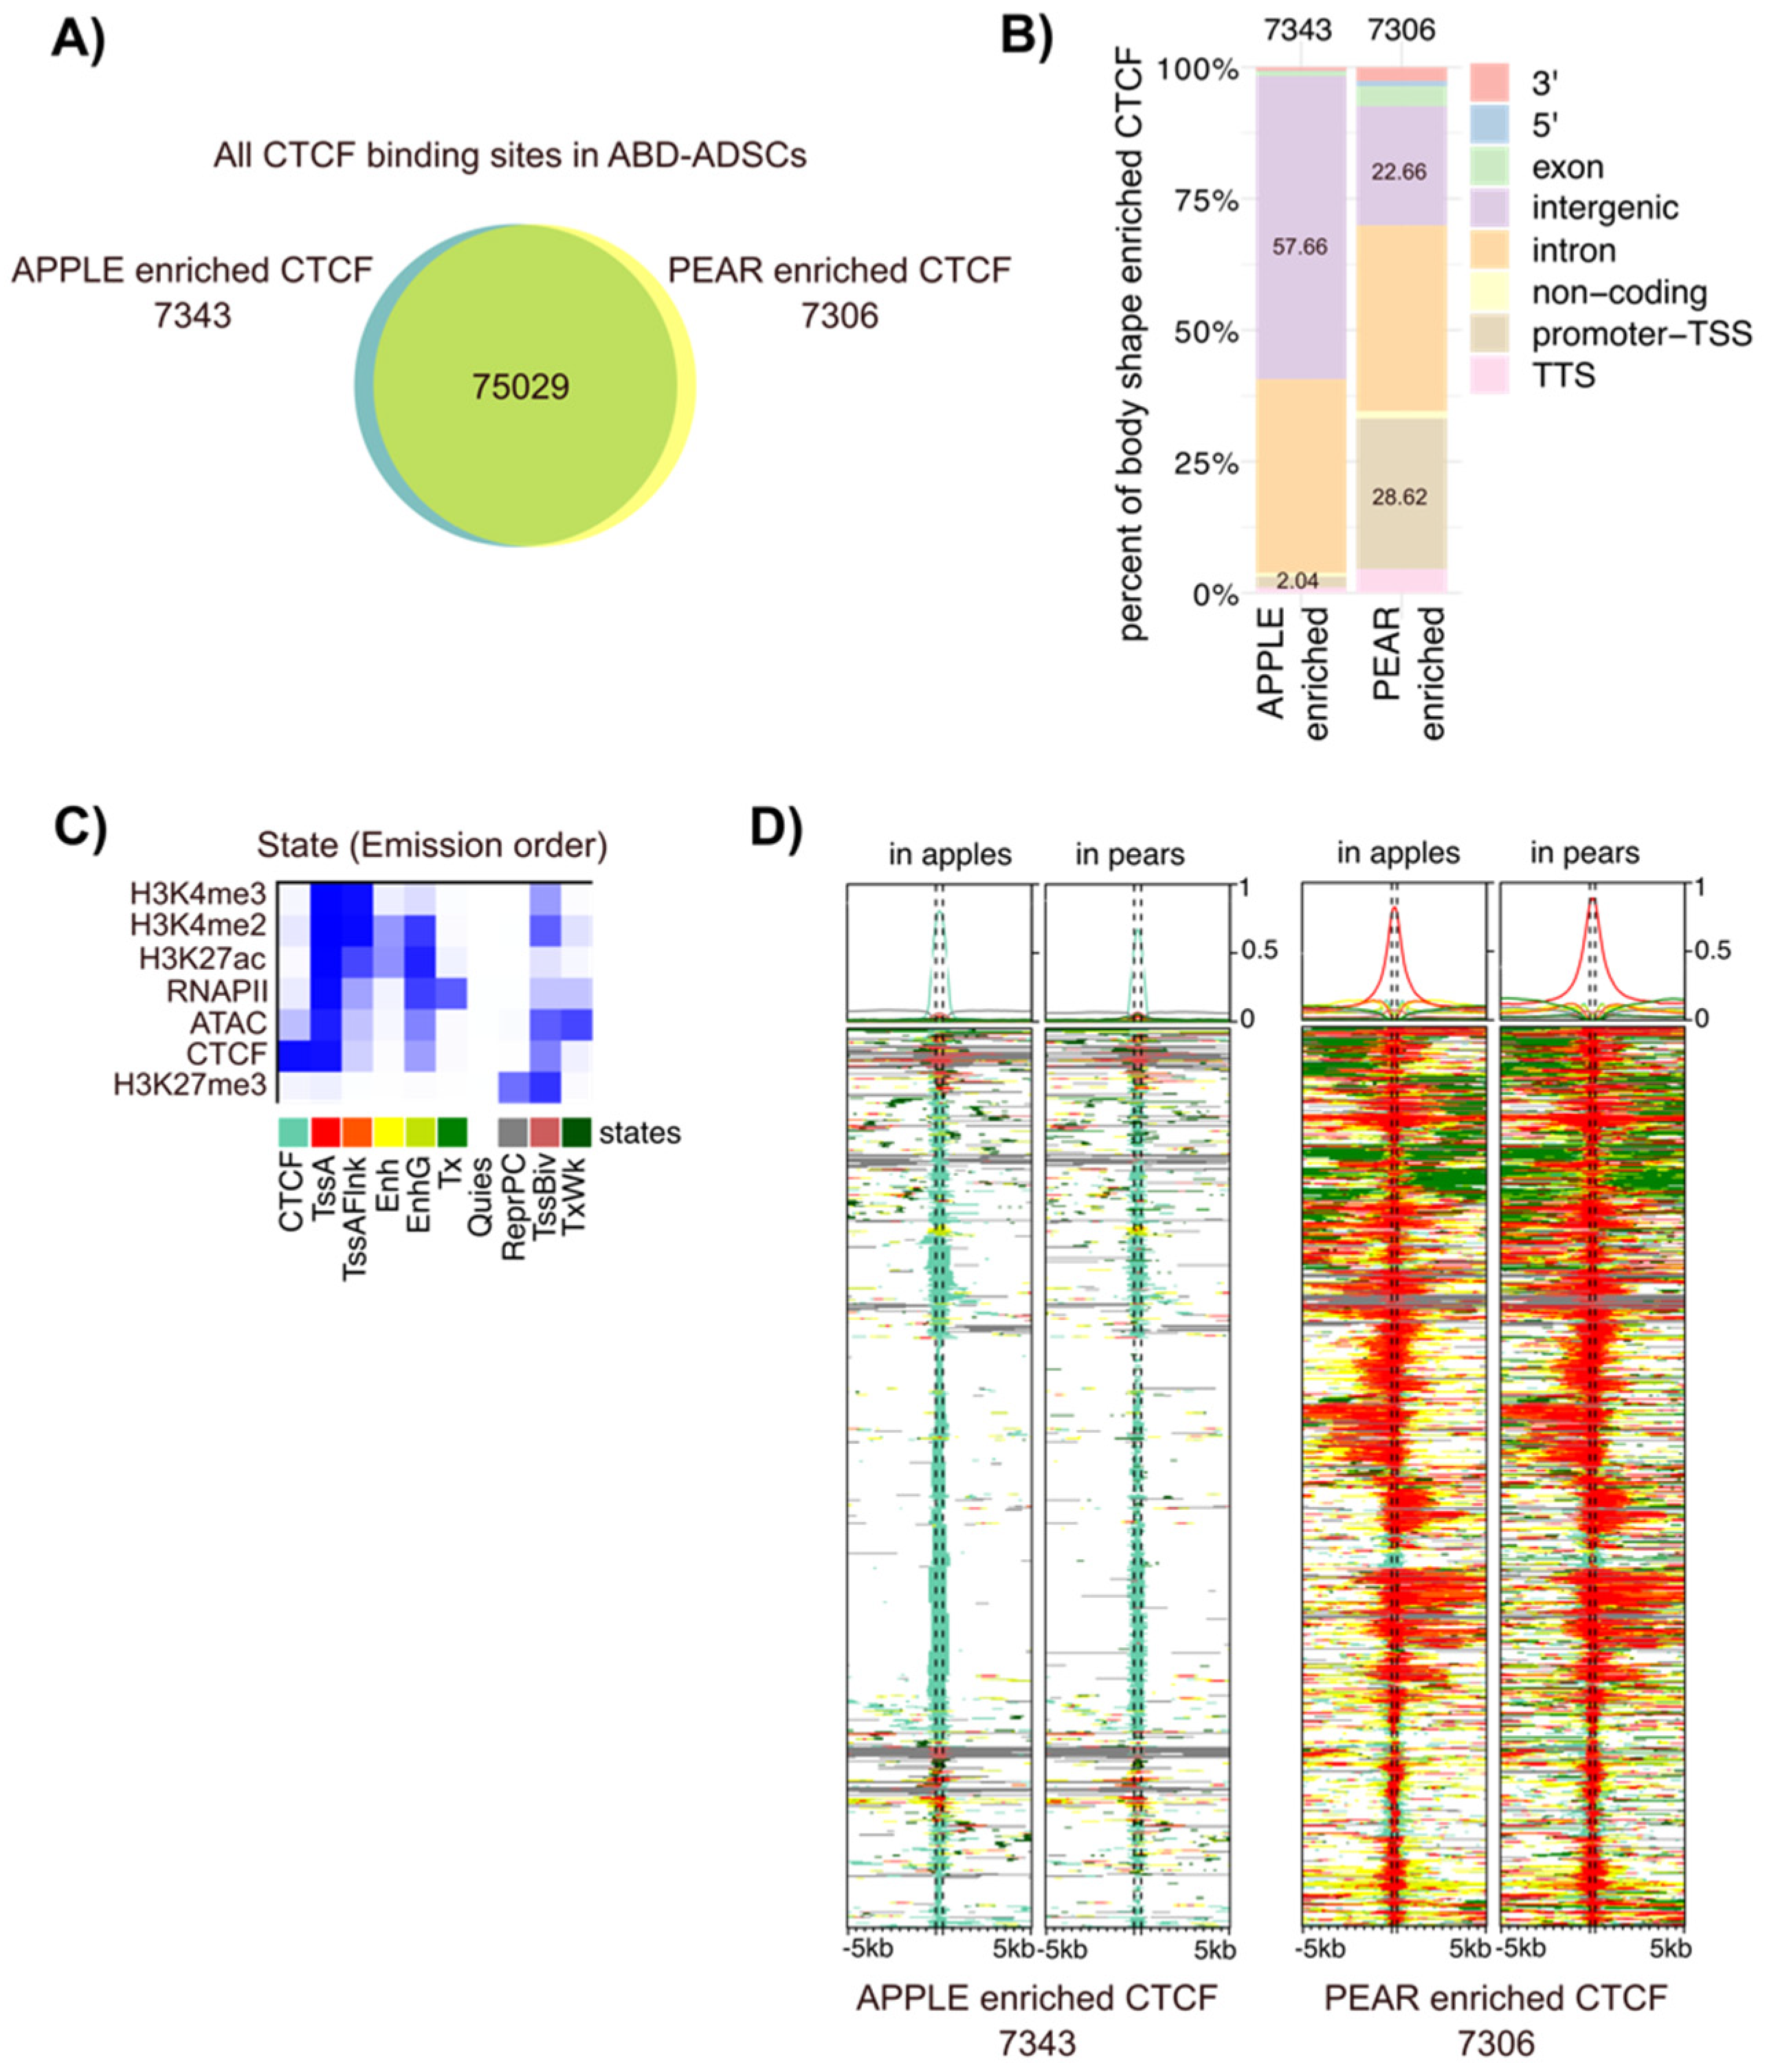
3.3. Differential CTCF Enrichment in Apple vs. Pear ADSCs
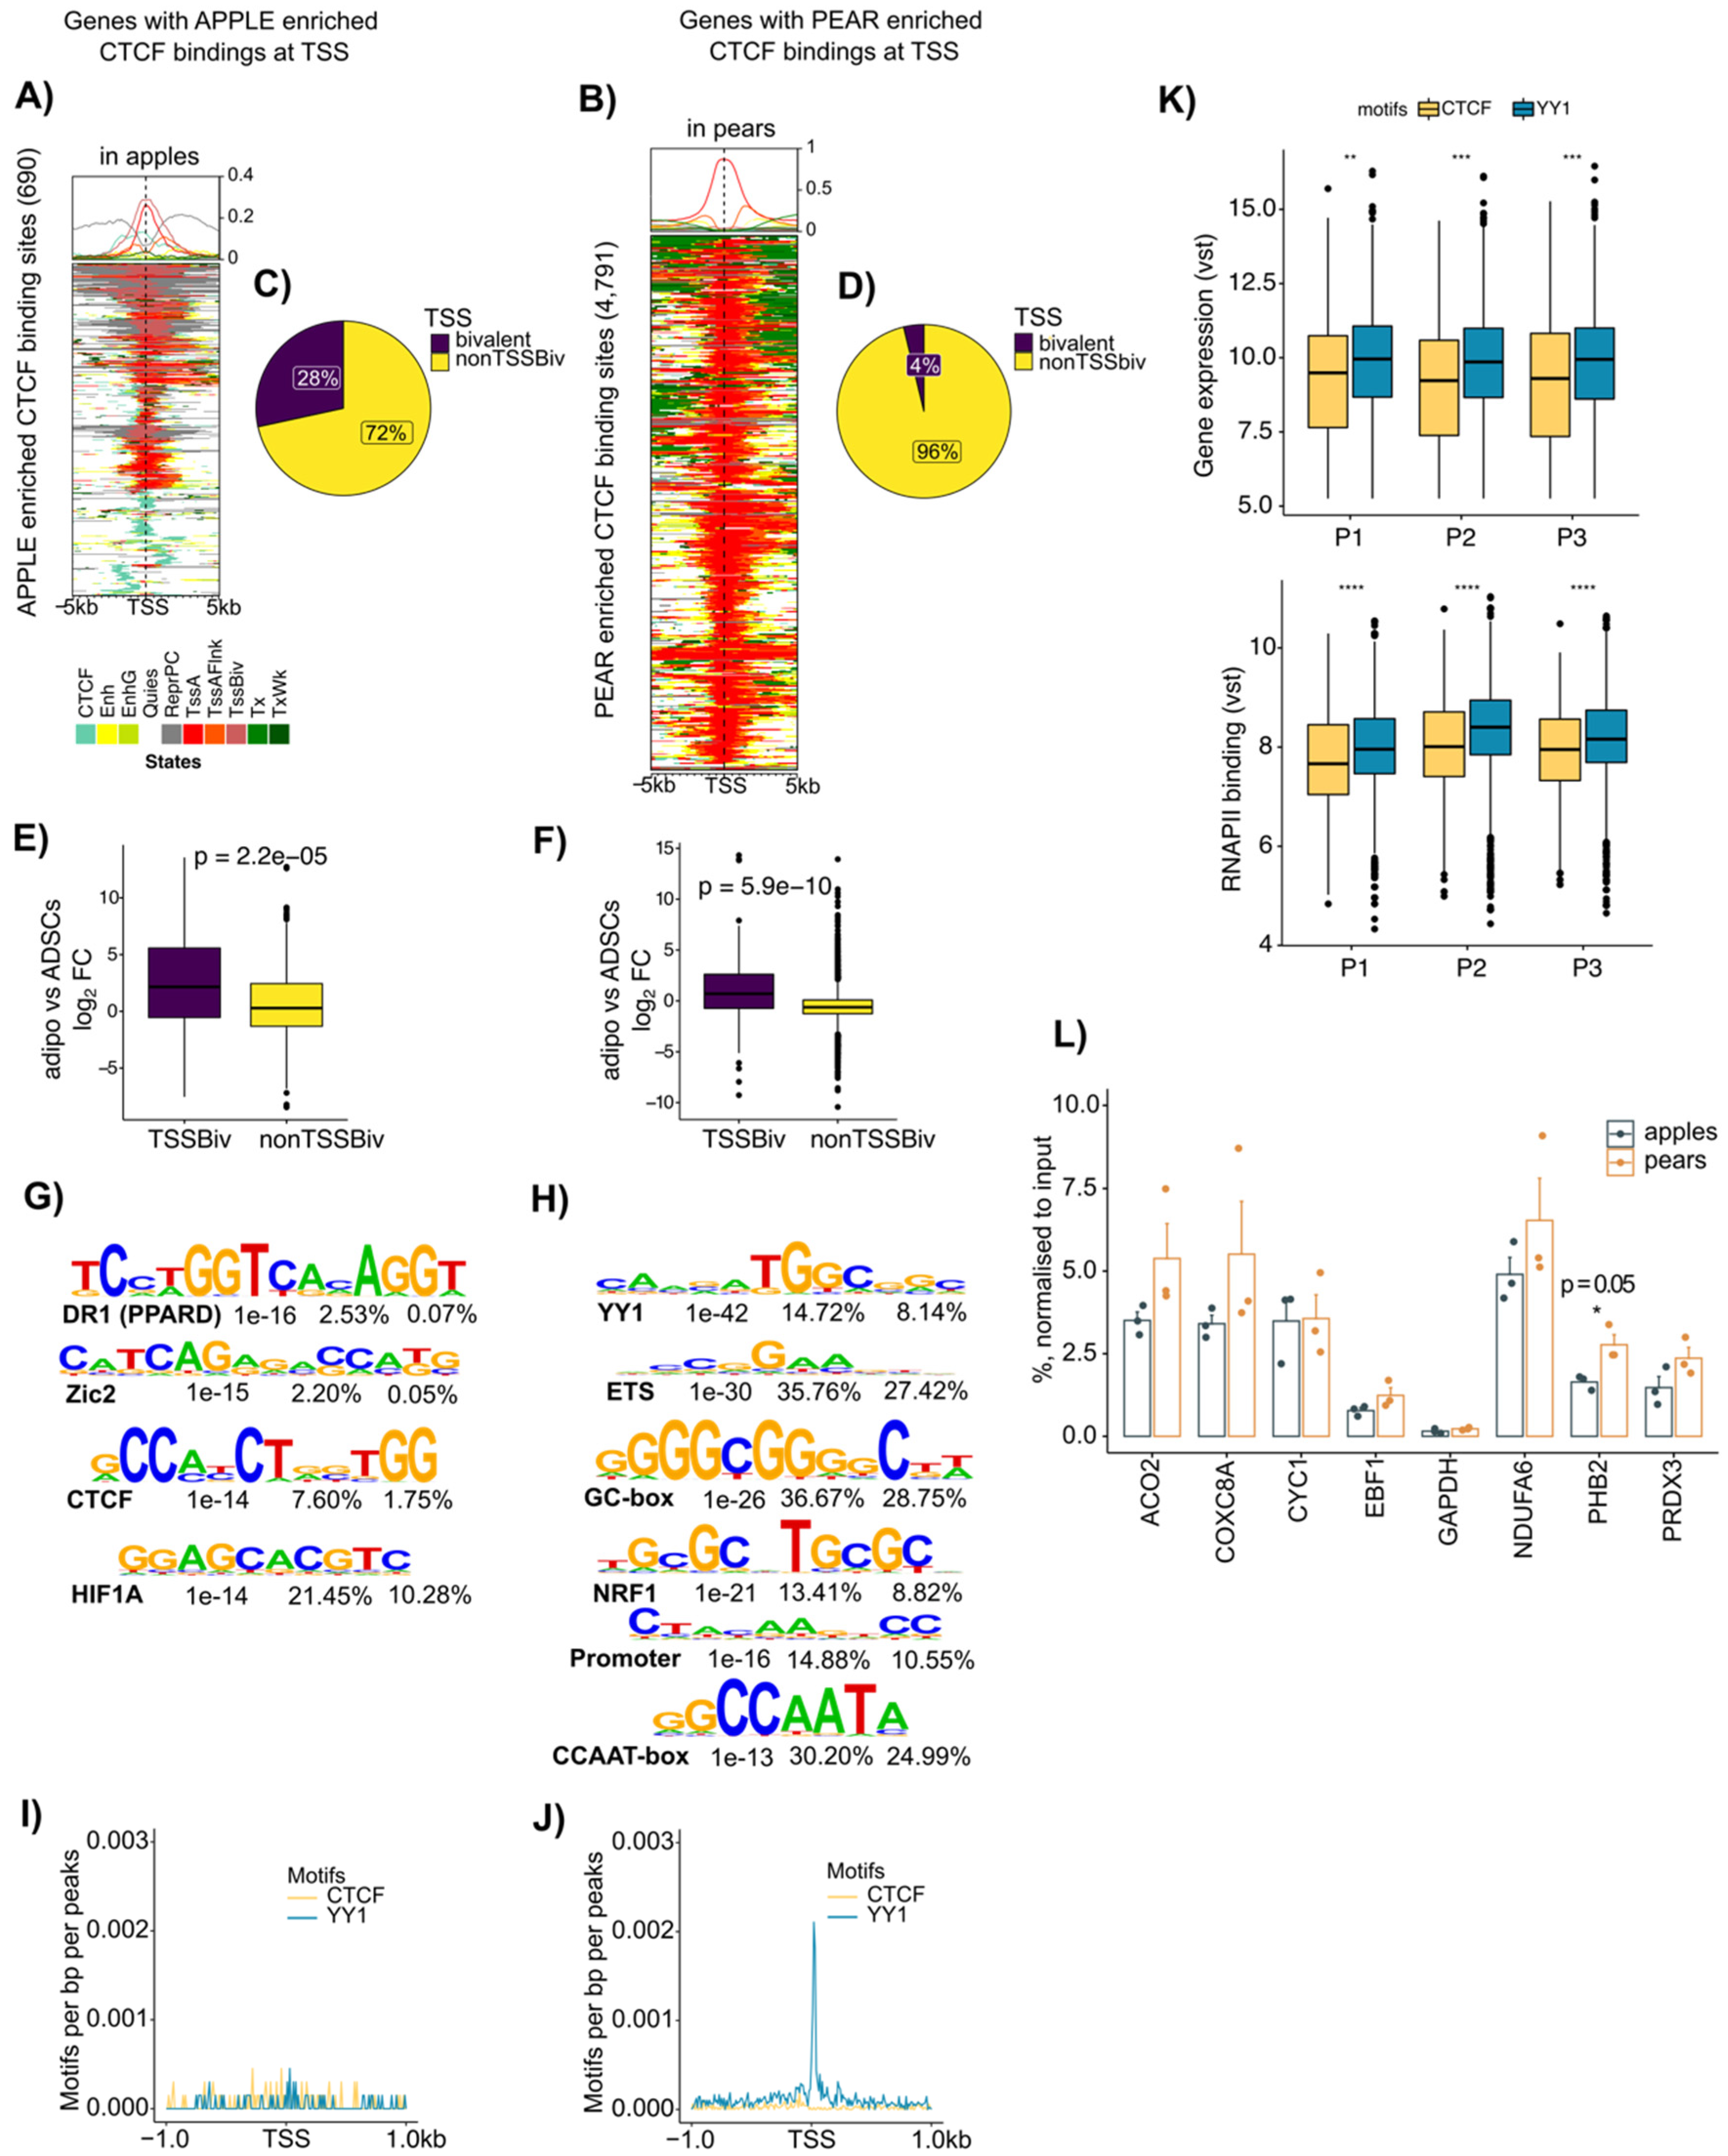
3.4. Enrichment of CTCF at Active Transcription Start Site Containing YY1 Motifs Selectively in Pear ADSCs
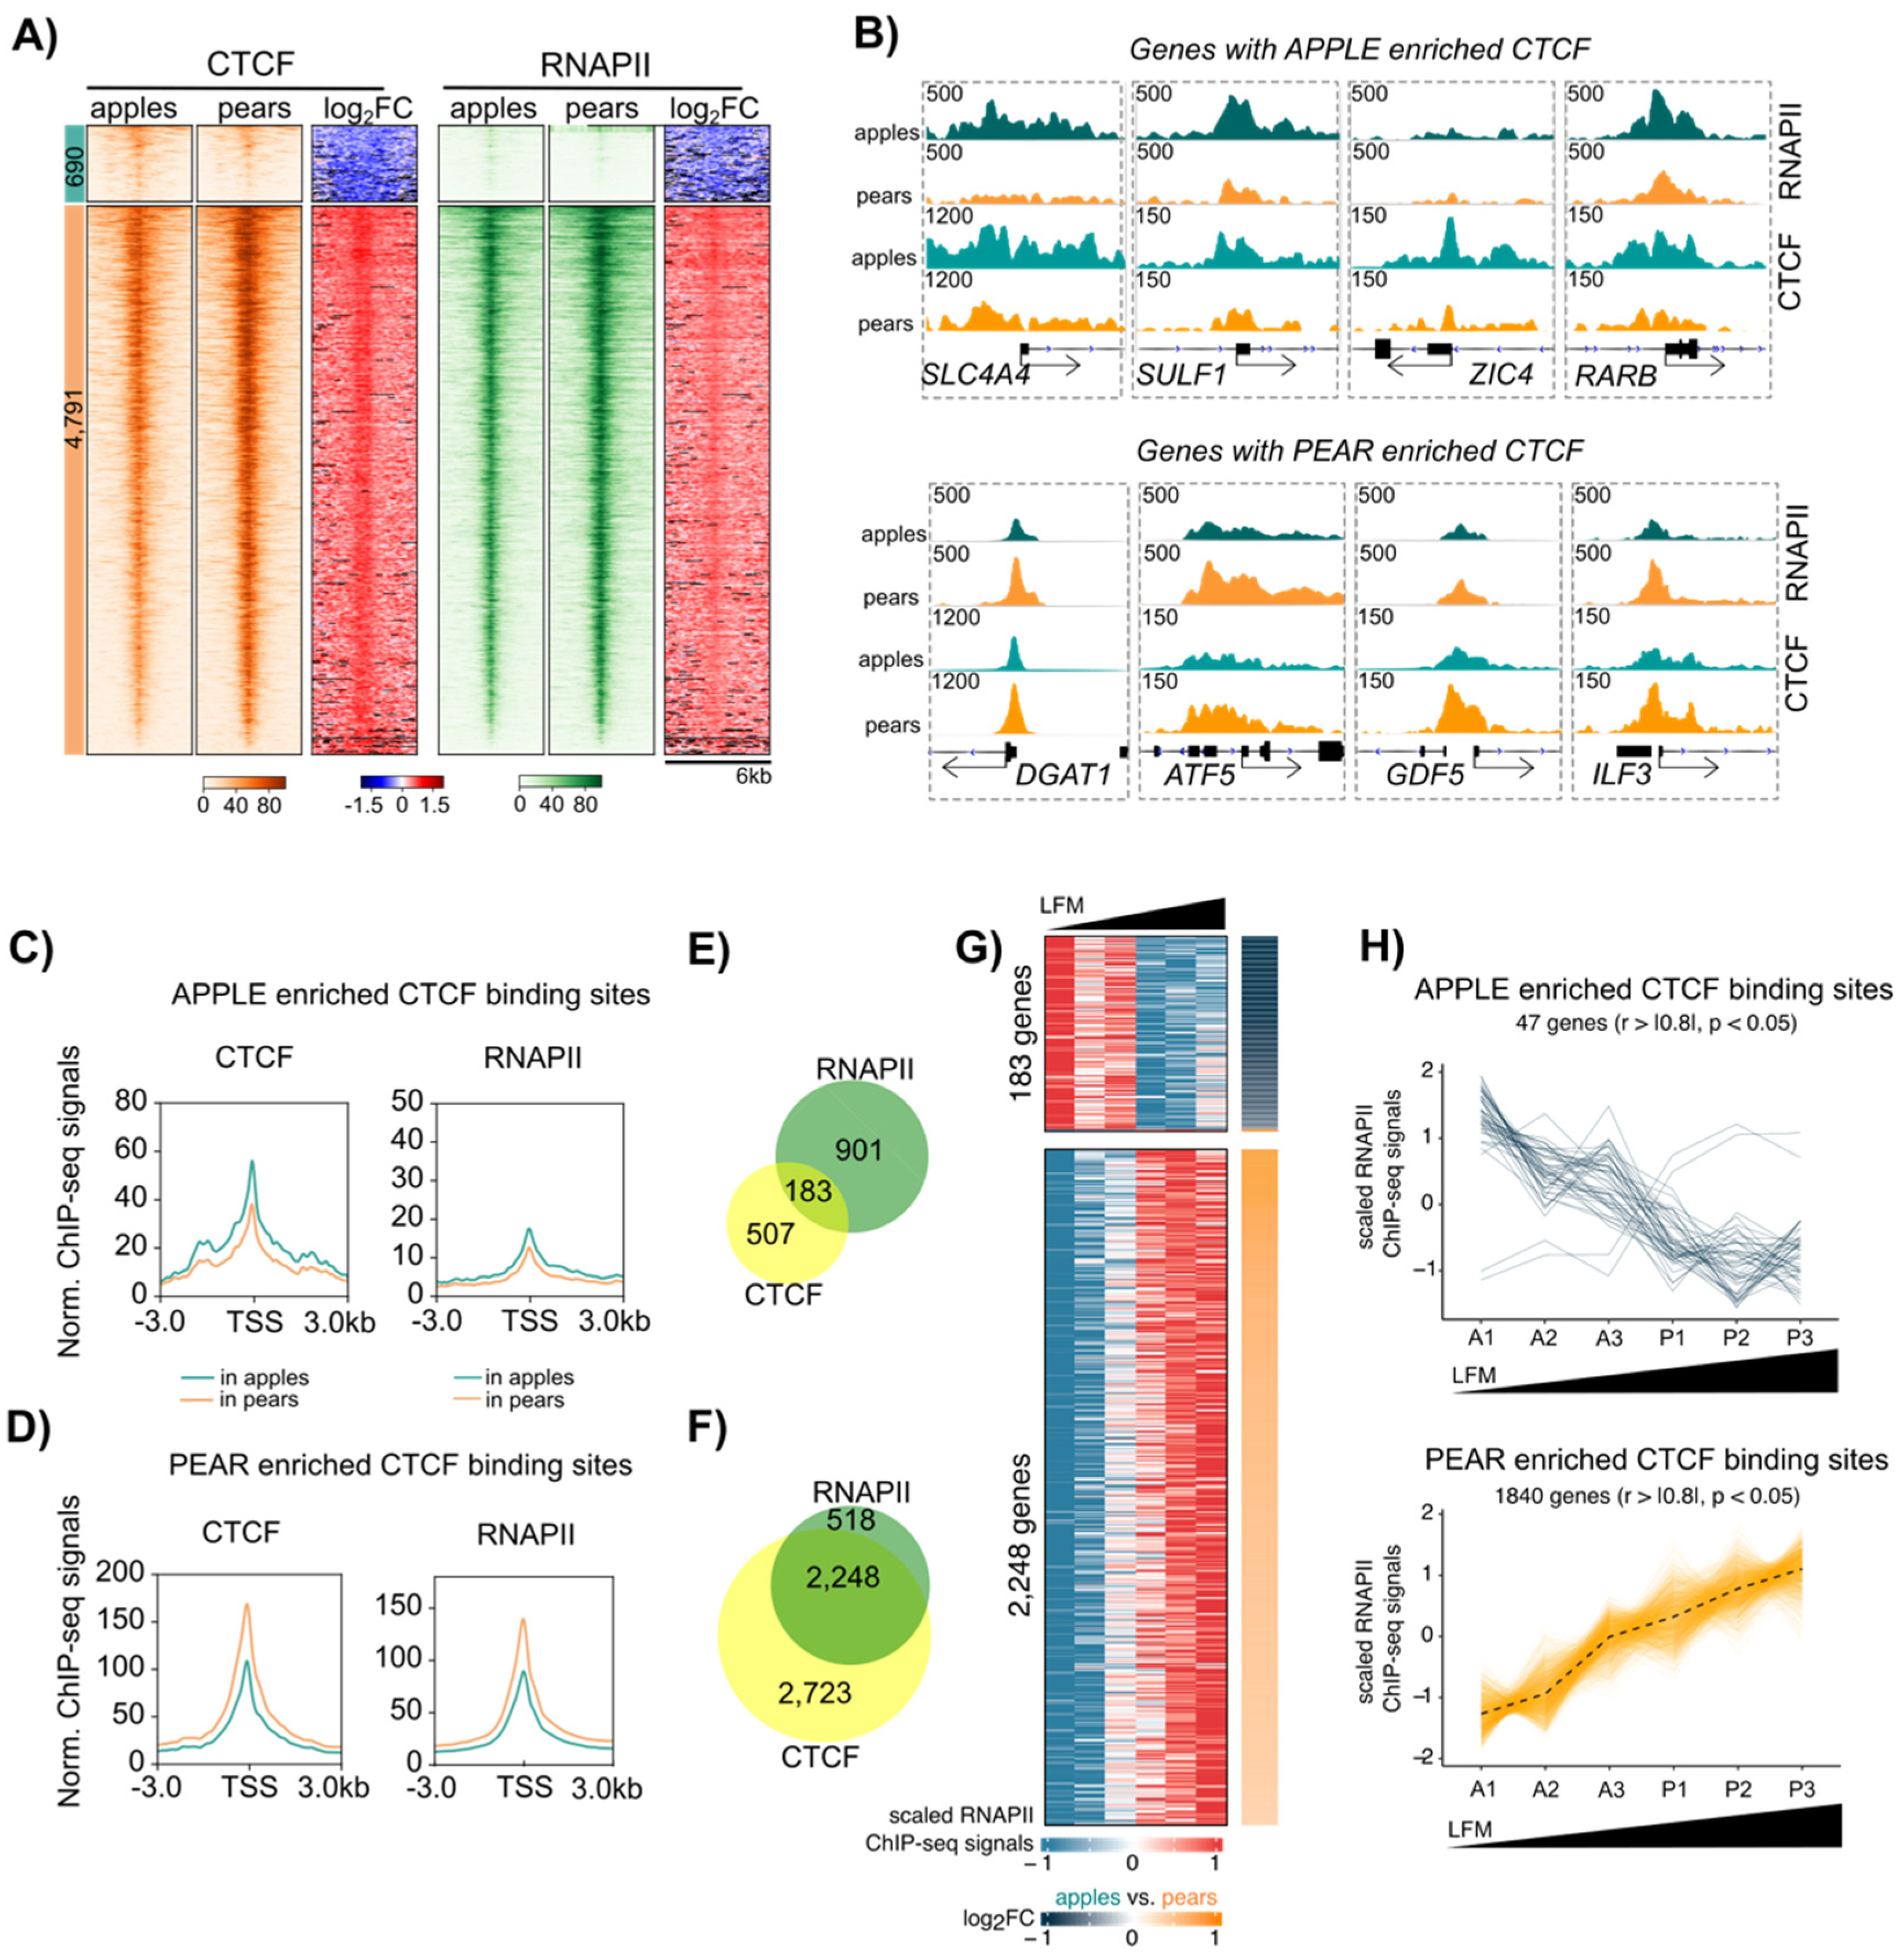
3.5. Coordinated CTCF and RNAPII Binding at TSS of Genes Correlates with Body Shape-Specific Gene Expression
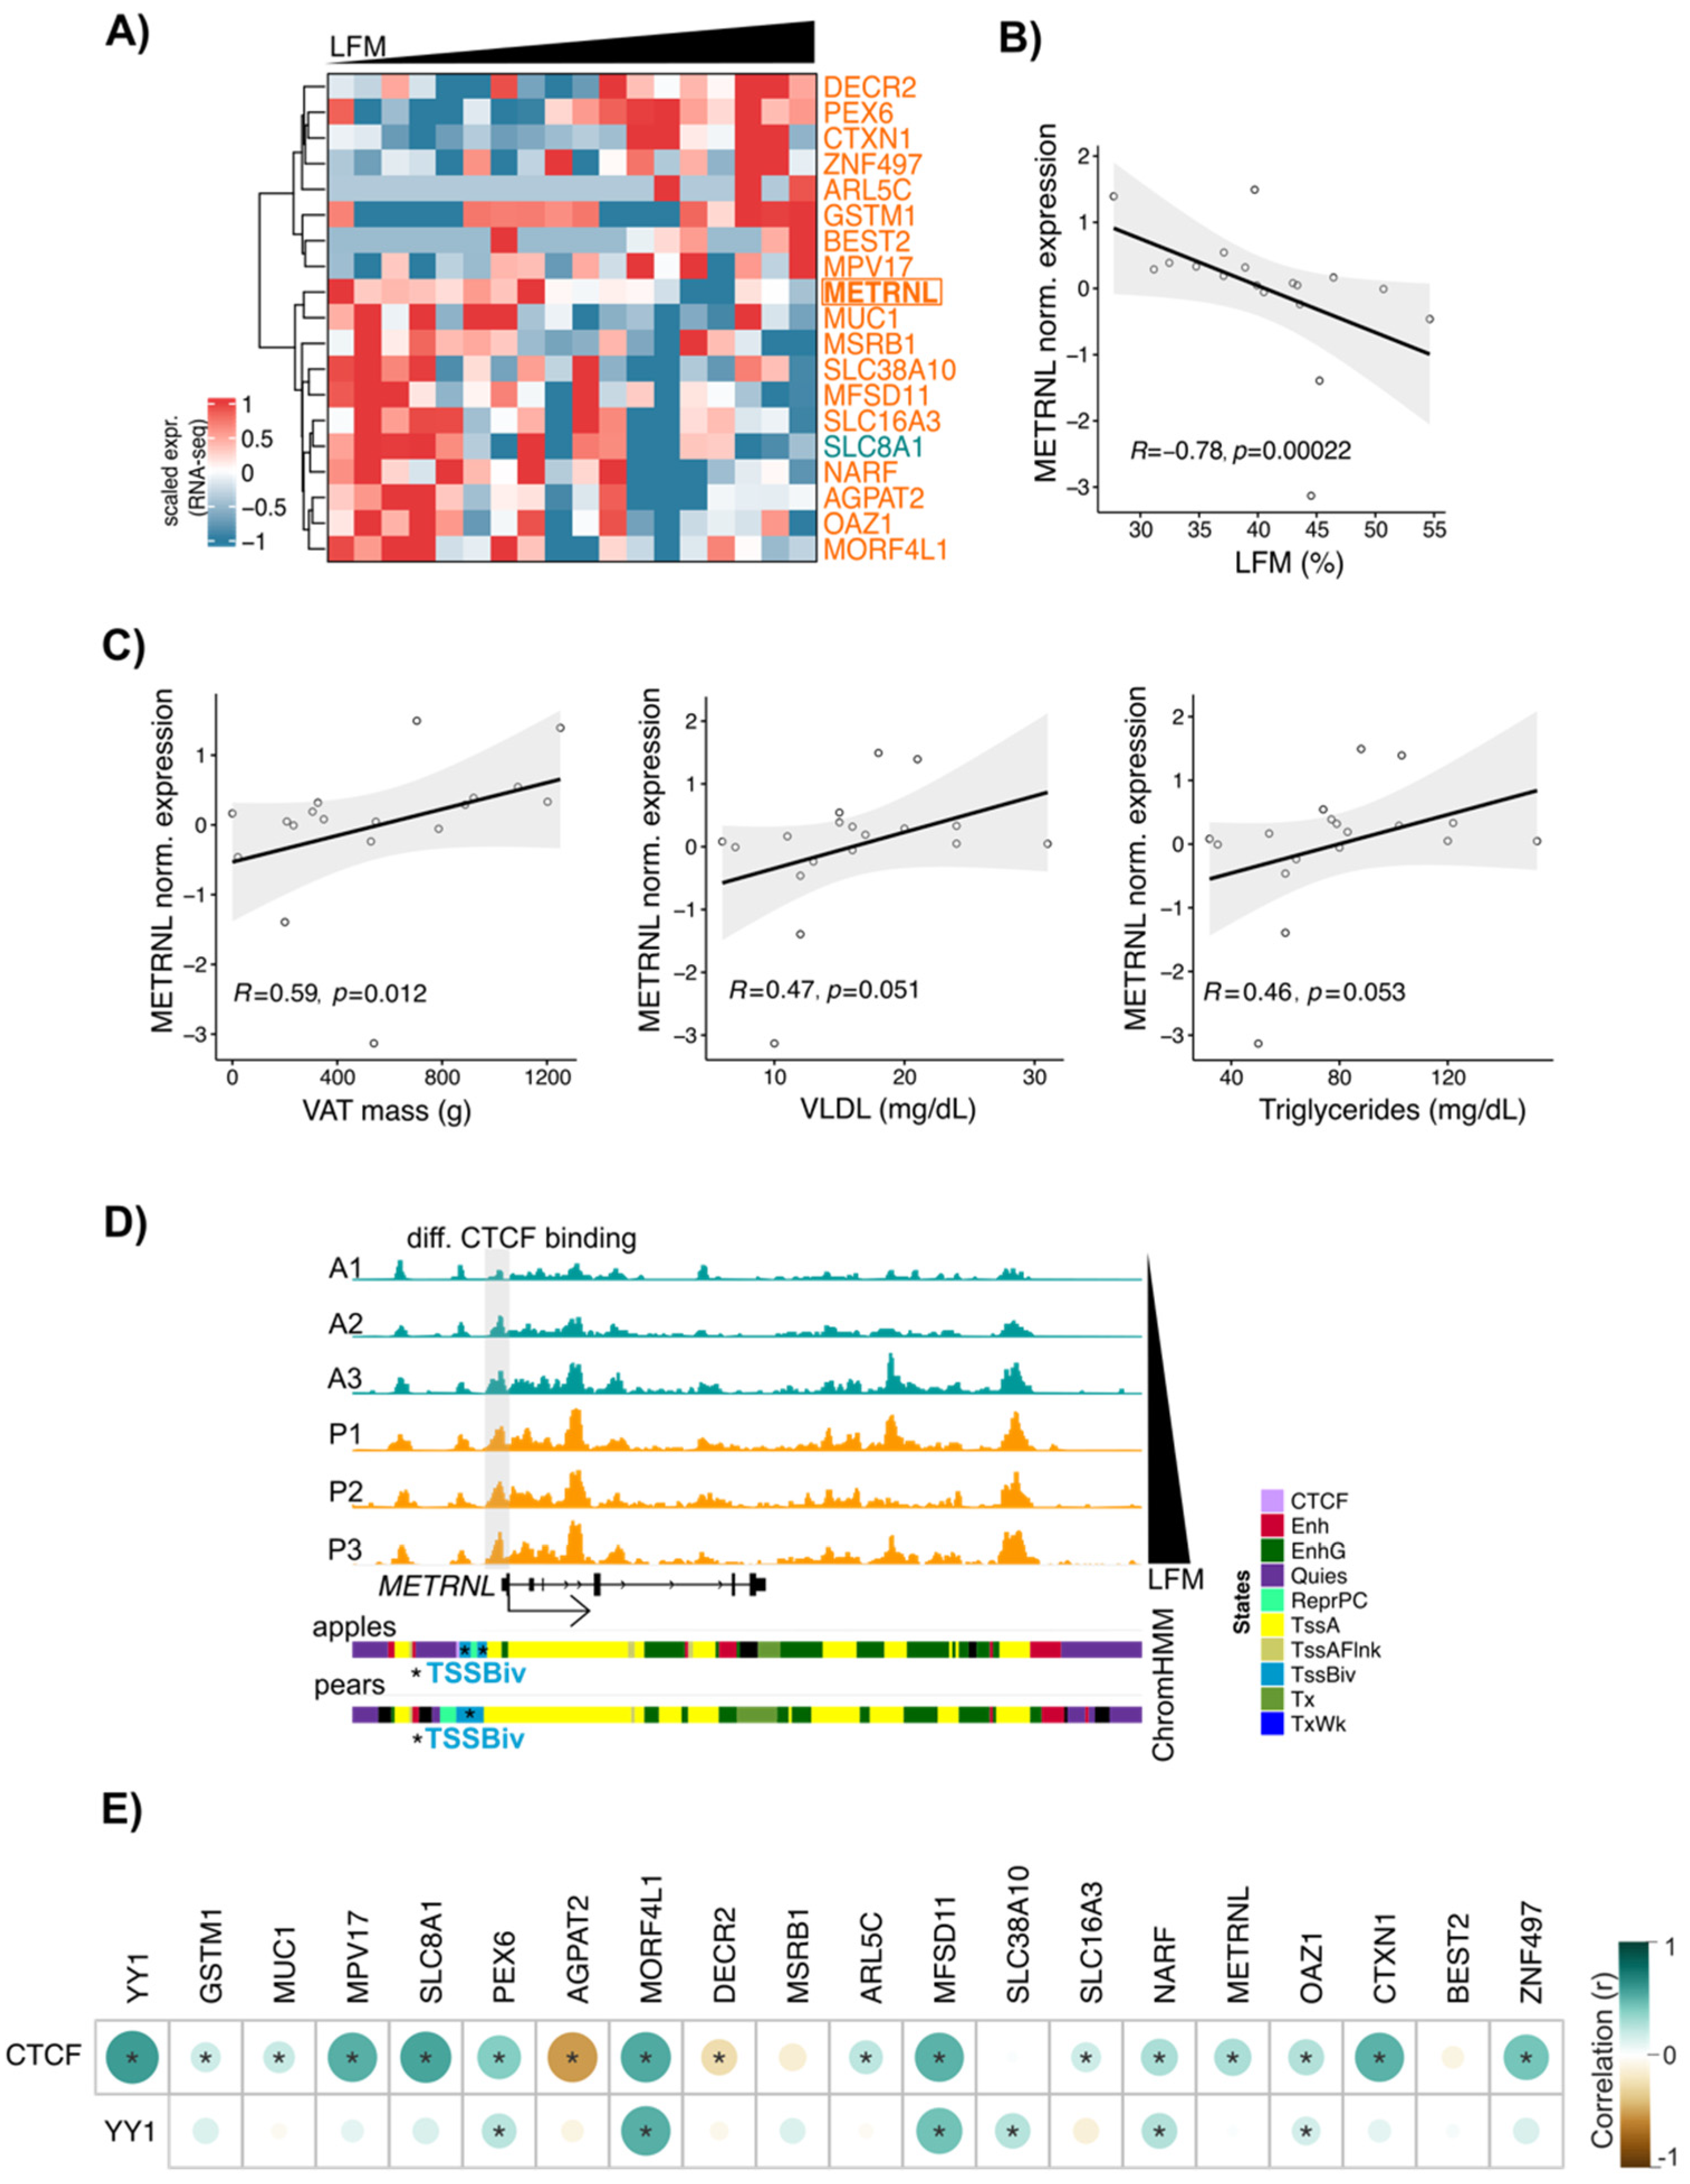
3.6. METRNL: A New CTCF Target Gene Associated with Differential Fat Distribution in Women
4. Discussion
5. Conclusions
Supplementary Materials
Author Contributions
Funding
Institutional Review Board Statement
Informed Consent Statement
Data Availability Statement
Acknowledgments
Conflicts of Interest
Abbreviations
References
- Canoy, D.; Boekholdt, S.M.; Wareham, N.; Luben, R.; Welch, A.; Bingham, S.; Buchan, I.; Day, N.; Khaw, K.T. Body fat distribution and risk of coronary heart disease in men and women in the European Prospective Investigation Into Cancer and Nutrition in Norfolk cohort: A population-based prospective study. Circulation 2007, 116, 2933–2943. [Google Scholar] [CrossRef] [PubMed]
- Yamazaki, H.; Tauchi, S.; Machann, J.; Haueise, T.; Yamamoto, Y.; Dohke, M.; Hanawa, N.; Kodama, Y.; Katanuma, A.; Stefan, N.; et al. Fat Distribution Patterns and Future Type 2 Diabetes. Diabetes 2022, 71, 1937–1945. [Google Scholar] [CrossRef] [PubMed]
- Mahmood, S.S.; Levy, D.; Vasan, R.S.; Wang, T.J. The Framingham Heart Study and the epidemiology of cardiovascular disease: A historical perspective. Lancet 2014, 383, 999–1008. [Google Scholar] [CrossRef] [PubMed]
- Rao, V.N.; Bush, C.G.; Mongraw-Chaffin, M.; Hall, M.E.; Clark, D., 3rd; Fudim, M.; Correa, A.; Hammill, B.G.; O’Brien, E.; Min, Y.I.; et al. Regional Adiposity and Risk of Heart Failure and Mortality: The Jackson Heart Study. J. Am. Heart Assoc. 2021, 10, e020920. [Google Scholar] [CrossRef] [PubMed]
- Yusuf, S.; Hawken, S.; Ounpuu, S.; Bautista, L.; Franzosi, M.G.; Commerford, P.; Lang, C.C.; Rumboldt, Z.; Onen, C.L.; Lisheng, L.; et al. Obesity and the risk of myocardial infarction in 27,000 participants from 52 countries: A case-control study. Lancet 2005, 366, 1640–1649. [Google Scholar] [CrossRef] [PubMed]
- Drogan, D.; Boeing, H.; Janke, J.; Schmitt, B.; Zhou, Y.; Walter, J.; Pischon, T.; Tierling, S. Regional distribution of body fat in relation to DNA methylation within the LPL, ADIPOQ and PPARγ promoters in subcutaneous adipose tissue. Nutr. Diabetes 2015, 5, e168. [Google Scholar] [CrossRef]
- Lumish, H.S.; O’Reilly, M.; Reilly, M.P. Sex Differences in Genomic Drivers of Adipose Distribution and Related Cardiometabolic Disorders: Opportunities for Precision Medicine. Arterioscler. Thromb. Vasc. Biol. 2020, 40, 45–60. [Google Scholar] [CrossRef]
- Wu, Y.; Tian, H.; Wang, W.; Li, W.; Duan, H.; Zhang, D. DNA methylation and waist-to-hip ratio: An epigenome-wide association study in Chinese monozygotic twins. J. Endocrinol. Investig. 2022, 45, 2365–2376. [Google Scholar] [CrossRef]
- Divoux, A.; Eroshkin, A.; Erdos, E.; Sandor, K.; Osborne, T.F.; Smith, S.R. DNA Methylation as a Marker of Body Shape in Premenopausal Women. Front. Genet. 2021, 12, 709342. [Google Scholar] [CrossRef]
- Pinnick, K.E.; Nicholson, G.; Manolopoulos, K.N.; McQuaid, S.E.; Valet, P.; Frayn, K.N.; Denton, N.; Min, J.L.; Zondervan, K.T.; Fleckner, J.; et al. Distinct developmental profile of lower-body adipose tissue defines resistance against obesity-associated metabolic complications. Diabetes 2014, 63, 3785–3797. [Google Scholar] [CrossRef]
- Divoux, A.; Sandor, K.; Bojcsuk, D.; Talukder, A.; Li, X.; Balint, B.L.; Osborne, T.F.; Smith, S.R. Differential open chromatin profile and transcriptomic signature define depot-specific human subcutaneous preadipocytes: Primary outcomes. Clin. Epigenetics 2018, 10, 148. [Google Scholar] [CrossRef] [PubMed]
- Cui, T.T.; Xing, T.Y.; Chu, Y.K.; Li, H.; Wang, N. Genetic and epigenetic regulation of PPARγ during adipogenesis. Yi Chuan Hered. 2017, 39, 1066–1077. [Google Scholar]
- Lee, J.E.; Schmidt, H.; Lai, B.; Ge, K. Transcriptional and Epigenomic Regulation of Adipogenesis. Mol. Cell. Biol. 2019, 39, e00601-18. [Google Scholar] [CrossRef] [PubMed]
- Kim, S.; Yu, N.K.; Kaang, B.K. CTCF as a multifunctional protein in genome regulation and gene expression. Exp. Mol. Med. 2015, 47, e166. [Google Scholar] [CrossRef] [PubMed]
- Ong, C.T.; Corces, V.G. CTCF: An architectural protein bridging genome topology and function. Nat. Rev. Genet. 2014, 15, 234–246. [Google Scholar] [CrossRef] [PubMed]
- Phillips, J.E.; Corces, V.G. CTCF: Master weaver of the genome. Cell 2009, 137, 1194–1211. [Google Scholar] [CrossRef] [PubMed]
- Chen, Y.; He, R.; Han, Z.; Wu, Y.; Wang, Q.; Zhu, X.; Huang, Z.; Ye, J.; Tang, Y.; Huang, H.; et al. Cooperation of ATF4 and CTCF promotes adipogenesis through transcriptional regulation. Cell Biol. Toxicol. 2022, 38, 741–763. [Google Scholar] [CrossRef]
- Dubois-Chevalier, J.; Oger, F.; Dehondt, H.; Firmin, F.F.; Gheeraert, C.; Staels, B.; Lefebvre, P.; Eeckhoute, J. A dynamic CTCF chromatin binding landscape promotes DNA hydroxymethylation and transcriptional induction of adipocyte differentiation. Nucleic Acids Res. 2014, 42, 10943–10959. [Google Scholar] [CrossRef]
- Divoux, A.; Sandor, K.; Bojcsuk, D.; Yi, F.; Hopf, M.E.; Smith, J.S.; Balint, B.L.; Osborne, T.F.; Smith, S.R. Fat Distribution in Women Is Associated with Depot-Specific Transcriptomic Signatures and Chromatin Structure. J. Endocr. Soc. 2020, 4, bvaa042. [Google Scholar] [CrossRef]
- Lee, M.J.; Wu, Y.; Fried, S.K. A modified protocol to maximize differentiation of human preadipocytes and improve metabolic phenotypes. Obesity 2012, 20, 2334–2340. [Google Scholar] [CrossRef]
- Zaragosi, L.E.; Wdziekonski, B.; Villageois, P.; Keophiphath, M.; Maumus, M.; Tchkonia, T.; Bourlier, V.; Mohsen-Kanson, T.; Ladoux, A.; Elabd, C.; et al. Activin a plays a critical role in proliferation and differentiation of human adipose progenitors. Diabetes 2010, 59, 2513–2521. [Google Scholar] [CrossRef] [PubMed]
- Barish, G.D.; Yu, R.T.; Karunasiri, M.; Ocampo, C.B.; Dixon, J.; Benner, C.; Dent, A.L.; Tangirala, R.K.; Evans, R.M. Bcl-6 and NF-kappaB cistromes mediate opposing regulation of the innate immune response. Genes Dev. 2010, 24, 2760–2765. [Google Scholar] [CrossRef] [PubMed]
- Erdos, E.; Divoux, A.; Sandor, K.; Halasz, L.; Smith, S.R.; Osborne, T.F. Unique role for lncRNA HOTAIR in defining depot-specific gene expression patterns in human adipose-derived stem cells. Genes Dev. 2022, 36, 566–581. [Google Scholar] [CrossRef] [PubMed]
- Ramírez, F.; Dündar, F.; Diehl, S.; Grüning, B.A.; Manke, T. deepTools: A flexible platform for exploring deep-sequencing data. Nucleic Acids Res. 2014, 42, W187–W191. [Google Scholar] [CrossRef] [PubMed]
- Blighe, K.; Rana, S.; Lewis, M. EnhancedVolcano: Publication-Ready Volcano Plots with Enhanced Colouring and Labeling; R Core Team: Vienna, Austria, 2018. [Google Scholar]
- Gu, Z.; Eils, R.; Schlesner, M. Complex heatmaps reveal patterns and correlations in multidimensional genomic data. Bioinformatics 2016, 32, 2847–2849. [Google Scholar] [CrossRef] [PubMed]
- Gu, Z.; Eils, R.; Schlesner, M.; Ishaque, N. EnrichedHeatmap: An R/Bioconductor package for comprehensive visualization of genomic signal associations. BMC Genom. 2018, 19, 234. [Google Scholar]
- Ehara, H.; Kujirai, T.; Shirouzu, M.; Kurumizaka, H.; Sekine, S.I. Structural basis of nucleosome disassembly and reassembly by RNAPII elongation complex with FACT. Science 2022, 377, eabp9466. [Google Scholar] [CrossRef]
- Bernstein, B.E.; Mikkelsen, T.S.; Xie, X.; Kamal, M.; Huebert, D.J.; Cuff, J.; Fry, B.; Meissner, A.; Wernig, M.; Plath, K.; et al. A bivalent chromatin structure marks key developmental genes in embryonic stem cells. Cell 2006, 125, 315–326. [Google Scholar]
- Liu, Q.Y.; Qin, Y. A versatile role of transcription regulator CTCF in epigenetics and diseases. Zhonghua Yi Xue Yi Chuan Xue Za Zhi = Zhonghua Yixue Yichuanxue Zazhi Chin. J. Med. Genet. 2012, 29, 176–180. [Google Scholar]
- Ghirlando, R.; Felsenfeld, G. CTCF: Making the right connections. Genes Dev. 2016, 30, 881–891. [Google Scholar] [CrossRef]
- Weth, O.; Renkawitz, R. CTCF function is modulated by neighboring DNA binding factors. Biochem. Cell Biol. Biochim. Et Biol. Cell. 2011, 89, 459–468. [Google Scholar] [CrossRef] [PubMed]
- Beagan, J.A.; Duong, M.T.; Titus, K.R.; Zhou, L.; Cao, Z.; Ma, J.; Lachanski, C.V.; Gillis, D.R.; Phillips-Cremins, J.E. YY1 and CTCF orchestrate a 3D chromatin looping switch during early neural lineage commitment. Genome Res. 2017, 27, 1139–1152. [Google Scholar] [CrossRef] [PubMed]
- Taft, R.J.; Hawkins, P.G.; Mattick, J.S.; Morris, K.V. The relationship between transcription initiation RNAs and CCCTC-binding factor (CTCF) localization. Epigenetics Chromatin 2011, 4, 13. [Google Scholar] [CrossRef] [PubMed]
- Cordero, A.D.; Callihan, E.C.; Said, R.; Alowais, Y.; Paffhausen, E.S.; Bracht, J.R. Epigenetic Regulation of Neuregulin-1 Tunes White Adipose Stem Cell Differentiation. Cells 2020, 9, 1148. [Google Scholar] [CrossRef] [PubMed]
- Liu, C.; Zhang, Y.; Wang, Y.; Wang, N.; Xu, J.; Liang, X.; Xiong, J.; Lu, S.; Zhou, P.; Liu, J.; et al. Betaine-homocysteine methyltransferase promotes adipocyte commitment and insulin resistance via p38 MAPK/Smad signaling. Obesity 2023, 31, 1569–1583. [Google Scholar] [CrossRef] [PubMed]
- Zheng, S.L.; Li, Z.Y.; Song, J.; Liu, J.M.; Miao, C.Y. Metrnl: A secreted protein with new emerging functions. Acta Pharmacol. Sin. 2016, 37, 571–579. [Google Scholar] [CrossRef] [PubMed]
- Li, Z.Y.; Song, J.; Zheng, S.L.; Fan, M.B.; Guan, Y.F.; Qu, Y.; Xu, J.; Wang, P.; Miao, C.Y. Adipocyte Metrnl Antagonizes Insulin Resistance through PPARγ Signaling. Diabetes 2015, 64, 4011–4022. [Google Scholar] [CrossRef]
- Donohoe, M.E.; Zhang, L.F.; Xu, N.; Shi, Y.; Lee, J.T. Identification of a Ctcf cofactor, Yy1, for the X chromosome binary switch. Mol. Cell 2007, 25, 43–56. [Google Scholar] [CrossRef]
- Fiorito, E.; Sharma, Y.; Gilfillan, S.; Wang, S.; Singh, S.K.; Satheesh, S.V.; Katika, M.R.; Urbanucci, A.; Thiede, B.; Mills, I.G.; et al. CTCF modulates Estrogen Receptor function through specific chromatin and nuclear matrix interactions. Nucleic Acids Res. 2016, 44, 10588–10602. [Google Scholar] [CrossRef]
- Huang, H.Y.; Li, X.; Liu, M.; Song, T.J.; He, Q.; Ma, C.G.; Tang, Q.Q. Transcription factor YY1 promotes adipogenesis via inhibiting CHOP-10 expression. Biochem. Biophys. Res. Commun. 2008, 375, 496–500. [Google Scholar] [CrossRef]
- Jiang, W.Y.; Xing, C.; Wang, H.W.; Wang, W.; Chen, S.Z.; Ning, L.F.; Xu, X.; Tang, Q.Q.; Huang, H.Y. A Lox/CHOP-10 crosstalk governs osteogenic and adipogenic cell fate by MSCs. J. Cell. Mol. Med. 2018, 22, 5097–5108. [Google Scholar] [CrossRef] [PubMed]
- Li, F.; Wan, M.; Zhang, B.; Peng, Y.; Zhou, Y.; Pi, C.; Xu, X.; Ye, L.; Zhou, X.; Zheng, L. Bivalent Histone Modifications and Development. Curr. Stem Cell Res. Ther. 2018, 13, 83–90. [Google Scholar] [CrossRef] [PubMed]
- Li, Z.Y.; Zheng, S.L.; Wang, P.; Xu, T.Y.; Guan, Y.F.; Zhang, Y.J.; Miao, C.Y. Subfatin is a novel adipokine and unlike Meteorin in adipose and brain expression. CNS Neurosci. Ther. 2014, 20, 344–354. [Google Scholar] [CrossRef] [PubMed]
- Schmid, A.; Karrasch, T.; Schäffler, A. Meteorin-Like Protein (Metrnl) in Obesity, during Weight Loss and in Adipocyte Differentiation. J. Clin. Med. 2021, 10, 4338. [Google Scholar] [CrossRef]
- Löffler, D.; Landgraf, K.; Rockstroh, D.; Schwartze, J.T.; Dunzendorfer, H.; Kiess, W.; Körner, A. METRNL decreases during adipogenesis and inhibits adipocyte differentiation leading to adipocyte hypertrophy in humans. Int. J. Obes. 2017, 41, 112–119. [Google Scholar] [CrossRef]


Disclaimer/Publisher’s Note: The statements, opinions and data contained in all publications are solely those of the individual author(s) and contributor(s) and not of MDPI and/or the editor(s). MDPI and/or the editor(s) disclaim responsibility for any injury to people or property resulting from any ideas, methods, instructions or products referred to in the content. |
© 2023 by the authors. Licensee MDPI, Basel, Switzerland. This article is an open access article distributed under the terms and conditions of the Creative Commons Attribution (CC BY) license (https://creativecommons.org/licenses/by/4.0/).
Share and Cite
Erdos, E.; Sandor, K.; Young-Erdos, C.L.; Halasz, L.; Smith, S.R.; Osborne, T.F.; Divoux, A. Transcriptional Control of Subcutaneous Adipose Tissue by the Transcription Factor CTCF Modulates Heterogeneity in Fat Distribution in Women. Cells 2024, 13, 86. https://doi.org/10.3390/cells13010086
Erdos E, Sandor K, Young-Erdos CL, Halasz L, Smith SR, Osborne TF, Divoux A. Transcriptional Control of Subcutaneous Adipose Tissue by the Transcription Factor CTCF Modulates Heterogeneity in Fat Distribution in Women. Cells. 2024; 13(1):86. https://doi.org/10.3390/cells13010086
Chicago/Turabian StyleErdos, Edina, Katalin Sandor, Crystal L. Young-Erdos, Laszlo Halasz, Steven R. Smith, Timothy F. Osborne, and Adeline Divoux. 2024. "Transcriptional Control of Subcutaneous Adipose Tissue by the Transcription Factor CTCF Modulates Heterogeneity in Fat Distribution in Women" Cells 13, no. 1: 86. https://doi.org/10.3390/cells13010086