Article

Regulation Networks of Non-Coding RNA-Associated ceRNAs in Cisplatin-Induced Acute Kidney Injury

1
Henan Provincial Key Laboratory of Kidney Disease and Immunology, Henan Provincial Clinical Research Center for Kidney Disease, Department of Nephrology, Henan Provincial People’s Hospital, People’s Hospital of Zhengzhou University, Zhengzhou 450003, China
2
Academy of Medical Sciences, Zhengzhou University, Zhengzhou 450052, China
*
Authors to whom correspondence should be addressed.
Cells 2022, 11(19), 2971; https://doi.org/10.3390/cells11192971
Submission received: 6 July 2022 / Revised: 8 September 2022 / Accepted: 16 September 2022 / Published: 23 September 2022

Abstract

:
Cisplatin is widely used as a chemotherapeutic drug to treat various solid tumors. However, it often induces severe side effects, including nephrotoxicity, which limits its application in clinical settings. Furthermore, the underlying mechanisms of action are unclear. Here, we applied whole-transcriptome RNA sequencing to a cisplatin-induced acute kidney injury (CP-AKI) mouse model to evaluate competing endogenous RNA (ceRNA) networks. We found 4460 mRNAs, 1851 long non-coding RNAs, 101 circular RNAs, and 102 microRNAs significantly differentially expressed between CP-AKI and control mice. We performed gene set enrichment analysis to reveal the biological functions of the mRNAs and constructed non-coding RNA-associated ceRNA networks in CP-AKI mice. Two ceRNA regulatory pathways, Lhx1os-203/mmu-miR-21a-3p/Slc7a13 and circular RNA_3907/mmu-miR-185-3p/Ptprn, were validated using quantitative real-time PCR. The protein–protein interaction network indicated that Il6, Cxcl1, Cxcl2, and Plk1 serve as hub genes and are highly connected with the inflammatory response or DNA damage. Transcription factors, such as Stat3, Cebpb, and Foxm1, regulate gene expression levels in CP-AKI. Our study provides insight into non-coding RNA-associated ceRNA networks and mRNAs in CP-AKI and identifies potential treatment targets.

1. Introduction

Acute kidney injury (AKI) is characterized by increased serum creatinine (sCr) levels and decreased urine output and kidney function [1,2]. Cisplatin-induced AKI (CP-AKI) is a complication of cisplatin application and increases the susceptibility to chronic kidney disease [3]. This condition imposes a heavy burden on the medical system because of its high morbidity, mortality, and treatment costs [4,5]. Furthermore, CP-AKI is accompanied by short- and long-term adverse survival outcomes, and no effective therapies are available for prevention or treatment [6,7,8]. Therefore, studies are needed to clarify the mechanism underlying CP-AKI development and search for new targets for intervention.
Non-coding RNAs (ncRNAs) play vital roles in gene regulatory networks and various pathophysiological processes [9,10,11]. ncRNAs exist as long ncRNAs (lncRNAs), circular RNAs (circRNAs) with closed-loop structures, and small RNAs, such as microRNAs (miRNAs) [12,13]. Previous studies suggested a relationship between CP-AKI and ncRNAs [14,15]. LncRNAs and circRNAs act as miRNA sponges and form competing endogenous RNA (ceRNA) networks. LncRNAs are also involved in chromatin modification, cellular organization, cell death, renal inflammation, and renal fibrosis in AKI and other kidney diseases [16,17]. Over the past two decades, studies have reported that circRNAs regulate sepsis-associated AKI and play vital roles in AKI development and structural kidney damage [18,19]. Differentially expressed miRNAs participate in gene regulatory networks and various pathophysiological processes and affect patients with AKI [20,21,22,23].
However, the pathogenic mechanisms underlying the involvement of ncRNA-associated ceRNA networks in CP-AKI remain unclear and have not been widely examined. Effective solutions are urgently required to prevent or slow CP-AKI development. In this study, we evaluated ncRNA-associated ceRNA mechanisms in a CP-AKI mouse model using whole-transcriptome RNA sequencing (RNA-seq). Our results improve the understanding of the molecular pathophysiology of CP-AKI and suggest potential targets for its diagnosis and therapy.

2. Materials and Methods

2.1. CP-AKI Mouse Model

The schematic representation shown in Figure 1A was generated using templates from BioRender (https://biorender.com/ (accessed on 6 July 2022)). Male C57BL/6 mice (eight weeks old) weighing approximately 25 g were purchased from GemPharmatech Co., Ltd. (Nanjing, China). Ten mice were randomly divided into either the CP-AKI or the control groups (n = 5 each) and intraperitoneally injected with either cisplatin (20 mg/kg; MedChemExpress LLC., Monmouth Junction, NJ, USA) or normal saline (NS; 20 mL/kg, control group), respectively. The blood and kidneys were harvested 72 h later. Four mice were randomly chosen from each group for RNA-seq analysis.

2.2. Blood Biomarker Assay

The serum was separated by centrifugation at 3000× g for 10 min at 4 °C. The sCr and blood urea nitrogen (BUN) levels in the CP-AKI and control groups were measured by using creatinine (sarcosine oxidase) and urea assay kits (Nanjing Jiancheng Bioengineering Institute, Nanjing, China).

2.3. Hematoxylin and Eosin (H&E) Staining

Kidney tissues were fixed in 4% paraformaldehyde and preserved at 25–30 °C. Formalin-fixed paraffin-embedded tissues were sectioned at 4 μm thickness and treated as follows: dewaxing, staining with an H&E solution and ethanol, and subsequent dehydration. The severity of the kidney injury in the mice was scored based on the detachment of tubular cells and the number of renal tubular epithelial casts [14,24].

2.4. Transmission Electron Microscopy (TEM) Examination

Tissue blocks were prepared for TEM analysis. After fixation and dehydration at 25–30 °C, we performed resin penetration and embedding, polymerization, ultrathin sectioning, and staining. The subcellular structures of tubular epithelial cells were detected using a transmission electron microscope (HT7800/HT7700; Hitachi, Tokyo, Japan).

2.5. Terminal Deoxynucleotidyl Transferase dUTP Nick-End Labeling (TUNEL) Assay

Apoptosis was estimated using a TUNEL assay kit (HRP-DAB; Elabscience, Wuhan, China) on formalin-fixed paraffin-embedded tissue sections according to the manufacturer’s instructions. The proportion of TUNEL-positive cells was calculated as the number of dead cells in four different visual fields in each section.

2.6. RNA-Seq Analysis

Total RNA from each kidney tissue sample was extracted using a mirVana miRNA Isolation kit (Ambion, Austin, TX, USA). A NanoDrop (Thermo Fisher Scientific, Waltham, MA, USA) and 2100 Bioanalyzer (Agilent Technologies, Santa Clara, CA, USA) were used to measure the concentration and integrity of the isolated RNA samples, respectively. Samples with an RNA integrity number ≥ 7 were further analyzed. After removing the ribosomal RNA and other RNA fragments, double-stranded cDNA was synthesized and amplified. Sequencing libraries were constructed using TruSeq stranded total RNA with Ribo-Zero Gold (Illumina, San Diego, CA, USA). The libraries were sequenced on a HiSeqTM2500 (OEbiotech, Shanghai, China).

2.7. Gene Expression Analysis

The raw reads required quality-filtering, and the Trimmomatic software (version 0.36) [25] was used to remove adapters, low-quality bases, and N-bases or low-quality reads. High-quality clean reads were further analyzed. The fragments per kilobase of exons per million fragments mapped (FPKM) value and counts were obtained after sequencing read alignments of each sample with the sequence of the mRNA transcript and lncRNA using bowtie2 (version 2.2.9) [26]. The gene levels were quantified using eXpress (version 1.5.1) [27]. CircRNAs were quantified as reads per million (RPM). Small RNA sequencing and analysis were performed, and the miRNA expression levels were calculated as transcripts per million (TPM). The results were substantiated using principal component analysis (PCA), and sample-to-sample correlations were presented in a correlation heatmap. Volcano plots were generated using the “ggplot2” R package.

2.8. Gene Set Enrichment Analysis (GSEA)

Gene Ontology (GO) enrichment for biological processes and Kyoto Encyclopedia of Genes and Genomes (KEGG) pathway analysis were performed using GSEA with the clusterProfiler package [28]. A p-value less than 0.05 was used to determine significant enrichment.

2.9. Differential Gene Expression Analysis

The differentially expressed gene (DEG) algorithm in DESeq (version 1.18.0) [29] was used to calculate the p-value for experiments with biological replicates.

2.10. ceRNA Network Analysis

mRNAs and ncRNAs with significantly different expression levels were analyzed in the CP-AKI and control groups. The Bowtie software (version 1.1.1) [30] was used to perform mismatch-free matching by comparing the filtered reads with the miRNA mature body sequence in miRbase [31]. A matching sequence was considered a known miRNA. We utilized the Miranda software (version 3.3a) [32] to distinguish the predictive target genes of dysregulated miRNAs. The results of the interaction analysis between lncRNAs or circRNAs associated with the ceRNA networks were mapped using the Cytoscape software (version 3.9.0) [33].

2.11. Protein–Protein Interaction (PPI) Network Analysis and Hub Gene Identification

The Search Tool for the Retrieval of Interacting Genes (https://string-db.org/ (accessed on 10 June 2022)), a database of known and predicted PPIs, was used to construct a PPI network for the DEGs. The PPI network was generated and optimized using the Cytoscape software (version 3.9.0). CytoHubba (version 0.1), a Cytoscape plug-in, was used to identify hub genes based on the highest intramodular connectivity and a minimum correlation of 0.9 for the DEGs with a cut-off of 20 hub genes. Hub genes were visualized using Cytoscape (version 3.9.0).

2.12. Transcription Factor (TF) Analysis

The TF activity was estimated using the Discriminant Regulon Expression Analysis (DoRothEA) package [34] based on the average gene expression of each group. The mouse TF–target interaction regulons database “dorothea_mm” was used, and regulons with lower confidence scores were filtered out using the confidence scores. The final TF activities were calculated using the “run_viper” function of DoRothEA, and the results were visualized using the pheatmap package [35].

2.13. RT-qPCR Validation

Total RNA used for RT-qPCR was extracted from mouse kidneys using an RNAeasy™ Animal RNA Isolation Kit (Beyotime, Shanghai, China). A ReverTra Ace® qPCR RT Kit (TOYOBO, Shanghai, China) was used for reverse transcription with 700 ng of purified RNA. RT-qPCR was performed using 2× RealStar Green Fast Mixture (GeneStar, Beijing, China). The 2−ΔΔCt method [36] was used to evaluate the relative expression levels. The primer sequences are listed in the Supplementary Materials.

2.14. Statistical Analysis

Student’s t-test was used for data analysis to compare transcript-level differential expression. The data are presented as the mean ± standard error of the mean. p < 0.05 was defined as showing significant differences.

3. Results

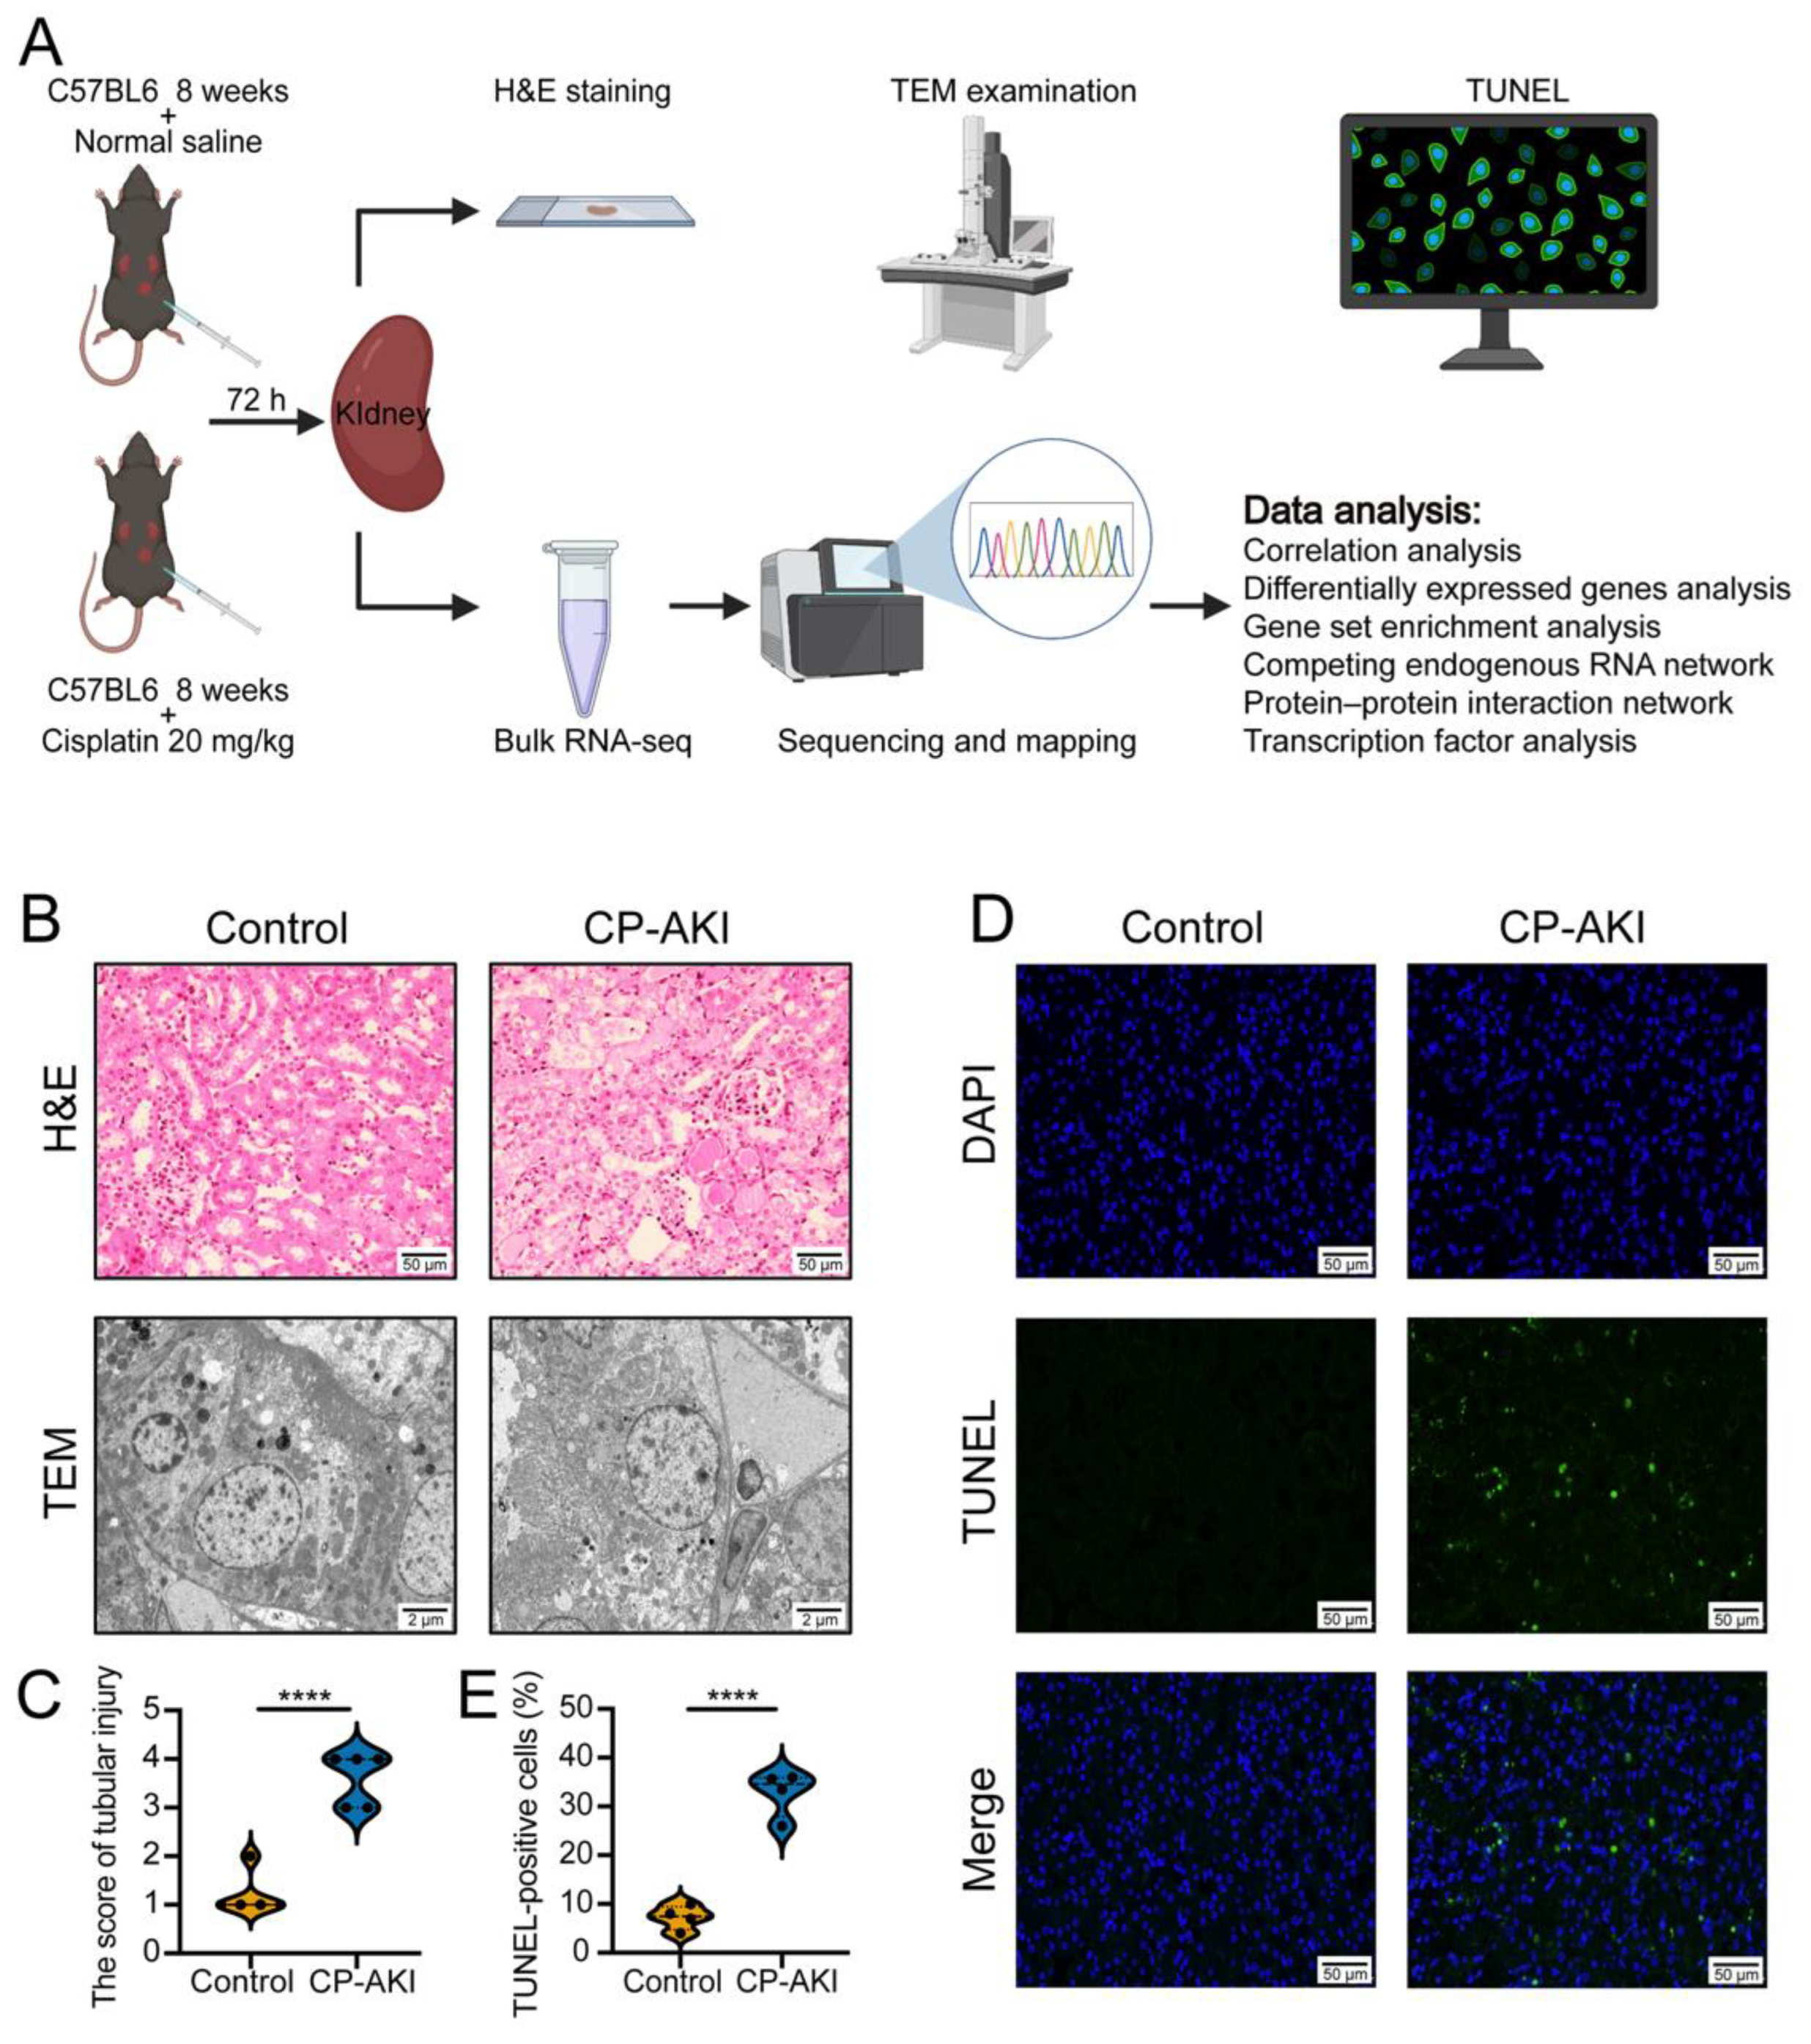
3.1. Evaluation of the CP-AKI Mouse Model

To determine the molecular mechanisms underlying CP-AKI, we constructed a mouse model using C57BL/6 mice and assessed their response to cisplatin (Figure 1A). As markers of kidney function, the sCr and BUN levels were measured in C57BL/6 mice at 72 h after a single dose of intraperitoneal injection of cisplatin (20 mg/kg) or NS (20 mL/kg). The sCr and BUN levels increased considerably after the cisplatin injection (p < 0.05) (Figures S1 and S2). Figure 1B shows the histopathological changes in the mouse kidneys between the two groups. H&E staining showed that the renal tubular epithelial cells in the CP-AKI mice were severely injured (histologic score: 1.2 ± 0.45) compared to those in the control mice (histologic score: 3.6 ± 0.55) (Figure 1C). TEM analysis revealed the presence of renal tubular epithelial cells with mild edema in the control mice. The cell membrane was intact, but the mitochondria were slightly swollen. These mild morphological changes were caused by technical factors during the processing of the blocks or ultrathin sections; nevertheless, the differences were very obvious when comparing with the experimental group. In the CP-AKI group, the degree of renal tubular epithelial cell edema was severe, with an accumulation of autophagosomes and noticeable swelling of the organelles. In addition, no plasma membrane fold structure was observed. The TUNEL assay suggested that the percentage of apoptotic cells increased in the CP-AKI group (percentage of TUNEL-positive cells: 32.8 ± 4.67) compared to that in the control mice (percentage of TUNEL-positive cells: 7.25 ± 2.50; p < 0.05) (Figure 1D,E). Our results indicated the successful construction of the CP-AKI mouse model.

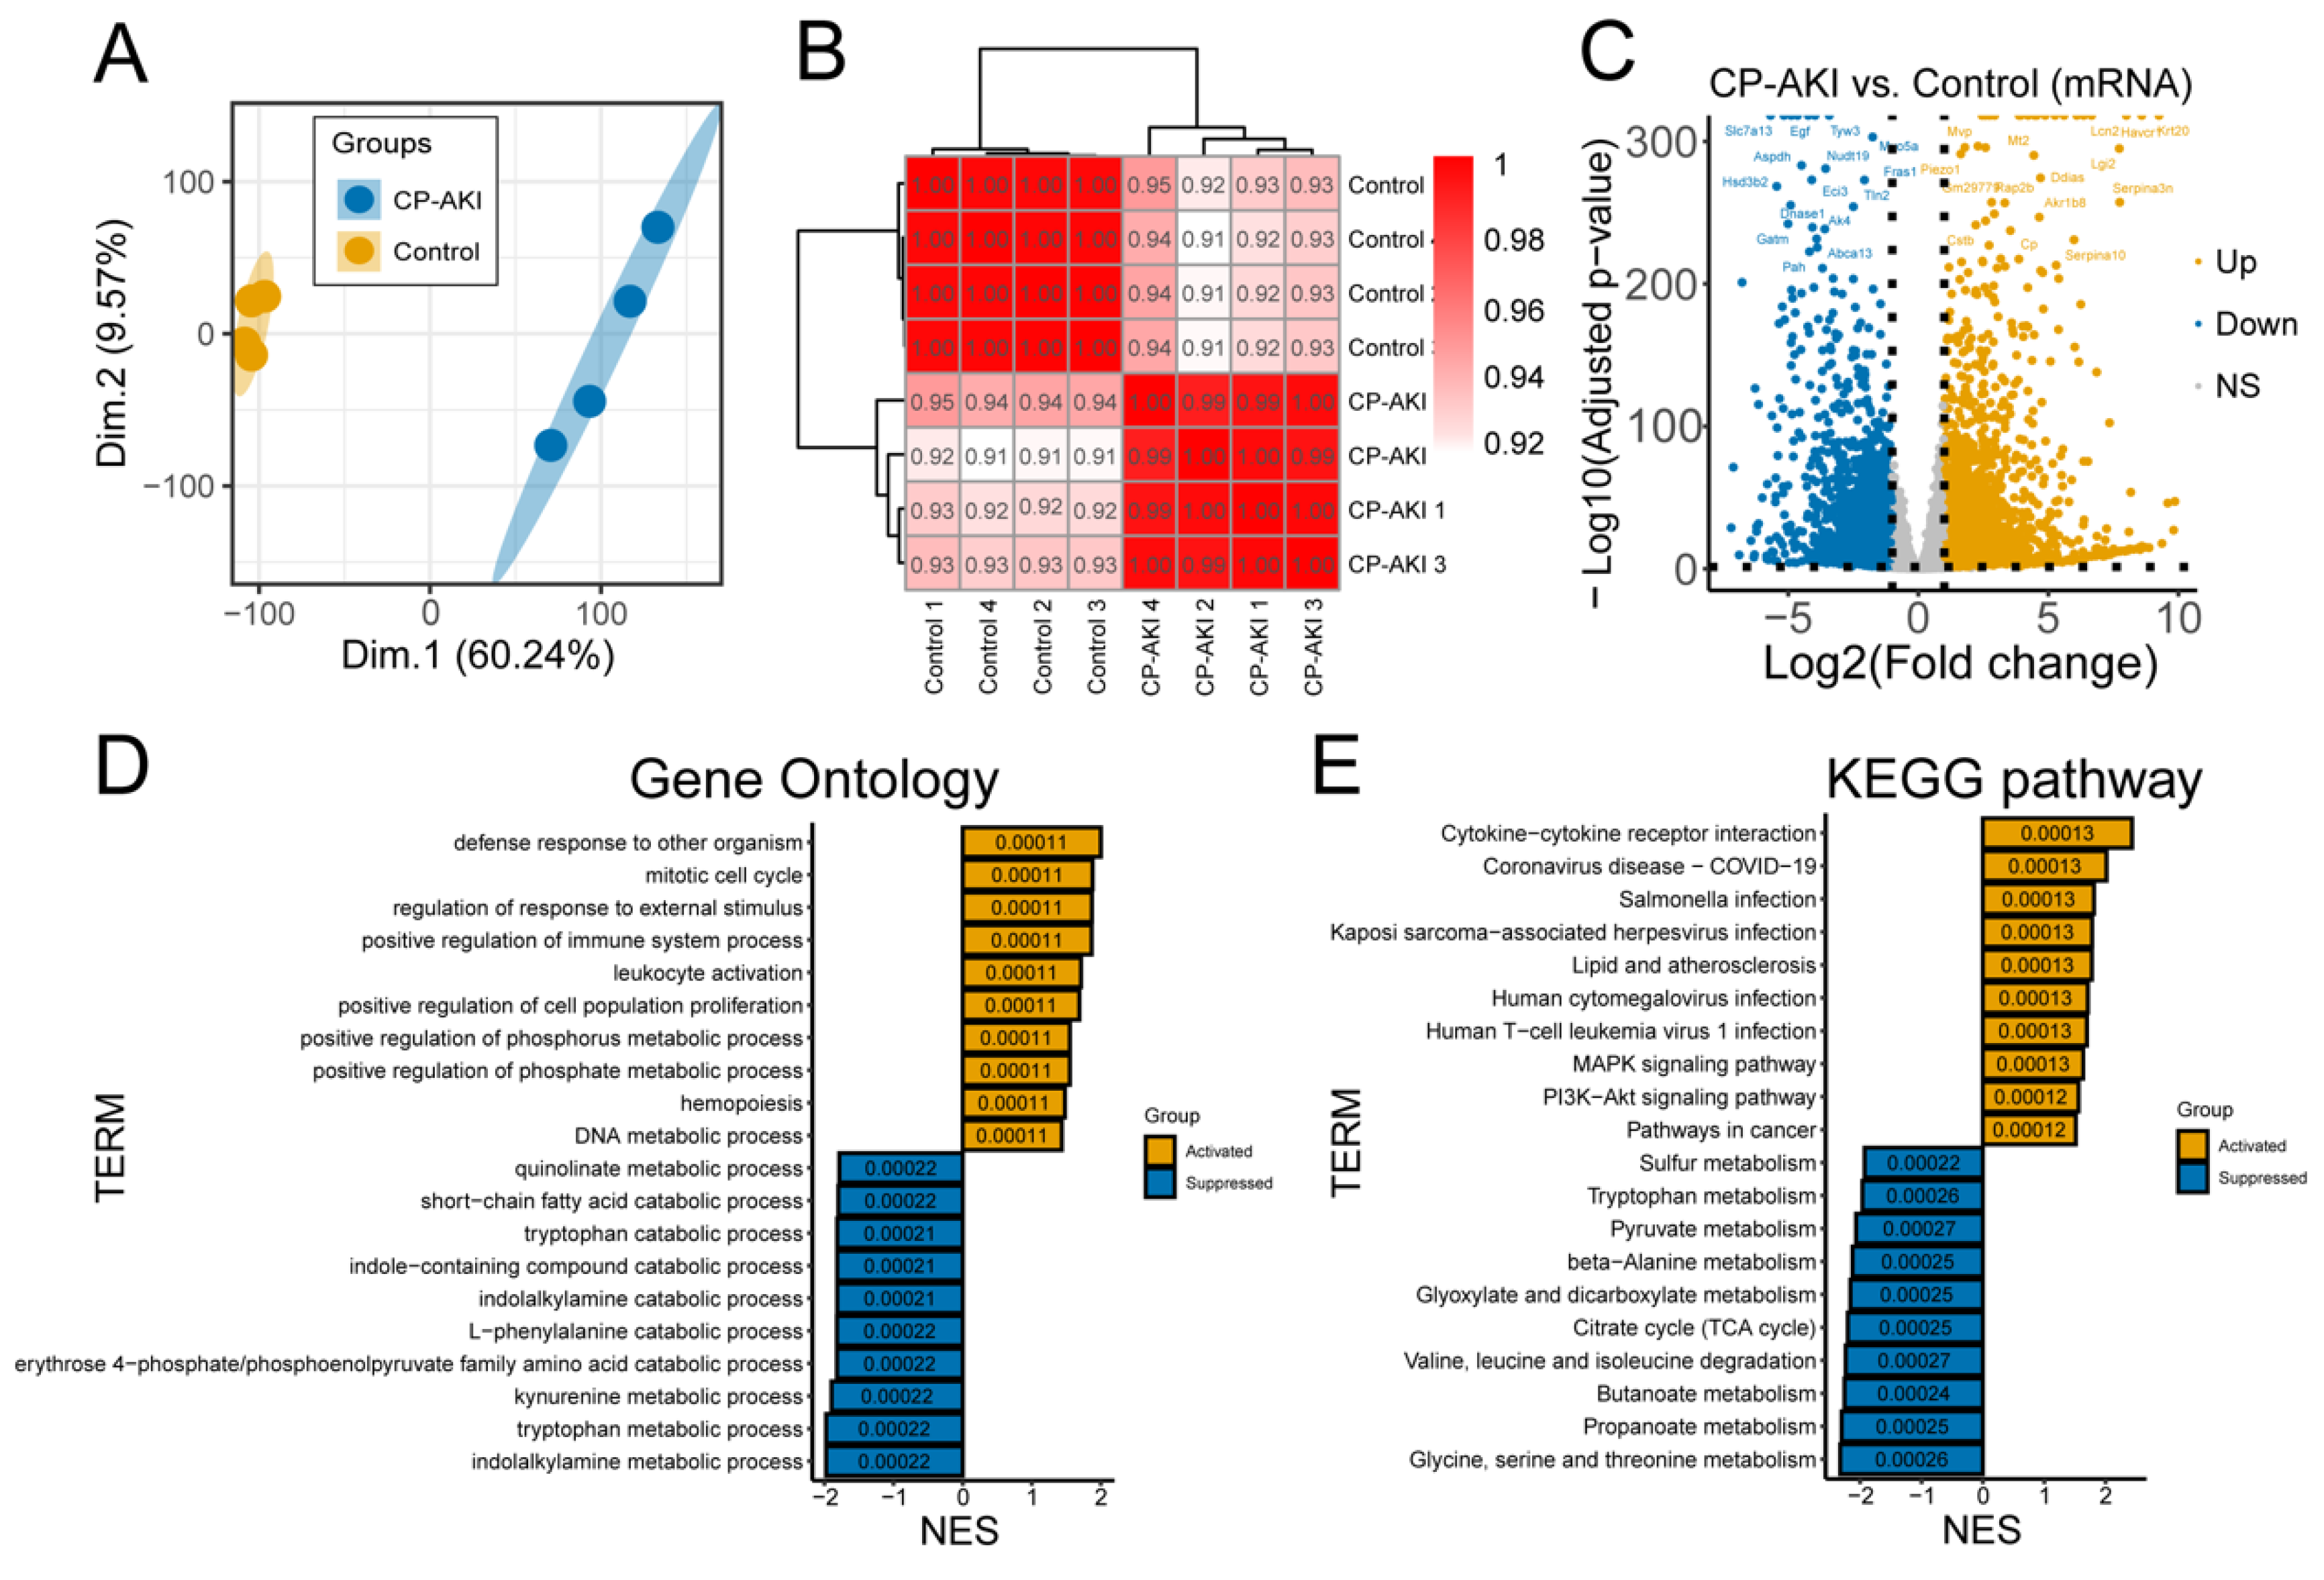
3.2. Biological Processes of CP-AKI Revealed by RNA-Seq

To investigate the regulatory functions of RNAs in CP-AKI, RNA-seq was performed and distinguished the dysregulated mRNAs and ncRNAs between the CP-AKI and control groups. PCA indicated that cisplatin-treated samples were separated from the NS-treated samples (Figure 2A). Sample-to-sample correlation analysis exhibited clustering with inter-regional relationships similar to those observed in the PCA (Figure 2B). Volcano plots were used to visualize the 4460 dysregulated genes (Figure 2C), 1851 lncRNAs (Figure S3), 101 circRNAs (Figure S4), and 102 miRNAs (Figure S5) in the two groups. GSEA of DEGs in the CP-AKI group was performed. Figure 2D shows an overview of the significantly enriched GO terms (p < 0.05, Table S1). Terms for the regulation of responses to external stimuli and for the positive regulation of immune system processes were markedly activated. The first stage in the occurrence of AKI is exposure to nephrotoxic drugs [37]. Furthermore, an excessive cellular workload in many tubular cells increases the risk of nephrotoxicity-related injury [38]. AKI induced by immune-checkpoint inhibitors may be caused by immune-system reprogramming, resulting in the loss of tolerance [39]. KEGG pathway analysis, as shown in Figure 2E, revealed significantly enriched pathways among dysregulated mRNAs involved in ncRNA-associated ceRNA networks (p < 0.05, Table S2). These pathways were associated with cytokine–cytokine receptor synergy and MAPK signaling pathways. Our results suggest that microenvironmental factors, particularly immune activation, contribute to the occurrence and development of CP-AKI.

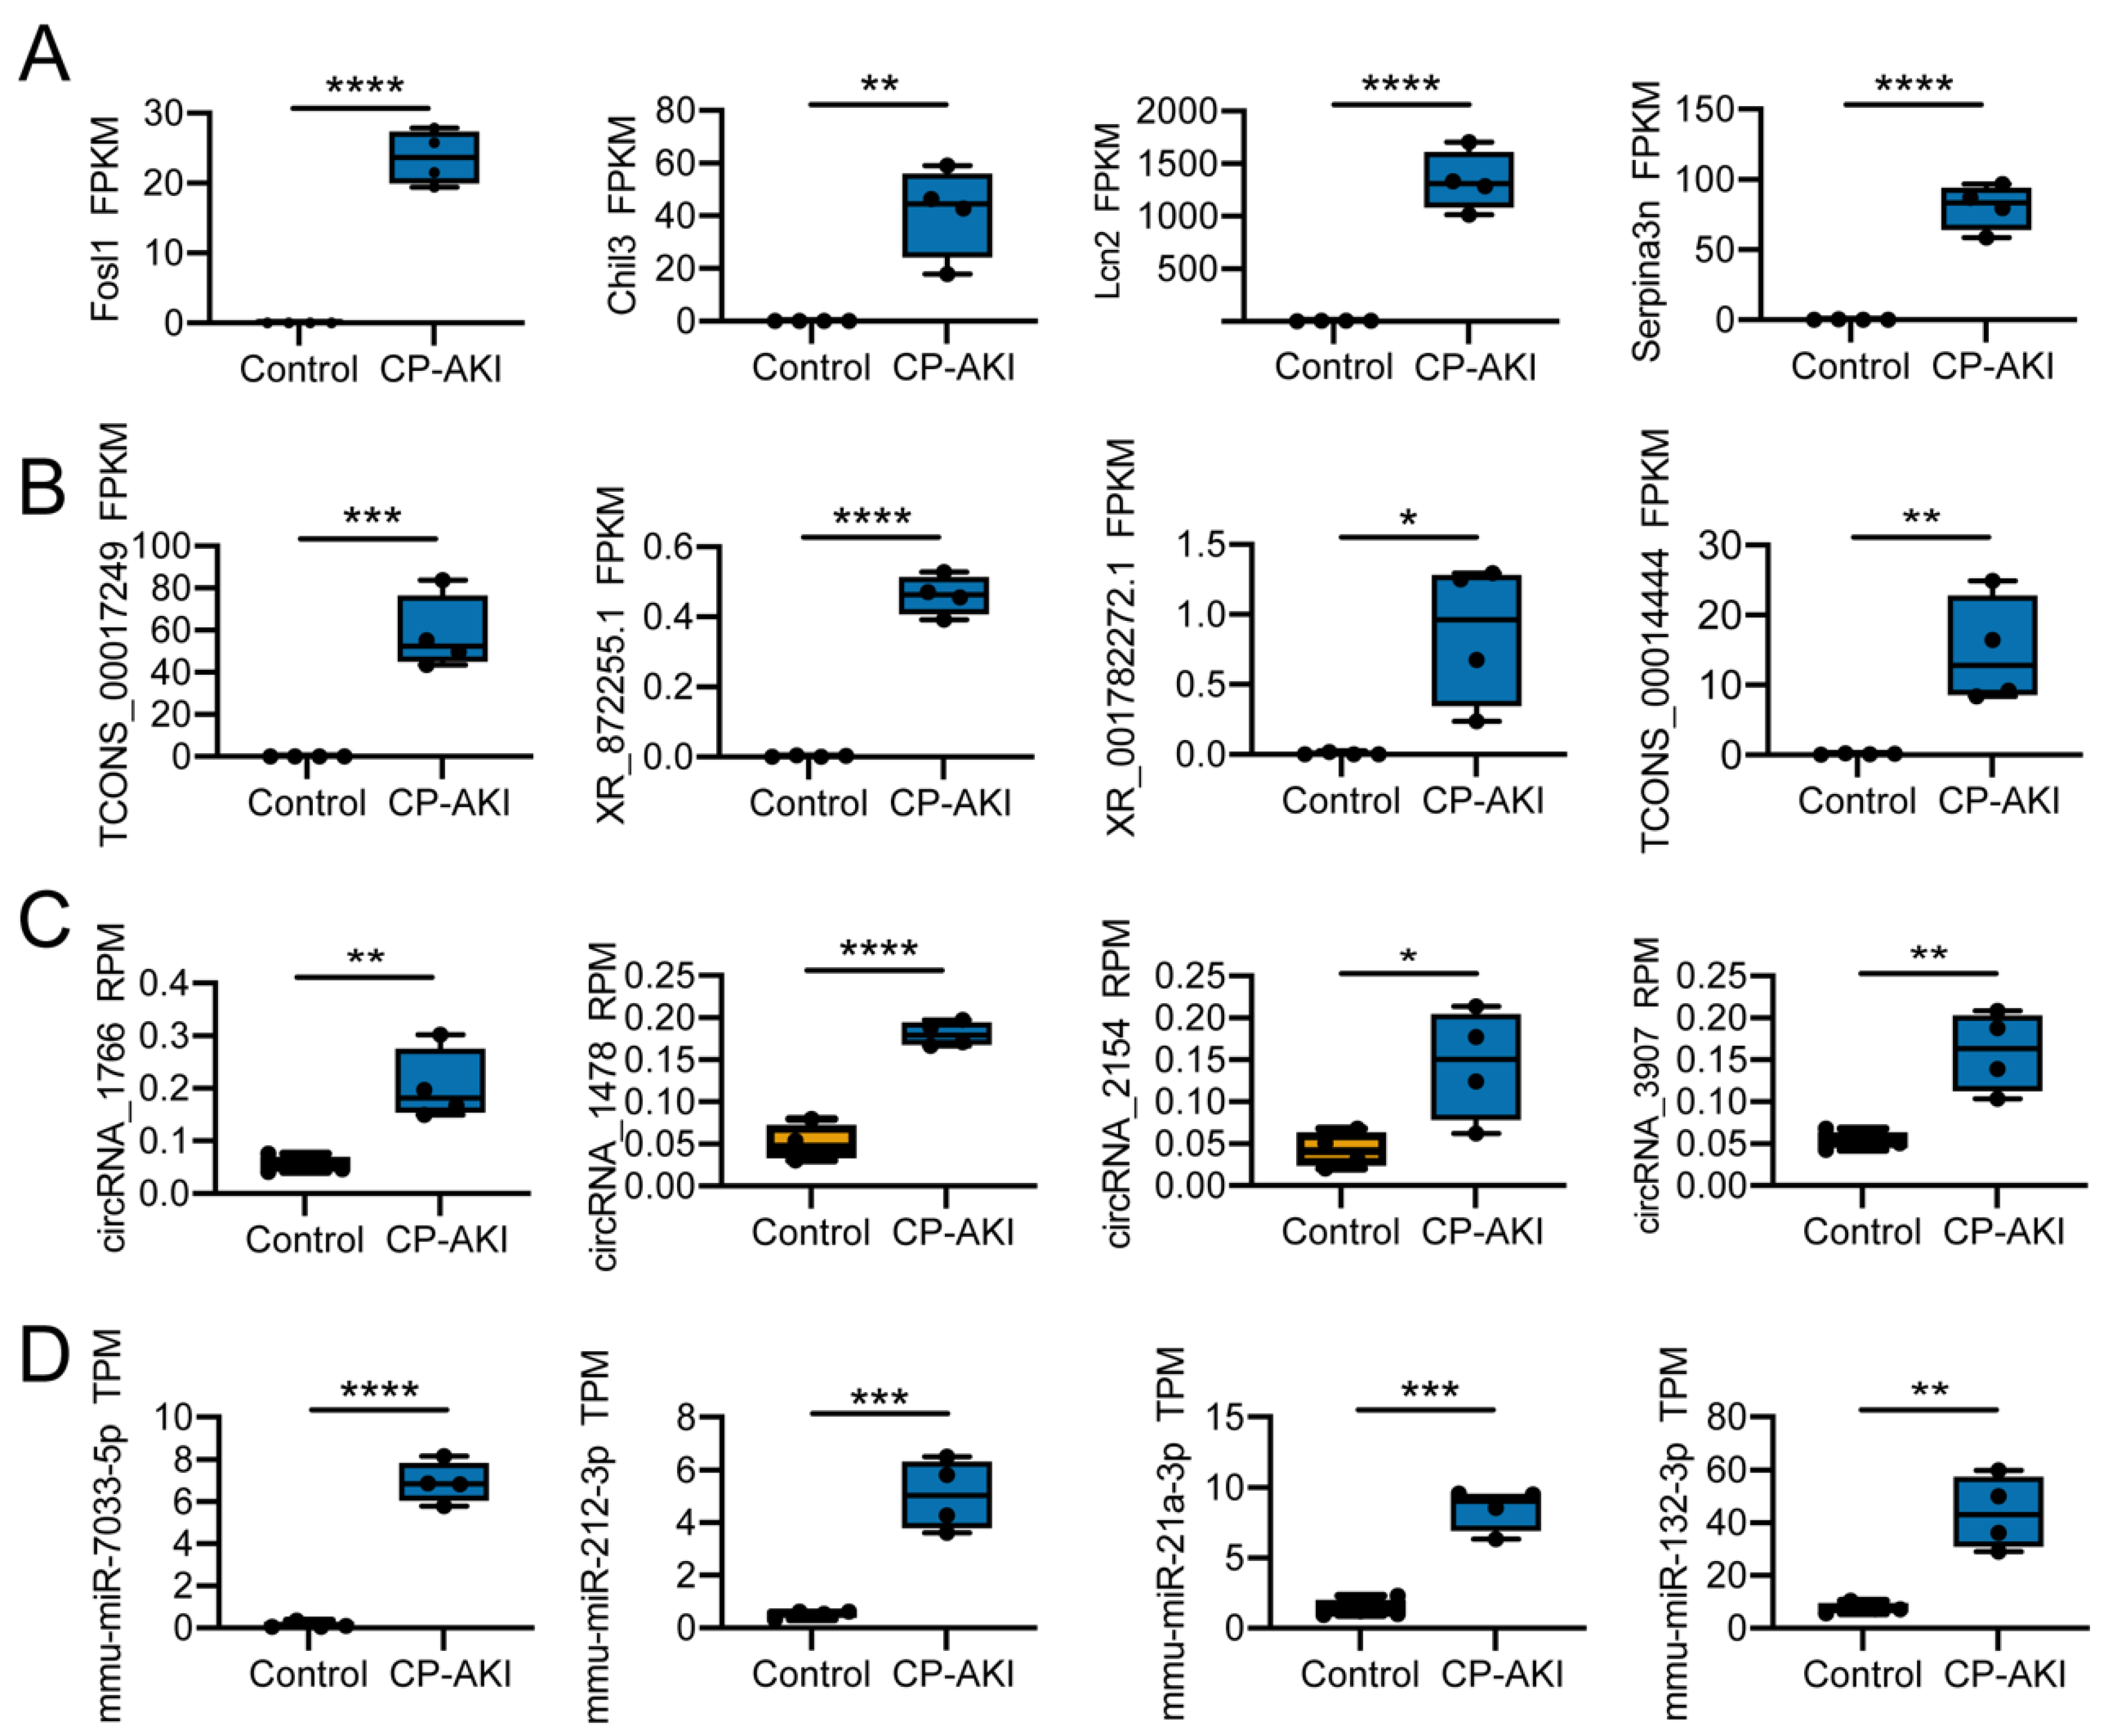
3.3. Potential Regulation Mechanisms in CP-AKI Mice

To evaluate the DEGs between the two groups, RNAs were ranked in descending order of log2 (fold-change). Compared to the RNAs in the control group, 4460 significantly differentially expressed mRNAs were identified based on FPKM, among which 2363 were upregulated and 1997 were downregulated (p < 0.05, Table S3); 1851 significantly differentially expressed lncRNAs were detected based on the FPKM, with 865 upregulated and 986 downregulated (p < 0.05, Table S4); 101 significantly differentially expressed circRNAs were identified based on the RPM, with 43 upregulated and 58 downregulated (p < 0.05, Table S5); and 102 significantly differentially expressed miRNAs were detected based on the TPM, with 67 upregulated and 35 downregulated (p < 0.05, Table S6).
The most upregulated mRNAs were Fosl1, Chil3, Lcn2, and Serpina3n (Figure 3A). Fosl1, also known as Fra-1, regulates inflammatory reactions in a cell-dependent manner in mice with cigarette-smoke-induced lung inflammation [40]. Chil3 is also related to the immune response [41,42]. Lipocalin 2, also known as NGAL, is a crucial injury-response factor that showed elevated expression levels in single-cell RNA-seq in an ischemia–reperfusion mouse model of AKI [43]. Serpina3n is upregulated during inflammation resolution, which can prevent inflammation progression [44]. TCONS_00017249, XR_872255.1, XR_001782272.1, and TCONS_00014444 were the most upregulated lncRNAs (Figure 3B). CircRNA_1766, circRNA_1478, circRNA_2154, and circRNA_3907 were the most upregulated circRNAs (Figure 3C). Mmu-miR-7033-5p, mmu-miR-212-3p, mmu-miR-21a-3p, and mmu-miR-132-3p were the most upregulated miRNAs (Figure 3D). MiR-212-3p reportedly participates in activating the EGFR/PI3K/AKT signaling pathway [45]. Furthermore, suppression of the PI3K/AKT/mTOR pathway can facilitate oxidative stress and reduce apoptosis in sepsis-induced AKI, indicating that targeting miR-212-3p can help to limit AKI progression [46]. Additionally, miR-21a-3p can promote angiogenesis and plays a regulatory role under inflammatory conditions [47].
Collectively, the evidence presented here indicates that upregulated genes are essential for CP-AKI occurrence through immune or inflammatory regulation. The increased expression of miRNAs suggests that they are responsible for regulating gene expression and, in turn, are regulated by lncRNAs or circRNAs in ceRNA networks.

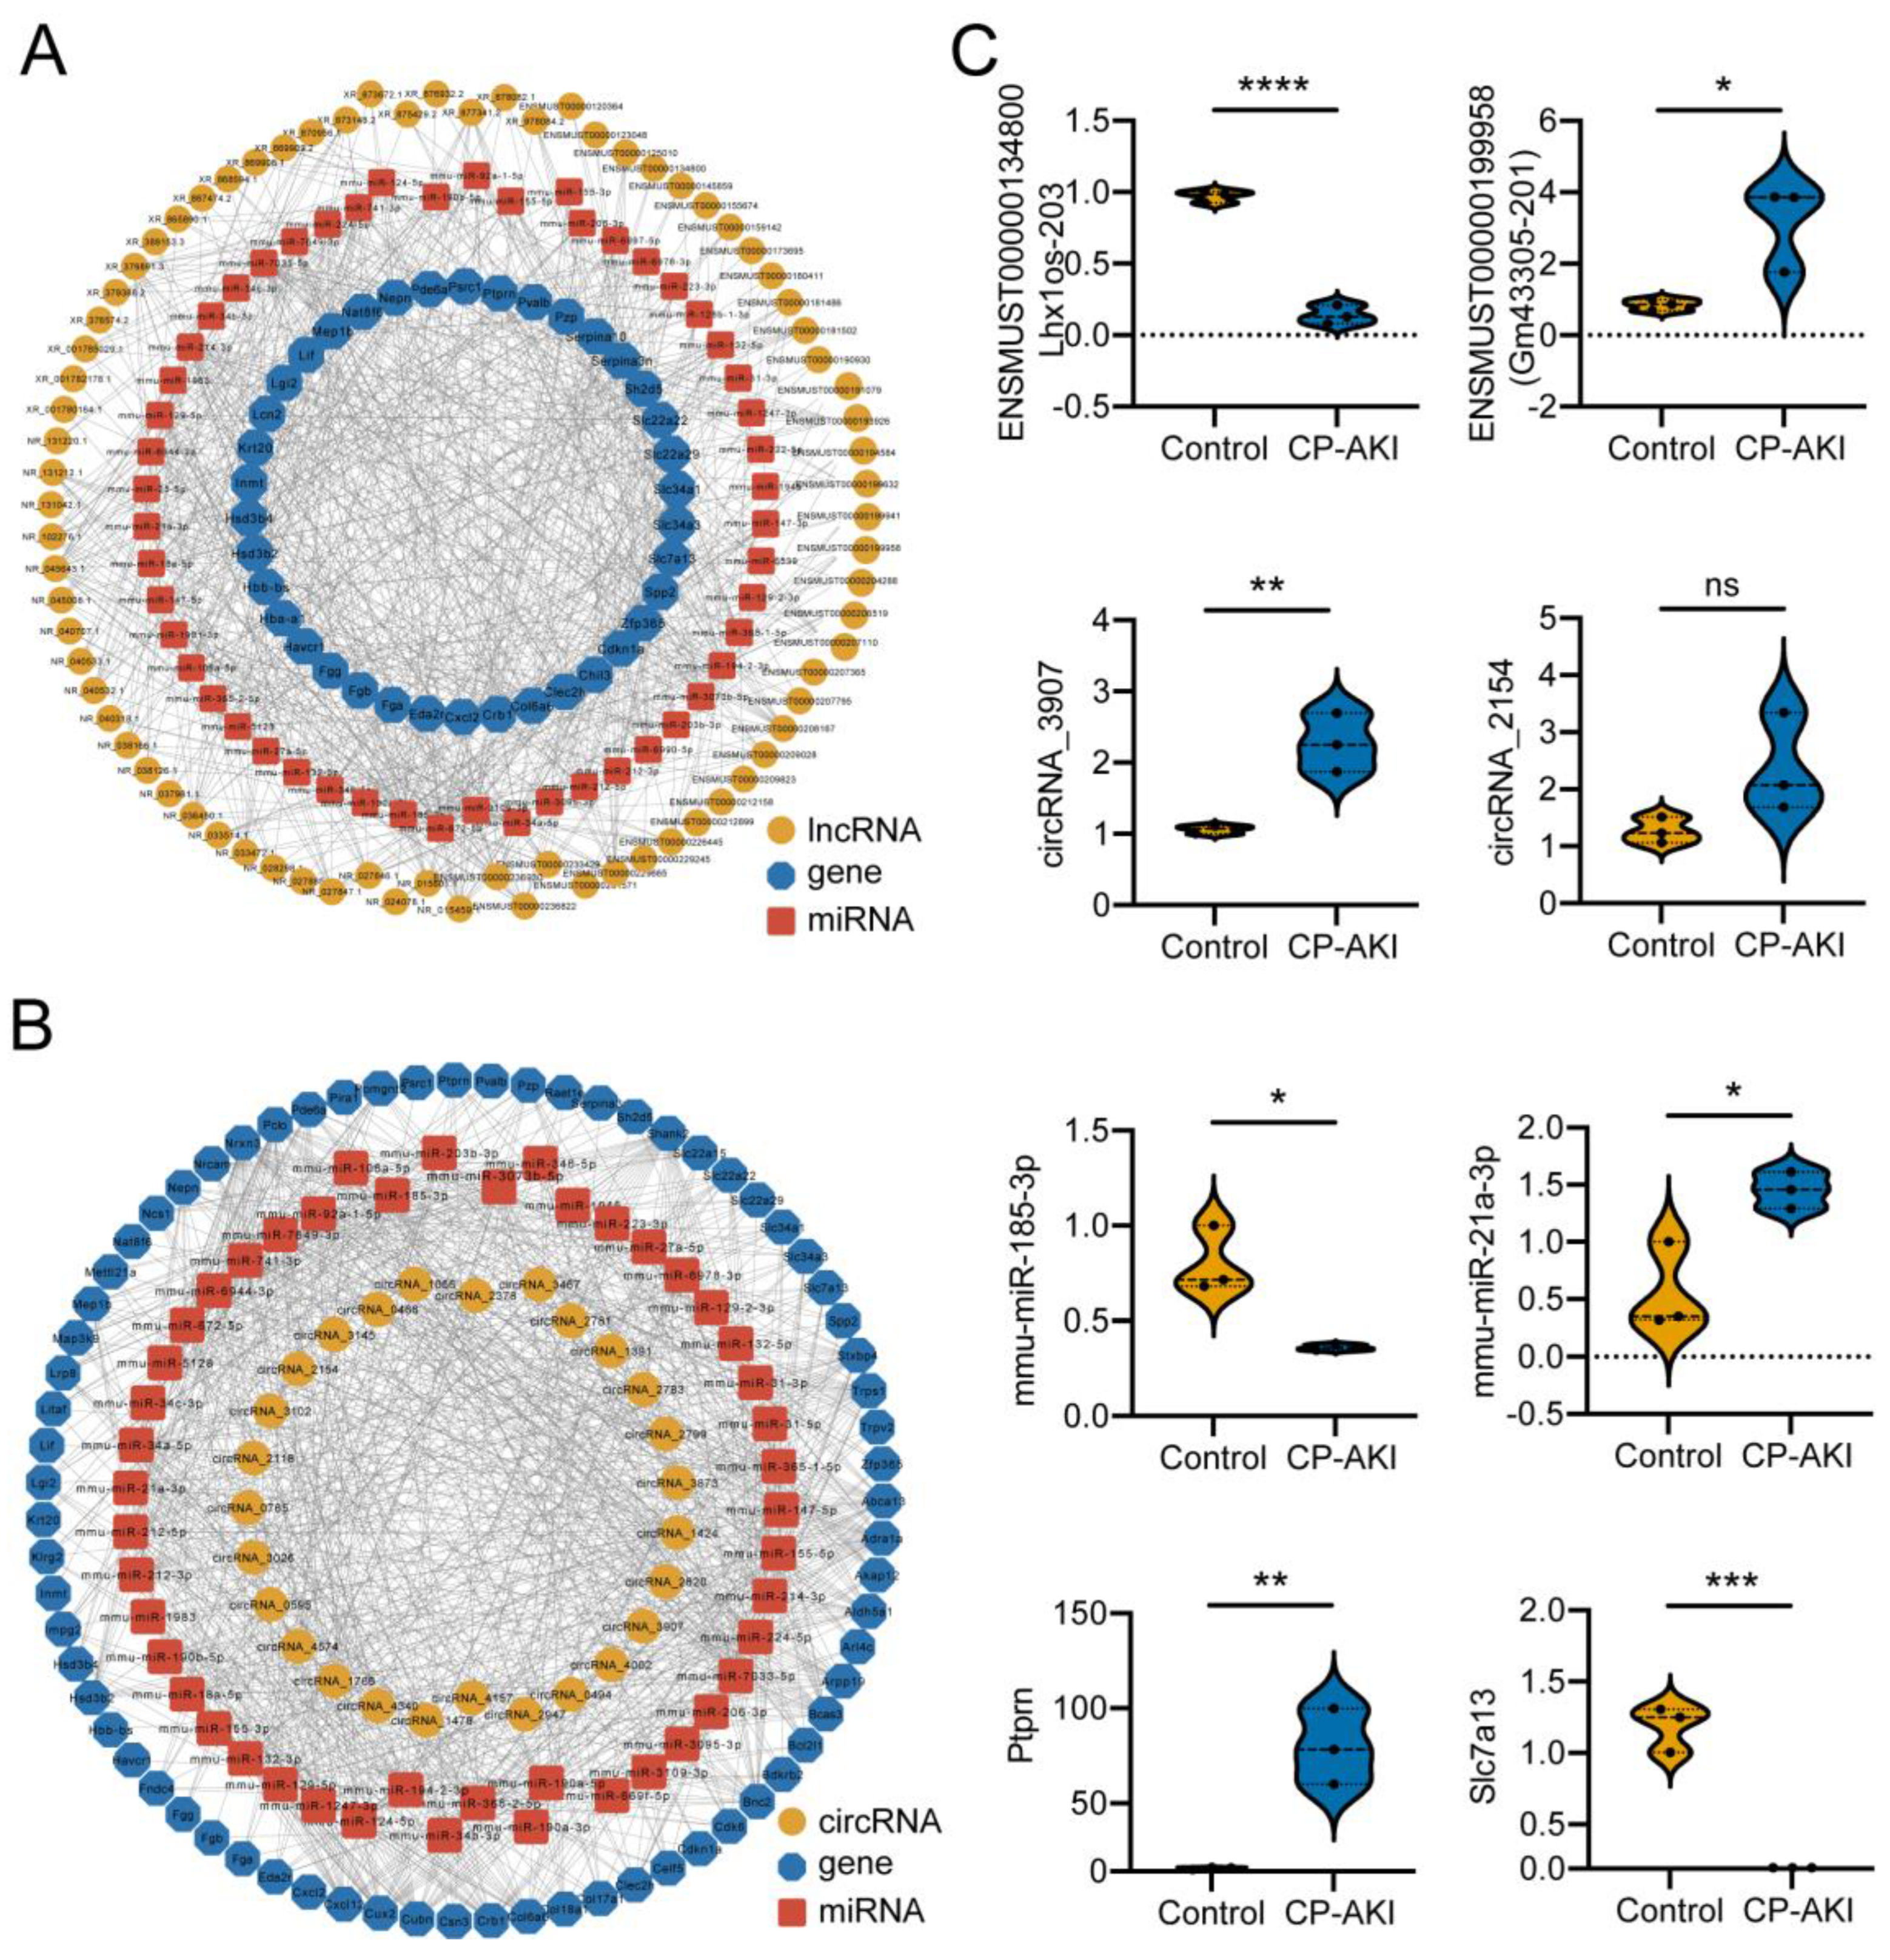
3.4. Construction and Validation of ncRNA-Associated ceRNA Networks in CP-AKI Mice

To determine the regulatory roles of ncRNAs in CP-AKI, we constructed ceRNA networks based on their expression profiles using RNA-seq. Figure 4A,B show portions of the ceRNA network: the lncRNA–miRNA–mRNA network and circRNA–miRNA–mRNA network, respectively. Both portions consisted of upregulated and downregulated RNAs in CP-AKI mice.
Using RT-qPCR, we randomly selected and confirmed eight significantly differentially expressed RNAs from a cohort of three CP-AKI and three control mice. Validation of the ceRNA networks Lhx1os-203/mmu-miR-21a-3p/Slc7a13 and circRNA_3907/mmu-miR-185-3p/Ptprn revealed the same trend as the sequencing data with a significant difference (Figure 4C). Lhx1os-203 is a ceRNA of mmu-miR-21a-3p, which targets Slc7a13. SLC7A13 is a membrane protein and serves as the second cystine transporter, which can enable the determination of the previously unidentified genetics of cystinuria [48]. MiR-21a-3p is also involved in the inflammatory response, as previously mentioned. CircRNA _3907 is a ceRNA of mmu-miR-185-3p that targets Ptprn. PTPRN, a transmembrane protein, upregulates pancreatic β-cell transcription and proliferation [49]. MiR-185-3p can downregulate AGER expression and improve renal function in diabetic kidney disease (DKD) mice [50]. Based on these data, the circRNA_3907/mmu-miR-185-3p/Ptprn network may be associated with DKD and is likely to be involved in CP-AKI.
Understanding the impact of ceRNA regulation on miRNAs may help to reveal the pathogenesis of CP-AKI and determine general diagnostic methods and therapeutic options for patients with CP-AKI. Additional information on the ncRNA-associated ceRNA networks is shown in Tables S7 and S8.

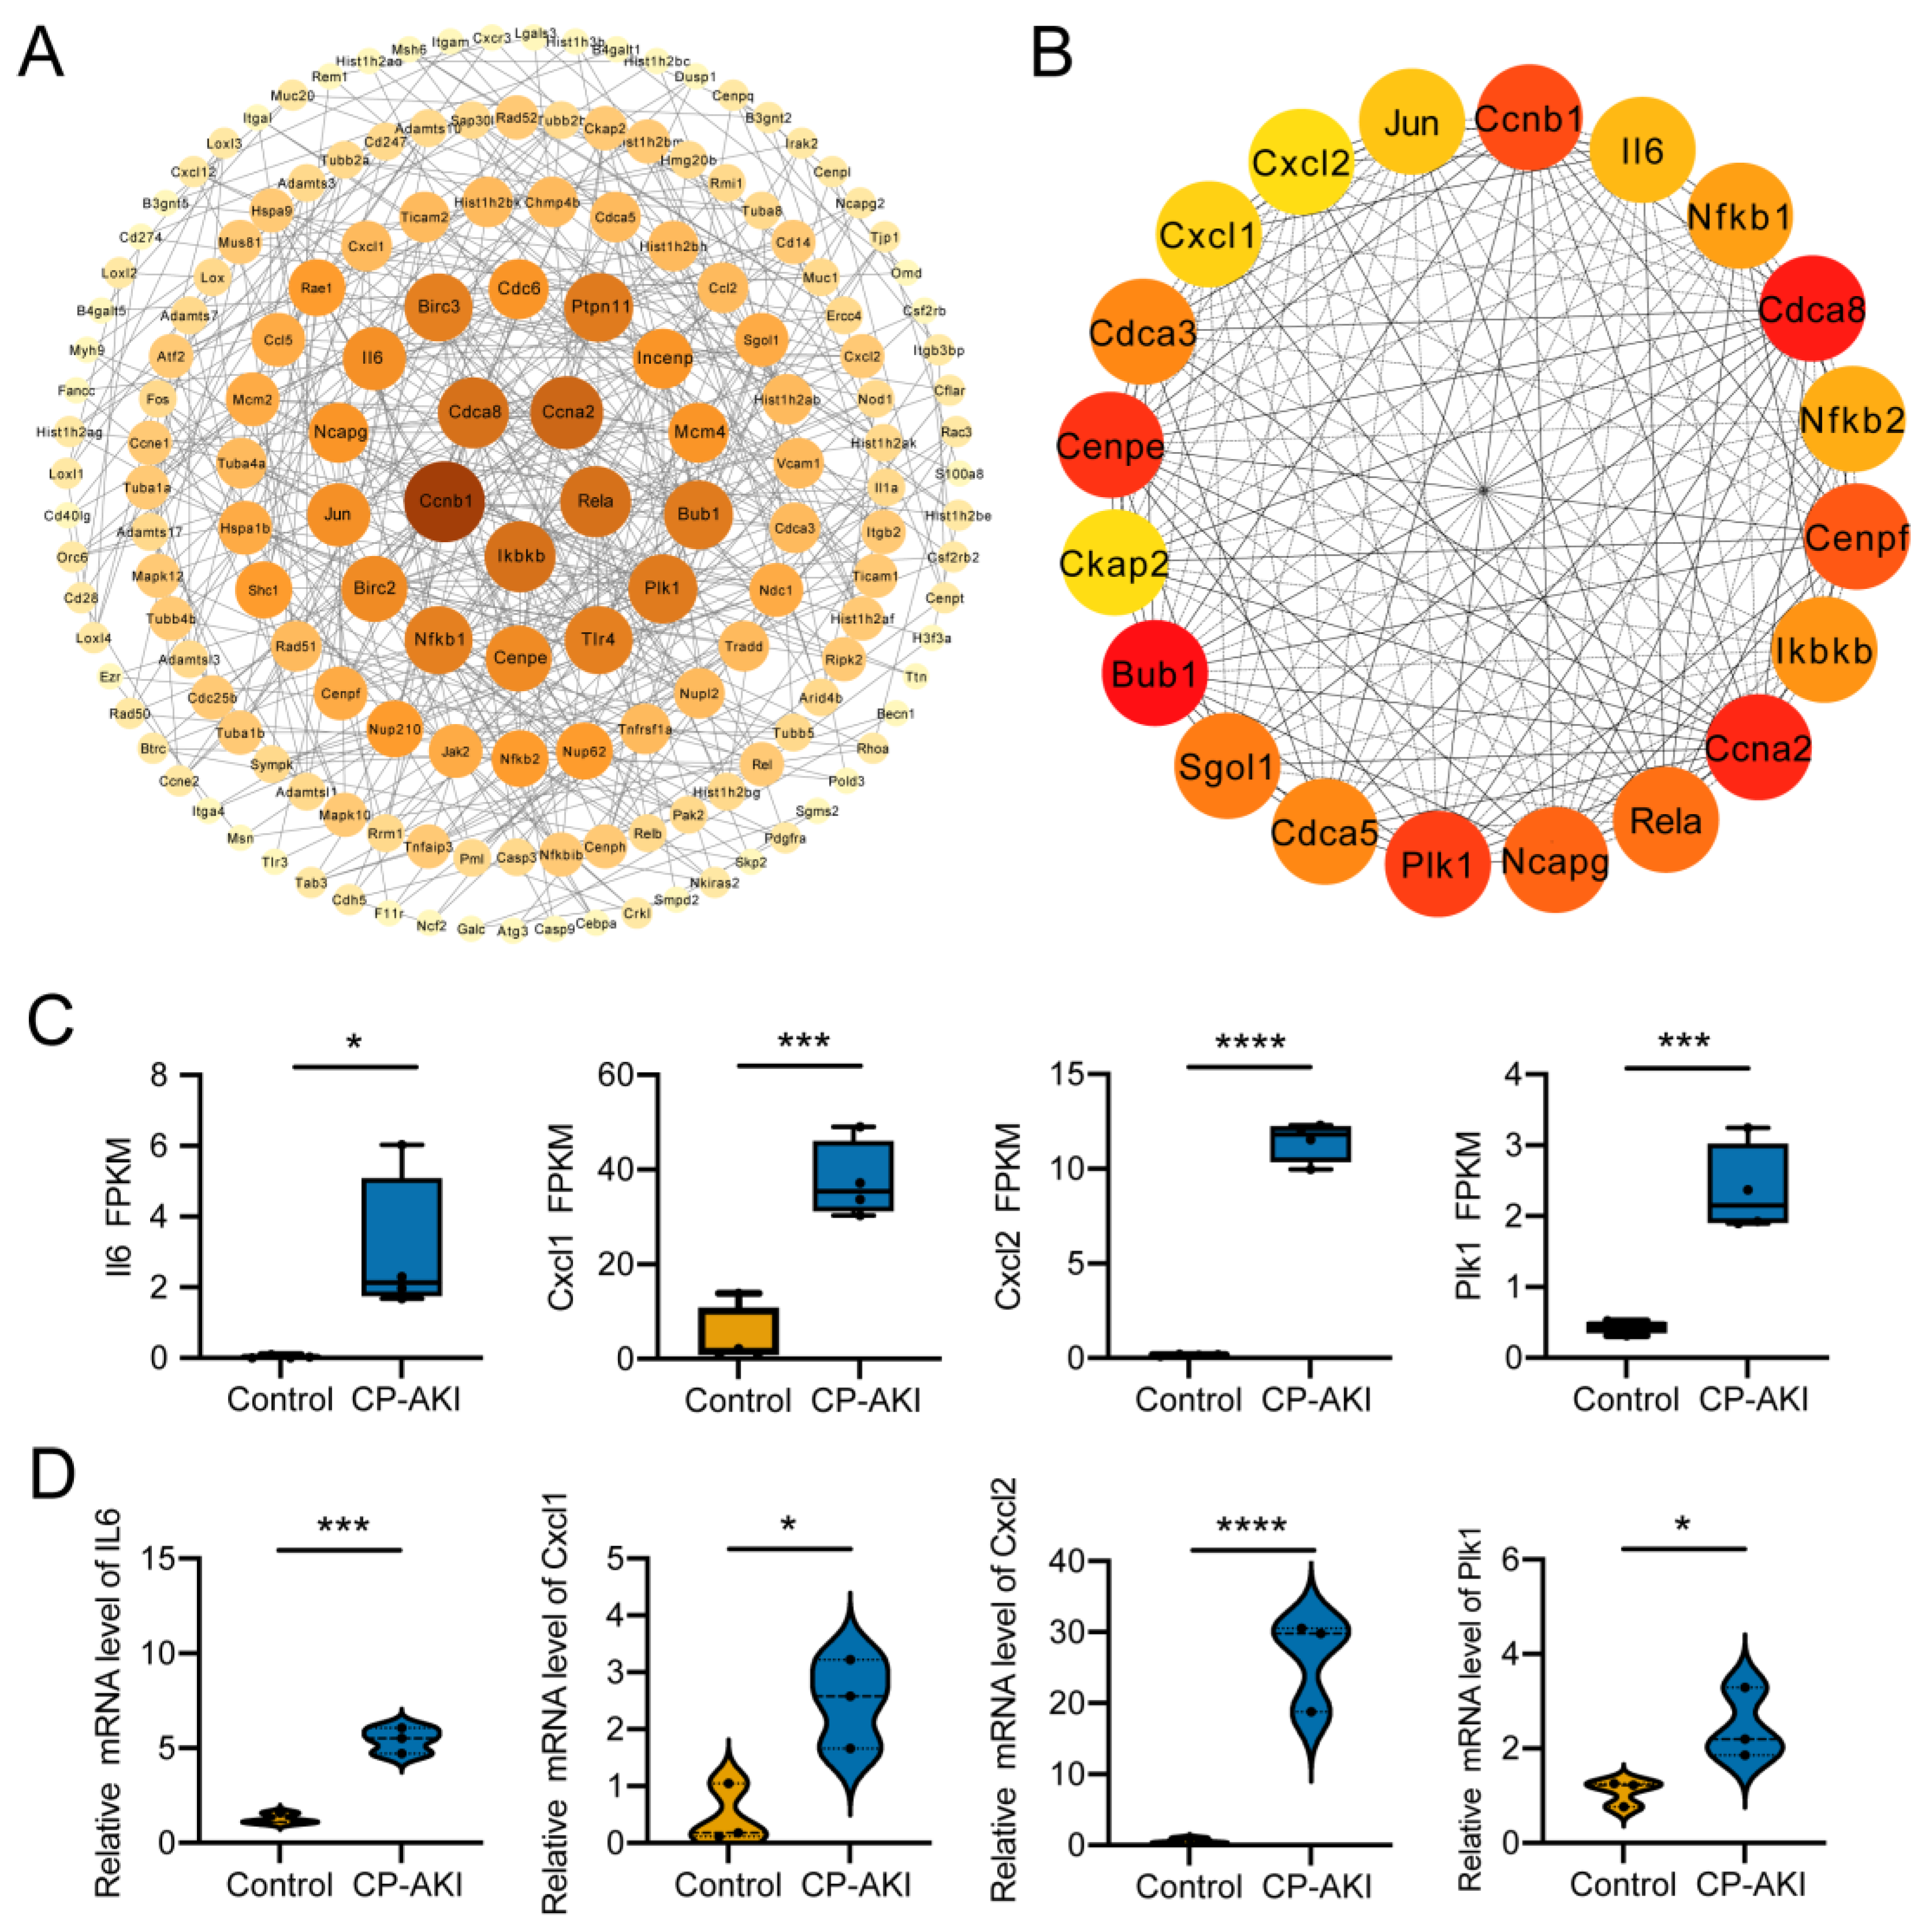
3.5. Construction and Analysis of the PPI Network and Hub Genes

To highlight the key implicit protein-coding genes involved in AKI development, we generated a PPI network using the upregulated DEGs in the CP-AKI mice (Figure 5A). Highly connected genes in the network were acknowledged as hub genes; the top 20 hub genes are shown in Figure 5B. Genes involved in AKI pathogenesis were predicted. Il6, Cxcl1, and Cxcl2 are highly associated with the inflammatory response, and Plk1 correlates with DNA damage [51,52]. Consistent with the data from RNA-seq (Figure 5C), these hub genes showed increased expression in CP-AKI mice (Figure 5D), indicating that the hub genes are most related to AKI pathogenesis and play vital roles in CP-AKI development.
Previous studies demonstrated the vital role of interleukin-6 in AKI. Interleukin-6 trans-signaling may affect kidney fibrosis, and suppression of this trans-signaling may protect podocytes and present an innovative therapeutic target for DKD and renal fibrosis [53,54]. Cisplatin-induced inflammatory responses are regulated by CXCL1/CXCR2 via the nuclear factor-kappa B signaling pathway [51]. CXCL1/CXCL2 can regulate the initial stage of neutrophil recruitment in lipopolysaccharide-induced inflammation, and a decrease in SIRT2 may contribute to downregulated CXCL2 and CCL2 expression induced by lipopolysaccharides in the kidneys [55,56]. PLK1 is inactivated in response to various DNA-damaging agents. NOTCH1 serves as a substrate of PLK1, and NOTCH1 inactivation is involved in PLK1-associated DNA damage, which increases cell death [52,57].
The PPI network results revealed that the hub genes in CP-AKI have various effects, particularly in renal fibrosis, inflammation, and DNA damage.

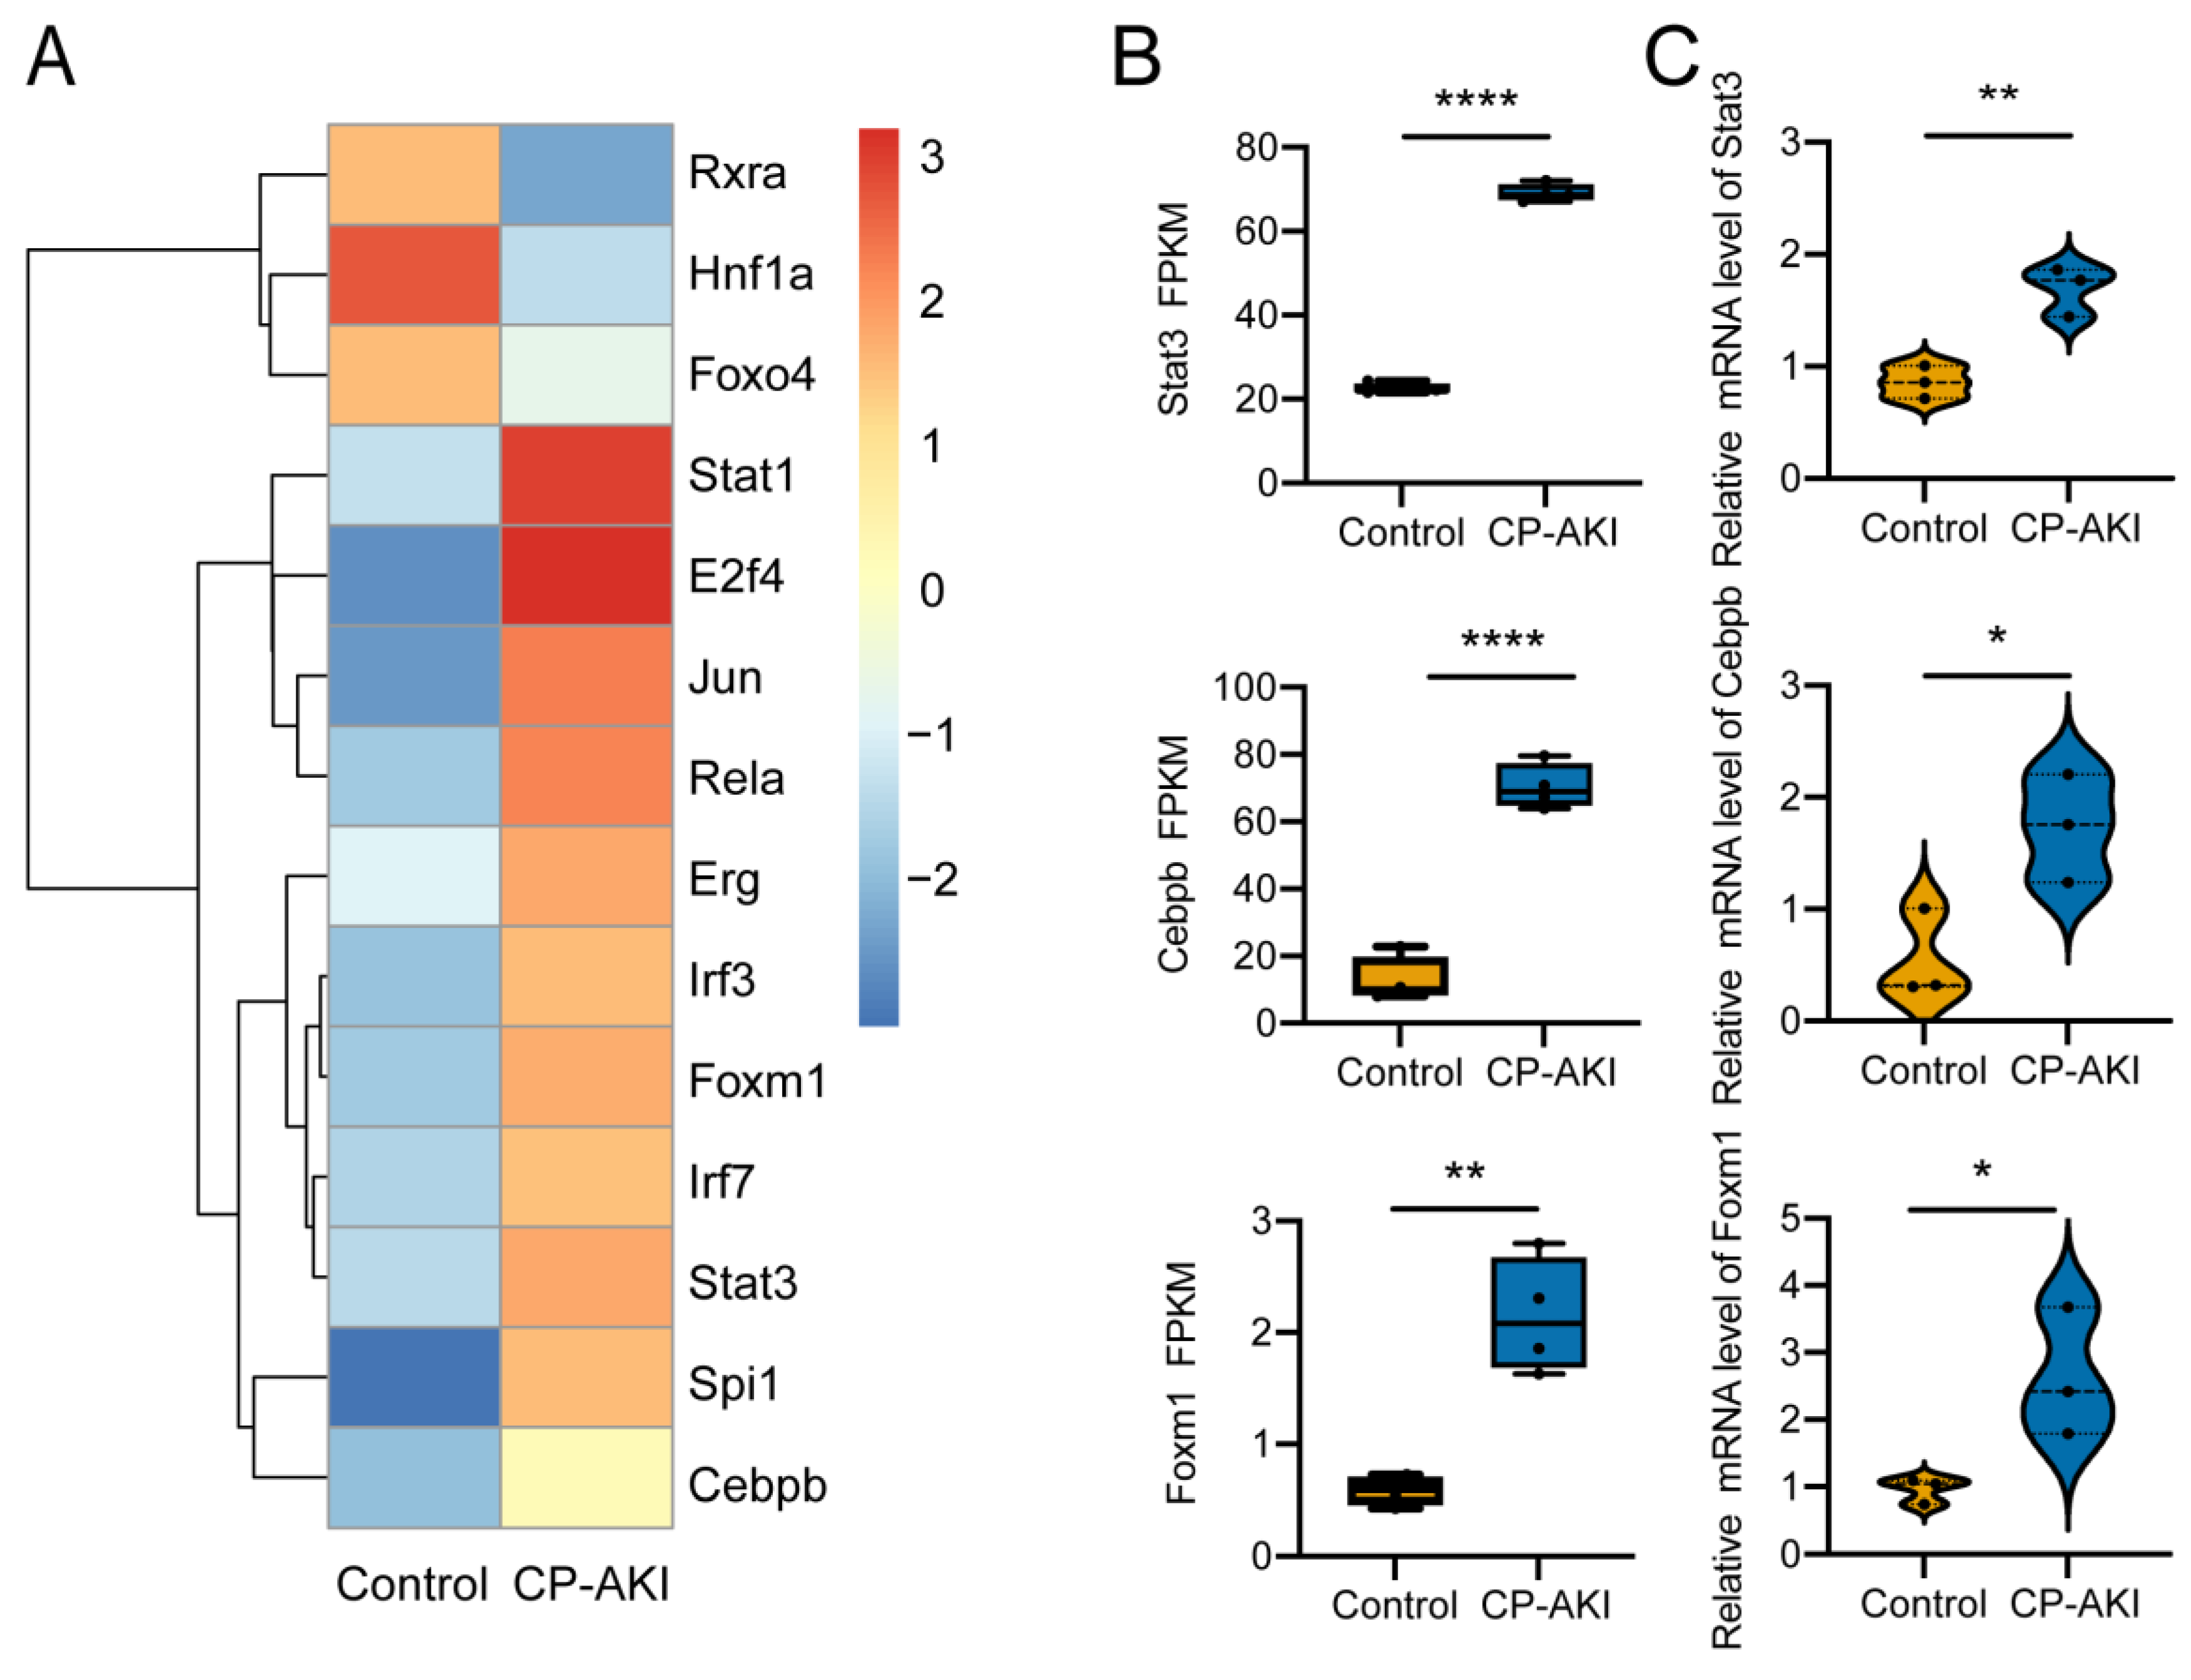
3.6. Identification of Activated TFs in CP-AKI Mice

To further understand how TFs perturb gene expression profiles, we analyzed TF activity using RNA-seq expression data. Figure 6A shows the activated TFs in CP-AKI mice. We randomly selected three TFs for experimental validation, and the results corresponded well with those of RNA-seq (Figure 6B,C). The changes in TFs reveal the causes of the altered transcriptional levels of genes in CP-AKI mice because they can reflect the critical regulatory processes in the transcriptional response. Stat3 is a transcriptional activator that mediates cellular responses to interleukins and other growth factors. STAT3 activates KIM-1 by occupying the KIM-1 promoter and regulating its transcription and translation [58]. Cisplatin- or sepsis-induced AKI can be attenuated when the JAK2/STAT3 signaling pathway is suppressed by curcumin or AG490 [59,60]. C/EBPβ (encoded by Cebpb) exacerbated ischemia/reperfusion-induced AKI by transactivating miR-16 [22]. Foxm1 is induced early in AKI and is essential for renal tubular proliferation [61,62]. Collectively, TFs reflect vital regulatory elements that can affect transcriptional activation and/or repression and the mechanism by which genes and ncRNAs are regulated in CP-AKI. These results also indicate the need for follow-up research on CP-AKI.

4. Discussion

Previous studies revealed the serious adverse consequences of chemotherapeutic-drug-induced nephrotoxicity [63,64]. However, the specific mechanisms underlying CP-AKI pathogenesis remain unclear. The ceRNA hypothesis states that lncRNAs or circRNAs share common miRNA target sites with mRNAs and form an interaction and regulation network known as the ceRNA network [65]. ncRNA-associated ceRNA networks in CP-AKI have recently attracted considerable attention. However, the detailed mechanisms by which ncRNAs interact with CP-AKI remain poorly understood.
We performed RNA-seq analysis of the kidneys of CP-AKI mice and detected differentially expressed RNAs (4460 mRNAs, 1851 lncRNAs, 101 circRNAs, and 102 miRNAs). We constructed two ceRNA networks: Lhx1os-203/mmu-miR-21a-3p/Slc7a13 and circRNA_3907/mmu-miR-185-3p/Ptprn. However, the precise ceRNA network regulatory mechanisms are still unclear, and thus, further in-depth studies exploring expression regulation and luciferase reporter gene expression are required in the near future. Il6, Cxcl1, Cxcl2, and Plk1 were identified as hub genes with physiological functions in CP-AKI in the PPI network, which can contribute to a better understanding of how genes in ceRNA networks interact. Stat3, Cebpb, and Foxm1 are activated TFs that regulate gene transcription levels. TF analysis of the mRNA expression data in the ceRNA network further supported our conclusion. These results elucidate the mechanisms underlying CP-AKI development and highlight potential therapeutic targets.
We identified 4460 mRNAs that were differentially expressed and associated with CP-AKI pathogenesis. Among the upregulated mRNAs, Arg2 plays a vital role in nitrosative stress involved in ischemia/reperfusion-induced AKI [66]. Klf6 may participate in regulating mitochondrial function and podocyte apoptosis [67]. This is in accordance with the findings of Cheng et al., who demonstrated that Gpnmb was upregulated in contrast-induced AKI [14]. CXCL1 and CXCL2 signals may exert protective effects in injured kidneys by mediating myeloid-derived suppressor cell recruitment [68]. The β-fragment was found to increase earlier than sCr and BUN levels, demonstrating its potential as a biomarker of AKI [69].
ncRNAs represent the majority of total human transcripts [70]. We found 1851 lncRNAs, 101 circRNAs, and 102 miRNAs differentially expressed in the CP-AKI mice. These ncRNAs may participate in kidney disease progression and may be classified as ceRNAs that influence differences in the expression of genes in CP-AKI. LncRNA H19 was induced in ischemic AKI and can attenuate AKI pathogenesis by sponging miRNA-30a-5p [71]. Many lncRNAs are candidate biomarkers, including TapSAKI, XIST, MALAT1, CASC2, and HOXA-AS2 [72]. Regarding exosomes, miR-125b-5p was reported to promote tubular repair in ischemic AKI, whereas miRNA-19b-3p was reported to participate in tubulointerstitial inflammation [73,74]. These lncRNAs may function as regulators in CP-AKI.

5. Conclusions

We identified dysregulated mRNAs and ncRNAs, as well as lncRNA- or circRNA-associated ceRNA networks, between CP-AKI and control mice using RNA-seq. Further research should be undertaken to investigate how the mRNAs involved in ceRNA networks play a role and are regulated by TFs in the pathogenesis of CP-AKI. Our results improve the understanding of ceRNA networks, hub genes, and TFs. In addition, these findings provide support for determining the pathogenesis of CP-AKI and identifying potential therapeutic targets for patients with CP-AKI.

Supplementary Materials

The following supporting information can be downloaded at: https://www.mdpi.com/article/10.3390/cells11192971/s1. Figure S1: Serum creatinine (sCr) levels: cisplatin-induced acute kidney injury (CP-AKI) model versus the control group; Figure S2: Blood urea nitrogen (BUN) levels: cisplatin-induced acute kidney injury (CP-AKI) model versus the control group; Figure S3: Volcano plot of differentially expressed long non-coding RNAs (lncRNAs) of CP-AKI versus the control group; Figure S4: Volcano plot of differentially expressed circular RNAs (circRNAs) of CP-AKI versus the control group; Figure S5: Volcano plot of differentially expressed microRNAs (miRNAs) of CP-AKI versus the control group; Table S1: Enriched GO terms; Table S2: Enriched KEGG pathways; Table S3: Differentially expressed mRNAs; Table S4: Differentially expressed lncRNAs; Table S5: Differentially expressed circRNAs; Table S6: Differentially expressed miRNAs; Table S7: lncRNA-associated ceRNA network; Table S8: circRNA-associated ceRNA network.

Author Contributions

Supervision, project administration, and funding acquisition, F.S. and H.C.; validation, visualization, and writing—original draft preparation, Y.D.; conceptualization and methodology, S.W. and W.L.; writing—review and editing, Y.L.; investigation and resources, Q.X., Y.G. (Yujin Gan), L.Y., Y.G. (Yue Gu), Z.L. and Y.H. All authors have read and agreed to the published version of the manuscript.

Funding

This research was funded by the Funding of Zhongyuan Scholars of Henan Provincial Health Commission (No. 224000510005).

Institutional Review Board Statement

The study protocol (approval number HNEECA–2020–12) was approved by the Animal Ethics Committee of Henan Eye Hospital/Henan Eye Institute and was performed in accordance with animal care guidelines.

Informed Consent Statement

Not applicable.

Data Availability Statement

The raw sequence data in this study are deposited publicly available at the Sequence Read Archive (SRA) at http://www.ncbi.nlm.nih.gov/bioproject/806364 (accessed on 2 September 2022) with BioProject ID PRJNA806364.

Acknowledgments

We would like to thank Yanliang Wang, Limeng Wang, Xiaojing Jiao, and Lina Zhang for their excellent technical assistance.

Conflicts of Interest

The authors declare no conflict of interest.

References

  1. Ronco, C.; Bellomo, R.; Kellum, J.A. Acute kidney injury. Lancet 2019, 394, 1949–1964. [Google Scholar] [CrossRef]
  2. Fu, H.; Zhou, D.; Zhu, H.; Liao, J.; Lin, L.; Hong, X.; Hou, F.F.; Liu, Y. Matrix metalloproteinase-7 protects against acute kidney injury by priming renal tubules for survival and regeneration. Kidney Int. 2019, 95, 1167–1180. [Google Scholar] [CrossRef]
  3. Holditch, S.J.; Brown, C.N.; Lombardi, A.M.; Nguyen, K.N.; Edelstein, C.L. Recent Advances in Models, Mechanisms, Biomarkers, and Interventions in Cisplatin-Induced Acute Kidney Injury. Int. J. Mol. Sci. 2019, 20, 3011. [Google Scholar] [CrossRef]
  4. Tanase, D.M.; Gosav, E.M.; Radu, S.; Costea, C.F.; Ciocoiu, M.; Carauleanu, A.; Lacatusu, C.M.; Maranduca, M.A.; Floria, M.; Rezus, C. The Predictive Role of the Biomarker Kidney Molecule-1 (KIM-1) in Acute Kidney Injury (AKI) Cisplatin-Induced Nephrotoxicity. Int. J. Mol. Sci. 2019, 20, 5238. [Google Scholar] [CrossRef] [PubMed]
  5. Kellum, J.A.; Lameire, N.; Group, K.A.G.W. Diagnosis, evaluation, and management of acute kidney injury: A KDIGO summary (Part 1). Crit. Care 2013, 17, 204. [Google Scholar] [CrossRef] [PubMed]
  6. Hoste, E.A.J.; Kellum, J.A.; Selby, N.M.; Zarbock, A.; Palevsky, P.M.; Bagshaw, S.M.; Goldstein, S.L.; Cerda, J.; Chawla, L.S. Global epidemiology and outcomes of acute kidney injury. Nat. Rev. Nephrol. 2018, 14, 607–625. [Google Scholar] [CrossRef]
  7. Ranganathan, P.; Hamad, R.; Mohamed, R.; Jayakumar, C.; Muthusamy, T.; Ramesh, G. Histone deacetylase-mediated silencing of AMWAP expression contributes to cisplatin nephrotoxicity. Kidney Int. 2016, 89, 317–326. [Google Scholar] [CrossRef]
  8. Li, C.M.; Li, M.; Ye, Z.C.; Huang, J.Y.; Li, Y.; Yao, Z.Y.; Peng, H.; Lou, T.Q. Circular RNA expression profiles in cisplatin-induced acute kidney injury in mice. Epigenomics 2019, 11, 1191–1207. [Google Scholar] [CrossRef] [PubMed]
  9. Fan, F.; Ping, Y.; Yang, L.; Duan, X.; Resegofetse Maimela, N.; Li, B.; Li, X.; Chen, J.; Zhang, K.; Wang, L.; et al. Characterization of a non-coding RNA-associated ceRNA network in metastatic lung adenocarcinoma. J. Cell Mol. Med. 2020, 24, 11680–11690. [Google Scholar] [CrossRef]
  10. Li, Y.; Ashraf, U.; Chen, Z.; Zhou, D.; Imran, M.; Ye, J.; Chen, H.; Cao, S. Genome-wide profiling of host-encoded circular RNAs highlights their potential role during the Japanese encephalitis virus-induced neuroinflammatory response. BMC Genom. 2020, 21, 409. [Google Scholar] [CrossRef] [PubMed]
  11. Wu, J.; Li, D.D.; Li, J.Y.; Yin, Y.C.; Li, P.C.; Qiu, L.; Chen, L.M. Identification of microRNA-mRNA networks involved in cisplatin-induced renal tubular epithelial cells injury. Eur. J. Pharmacol. 2019, 851, 1–12. [Google Scholar] [CrossRef] [PubMed]
  12. Fasolo, F.; Di Gregoli, K.; Maegdefessel, L.; Johnson, J.L. Non-coding RNAs in cardiovascular cell biology and atherosclerosis. Cardiovasc. Res. 2019, 115, 1732–1756. [Google Scholar] [CrossRef] [PubMed]
  13. Panni, S.; Lovering, R.C.; Porras, P.; Orchard, S. Non-coding RNA regulatory networks. Biochim. Biophys. Acta (BBA) Gene Regul. Mech. 2020, 1863, 194417. [Google Scholar] [CrossRef] [PubMed]
  14. Cheng, W.; Li, X.W.; Xiao, Y.Q.; Duan, S.B. Non-coding RNA-Associated ceRNA Networks in a New Contrast-Induced Acute Kidney Injury Rat Model. Mol. Ther. Nucleic Acids 2019, 17, 102–112. [Google Scholar] [CrossRef]
  15. Matsui, M.; Corey, D.R. Non-coding RNAs as drug targets. Nat. Rev. Drug Discov. 2017, 16, 167–179. [Google Scholar] [CrossRef] [PubMed]
  16. Ren, G.L.; Zhu, J.; Li, J.; Meng, X.M. Noncoding RNAs in acute kidney injury. J. Cell Physiol. 2019, 234, 2266–2276. [Google Scholar] [CrossRef] [PubMed]
  17. Zhang, Y.; Tang, P.M.; Niu, Y.; Garcia Cordoba, C.A.; Huang, X.R.; Yu, C.; Lan, H.Y. Long Non-coding RNA LRNA9884 Promotes Acute Kidney Injury via Regulating NF-kB-Mediated Transcriptional Activation of MIF. Front. Physiol. 2020, 11, 590027. [Google Scholar] [CrossRef] [PubMed]
  18. Brandenburger, T.; Salgado Somoza, A.; Devaux, Y.; Lorenzen, J.M. Noncoding RNAs in acute kidney injury. Kidney Int. 2018, 94, 870–881. [Google Scholar] [CrossRef]
  19. Shi, Y.; Sun, C.F.; Ge, W.H.; Du, Y.P.; Hu, N.B. Circular RNA VMA21 ameliorates sepsis-associated acute kidney injury by regulating miR-9-3p/SMG1/inflammation axis and oxidative stress. J. Cell Mol. Med. 2020, 24, 11397–11408. [Google Scholar] [CrossRef] [PubMed]
  20. Ledeganck, K.J.; Gielis, E.M.; Abramowicz, D.; Stenvinkel, P.; Shiels, P.G.; Van Craenenbroeck, A.H. MicroRNAs in AKI and Kidney Transplantation. Clin. J. Am. Soc. Nephrol. 2019, 14, 454–468. [Google Scholar] [CrossRef] [Green Version]
  21. Wang, S.; Zhang, Z.; Wang, J.; Miao, H. MiR-107 induces TNF-alpha secretion in endothelial cells causing tubular cell injury in patients with septic acute kidney injury. Biochem. Biophys. Res. Commun. 2017, 483, 45–51. [Google Scholar] [CrossRef] [PubMed]
  22. Chen, H.H.; Lan, Y.F.; Li, H.F.; Cheng, C.F.; Lai, P.F.; Li, W.H.; Lin, H. Urinary miR-16 transactivated by C/EBPbeta reduces kidney function after ischemia/reperfusion-induced injury. Sci. Rep. 2016, 6, 27945. [Google Scholar] [CrossRef]
  23. Ge, Q.M.; Huang, C.M.; Zhu, X.Y.; Bian, F.; Pan, S.M. Differentially expressed miRNAs in sepsis-induced acute kidney injury target oxidative stress and mitochondrial dysfunction pathways. PLoS ONE 2017, 12, e0173292. [Google Scholar] [CrossRef]
  24. Hu, Z.; Zhang, H.; Yi, B.; Yang, S.; Liu, J.; Hu, J.; Wang, J.; Cao, K.; Zhang, W. VDR activation attenuate cisplatin induced AKI by inhibiting ferroptosis. Cell Death Dis. 2020, 11, 73. [Google Scholar] [CrossRef] [PubMed]
  25. Bolger, A.M.; Lohse, M.; Usadel, B. Trimmomatic: A flexible trimmer for Illumina sequence data. Bioinformatics 2014, 30, 2114–2120. [Google Scholar] [CrossRef] [PubMed]
  26. Langmead, B.; Salzberg, S.L. Fast gapped-read alignment with Bowtie 2. Nat. Methods 2012, 9, 357–359. [Google Scholar] [CrossRef] [PubMed]
  27. Roberts, A.; Pachter, L. Streaming fragment assignment for real-time analysis of sequencing experiments. Nat. Methods 2013, 10, 71–73. [Google Scholar] [CrossRef]
  28. Yu, G.; Wang, L.G.; Han, Y.; He, Q.Y. clusterProfiler: An R package for comparing biological themes among gene clusters. Omics 2012, 16, 284–287. [Google Scholar] [CrossRef] [PubMed]
  29. Anders, S.; Huber, W. Differential expression of RNA-Seq data at the gene level–the DESeq package. Heidelb. Ger. Eur. Mol. Biol. Lab. (EMBL) 2012, 10, f1000research. [Google Scholar]
  30. Langmead, B. Aligning short sequencing reads with Bowtie. Curr. Protoc. Bioinform. 2010, 32, 11.7.1–11.7.14. [Google Scholar] [CrossRef] [PubMed]
  31. Griffiths-Jones, S.; Saini, H.K.; van Dongen, S.; Enright, A.J. miRBase: Tools for microRNA genomics. Nucleic Acids Res. 2008, 36, D154–D158. [Google Scholar] [CrossRef] [PubMed] [Green Version]
  32. Enright, A.J.; John, B.; Gaul, U.; Tuschl, T.; Sander, C.; Marks, D.S. MicroRNA targets in Drosophila. Genome Biol. 2003, 5, R1. [Google Scholar] [CrossRef] [PubMed]
  33. Shannon, P.T.; Grimes, M.; Kutlu, B.; Bot, J.J.; Galas, D.J. RCytoscape: Tools for exploratory network analysis. BMC Bioinform. 2013, 14, 217. [Google Scholar] [CrossRef] [PubMed]
  34. Garcia-Alonso, L.; Holland, C.H.; Ibrahim, M.M.; Turei, D.; Saez-Rodriguez, J. Benchmark and integration of resources for the estimation of human transcription factor activities. Genome Res. 2019, 29, 1363–1375. [Google Scholar] [CrossRef]
  35. Kolde, R. Package ‘pheatmap’. R Package 2015, 1, 790. [Google Scholar]
  36. Livak, K.J.; Schmittgen, T.D. Analysis of relative gene expression data using real-time quantitative PCR and the 2(-Delta Delta C(T)) Method. Methods 2001, 25, 402–408. [Google Scholar] [CrossRef]
  37. Levey, A.S.; James, M.T. Acute Kidney Injury. Ann. Intern. Med. 2017, 167, ITC66–ITC80. [Google Scholar] [CrossRef]
  38. Perazella, M.A. Pharmacology behind Common Drug Nephrotoxicities. Clin. J. Am. Soc. Nephrol. 2018, 13, 1897–1908. [Google Scholar] [CrossRef]
  39. Cortazar, F.B.; Marrone, K.A.; Troxell, M.L.; Ralto, K.M.; Hoenig, M.P.; Brahmer, J.R.; Le, D.T.; Lipson, E.J.; Glezerman, I.G.; Wolchok, J.; et al. Clinicopathological features of acute kidney injury associated with immune checkpoint inhibitors. Kidney Int. 2016, 90, 638–647. [Google Scholar] [CrossRef]
  40. Vaz, M.; Rajasekaran, S.; Potteti, H.R.; Reddy, S.P. Myeloid-specific Fos-related antigen-1 regulates cigarette smoke-induced lung inflammation, not emphysema, in mice. Am. J. Respir. Cell Mol. Biol. 2015, 53, 125–134. [Google Scholar] [CrossRef]
  41. Liu, K.; Zhao, E.; Ilyas, G.; Lalazar, G.; Lin, Y.; Haseeb, M.; Tanaka, K.E.; Czaja, M.J. Impaired macrophage autophagy increases the immune response in obese mice by promoting proinflammatory macrophage polarization. Autophagy 2015, 11, 271–284. [Google Scholar] [CrossRef] [PubMed]
  42. Sadtler, K.; Wolf, M.T.; Ganguly, S.; Moad, C.A.; Chung, L.; Majumdar, S.; Housseau, F.; Pardoll, D.M.; Elisseeff, J.H. Divergent immune responses to synthetic and biological scaffolds. Biomaterials 2019, 192, 405–415. [Google Scholar] [CrossRef] [PubMed]
  43. Rudman-Melnick, V.; Adam, M.; Potter, A.; Chokshi, S.M.; Ma, Q.; Drake, K.A.; Schuh, M.P.; Kofron, J.M.; Devarajan, P.; Potter, S.S. Single-Cell Profiling of AKI in a Murine Model Reveals Novel Transcriptional Signatures, Profibrotic Phenotype, and Epithelial-to-Stromal Crosstalk. J. Am. Soc. Nephrol. 2020, 31, 2793–2814. [Google Scholar] [CrossRef] [PubMed]
  44. Ho, Y.T.; Shimbo, T.; Wijaya, E.; Kitayama, T.; Takaki, S.; Ikegami, K.; Miyashita, K.; Ouchi, Y.; Takaki, E.; Yamamoto, R.; et al. Longitudinal Single-Cell Transcriptomics Reveals a Role for Serpina3n-Mediated Resolution of Inflammation in a Mouse Colitis Model. Cell Mol. Gastroenterol. Hepatol. 2021, 12, 547–566. [Google Scholar] [CrossRef] [PubMed]
  45. Tiemin, P.; Fanzheng, M.; Peng, X.; Jihua, H.; Ruipeng, S.; Yaliang, L.; Yan, W.; Junlin, X.; Qingfu, L.; Zhefeng, H.; et al. MUC13 promotes intrahepatic cholangiocarcinoma progression via EGFR/PI3K/AKT pathways. J. Hepatol. 2020, 72, 761–773. [Google Scholar] [CrossRef]
  46. Zhao, Y.; Feng, X.; Li, B.; Sha, J.; Wang, C.; Yang, T.; Cui, H.; Fan, H. Dexmedetomidine Protects Against Lipopolysaccharide-Induced Acute Kidney Injury by Enhancing Autophagy Through Inhibition of the PI3K/AKT/mTOR Pathway. Front. Pharmacol. 2020, 11, 128. [Google Scholar] [CrossRef]
  47. Zhou, Y.; Yang, Y.; Liang, T.; Hu, Y.; Tang, H.; Song, D.; Fang, H. The regulatory effect of microRNA-21a-3p on the promotion of telocyte angiogenesis mediated by PI3K (p110alpha)/AKT/mTOR in LPS induced mice ARDS. J. Transl. Med. 2019, 17, 427. [Google Scholar] [CrossRef]
  48. Nagamori, S.; Wiriyasermkul, P.; Guarch, M.E.; Okuyama, H.; Nakagomi, S.; Tadagaki, K.; Nishinaka, Y.; Bodoy, S.; Takafuji, K.; Okuda, S.; et al. Novel cystine transporter in renal proximal tubule identified as a missing partner of cystinuria-related plasma membrane protein rBAT/SLC3A1. Proc. Natl. Acad. Sci. USA 2016, 113, 775–780. [Google Scholar] [CrossRef]
  49. Suckale, J.; Solimena, M. The insulin secretory granule as a signaling hub. Trends Endocrinol. Metab. 2010, 21, 599–609. [Google Scholar] [CrossRef]
  50. Xue, X.X.; Lei, H.Q.; Zhao, L.; Wang, X.Y.; Wang, Z.; Xie, L.Y.; Jia, J.H. MiR-185-3p downregulates advanced glycosylation end product receptor expression and improves renal function in diabetic nephropathy mice. Eur. Rev. Med. Pharmacol. Sci. 2020, 24, 5018–5027. [Google Scholar] [CrossRef]
  51. Liu, P.; Li, X.; Lv, W.; Xu, Z. Inhibition of CXCL1-CXCR2 axis ameliorates cisplatin-induced acute kidney injury by mediating inflammatory response. Biomed. Pharmacother. 2020, 122, 109693. [Google Scholar] [CrossRef] [PubMed]
  52. Li, W.; Wang, H.Y.; Zhao, X.; Duan, H.; Cheng, B.; Liu, Y.; Zhao, M.; Shu, W.; Mei, Y.; Wen, Z.; et al. A methylation-phosphorylation switch determines Plk1 kinase activity and function in DNA damage repair. Sci. Adv. 2019, 5, eaau7566. [Google Scholar] [CrossRef] [PubMed] [Green Version]
  53. Chen, W.; Yuan, H.; Cao, W.; Wang, T.; Chen, W.; Yu, H.; Fu, Y.; Jiang, B.; Zhou, H.; Guo, H.; et al. Blocking interleukin-6 trans-signaling protects against renal fibrosis by suppressing STAT3 activation. Theranostics 2019, 9, 3980–3991. [Google Scholar] [CrossRef] [PubMed]
  54. Lei, C.T.; Su, H.; Ye, C.; Tang, H.; Gao, P.; Wan, C.; He, F.F.; Wang, Y.M.; Zhang, C. The classic signalling and trans-signalling of interleukin-6 are both injurious in podocyte under high glucose exposure. J. Cell Mol. Med. 2018, 22, 251–260. [Google Scholar] [CrossRef] [PubMed]
  55. Jung, Y.J.; Lee, A.S.; Nguyen-Thanh, T.; Kim, D.; Kang, K.P.; Lee, S.; Park, S.K.; Kim, W. SIRT2 Regulates LPS-Induced Renal Tubular CXCL2 and CCL2 Expression. J. Am. Soc. Nephrol. 2015, 26, 1549–1560. [Google Scholar] [CrossRef]
  56. De Filippo, K.; Dudeck, A.; Hasenberg, M.; Nye, E.; van Rooijen, N.; Hartmann, K.; Gunzer, M.; Roers, A.; Hogg, N. Mast cell and macrophage chemokines CXCL1/CXCL2 control the early stage of neutrophil recruitment during tissue inflammation. Blood 2013, 121, 4930–4937. [Google Scholar] [CrossRef]
  57. De Blasio, C.; Zonfrilli, A.; Franchitto, M.; Mariano, G.; Cialfi, S.; Verma, N.; Checquolo, S.; Bellavia, D.; Palermo, R.; Benelli, D.; et al. PLK1 targets NOTCH1 during DNA damage and mitotic progression. J. Biol. Chem. 2019, 294, 17941–17950. [Google Scholar] [CrossRef]
  58. Ajay, A.K.; Kim, T.M.; Ramirez-Gonzalez, V.; Park, P.J.; Frank, D.A.; Vaidya, V.S. A bioinformatics approach identifies signal transducer and activator of transcription-3 and checkpoint kinase 1 as upstream regulators of kidney injury molecule-1 after kidney injury. J. Am. Soc. Nephrol. 2014, 25, 105–118. [Google Scholar] [CrossRef]
  59. Zhu, H.; Wang, X.; Wang, X.; Liu, B.; Yuan, Y.; Zuo, X. Curcumin attenuates inflammation and cell apoptosis through regulating NF-kappaB and JAK2/STAT3 signaling pathway against acute kidney injury. Cell Cycle 2020, 19, 1941–1951. [Google Scholar] [CrossRef]
  60. Zhang, L.; Lu, P.; Guo, X.; Liu, T.; Luo, X.; Zhu, Y.T. Inhibition of JAK2/STAT3 signaling pathway protects mice from the DDP-induced acute kidney injury in lung cancer. Inflamm. Res. 2019, 68, 751–760. [Google Scholar] [CrossRef]
  61. Chang-Panesso, M.; Kadyrov, F.F.; Lalli, M.; Wu, H.; Ikeda, S.; Kefaloyianni, E.; Abdelmageed, M.M.; Herrlich, A.; Kobayashi, A.; Humphreys, B.D. FOXM1 drives proximal tubule proliferation during repair from acute ischemic kidney injury. J. Clin. Investig. 2019, 129, 5501–5517. [Google Scholar] [CrossRef] [PubMed]
  62. Sinha, S.; Dwivedi, N.; Woodgett, J.; Tao, S.; Howard, C.; Fields, T.A.; Jamadar, A.; Rao, R. Glycogen synthase kinase-3beta inhibits tubular regeneration in acute kidney injury by a FoxM1-dependent mechanism. FASEB J. 2020, 34, 13597–13608. [Google Scholar] [CrossRef] [PubMed]
  63. Kaushal, G.P.; Kaushal, V.; Herzog, C.; Yang, C. Autophagy delays apoptosis in renal tubular epithelial cells in cisplatin cytotoxicity. Autophagy 2008, 4, 710–712. [Google Scholar] [CrossRef] [PubMed]
  64. Shen, X.; Wang, H.; Weng, C.; Jiang, H.; Chen, J. Caspase 3/GSDME-dependent pyroptosis contributes to chemotherapy drug-induced nephrotoxicity. Cell Death Dis. 2021, 12, 186. [Google Scholar] [CrossRef] [PubMed]
  65. Chiu, H.S.; Martinez, M.R.; Komissarova, E.V.; Llobet-Navas, D.; Bansal, M.; Paull, E.O.; Silva, J.; Yang, X.; Sumazin, P.; Califano, A. The number of titrated microRNA species dictates ceRNA regulation. Nucleic Acids Res. 2018, 46, 4354–4369. [Google Scholar] [CrossRef] [PubMed]
  66. Hara, M.; Torisu, K.; Tomita, K.; Kawai, Y.; Tsuruya, K.; Nakano, T.; Kitazono, T. Arginase 2 is a mediator of ischemia-reperfusion injury in the kidney through regulation of nitrosative stress. Kidney Int. 2020, 98, 673–685. [Google Scholar] [CrossRef]
  67. Mallipattu, S.K.; Horne, S.J.; D'Agati, V.; Narla, G.; Liu, R.; Frohman, M.A.; Dickman, K.; Chen, E.Y.; Ma'ayan, A.; Bialkowska, A.B.; et al. Kruppel-like factor 6 regulates mitochondrial function in the kidney. J. Clin. Investig. 2015, 125, 1347–1361. [Google Scholar] [CrossRef]
  68. Zhang, C.; Wang, S.; Li, J.; Zhang, W.; Zheng, L.; Yang, C.; Zhu, T.; Rong, R. The mTOR signal regulates myeloid-derived suppressor cells differentiation and immunosuppressive function in acute kidney injury. Cell Death Dis. 2017, 8, e2695. [Google Scholar] [CrossRef]
  69. Herzog, C.; Seth, R.; Shah, S.V.; Kaushal, G.P. Role of meprin A in renal tubular epithelial cell injury. Kidney Int. 2007, 71, 1009–1018. [Google Scholar] [CrossRef]
  70. Marchese, F.P.; Grossi, E.; Marin-Bejar, O.; Bharti, S.K.; Raimondi, I.; Gonzalez, J.; Martinez-Herrera, D.J.; Athie, A.; Amadoz, A.; Brosh, R.M., Jr.; et al. A Long Noncoding RNA Regulates Sister Chromatid Cohesion. Mol. Cell 2016, 63, 397–407. [Google Scholar] [CrossRef]
  71. Haddad, G.; Kolling, M.; Wegmann, U.A.; Dettling, A.; Seeger, H.; Schmitt, R.; Soerensen-Zender, I.; Haller, H.; Kistler, A.D.; Dueck, A.; et al. Renal AAV2-Mediated Overexpression of Long Non-Coding RNA H19 Attenuates Ischemic Acute Kidney Injury Through Sponging of microRNA-30a-5p. J. Am. Soc. Nephrol. 2021, 32, 323–341. [Google Scholar] [CrossRef] [PubMed]
  72. Ma, T.; Jia, H.; Ji, P.; He, Y.; Chen, L. Identification of the candidate lncRNA biomarkers for acute kidney injury: A systematic review and meta-analysis. Expert Rev. Mol. Diagn. 2021, 21, 77–89. [Google Scholar] [CrossRef] [PubMed]
  73. Cao, J.Y.; Wang, B.; Tang, T.T.; Wen, Y.; Li, Z.L.; Feng, S.T.; Wu, M.; Liu, D.; Yin, D.; Ma, K.L.; et al. Exosomal miR-125b-5p deriving from mesenchymal stem cells promotes tubular repair by suppression of p53 in ischemic acute kidney injury. Theranostics 2021, 11, 5248–5266. [Google Scholar] [CrossRef] [PubMed]
  74. Lv, L.L.; Feng, Y.; Wu, M.; Wang, B.; Li, Z.L.; Zhong, X.; Wu, W.J.; Chen, J.; Ni, H.F.; Tang, T.T.; et al. Exosomal miRNA-19b-3p of tubular epithelial cells promotes M1 macrophage activation in kidney injury. Cell Death Differ. 2020, 27, 210–226. [Google Scholar] [CrossRef] [PubMed]
Figure 1. Cisplatin-induced acute kidney injury (CP-AKI) mouse model. (A) Experimental design workflow. (B) Representative photomicrographs of tubular cell injuries in mouse kidney tissues (hematoxylin and eosin (H&E) staining; original magnification, 200×) and representative photomicrographs of mitochondrial ultrastructural changes in renal tubular epithelial cells (original magnification, 5000×). (C) Quantitative analysis of histologic scoring (n = 5 in each group). (D) Immunofluorescent labeling for terminal deoxynucleotidyl transferase dUTP nick-end labeling (TUNEL) in mouse kidney tissue sections of the two groups (original magnification, 200×). Apoptotic cells in mouse kidney tissues were evaluated using TUNEL staining (green). Nuclei were stained with 4′,6-diamidino-2-phenylindole (DAPI) (blue). (E) Quantitative analysis of TUNEL-positive cells (n = 4 in each group). Over 200 cells in each group were evaluated to determine the percentage of TUNEL-positive cells. **** p < 0.0001.
Cells 11 02971 g001
Figure 2. Expression profiles revealed by whole-transcriptome RNA sequencing (RNA-seq). (A) Principal component analysis (PCA) of control and CP-AKI samples. (B) Spearman correlation analysis among samples. (C) Volcano plot of the CP-AKI group’s differentially expressed genes (DEGs) versus the control group. (D,E) Gene set enrichment analysis (GSEA) of the CP-AKI group versus the control group by clusterProfiler. Gene Ontology (GO) (D) and Kyoto Encyclopedia of Genes Genomes (KEGG) pathways (E) were analyzed at the mRNA level. p < 0.05 was considered to indicate significant differences.
Cells 11 02971 g002
Figure 3. Upregulated mRNA and non-coding RNA (ncRNA) expression levels: the CP-AKI model versus the control group. (A) Differential expression analysis of mRNAs, quantified as fragments per kilobase of exons per million fragments mapped (FPKM). (B) Differential expression analysis of long non-coding RNAs (lncRNAs), quantified as FPKM. (C) Differential expression analysis of circular RNAs (circRNAs), quantified as reads per million (RPM). (D) Differential expression analysis of microRNAs (miRNAs), quantified as transcripts per million (TPM). n = 4. * p < 0.05, ** p < 0.01, *** p < 0.001, **** p < 0.0001.
Cells 11 02971 g003
Figure 4. Construction of lncRNA- or circRNA-associated competing endogenous RNA (ceRNA) network. (A) LncRNA-associated ceRNA networks in CP-AKI mice. (B) CircRNA-associated ceRNA networks in CP-AKI mice. The circular frames denote lncRNAs or circRNAs, octagonal nodes represent mRNAs, and square nodes indicate miRNAs. (C) Validation of transcript expression by quantitative real-time PCR (RT-qPCR) between CP-AKI and control mice (n = 3, respectively). * p < 0.05, ** p < 0.01, *** p < 0.001, **** p < 0.0001; ns, not significant.
Cells 11 02971 g004
Figure 5. Construction and validation of the protein–protein interaction (PPI) network. (A) The PPI network of upregulated mRNAs in CP-AKI versus control mice. (B) Top 20 hub genes from PPI networks. (C) Relative expression (FPKM) levels of Il6, Cxcl1, Cxcl2, and Plk1 in control and CP-AKI mouse kidneys according to RNA-seq (n = 4). (D) Validation of Il6, Cxcl1, Cxcl2, and Plk1 expression levels by RT-qPCR between the two groups (n = 3, respectively). * p < 0.05, *** p < 0.001, **** p < 0.0001.
Cells 11 02971 g005
Figure 6. Classification of transcription factors (TFs): CP-AKI versus control mice. (A) Activated TFs in CP-AKI and control mice. (B) Relative expression (FPKM) levels of Stat3, Cebpb, and Foxm1 from RNA-seq results (n = 4). (C) Validation of Stat3, Cebpb, and Foxm1 expression levels by RT-qPCR between the two groups (n = 3, respectively). * p < 0.05, ** p < 0.01, **** p < 0.0001.
Cells 11 02971 g006
Publisher’s Note: MDPI stays neutral with regard to jurisdictional claims in published maps and institutional affiliations.

