
Effects of Oxygen Tension for Membrane Lipidome Remodeling of Cockayne Syndrome Cell Models

 ,
,  ,
,  ,
,  ,
, 
Abstract
:
1. Introduction
2. Materials and Methods
2.1. Materials
2.2. Cell Cultures
2.3. Phospholipid Extraction and Fatty Acid Analysis
2.4. Statistical Analysis
3. Results
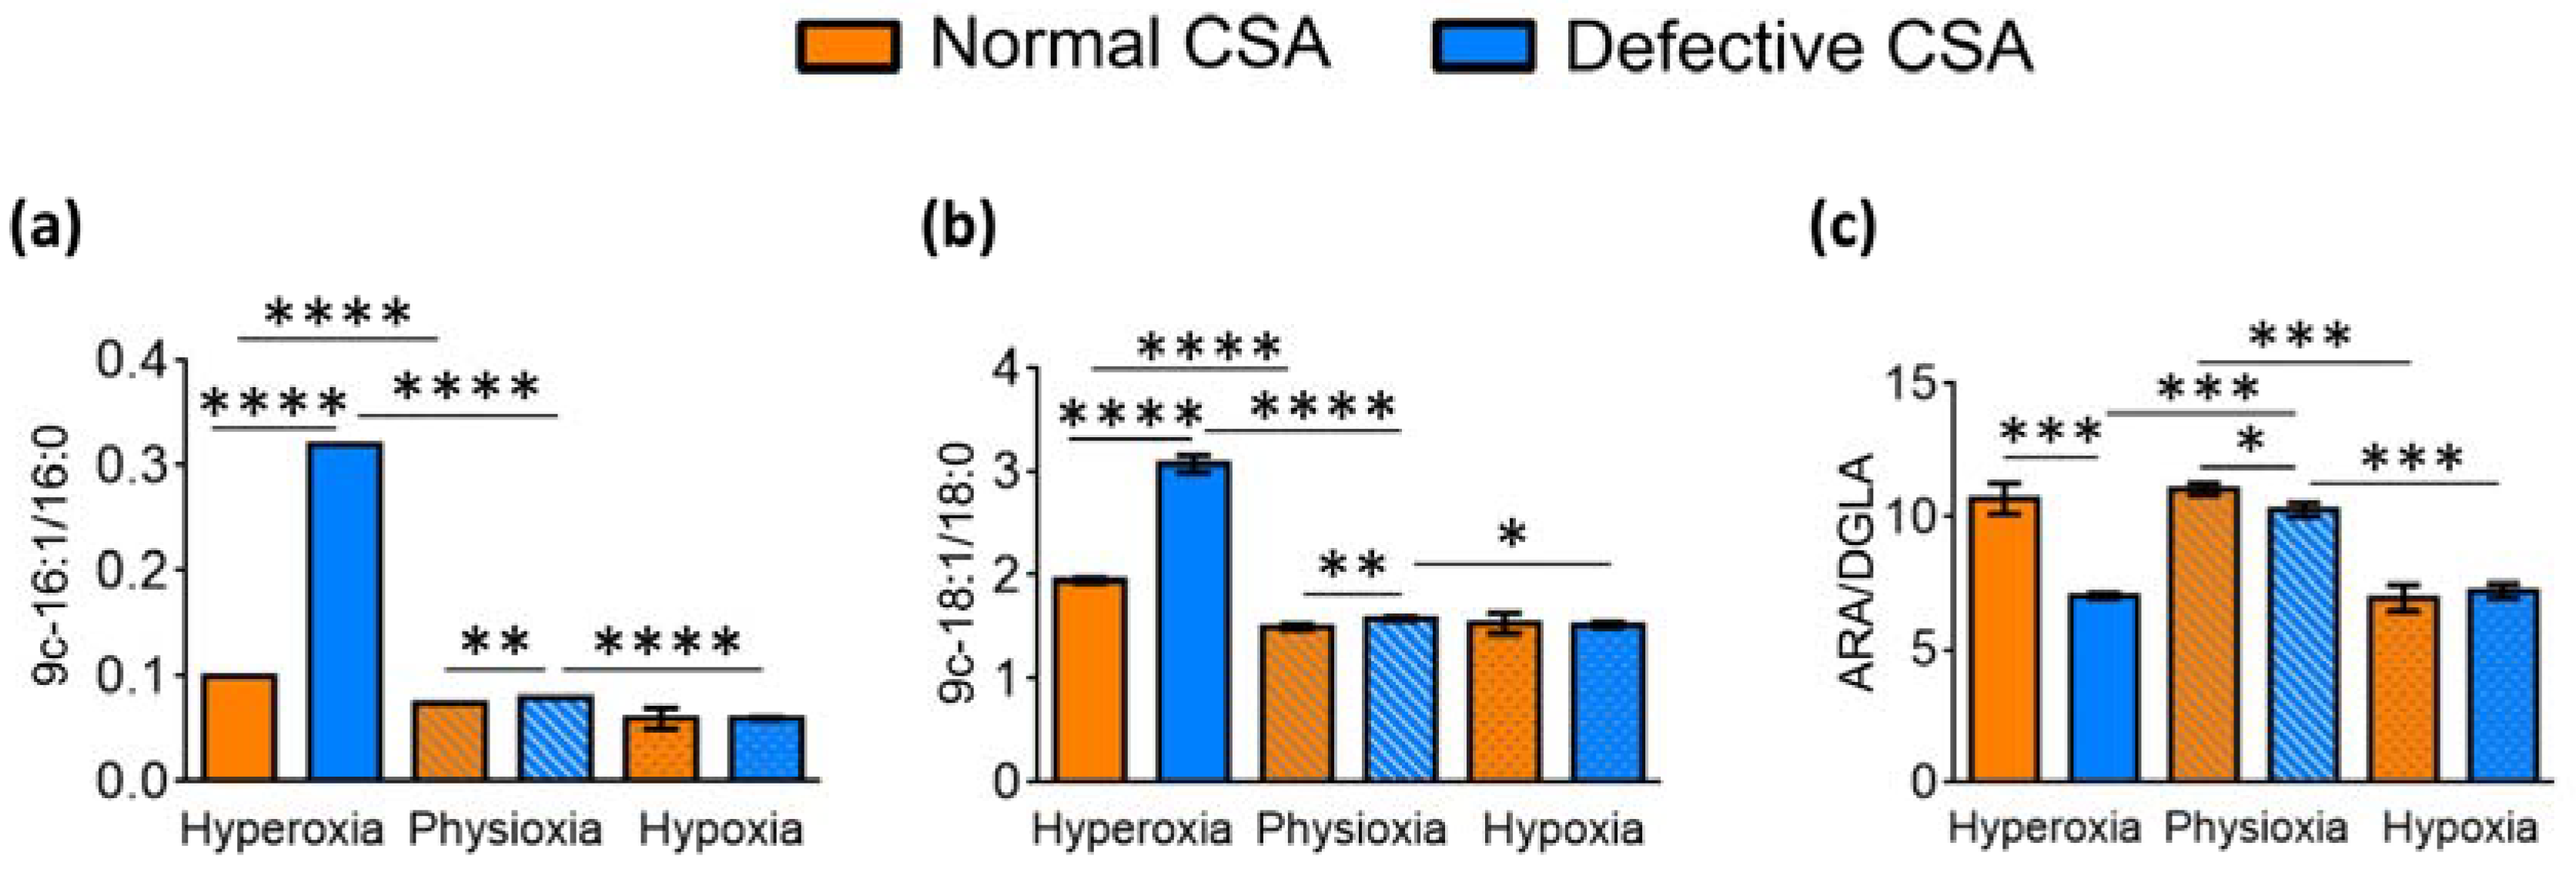
3.1. FAME Levels in Normal and Defective CSA Cells
- (i)
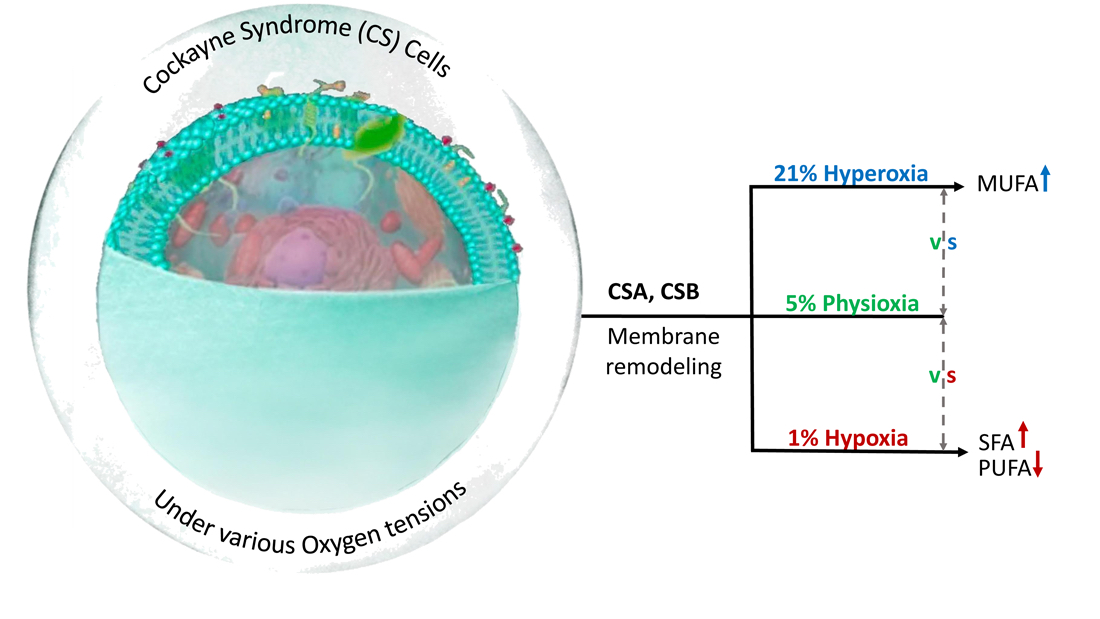
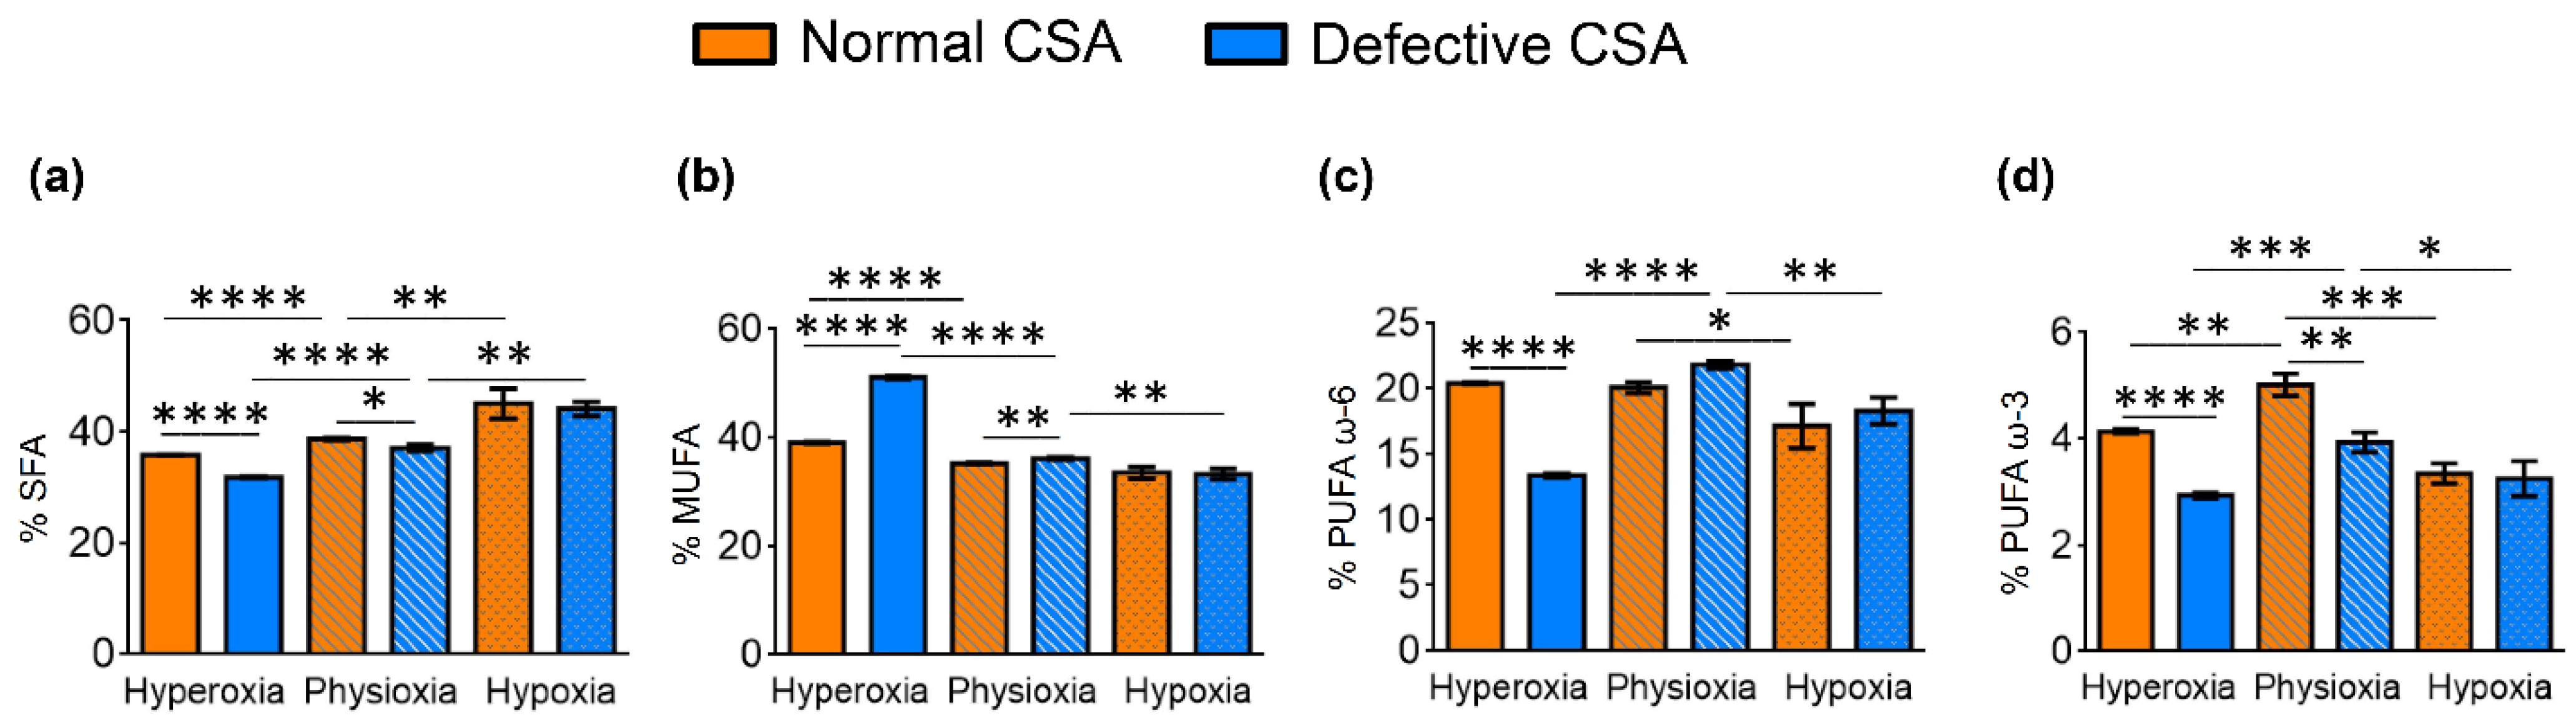
- The significant decrease in SFA (16:0 and 18:0) and significant increase in MUFA (6c-16:1, 9c-16:1, 9c-18:1 and 11c-18:1) production;
- (ii)
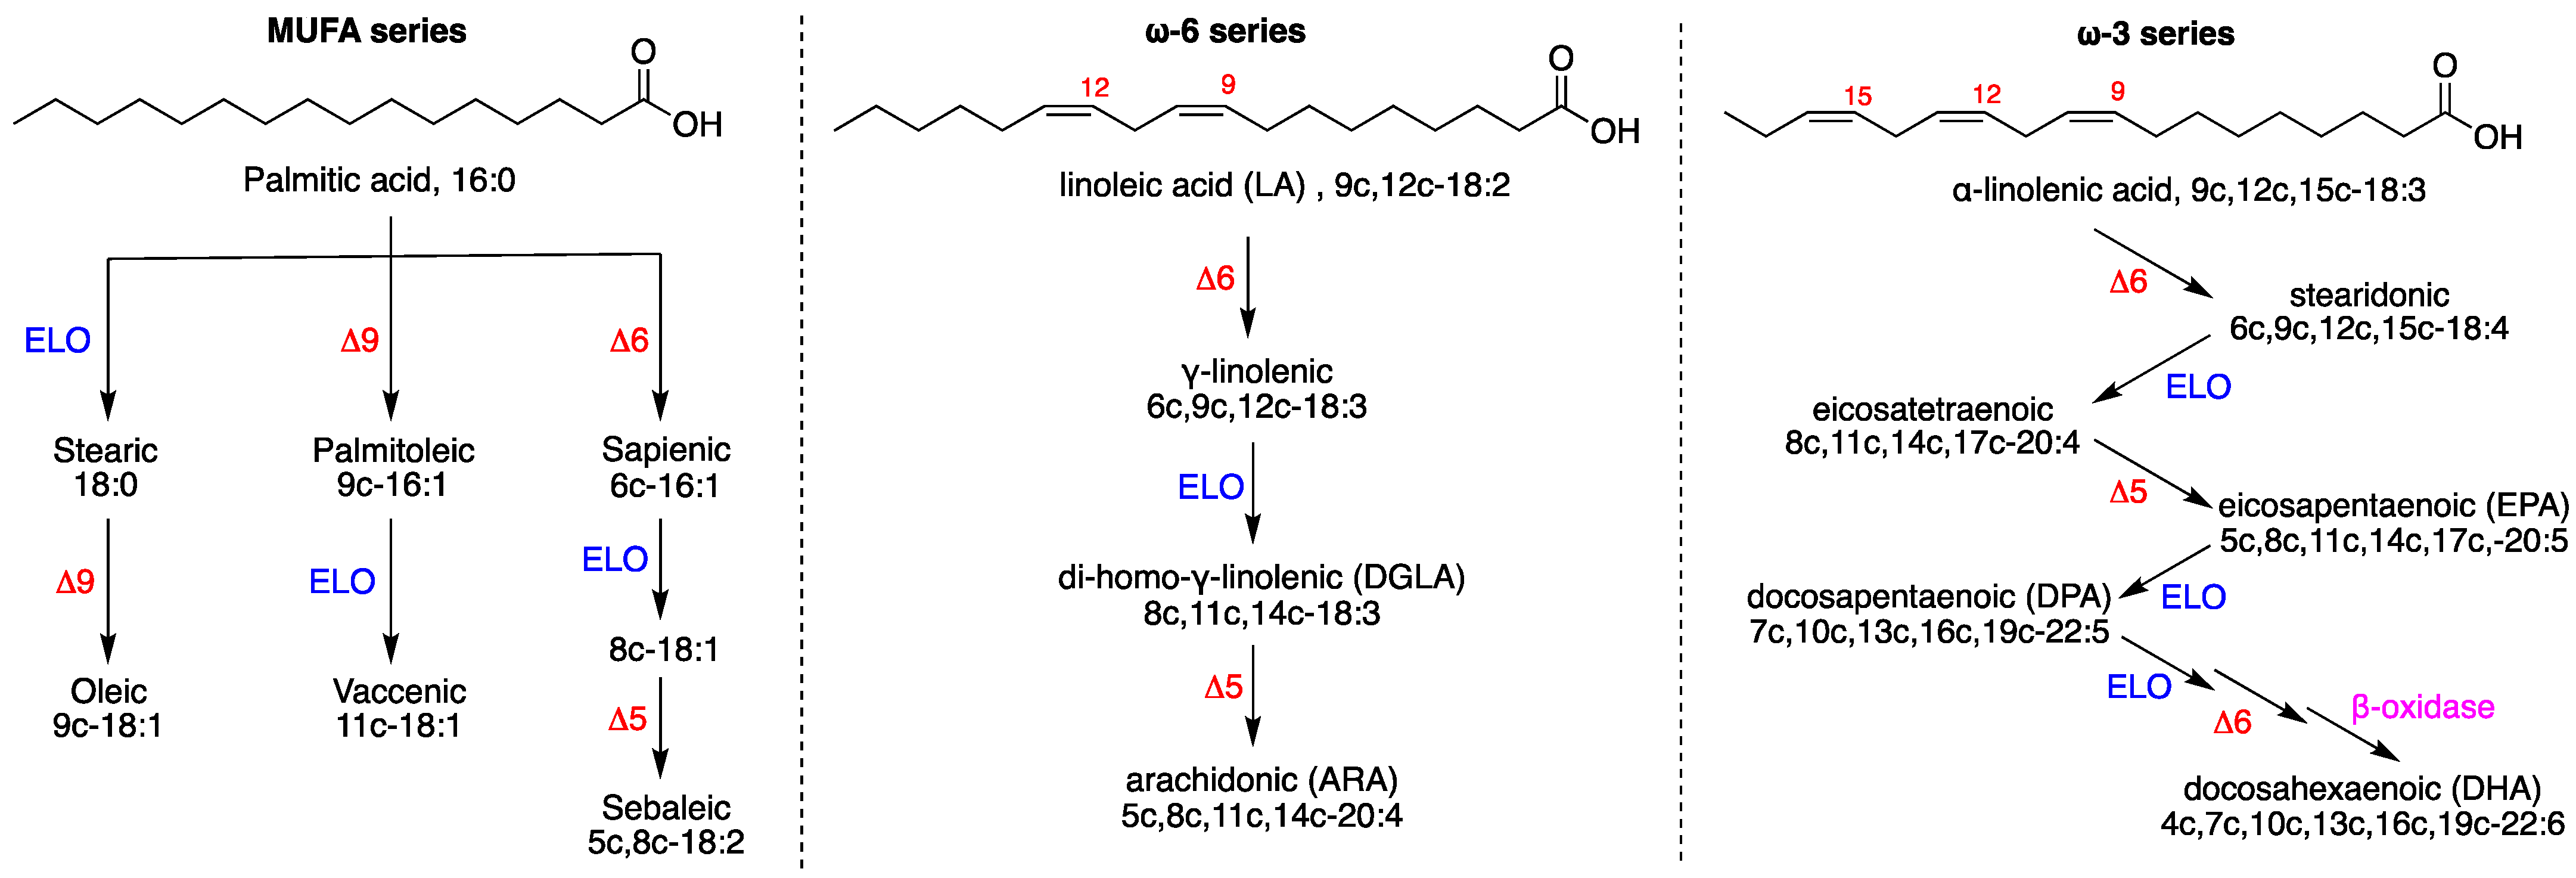
- PUFA ω6 increase due to the accelerated transformation of the precursor 18:2 (LA) into 20:3 (DGLA) and 20:4 (ARA) (cf. Figure 1);
- (iii)
- For PUFA ω3, hyperoxic conditions were deleterious for the three components (EPA, DPA, DHA) compared with physioxic conditions;
- (iv)
- It is worth noting that in the normal CSA cells, free radical stress, expressed by the formation of TFA, reached the highest level under hyperoxic conditions. We recall that TFA formation is connected with the radical-catalyzed cis–trans isomerization of the fatty acid double bonds, mainly due to the formation of endogenous sulfur-centered radicals [51,52];
- (v)
- The ω10 FA family, which expresses the Δ6 desaturase activity directly on palmitic acid (cf. Figure 1, left side), increased under hyperoxic conditions, especially with the levels of sapienic (6c-16:1), 8c-18:1 and sebaleic (5c,8c-18:2) acids.
- (i)
- A significant increase in SFA (16:0 and 14:0);
- (ii)
- A decrease in ω7 MUFA vaccenic acid (11c-18:1), but an increase in ω10 MUFA (8c-18:1);
- (iii)
- A decrease in PUFA ω6 transformation, in particular to 20:4 (ARA), with accumulation of the precursor linoleic acid, which is not transformed (cf. Figure 1);
- (iv)
- A decrease in PUFA ω3, which was particularly significant for DHA.
- (i)
- The observed changes were similar to the normal cell line under hyperoxia in the SFA–MUFA conversion, with an even more relevant production of 9c-16:1, 9c-18:1, 11c-18:1 and of the ω10 MUFA (6c-16:1 and 8c-18:1);
- (ii)
- For PUFA ω6, hyperoxic conditions led to the diminution of the levels of LA, DGLA and ARA and total ω6;
- (iii)
- PUFA ω3 responded with the diminution of DPA and DHA, whereas EPA increased;
- (iv)
- TFA reached the highest content.
- (i)
- Hypoxia did not create significant fatty acid differences in the FA families;
- (ii)
- Under physioxia, normal cells compared to defective cells had more MUFA ω9 and less SFA, as well as less PUFA ω3, in particular DPA and DHA;
- (iii)
- Hyperoxia created the most relevant changes between the two cell lines, with defective cells showing a decrease in SFA, strong increase in MUFA, decrease in PUFA (except for the increase in ω6 20:2 and the ω3 EPA) and an increase in total TFA.
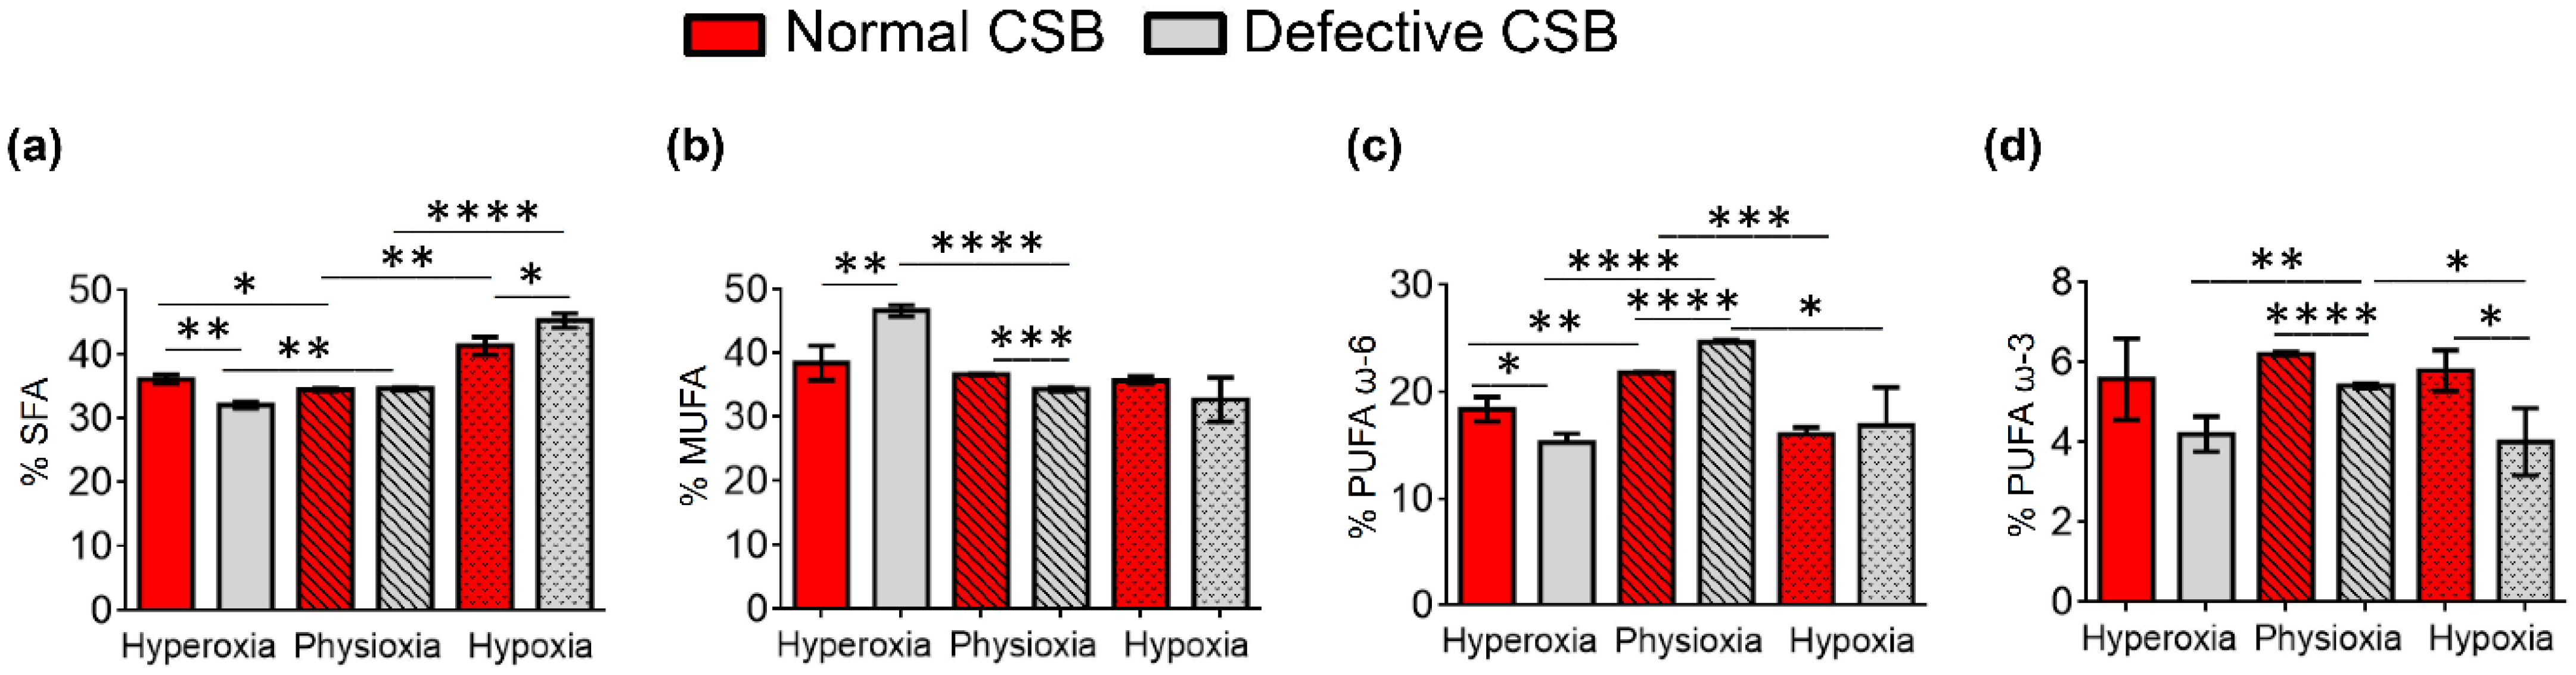
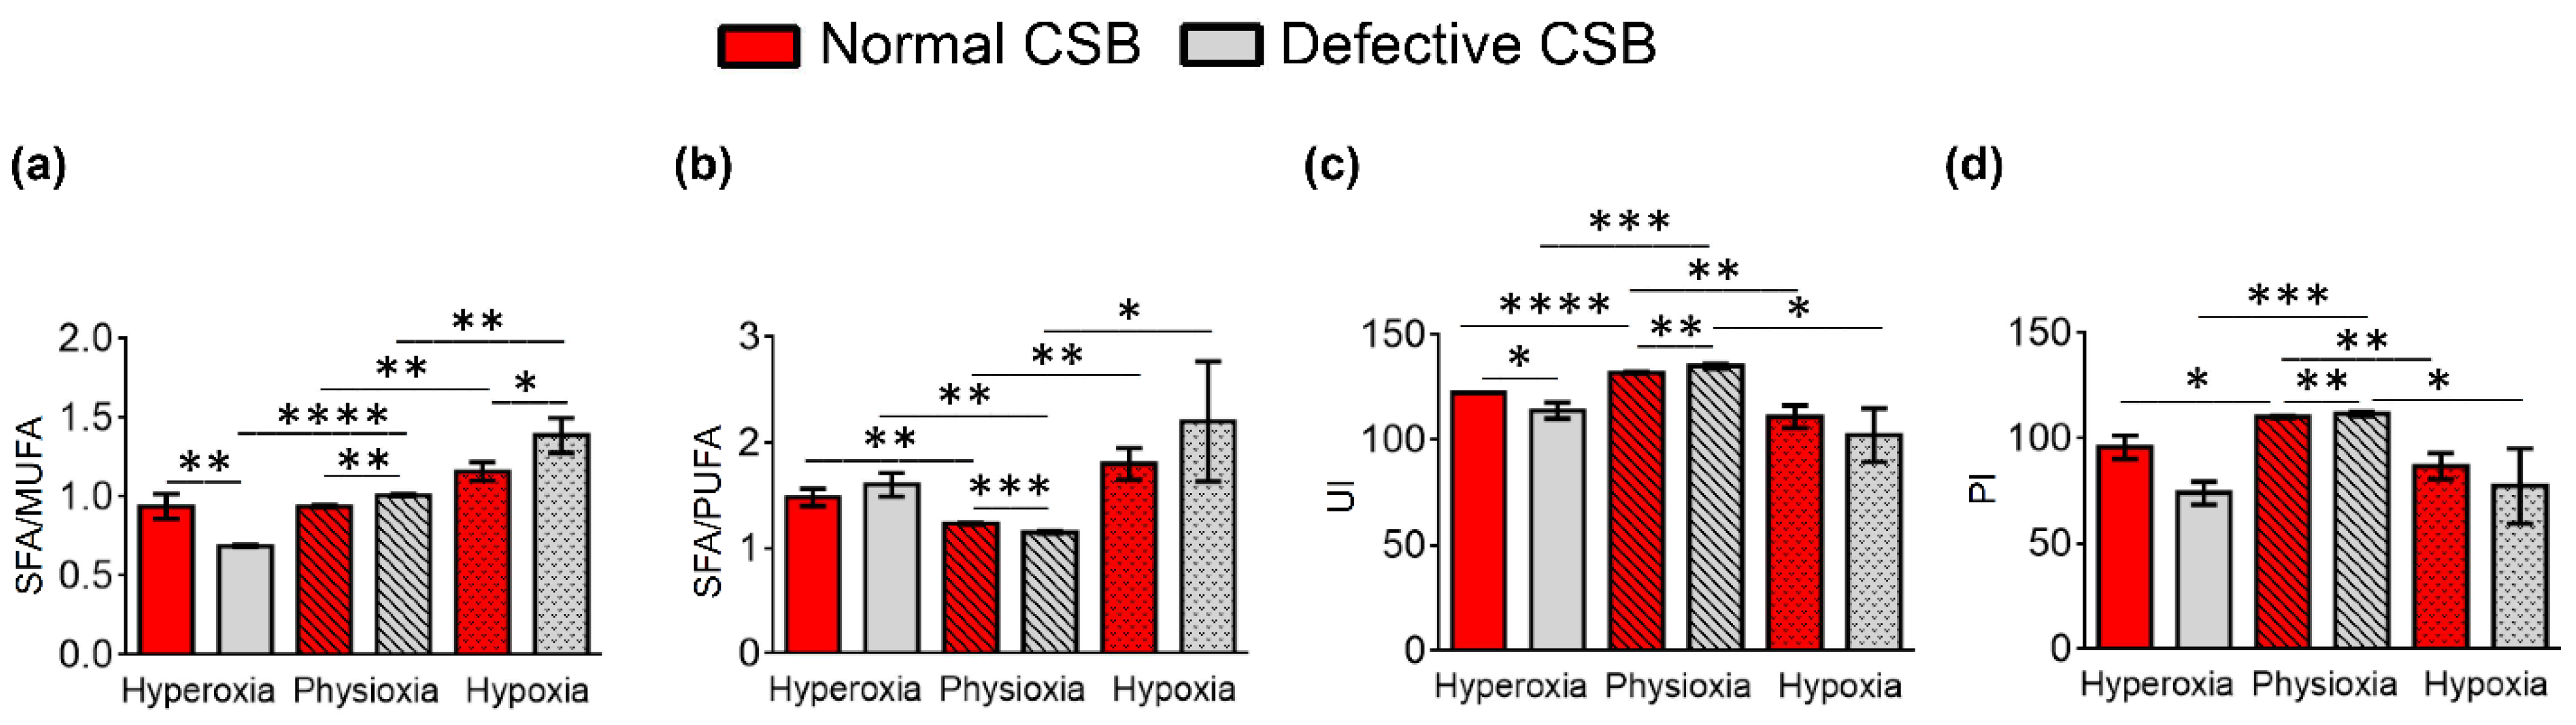
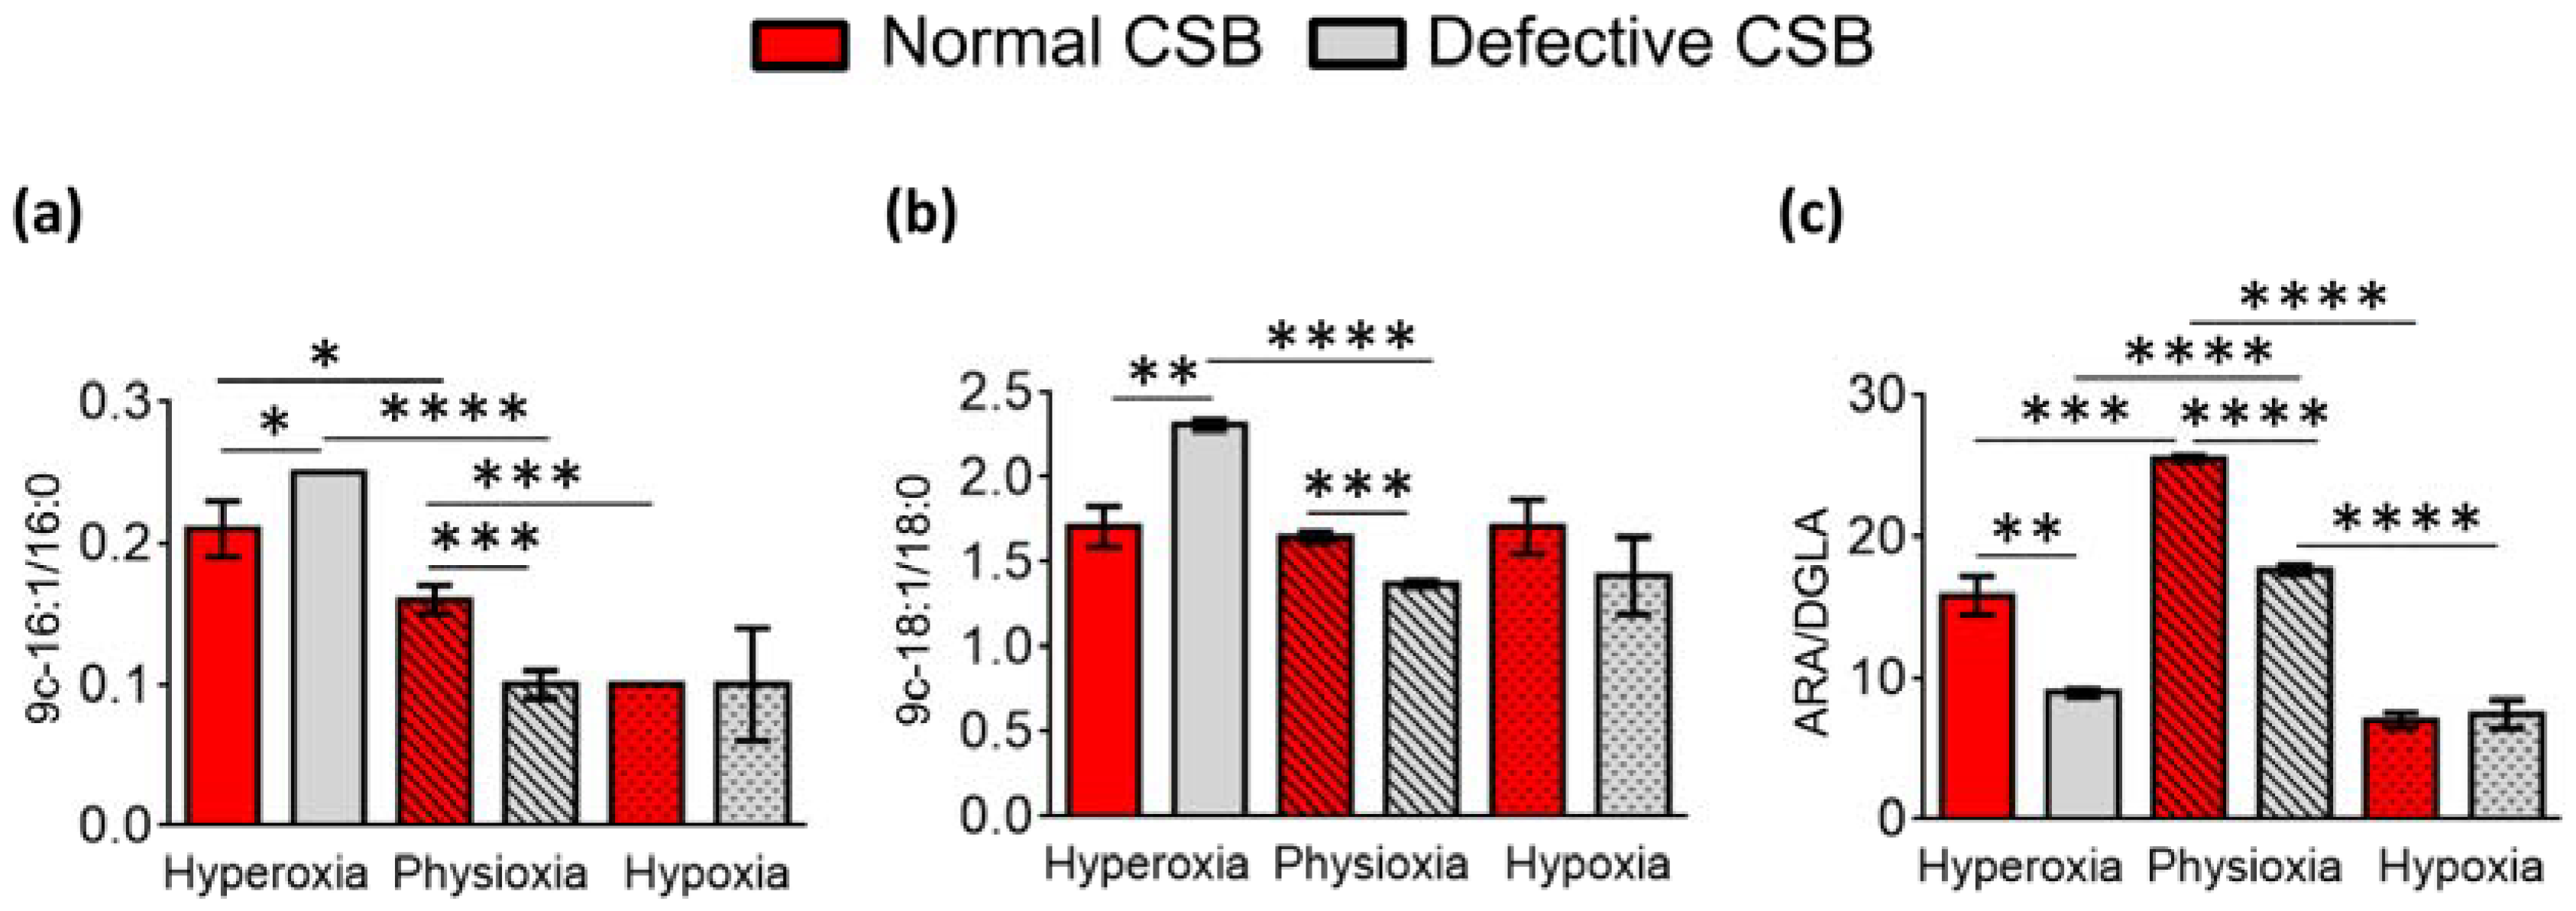
3.2. FAME Levels in Normal and Defective CSB Cells
- (i)
- An increase in SFA and MUFA (9c-16:1 and 9c-18:1) occurred under hyperoxic compared to physioxic conditions, differently from what we observed in the normal CSA cell line (i.e., SFA decrease and MUFA increase);
- (ii)
- PUFA ω6 diminished in hyperoxic conditions;
- (iii)
- PUFA ω3 residues did not show consistent changes;
- (iv)
- As in the previously shown cell lines, TFA were increased under hyperoxia.
- (i)
- Increase in SFA and increase in MUFA; interestingly, the increase in oleic acid (9c-18:1) was coupled with the decrease in palmitoleic acid (9c-16:1, cf. Figure 1);
- (ii)
- Diminution of PUFA ω6;
- (iii)
- Diminution of TFA.
- (i)
- Hyperoxic conditions gave a boost to the MUFA production in these cell lines, like in the CSA line, and this production was even higher compared to the normal CSB cells, with significantly low levels of SFA;
- (ii)
- PUFA ω6 under hyperoxic conditions was at the lowest levels in the CSB-defective cells, whereas for PUFA ω3, only EPA and DPA were lower compared to the normal CSB cell lines;
- (iii)
- The TFA 9t-18:1 had higher levels under hyperoxia than in the normal cell line.
- (i)
- The highest SFA content and the lowest MUFA content, with an increase in two components of the ω10 MUFA, in particular sapienic acid and 8c-18:1;
- (ii)
- Only the PUFA ω3 DHA was significantly low.
4. Discussion
5. Conclusions
Supplementary Materials
Author Contributions
Funding
Institutional Review Board Statement
Informed Consent Statement
Data Availability Statement
Acknowledgments
Conflicts of Interest
Abbreviations
References
- Wang, B.; Tontonoz, P. Phospholipid Remodeling in Physiology and Disease. Ann. Rev. Physiol. 2019, 81, 165–188. [Google Scholar] [CrossRef] [PubMed]
- Lands, W.E. Metabolism of glycerolipides: A comparison of lecithin and triglyceride synthesis. J. Biol. Chem. 1958, 231, 883–888. [Google Scholar] [CrossRef]
- Cohen, G.; Shamni, O.; Avrahami, Y.; Cohen, O.; Broner, E.C.; Filippov-Levy, N.; Chatgilialoglu, C.; Ferreri, C.; Kaiser, N.; Sasson, S. Beta cell response to nutrient overload involves phospholipid remodelling and lipid peroxidation. Diabetologia 2015, 58, 1333–1343. [Google Scholar] [CrossRef] [PubMed]
- Bolognesi, A.; Chatgilialoglu, A.; Polito, L.; Ferreri, C. Membrane lipidome reorganization correlates with the fate of neuroblastoma cells supplemented with fatty acids. PLoS ONE 2013, 8, e55537. [Google Scholar] [CrossRef] [PubMed] [Green Version]
- Cort, A.; Ozben, T.; Melchiorre, M.; Chatgilialoglu, C.; Ferreri, C.; Sansone, A. Effects of Bleomycin and Antioxidants on the Fatty Acid Profile of Testicular Cancer Cell Membranes. Biochim. Biophys. Acta Biomembr. 2016, 1858, 434–441. [Google Scholar] [CrossRef] [PubMed]
- Cort, A.; Ozben, T.; Sansone, A.; Barata-Vallejo, S.; Chatgilialoglu, C.; Ferreri, C. Bleomycin-induced trans lipid formation in cell membranes and in liposome models. Org. Biomol. Chem. 2015, 13, 1100–1105. [Google Scholar] [CrossRef] [PubMed] [Green Version]
- Prasinou, P.; Dafnis, I.; Giacometti, G.; Ferreri, C.; Chroni, A.; Chatgilialoglu, C. Fatty acid-based lipidomics and membrane remodelling induced by apoE3 and apoE4 in human neuroblastoma cells. Biochim. Biophys. Acta Biomembr. 2017, 1859, 1967–1973. [Google Scholar] [CrossRef]
- Toniolo, G.; Louka, M.; Menounou, G.; Fantoni, N.Z.; Mitrikas, G.; Efthimiadou, E.K.; Masi, A.; Bortolotti, M.; Polito, L.; Bolognesi, A.; et al. [Cu(TPMA)(Phen)](ClO4)2: Metallodrug Nanocontainer Delivery and Membrane Lipidomics of a Neuroblastoma Cell Line Coupled with a Liposome Biomimetic Model Focusing on Fatty Acid Reactivity. ACS Omega 2018, 3, 15952–15965. [Google Scholar] [CrossRef] [Green Version]
- Hanikoglu, A.; Kucuksayan, E.; Hanikoglu, F.; Ozben, T.; Menounou, G.; Sansone, A.; Chatgilialoglu, C.; Di Bella, G.; Ferreri, C. Effects of Somatostatin and Vitamin C on the Fatty Acid Profile of Breast Cancer Cell Membranes. Anti-Cancer Agents Med. Chem. 2019, 19, 1899–1909. [Google Scholar] [CrossRef]
- Dhalla, N.S.; Elmoselhi, A.B.; Hata, T.; Makino, N. Status of myocardial antioxidants in ischemia–reperfusion injury. Cardiovasc. Res. 2000, 47, 446–569. [Google Scholar] [CrossRef]
- Komalska, A.J. Physical principles of membrane remodelling during cell mechanoadaptation. Nat. Commun. 2015, 6, 7292. [Google Scholar] [CrossRef] [PubMed] [Green Version]
- Guillou, H.; Zadravec, D.; Martin, P.G.P.; Jacobsson, A. The key roles of elongases and desaturases in mammalian fatty acid metabolism: Insights from transgenic mice. Prog. Lipid Res. 2010, 49, 186–199. [Google Scholar] [CrossRef] [PubMed]
- Ferreri, C.; Chatgilialoglu, C. Role of fatty acid-based functional lipidomics in the development of molecular diagnostic tools. Expert Rev. Mol. Diagn. 2012, 12, 767–780. [Google Scholar]
- Igal, R.A. Roles of Stearoyl Coa Desaturase-1 in the Regulation of Cancer Growth, Survival and tumorigenesis. Cancer 2011, 3, 2462–2477. [Google Scholar] [CrossRef] [Green Version]
- Kamphorst, J.J.; Cross, J.R.; Fan, J.; Methew, R.; White, E.P.; Thompson, C.B.; Rabinowitz, J.D. Hypoxic and Ras-transformed cells support growth by scavenging unsaturated fatty acids from lysophospholipids. Proc. Natl. Acad. Sci. USA 2013, 110, 8882–8887. [Google Scholar] [CrossRef] [PubMed] [Green Version]
- Ferreri, C.; Sansone, A.; Ferreri, R.; Amézaga, J.; Tueros, I. Fatty acids and membrane lipidomics in oncology: A cross-road of nutritional, signaling and metabolic pathways. Metabolites 2020, 10, 345. [Google Scholar] [CrossRef]
- Petrova, V.; Annicchiarico-Petruzzelli, M.; Melino, A.I. The hypoxic tumour microenvironment. Oncogenesis 2018, 7, 10. [Google Scholar] [CrossRef]
- Wang, B.; Zhao, Q.; Zhang, Y.; Liu, Z.; Zheng, Z.; Liu, S.; Meng, L.; Xin, Y.; Jiang, X. Targeting hypoxia in the tumor microenvironment: A potential strategy to improve cancer immunotherapy. J. Exp. Clin. Cancer Res. 2021, 40, 24. [Google Scholar] [CrossRef]
- Norouzirad, R.; González-Muniesa, P.; Ghasemi, A. Hypoxia in Obesity and Diabetes: Potential Therapeutic Effects of Hyperoxia and Nitrate. Oxid. Med. Cell. Longev. 2017, 2017, 5350267. [Google Scholar] [CrossRef]
- Todorčević, M.; Manuel, A.R.; Austen, L.; Michailidou, Z.; Hazlehurst, J.M.; Neville, M.; Stradling, J.R.; Karpe, F. Markers of adipose tissue hypoxia are elevated in subcutaneous adipose tissue of severely obese patients with obesity hypoventilation syndrome but not in the moderately obese. Int. J. Obes. 2021, 45, 1618–1622. [Google Scholar] [CrossRef]
- Gunton, J.E. Hypoxia-inducible factors and diabetes. J. Clin. Investig. 2020, 130, 5063–5073. [Google Scholar] [CrossRef] [PubMed]
- Singh, A.; Kukreti, R.; Saso, L.; Kukreti, S. Oxidative Stress: A Key Modulator in Neurodegenerative Diseases. Molecules 2019, 24, 1583. [Google Scholar] [CrossRef] [PubMed] [Green Version]
- Zhao, Y.; Zhao, B. Oxidative stress and the pathogenesis of Alzheimer’s disease. Oxid. Med. Cell. Longev. 2013, 2013, 316523. [Google Scholar] [CrossRef] [PubMed] [Green Version]
- Navarro, A.; Boveris, A. Brain mitochondrial dysfunction in aging, neurodegeneration, and Parkinson’s Disease. Front. Aging Neurosci. 2010, 2, 34. [Google Scholar] [CrossRef] [Green Version]
- Pizzino, G.; Irrera, N.; Cucinotta, M.P.; Pallio, G.; Mannino, F.; Arcoraci, V.; Squadrito, F.; Altavilla, D.; Bitto, A. Oxidative Stress: Harms and Benefits for Human Health. Oxid. Med. Cell. Longev. 2017, 2017, 8416763. [Google Scholar] [CrossRef]
- D’Errico, M.; Parlanti, E.; Pascucci, B.; Filomeni, F.; Mastroberardino, P.G.; Dogliotti, E. The interplay between mitochondrial functionality and genome integrity in the prevention of human neurologic diseases. Arch. Biochem. Biophys. 2021, 710, 108977. [Google Scholar] [CrossRef]
- Hanawalt, P.C.; Spivak, G. Transcription-coupled DNA repair: Two decades of progress and surprises. Nat. Rev. Mol. Cell Biol. 2008, 9, 958–970. [Google Scholar] [CrossRef]
- Brooks, P.J. Blinded by the UV light: How the focus on transcription- coupled NER has distracted from understanding the mechanisms of Cockayne syndrome neurologic disease. DNA Repair 2013, 12, 656–671. [Google Scholar] [CrossRef] [Green Version]
- Batenburg, N.L.; Thompson, E.L.; Hendrickson, E.A.; Zhu, X.D. Cockayne syndrome group B protein regulates DNA double-strand break repair and checkpoint activation. EMBO J. 2015, 34, 1399–1416. [Google Scholar] [CrossRef] [Green Version]
- Batenburg, N.L.; Walker, J.R.; Noordermeer, S.M.; Moatti, N.; Durocher, D.; Zhu, X.D. ATM and CDK2 control chromatin remodeler CSB to inhibit RIF1 in DSB repair pathway choice. Nat. Commun. 2017, 8, 1921. [Google Scholar] [CrossRef]
- Pascucci, B.; Fragale, A.; Marabitti, V.; Leuzzi, G.; Calcagnile, A.S.; Parlanti, E.; Franchitto, A.; Dogliotti, E.; D’Errico, M. CSA and CSB play a role in the response to DNA breaks. Oncotarget 2018, 9, 11581–11591. [Google Scholar] [CrossRef] [PubMed] [Green Version]
- Tiwari, V.; Baptiste, B.A.; Okur, M.N.; Bohr, V.A. Current and emerging roles of Cockayne syndrome group B (CSB) protein. Nucleic Acids Res. 2021, 49, 2418–2434. [Google Scholar] [CrossRef] [PubMed]
- Lanzafame, M.; Branca, G.; Landi, C.; Qiang, M.; Vaz, B.; Nardo, T.; Ferri, D.; Mura, M.; Iben, S.; Stefanini, M.; et al. Cockayne syndrome group A and ferrochelatase finely tune ribosomal gene transcription and its response to UV irradiation. Nucleic Acids Res. 2021, 49, 10911–10930. [Google Scholar] [CrossRef] [PubMed]
- Cordisco, S.; Tinaburri, L.; Teson, M.; Orioli, D.; Cardin, R.; Degan, P.; Stefanini, M.; Zambruno, G.; Guerra, L.; Dellambra, E. Cockayne syndrome type A protein protects primary human keratinocytes from senescence. J. Investig. Dermatol. 2019, 139, 38–50. [Google Scholar] [CrossRef] [Green Version]
- Crochemore, C.; Fernández-Molina, C.; Montagne, B.; Salles, A.; Ricchetti, M. CSB promoter downregulation via histone H3 hypoacetylation is an early determinant of replicative senescence. Nat. Commun. 2019, 10, 5576. [Google Scholar] [CrossRef] [Green Version]
- Alupei, M.C.; Maity, P.; Esser, P.R.; Krikki, I.; Tuorto, F.; Parlato, R.; Penzo, M.; Schelling, A.; Laugel, V.; Montanaro, L.; et al. Loss of Proteostasis Is a Pathomechanism in Cockayne Syndrome. Cell Rep. 2018, 23, 1612–1619. [Google Scholar] [CrossRef]
- Pascucci, B.; Spadaro, F.; Pietraforte, D.; Nuccio, C.D.; Visentin, S.; Giglio, P.; Dogliotti, E.; D’Errico, M. DRP1 Inhibition Rescues Mitochondrial Integrity and Excessive Apoptosis in CS-A Disease Cell Models. Int. J. Mol. Sci. 2021, 22, 7123. [Google Scholar] [CrossRef]
- Pascucci, B.; D’Errico, M.; Romagnoli, A.; De Nuccio, C.; Savino, M.; Pietraforte, D.; Lanzafame, M.; Calcagnile, A.S.; Fortini, P.; Baccarini, S.; et al. Overexpression of parkin rescues the defective mitochondrial phenotype and the increased apoptosis of Cockayne syndrome A cells. Oncotarget 2016, 8, 102852–102867. [Google Scholar] [CrossRef] [Green Version]
- Pascucci, B.; Lemma, T.; Iorio, E.; Giovannini, S.; Vaz, B.; Iavarone, I.; Calcagnile, A.; Narciso, L.; Degan, P.; Podo, F.; et al. An altered redox balance mediates the hypersensitivity of Cockayne syndrome primary fibroblasts to oxidative stress. Aging Cell 2012, 11, 520–529. [Google Scholar] [CrossRef]
- Krokidis, M.G.; D’Errico, M.; Pascucci, B.; Parlanti, E.; Masi, A.; Ferreri, C.; Chatgilialoglu, C. Oxygen-Dependent Accumulation of Purine DNA Lesions in Cockayne Syndrome Cells. Cells 2020, 9, 1671. [Google Scholar] [CrossRef]
- Krokidis, M.G.; Parlanti, E.; D’Errico, M.; Pascucci, B.; Pino, A.; Alimonti, A.; Pietraforte, D.; Masi, A.; Ferreri, C.; Chatgilialoglu, C. Purine DNA Lesions at Different Oxygen Concentration in DNA Repair-Impaired Human Cells (EUE-siXPA). Cells 2019, 8, 1377. [Google Scholar] [CrossRef] [PubMed] [Green Version]
- Krokidis, M.G.; Louka, M.; Efthimiadou, E.K.; Zervou, S.K.; Papadopoulos, K.; Hiskia, A.; Ferreri, C.; Chatgilialoglu, C. Membrane Lipidome Reorganization and Accumulation of Tissue DNA Lesions in Tumor-Bearing Mice: An Exploratory Study. Cancers 2019, 11, 480. [Google Scholar] [CrossRef] [PubMed] [Green Version]
- Ferguson, D.C.J.; Smerdon, G.R.; Harries, L.W.; Dodd, N.J.F.; Murphy, M.P.; Curnow, A.; Winyarda, P.G. Altered cellular redox homeostasis and redox responses under standard oxygen cell culture conditions versus physioxia. Free Radic. Biol. Med. 2018, 26, 322–333. [Google Scholar] [CrossRef] [PubMed]
- Yazdani, M. Technical aspects of oxygen level regulation in primary cell cultures: A review. Interdiscip. Toxicol. 2016, 9, 85–89. [Google Scholar] [CrossRef] [Green Version]
- Al-Ani, A.; Toms, D.; Kondro, D.; Thundathil, J.; Yu, Y.; Ungrin, M. Oxygenation in cell culture: Critical parameters for reproducibility are routinely not reported. PLoS ONE 2018, 13, e0204269. [Google Scholar] [CrossRef] [Green Version]
- D’Errico, M.; Teson, M.; Calcagnile, A.; Nardo, T.; De Luca, N.; Lazzari, C.; Soddu, S.; Zambruno, G.; Stefanini, M.; Dogliotti, E. Differential role of transcription-coupled repair in UVB–induced response of human fibroblasts and keratinocytes. Cancer Res. 2005, 65, 232–238. [Google Scholar]
- Folch, J.; Lees, M.; Sloane Stanley, G.H. A simple method for the isolation and purification of total lipids from animal tissues. J. Biol. Chem. 1957, 226, 497–509. [Google Scholar] [CrossRef]
- Küçüksayan, E.; Sansone, A.; Chatgilialoglu, C.; Ozben, T.; Tekeli, D.; Talibova, G.; Ferreri, C. Sapienic Acid Metabolism Influences Membrane Plasticity and Protein Signaling in Breast Cancer Cell Lines. Cells 2022, 11, 225. [Google Scholar] [CrossRef]
- Sansone, A.; Melchiorre, M.; Chatgilialoglu, C.; Ferreri, C. Hexadecenoic fatty acid isomers: A chemical biology approach for human plasma biomarker development. Chem. Res. Toxicol. 2013, 26, 1703–1709. [Google Scholar] [CrossRef]
- Scanferlato, R.; Bortolotti, M.; Sansone, A.; Chatgilialoglu, C.; Polito, L.; De Spirito, M.; Maulucci, G.; Bolognesi, A.; Ferreri, C. Hexadecenoic Fatty Acid Positional Isomers and De Novo PUFA Synthesis in Colon Cancer Cells. Int. J. Mol. Sci. 2019, 20, 832. [Google Scholar] [CrossRef] [Green Version]
- Chatgilialoglu, C.; Ferreri, C. Trans lipids: The free radical path. Acc. Chem. Res. 2005, 38, 441–448. [Google Scholar] [CrossRef] [PubMed]
- Hung, W.-L.; Whang, L.S.; Shahidi, F.; Pan, M.-H. Endogenous formation of trans fatty acids: Health implications and potential dietary intervention. J. Funct. Foods 2014, 25, 14–24. [Google Scholar] [CrossRef]
- Hulbert, A.J. Explaining longevity of different animals: Is membrane fatty acid composition the missing link? Age 2008, 30, 89–97. [Google Scholar] [CrossRef] [PubMed] [Green Version]
- Puca, A.A.; Andrew, P.; Novelli, V.; Viviani, C.; Somalvico, F.; Cirillo, N.A.; Chatgilialoglu, C.; Ferreri, C. Fatty acids profile of erythrocyte membranes as possible biomarker of longevity. Rejuvenation. Res. 2008, 11, 63–72. [Google Scholar] [CrossRef] [PubMed]
- Aguilar, P.S.; de Mendoza, D. Control of fatty acid desaturation: A mechanism conserved from bacteria to humans. Mol. Microbiol. 2006, 62, 1507–1514. [Google Scholar] [CrossRef]
- Kim, W.; Deik, A.; Gonzalez, C.; Gonzalez, M.E.; Fu, F.; Ferrari, M.; Churchhouse, C.L.; Florez, J.C.; Jacobs, S.B.R.; Clish, C.B.; et al. Polyunsaturated fatty acid desaturation is a mechanism for glycolytic NAD+ recycling. Cell. Metab. 2019, 29, 856–870. [Google Scholar] [CrossRef] [Green Version]
- Fang, E.F.; Scheibye-Knudsen, M.; Brace, L.E.; Kassahun, H.; SenGupta, T.; Nilsen, H.; Mitchell, J.R.; Croteau, D.L.; Bohr, V.A. Defective mitophagy in XPA via PARP-1 hyperactivation and NAD+/SIRT1 reduction. Cell 2014, 157, 882–896. [Google Scholar] [CrossRef] [Green Version]
- Wilson, W.; Hay, M. Targeting hypoxia in cancer therapy. Nat. Rev. Cancer 2011, 11, 393–410. [Google Scholar] [CrossRef]
- Di Mattia, M.; Mauro, A.; Citeroni, M.R.; Dufrusine, B.; Peserico, A.; Russo, V.; Berardinelli, P.; Dainese, E.; Cimini, A.; Barboni, B. Insight into Hypoxia Stemness Control. Cells 2021, 10, 2161. [Google Scholar] [CrossRef]
- Oudot, F.; Grinberg, A.; Sergiel, J.P. Eicosanoid synthesis in cardiomyocytes: Influence of hypoxia, reoxygenation, and polyunsaturated fatty acids. Am. J. Physiol. 1995, 268, H308–H315. [Google Scholar] [CrossRef]
- Filipovic, I.; Rutemöller, M. Comparative studies on fatty acid synthesis in atherosclerotic and hypoxic human aorta. Atherosclerosis 1976, 24, 457–469. [Google Scholar] [CrossRef]
- Maulucci, G.; Cohen, O.; Daniel, B.; Sansone, A.; Petropoulou, P.I.; Filou, S.; Spyridonidis, A.; Pani, G.; De Spirito, M.; Chatgilialoglu, C.; et al. Fatty acid-related modulations of membranes fluidity in cells: Detection and implications. Free Radic. Res. 2016, 50, S40–S50. [Google Scholar] [CrossRef] [PubMed] [Green Version]
- Scheibye-Knudsen, M.; Mitchell, S.J.; Fang, E.F.; Iyama, T.; Ward, T.; Wang, J.; Dunn, C.A.; Singh, N.; Veith, S.; Hasan-Olive, M.M.; et al. A high-fat diet and NAD(+) activate Sirt1 to rescue premature aging in cockayne syndrome. Cell Metab. 2014, 20, 840–855. [Google Scholar] [CrossRef] [PubMed] [Green Version]
- Okur, M.N.; Fang, E.F.; Fivenson, E.M.; Tiwari, V.; Croteau, D.L.; Bohr, V.A. Cockayne syndrome proteins CSA and CSB maintain mitochondrial homeostasis through NAD+ signaling. Aging Cells 2020, 19, e13268. [Google Scholar] [CrossRef] [PubMed]
- Nevedomskaya, E.; Meissner, A.; Goraler, S.; de Waard, M.; Ridwan, Y.; Zondag, G.; van der Pluijm, I.; Deelder, A.M.; Mayboroda, O.A. Metabolic profiling of accelerated aging ERCC1 d/- mice. J. Proteome Res. 2010, 9, 3680–3687. [Google Scholar] [CrossRef] [PubMed]
- Avallone, R.; Vitale, G.; Bertolotti, M. Omega-3 Fatty Acids and Neurodegenerative Diseases: New Evidence in Clinical Trials. Int. J. Mol. Sci. 2019, 20, 4256. [Google Scholar] [CrossRef] [Green Version]
- Chatre, L.; Biard, D.S.F.; Sarasin, A.; Ricchetti, M. Reversal of mitochondrial defects with CSB-dependent serine protease inhibitors in patient cells of the progeroid Cockayne syndrome. Proc. Natl. Acad. Sci. USA 2015, 112, E2910–E2919. [Google Scholar] [CrossRef] [Green Version]
- Kim, B.W.; Jeong, Y.E.; Wong, M.; Martin, L.J. DNA damage accumulates and responses are engaged in human ALS brain and spinal motor neurons and DNA repair is activatable in iPSC-derived motor neurons with SOD1 mutations. Acta Neuropathol. Commun. 2020, 8, 7. [Google Scholar] [CrossRef] [Green Version]
- Phillips, T.; Leeuwenburgh, C. Muscle fiber- specific apoptosis and TNF- α signaling in sarcopenia are attenuated by life-long calorie restriction. FASEB J. 2005, 19, 668–670. [Google Scholar] [CrossRef]
- Vermeij, W.P.; Dollé, M.E.T.; Reiling, E.; Jaarsma, D.; Payan-Gomez, C.; Bombardieri, C.R.; Wu, H.; Roks, A.J.M.; Botter, S.M.; van der Eerden, B.C.; et al. Restricted diet delays accelerated ageing and genomic stress in DNA-repair-deficient mice. Nature 2016, 537, 427–431. [Google Scholar] [CrossRef] [Green Version]
- Majora, M.; Sondenheimer, K.; Knechten, M.; Uthe, I.; Esser, C.; Schiavi, A.; Ventura, N.; Krutmann, J. HDAC inhibition improves autophagic and lysosomal function to prevent loss of subcutaneous fat in a mouse model of Cockayne syndrome. Sci. Transl. Med. 2018, 10, eaam7510. [Google Scholar] [CrossRef] [PubMed] [Green Version]
- Chatgilialoglu, C.; Ferreri, C.; Melchiorre, M.; Sansone, A.; Torreggiani, A. Lipid geometrical isomerism: From chemistry to biology and diagnostics. Chem. Rev. 2014, 114, 255–284. [Google Scholar] [CrossRef] [PubMed]
- Ferreri, C.; Faraone Mennella, M.R.; Formisano, C.; Landi, L.; Chatgilialoglu, C. Arachidonate geometrical isomers generated by thiyl radicals: The relationship with trans lipids detected in biological samples. Free Radic. Biol. Med. 2002, 33, 1516–1526. [Google Scholar] [CrossRef]
- Souabni, H.; Thoma, V.; Bizouarn, T.; Chatgilialoglu, C.; Siafaka-Kapadai, A.; Baciou, L.; Ferreri, C.; Houée-Levin, C.; Ostuni, M.A. trans-Arachidonic acid isomers inhibit NAPDH-oxidase activity by direct interaction with enzyme componenta. Biochim. Biophys. Acta Biomembr. 2012, 1818, 2314–2334. [Google Scholar] [CrossRef] [Green Version]


| FAME | Normal CSA Cells | Defective CSA Cells | ||||
|---|---|---|---|---|---|---|
| Hyperoxia | Physioxia | Hypoxia | Hyperoxia | Physioxia | Hypoxia | |
| 14:0 | 1.40 ± 0.02 | 0.96 ± 0.29 | 1.42 ± 0.14 | 1.45 ± 0.01 | 0.81 ± 0.25 | 1.08 ± 0.15 |
| 16:0 | 22.06 ± 0.05 | 22.72 ± 0.33 | 28.71 ± 2.41 | 21.09 ± 0.06 | 21.63 ± 0.58 | 27.80 ± 1.37 |
| 18:0 | 12.31 ± 0.09 | 15.03 ± 0.40 | 14.93 ± 0.92 | 9.24 ± 0.19 | 14.64 ± 0.16 | 15.24 ± 0.33 |
| SFA | 35.77 ± 0.05 | 38.71 ± 0.18 | 45.06 ± 2.67 | 31.79 ± 0.14 | 37.08 ± 0.63 | 44.12 ± 1.31 |
| 6c-16:1 | 2.48 ± 0.02 | 1.91 ± 0.12 | 2.23 ± 0.14 | 1.80 ± 0.01 | 1.55 ± 0.13 | 1.90 ± 0.28 |
| 9c-16:1 | 2.75 ± 0.05 | 1.71 ± 0.10 | 1.69 ± 0.21 | 6.74 ± 0.02 | 1.76 ± 0.11 | 1.62 ± 0.05 |
| 8c-18:1 | 0.47 ± 0.02 | 0.36 ± 0.09 | 0.69 ± 0.12 | 0.68 ± 0.14 | 0.53 ± 0.15 | 0.53 ± 0.09 |
| 9c-18:1 | 23.99 ± 0.09 | 22.51 ± 0.18 | 22.90 ± 0.77 | 28.42 ± 0.16 | 23.10 ± 0.23 | 23.11 ± 0.84 |
| 11c-18:1 | 8.73 ± 0.10 | 8.13 ± 0.09 | 5.70 ± 0.62 | 12.55 ± 0.19 | 8.49 ± 0.17 | 5.79 ± 0.36 |
| 11c-20:1 | 0.31 ± 0.02 | 0.61 ± 0.05 | 0.30 ± 0.15 | 0.66 ± 0.00 | 0.69 ± 0.07 | 0.35 ± 0.09 |
| MUFA | 39.03 ± 0.15 | 35.24 ± 0.11 | 33.51 ± 1.08 | 51.08 ± 0.24 | 36.12 ± 0.26 | 33.29 ± 0.97 |
| 18:2 (LA) | 4.94 ± 0.05 | 5.67 ± 0.04 | 5.99 ± 0.14 | 1.57 ± 0.01 | 5.50 ± 0.06 | 5.67 ± 0.13 |
| 20:2 | 0.49 ± 0.00 | 0.70 ± 0.04 | 0.41 ± 0.20 | 0.88 ± 0.02 | 0.73 ± 0.02 | 0.39 ± 0.13 |
| 20:3 (DGLA) | 1.23 ± 0.05 | 1.12 ± 0.03 | 1.35 ± 0.13 | 1.25 ± 0.02 | 1.35 ± 0.05 | 1.49 ± 0.10 |
| 20:4 (ARA) | 13.08 ± 0.16 | 12.40 ± 0.09 | 9.41 ± 1.42 | 8.81 ± 0.10 | 13.81 ± 0.18 | 10.78 ± 0.84 |
| PUFA ω6 | 20.43 ± 0.09 | 20.10 ± 0.41 | 17.16 ± 1.67 | 13.38 ± 0.15 | 21.85 ± 0.29 | 18.33 ± 1.04 |
| 20:5 (EPA) | 0.26 ± 0.01 | 0.32 ± 0.16 | 0.09 ± 0.04 | 0.47 ± 0.01 | 0.29 ± 0.06 | 0.15 ± 0.07 |
| 22:5 (DPA) | 1.33 ± 0.04 | 1.66 ± 0.04 | 1.25 ± 0.30 | 0.69 ± 0.01 | 1.50 ± 0.07 | 1.23 ± 0.19 |
| 22:6 (DHA) | 2.55 ± 0.02 | 3.03 ± 0.02 | 2.01 ± 0.07 | 1.77 ± 0.03 | 2.14 ± 0.08 | 1.87 ± 0.20 |
| PUFA ω3 | 4.14 ± 0.04 | 5.01 ± 0.21 | 3.35 ± 0.19 | 2.93 ± 0.05 | 3.93 ± 0.19 | 3.25 ± 0.33 |
| 6t-16:1 | 0.22 ± 0.01 | 0.15 ± 0.13 | 0.16 ± 0.03 | 0.13 ± 0.01 | 0.23 ± 0.04 | 0.18 ± 0.03 |
| 9t-18:1 | 0.07 ± 0.05 | 0.04 ± 0.07 | 0.05 ± 0.01 | 0.11 ± 0.01 | 0.05 ± 0.07 | 0.06 ± 0.03 |
| mt 18:2-ω6 2 | 0.49 ± 0.00 | 0.16 ± 0.14 | 0.10 ± 0.02 | 0.76 ± 0.01 | 0.23 ± 0.06 | 0.06 ± 0.02 |
| mt 20:4-ω6 2 | 0.20 ± 0.07 | 0.18 ± 0.17 | 0.16 ± 0.10 | 0.11 ± 0.03 | 0.24 ± 0.04 | 0.08 ± 0.03 |
| TFA | 0.98 ± 0.01 | 0.54 ± 0.47 | 0.48 ± 0.12 | 1.11 ± 0.03 | 0.75 ± 0.09 | 0.38 ± 0.02 |
| 5c,8c-18:2 | 0.94 ± 0.26 | 0.60 ± 0.05 | 0.46 ± 0.02 | 0.58 ± 0.16 | 0.74 ± 0.12 | 0.53 ± 0.07 |
| Entry | Normal CSA Cells | Defective CSA Cells | ||||
|---|---|---|---|---|---|---|
| Hyperoxia | Physioxia | Hypoxia | Hyperoxia | Physioxia | Hypoxia | |
| PUFA | 25.06 ± 0.12 | 25.51 ± 0.28 | 20.97 ± 1.85 | 17.07 ± 0.20 | 26.05 ± 0.56 | 22.11 ± 0.77 |
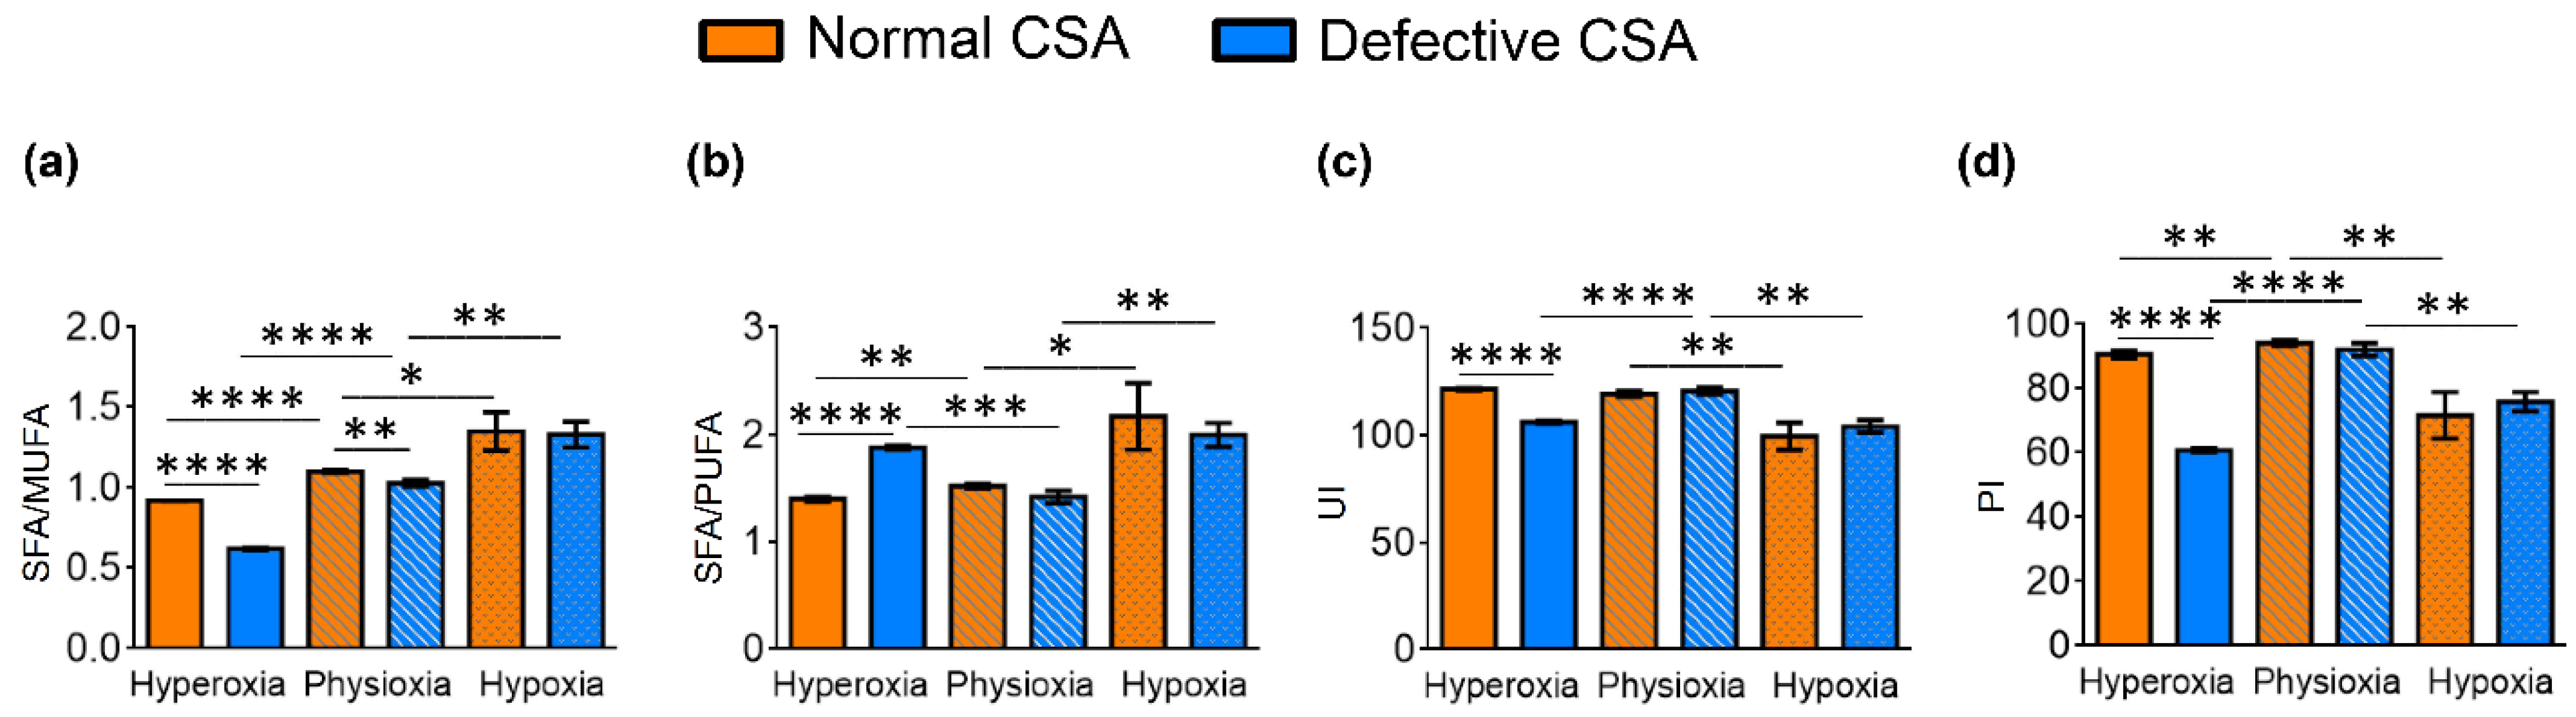
| SFA/MUFA | 0.92 ± 0.001 | 1.10 ± 0.01 | 1.35 ± 0.12 | 0.62 ± 0.01 | 1.03 ± 0.02 | 1.33 ± 0.08 |
| SFA/PUFA | 1.40 ± 0.02 | 1.52 ± 0.02 | 2.17 ± 0.31 | 1.88 ± 0.02 | 1.42 ± 0.06 | 2.00 ± 0.11 |
| PUFA ω6/ω3 | 4.94 ± 0.0494 | 4.02 ± 0.19 | 5.11 ± 0.22 | 4.56 ± 0.04 | 5.56 ± 0.21 | 5.71 ± 0.89 |
| FA ω10 1 | 3.89 ± 0.30 | 2.88 ± 0.17 | 3.38 ± 0.26 | 3.05 ± 0.27 | 2.82 ± 0.14 | 2.95 ± 0.40 |
| 9c-16:1/16:0 2 | 0.12 ± 0.00 | 0.075 ± 0.00 | 0.06 ± 0.01 | 0.32 ± 0.00 | 0.08 ± 0.00 | 0.06 ± 0.001 |
| 9c-18:1/18:0 3 | 1.95 ± 0.02 | 1.50 ± 0.03 | 1.54 ± 0.10 | 3.08 ± 0.08 | 1.58 ± 0.02 | 1.52 ± 0.03 |
| ARA/DGLA 4 | 10.68 ± 0.59 | 11.05 ± 0.23 | 6.95 ± 0.51 | 7.04 ± 0.12 | 10.25 ± 0.27 | 7.22 ± 0.27 |
| PUFA balance 5 | 0.16 ± 0.001 | 0.20 ± 0.01 | 0.16 ± 0.01 | 0.17 ± 0.001 | 0.15 ± 0.001 | 0.15 ± 0.02 |
| UI 6 | 121.51 ± 0.46 | 119.33 ± 1.34 | 99.67 ± 6.43 | 106.17 ± 0.55 | 120.7 ±1.65 | 104.18 ± 2.89 |
| PI 7 | 90.72 ± 1.14 | 94.22 ± 0.80 | 71.71 ± 7.25 | 60.82 ± 0.71 | 92.21 ± 1.99 | 75.97 ± 2.99 |
| FAME | Normal CSB Cells | Defective CSB Cells | ||||
|---|---|---|---|---|---|---|
| Hyperoxia | Physioxia | Hypoxia | Hyperoxia | Physioxia | Hypoxia | |
| 14:0 | 0.89 ± 0.07 | 0.83 ± 0.16 | 0.84 ± 0.20 | 0.66 ± 0.10 | 0.55 ± 0.11 | 1.50 ± 0.43 |
| 16:0 | 20.37 ± 0.46 | 19.83 ± 0.20 | 25.48 ± 1.01 | 17.87 ± 0.33 | 18.07 ± 0.23 | 28.50 ± 0.91 |
| 18:0 | 14.87 ± 0.21 | 13.84 ± 0.31 | 15.06 ± 1.05 | 13.59 ± 0.46 | 16.05 ± 0.16 | 15.33 ± 0.41 |
| SFA | 36.13 ± 0.67 | 34.50 ± 0.18 | 41.38 ± 1.40 | 32.13 ± 0.47 | 34.67 ± 0.19 | 45.33 ± 1.13 |
| 6c-16:1 | 1.08 ± 0.11 | 1.26 ± 0.05 | 1.49 ± 0.30 | 1.12 ± 0.03 | 1.56 ± 0.09 | 2.15 ± 0.28 |
| 9c-16:1 | 4.19 ± 0.32 | 3.23 ± 0.16 | 2.66 ± 0.08 | 4.47 ± 0.09 | 1.82 ± 0.09 | 2.84 ± 1.15 |
| 8c-18:1 | 0.21 ± 0.03 | 0.66 ± 0.30 | 0.28 ± 0.03 | 0.17 ± 0.05 | 0.34 ± 0.02 | 0.49 ± 0.10 |
| 9c-18:1 | 25.35 ± 1.65 | 22.89 ± 0.32 | 25.68 ± 0.71 | 31.36 ± 0.76 | 22.05 ± 0.19 | 21.66 ± 2.99 |
| 11c-18:1 | 7.58 ± 0.84 | 8.36 ± 0.01 | 5.47 ± 0.23 | 9.28 ± 0.22 | 8.23 ± 0.10 | 5.30 ± 0.79 |
| 11c-20:1 | 0.28 ± 0.02 | 0.34 ± 0.04 | 0.20 ± 0.09 | 0.48 ± 0.01 | 0.42 ± 0.05 | 0.31 ± 0.14 |
| MUFA | 38.49 ± 2.69 | 36.74 ± 0.13 | 35.78 ± 0.60 | 46.71 ± 0.88 | 34.41 ± 0.29 | 32.75 ± 3.45 |
| 18:2-ω6 (LA) | 4.71 ± 0.31 | 6.10 ± 0.05 | 5.51 ± 0.44 | 4.19 ± 0.17 | 6.52 ± 0.02 | 5.27 ± 0.56 |
| 20:2 | 0.44 ± 0.00 | 0.49 ± 0.01 | 0.30 ± 0.10 | 0.52 ± 0.02 | 0.76 ± 0.02 | 0.35 ± 0.07 |
| 20:3 (DGLA) | 0.79 ± 0.02 | 0.56 ± 0.00 | 1.29 ± 0.13 | 1.06 ± 0.04 | 0.91 ± 0.03 | 1.32 ± 0.28 |
| 20:4 (ARA) | 12.42 ± 0.85 | 14.25 ± 0.09 | 8.94 ± 0.45 | 9.50 ± 0.59 | 16.02 ± 0.20 | 9.92 ± 2.84 |
| PUFA ω6 | 18.36 ± 1.14 | 21.78 ± 0.06 | 16.04 ± 0.64 | 15.27 ± 0.82 | 24.65 ± 0.25 | 16.87 ± 3.59 |
| 20:5 (EPA) | 0.46 ± 0.04 | 0.21 ± 0.02 | 0.25 ± 0.06 | 0.58 ± 0.05 | 0.37 ± 0.02 | 0.17 ± 0.04 |
| 22:5 (DPA) | 1.79 ± 0.32 | 2.12 ± 0.04 | 1.67 ± 0.16 | 1.19 ± 0.12 | 1.81 ± 0.02 | 1.44 ± 0.30 |
| 22:6 (DHA) | 3.34 ± 0.66 | 3.89 ± 0.03 | 3.88 ± 0.52 | 2.45 ± 0.27 | 3.23 ± 0.06 | 2.41 ± 0.58 |
| PUFA ω3 | 5.59 ± 1.01 | 6.22 ± 0.05 | 5.80 ± 0.51 | 4.22 ± 0.44 | 5.42 ± 0.06 | 4.02 ± 0.84 |
| 6t-16:1 | 0.09 ± 0.05 | 0.17 ± 0.01 | 0.12 ± 0.03 | 0.07 ± 0.06 | 0.18 ± 0.01 | 0.13 ± 0.01 |
| 9t-18:1 | 0.08 ± 0.04 | 0.10 ± 0.01 | 0.08 ± 0.02 | 0.20 ± 0.01 | 0.10 ± 0.01 | 0.10 ± 0.03 |
| mt 18:2-ω6 | 0.34 ± 0.01 | 0.16 ± 0.01 | 0.17 ± 0.05 | 0.36 ± 0.02 | 0.20 ± 0.01 | 0.12 ± 0.09 |
| mt 20:4-ω6 | 0.20 ± 0.01 | 0.23 ± 0.02 | 0.13 ± 0.03 | 0.18 ± 0.02 | 0.24 ± 0.03 | 0.11 ± 0.01 |
| TFA | 0.70 ± 0.09 | 0.65 ± 0.05 | 0.51 ± 0.06 | 0.81 ± 0.05 | 0.71 ± 0.05 | 0.45 ± 0.11 |
| 5c,8c-18:2 | 0.53 ± 0.11 | 0.50 ± 0.05 | 0.40 ± 0.07 | 0.69 ± 0.10 | 0.58 ± 0.10 | 0.51 ± 0.06 |
| Normal CSB Cells | Defective CSB Cells | |||||
|---|---|---|---|---|---|---|
| Hyperoxia | Physioxia | Hypoxia | Hyperoxia | Physioxia | Hypoxia | |
| PUFA | 24.48 ± 2.05 | 28.12 ± 0.16 | 22.23 ± 1.13 | 20.18 ± 1.16 | 30.21 ± 0.27 | 21.39 ± 4.43 |
| SFA/MUFA | 0.94 ± 0.08 | 0.94 ± 0.01 | 1.16 ± 0.06 | 0.69 ± 0.01 | 1.01 ± 0.01 | 1.39 ± 0.1 |
| SFA/PUFA | 1.48 ± 0.08 | 1.23 ± 0.01 | 1.8 ± 0.15 | 1.60 ± 0.11 | 1.15 ± 0.01 | 2.20 ± 0.57 |
| PUFA ω6/ω3 | 3.33 ± 0.37 | 3.50 ± 0.02 | 2.77 ± 0.14 | 3.63 ± 0.18 | 4.55 ± 0.03 | 4.20 ± 0.36 |
| FA ω10 1 | 1.82 ± 0.03 | 2.42 ± 0.39 | 2.16 ± 0.36 | 1.98 ± 0.12 | 2.48 ± 0.14 | 3.15 ± 0.14 |
| 9c-16:1/16:0 2 | 0.21 ± 0.02 | 0.16 ± 0.01 | 0.10 ± 0.00 | 0.25 ± 0.00 | 0.10 ± 0.01 | 0.10 ± 0.04 |
| 9c-18:1/18:0 3 | 1.71 ± 0.12 | 1.65 ± 0.03 | 1.71 ± 0.16 | 2.31 ± 0.03 | 1.37 ± 0.02 | 1.42 ± 0.23 |
| ARA/DGLA 4 | 15.83 ± 1.36 | 25.52 ± 0.21 | 6.98 ± 0.58 | 8.96 ± 0.26 | 17.64 ± 0.33 | 7.44 ± 0.99 |
| PUFA balance 5 | 0.23 ± 0.10 | 0.22 ± 0.001 | 0.26 ± 0.01 | 0.21 ± 0.01 | 0.18 ± 0.001 | 0.19 ± 0.01 |
| UI 6 | 122.33 ± 0.02 | 131.96 ± 0.44 | 110.94 ± 5.40 | 113.88 ± 3.85 | 135 ± 1.01 | 102.25 ± 12.71 |
| PI 7 | 95.84 ± 5.47 | 110.14 ± 0.30 | 86.72 ± 6.12 | 74.00 ± 5.43 | 111.71 ± 1.16 | 77.39 ± 17.79 |
Publisher’s Note: MDPI stays neutral with regard to jurisdictional claims in published maps and institutional affiliations. |
© 2022 by the authors. Licensee MDPI, Basel, Switzerland. This article is an open access article distributed under the terms and conditions of the Creative Commons Attribution (CC BY) license (https://creativecommons.org/licenses/by/4.0/).
Share and Cite
Ferreri, C.; Sansone, A.; Krokidis, M.G.; Masi, A.; Pascucci, B.; D’Errico, M.; Chatgilialoglu, C. Effects of Oxygen Tension for Membrane Lipidome Remodeling of Cockayne Syndrome Cell Models. Cells 2022, 11, 1286. https://doi.org/10.3390/cells11081286
Ferreri C, Sansone A, Krokidis MG, Masi A, Pascucci B, D’Errico M, Chatgilialoglu C. Effects of Oxygen Tension for Membrane Lipidome Remodeling of Cockayne Syndrome Cell Models. Cells. 2022; 11(8):1286. https://doi.org/10.3390/cells11081286
Chicago/Turabian StyleFerreri, Carla, Anna Sansone, Marios G. Krokidis, Annalisa Masi, Barbara Pascucci, Mariarosaria D’Errico, and Chryssostomos Chatgilialoglu. 2022. "Effects of Oxygen Tension for Membrane Lipidome Remodeling of Cockayne Syndrome Cell Models" Cells 11, no. 8: 1286. https://doi.org/10.3390/cells11081286