
Glucose Regulates m6A Methylation of RNA in Pancreatic Islets

 , , , , and
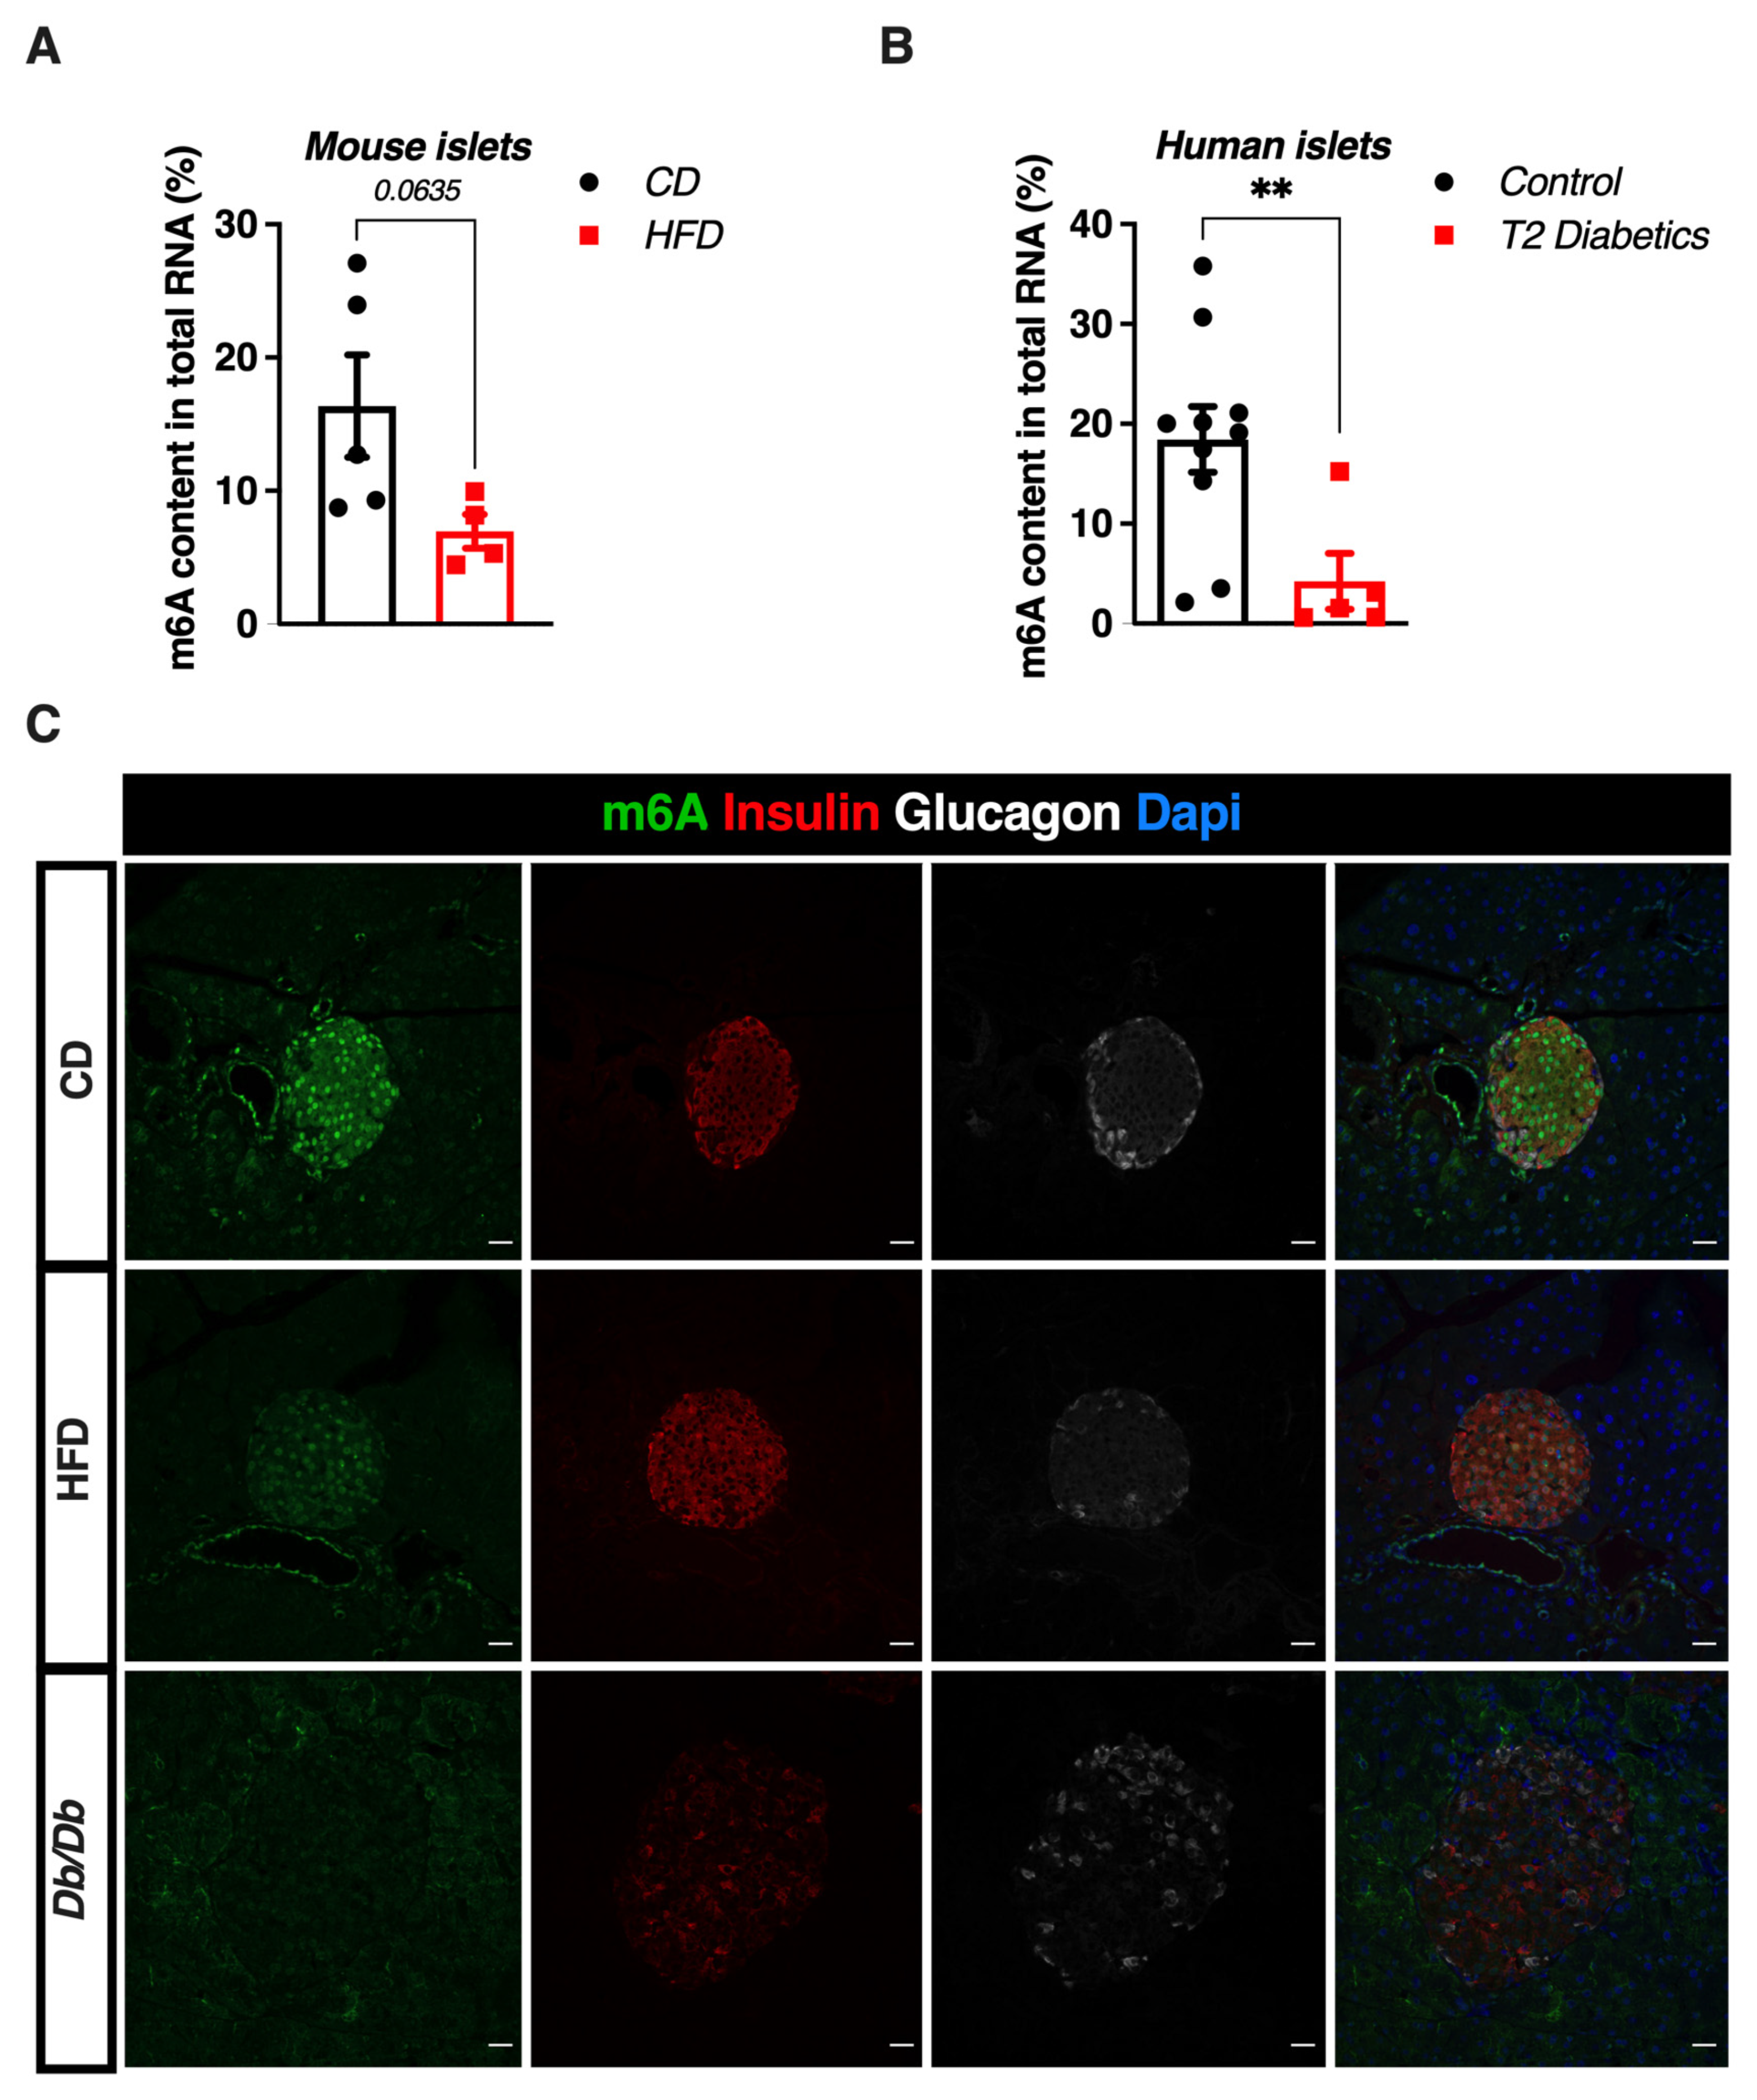
Abstract
:1. Introduction
2. Materials and Methods
2.1. Animal Experiments
2.2. Human Pancreatic Islets Studies
2.3. Cell Culture and Treatments
2.4. siRNA Transfection
2.5. Glucose-Stimulated Insulin Secretion and Insulin Quantification
2.6. RNA Extraction and RT-qPCR
2.7. m6A Quantification by Dot Blot
2.8. m6A Quantification by ELISA
2.9. Immunofluorescence and Quantification
2.10. Nuclear/Cytoplasmic Fractionation, Western Blot Analysis and Quantification
2.11. Statistical Analysis
3. Results
3.1. m6A RNA Methylation Is Reduced in Human and Murine Pancreatic Islets
3.2. High Glucose Concentrations Reduce m6A Methylation in Mouse β-Cell Line and Human Pancreatic Islets
3.3. Glucose Induces Changes in mRNA Expression and Protein Localization of Mettl3 and Alkbh5 in Mouse Min6 Cells
3.4. A Combination of Glucose and Palmitate Treatment Increases m6A Methylation in Pancreatic β Cell Line and Human Islets Associated to Alkbh5 Downregulation
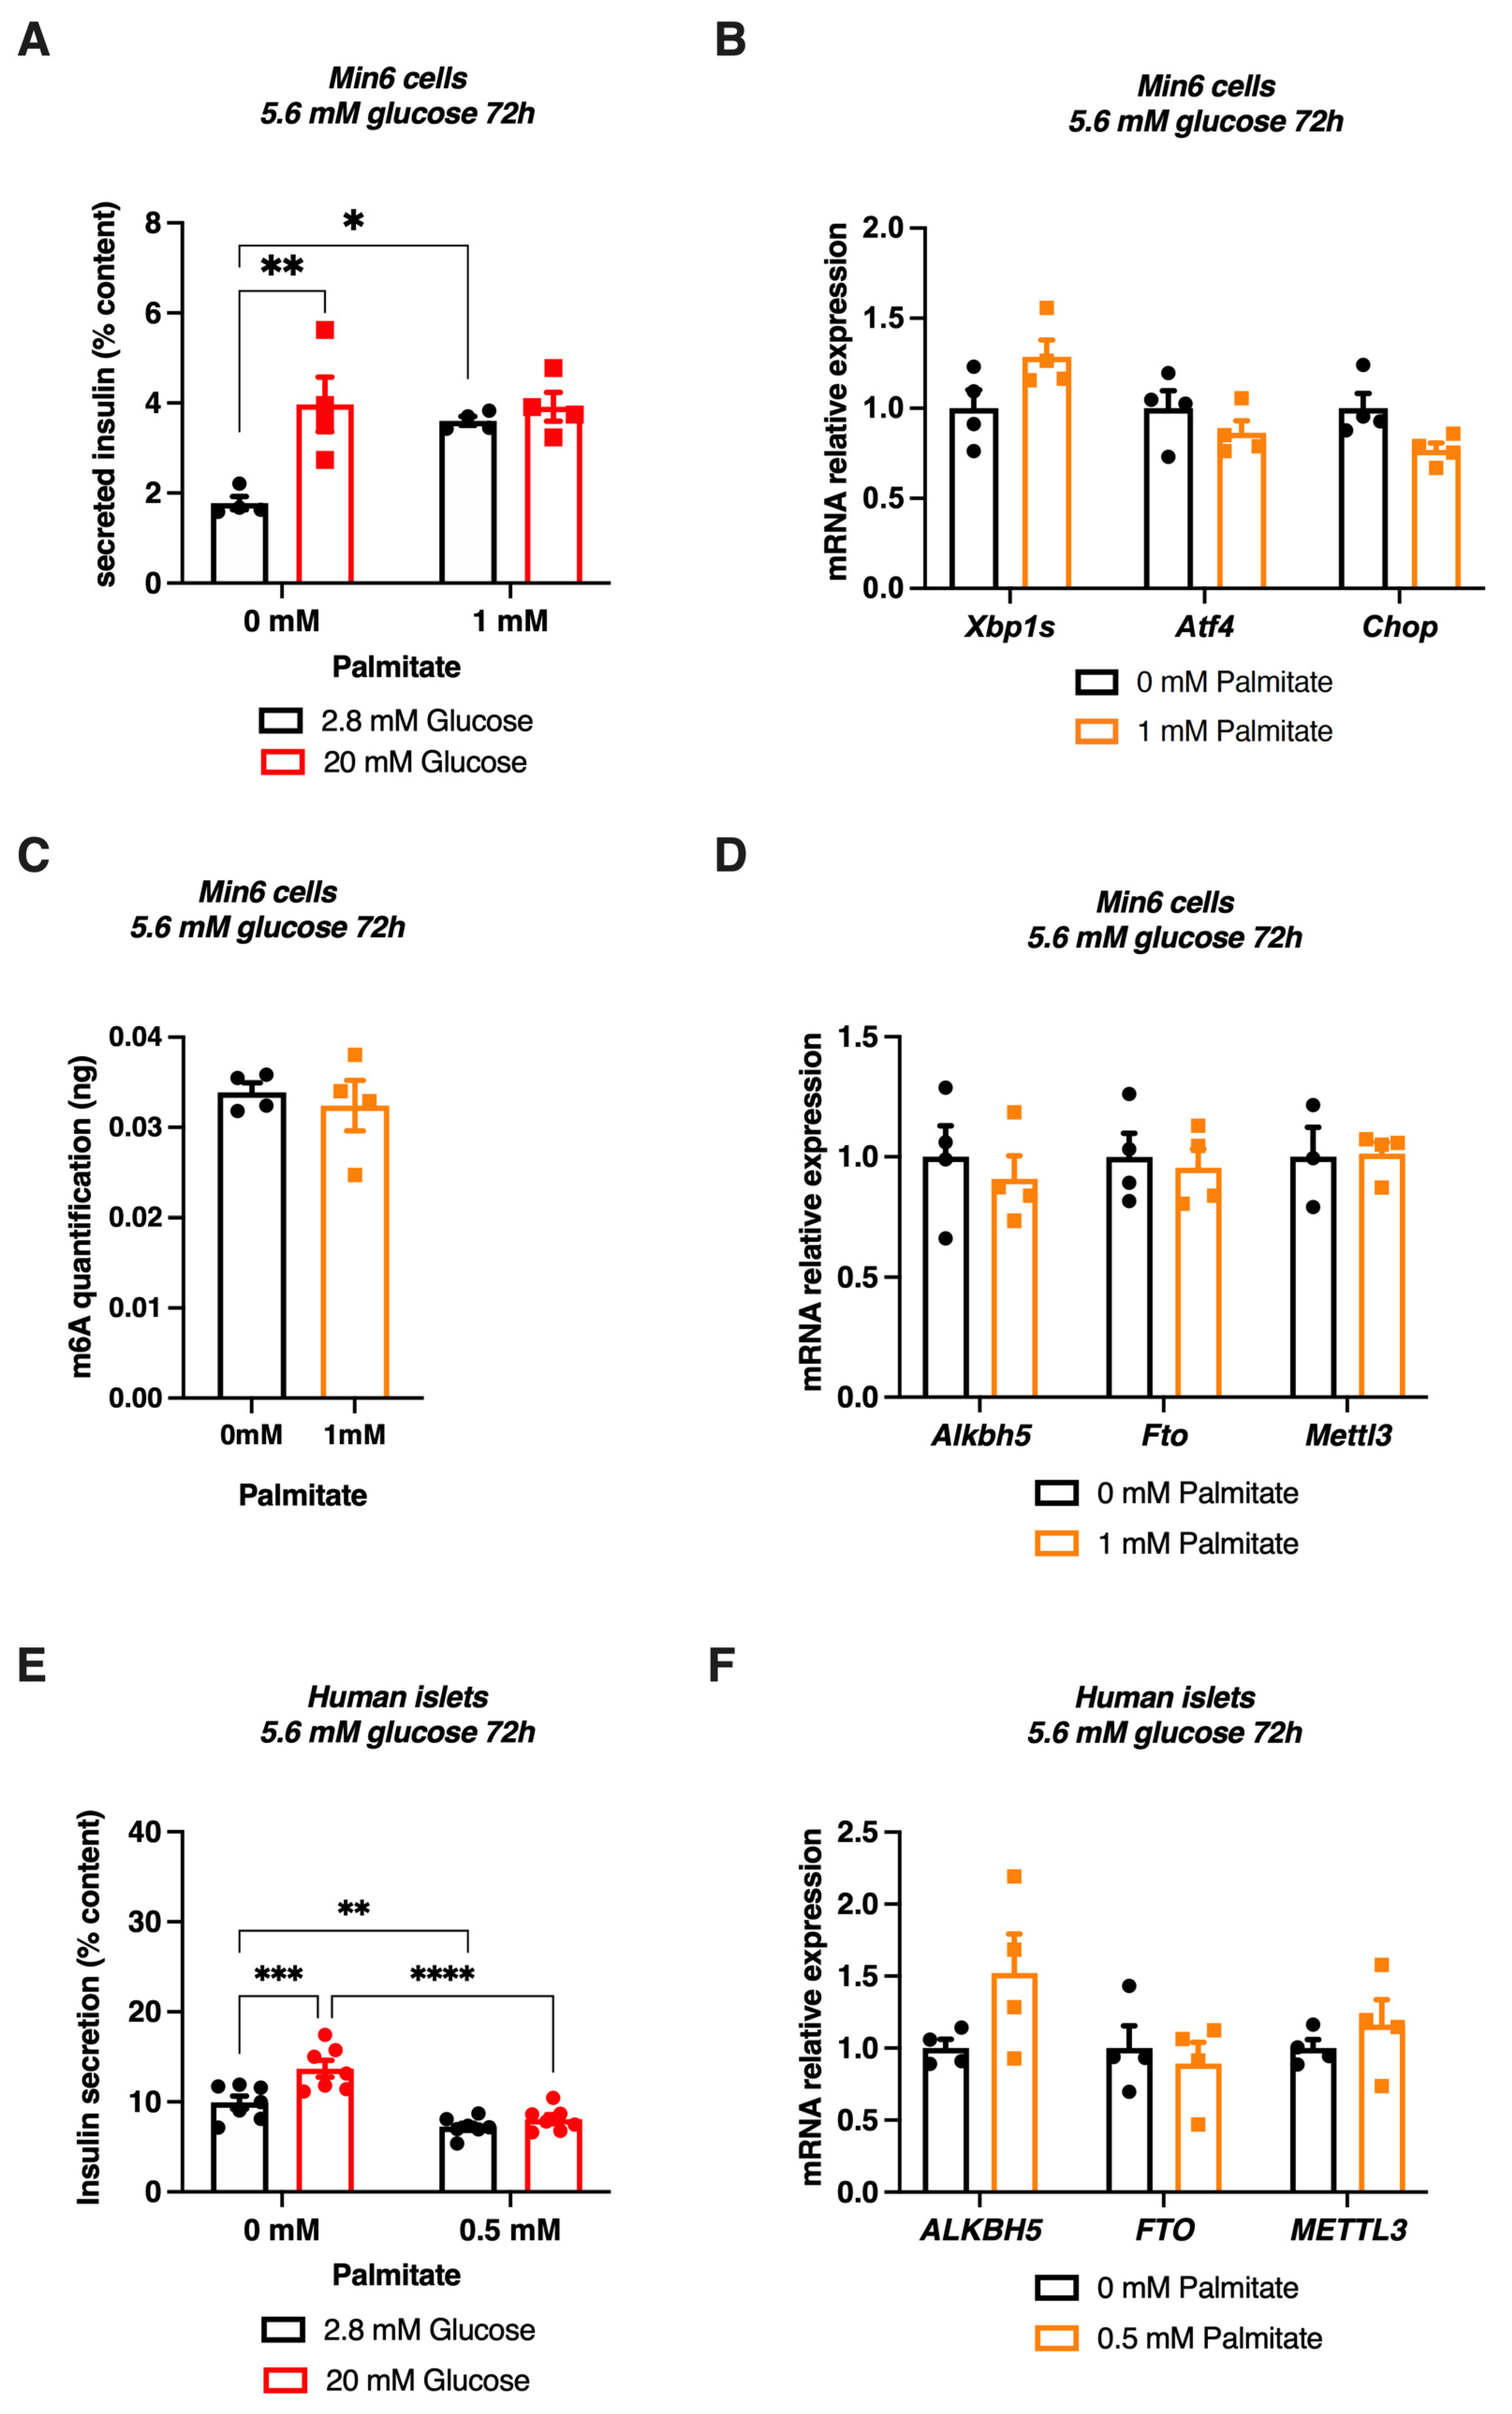
3.5. Chronic Palmitate Treatment Does Not Modulate m6A Methylation in Pancreatic β Cell Line and Human Islets at Low Glucose Concentration
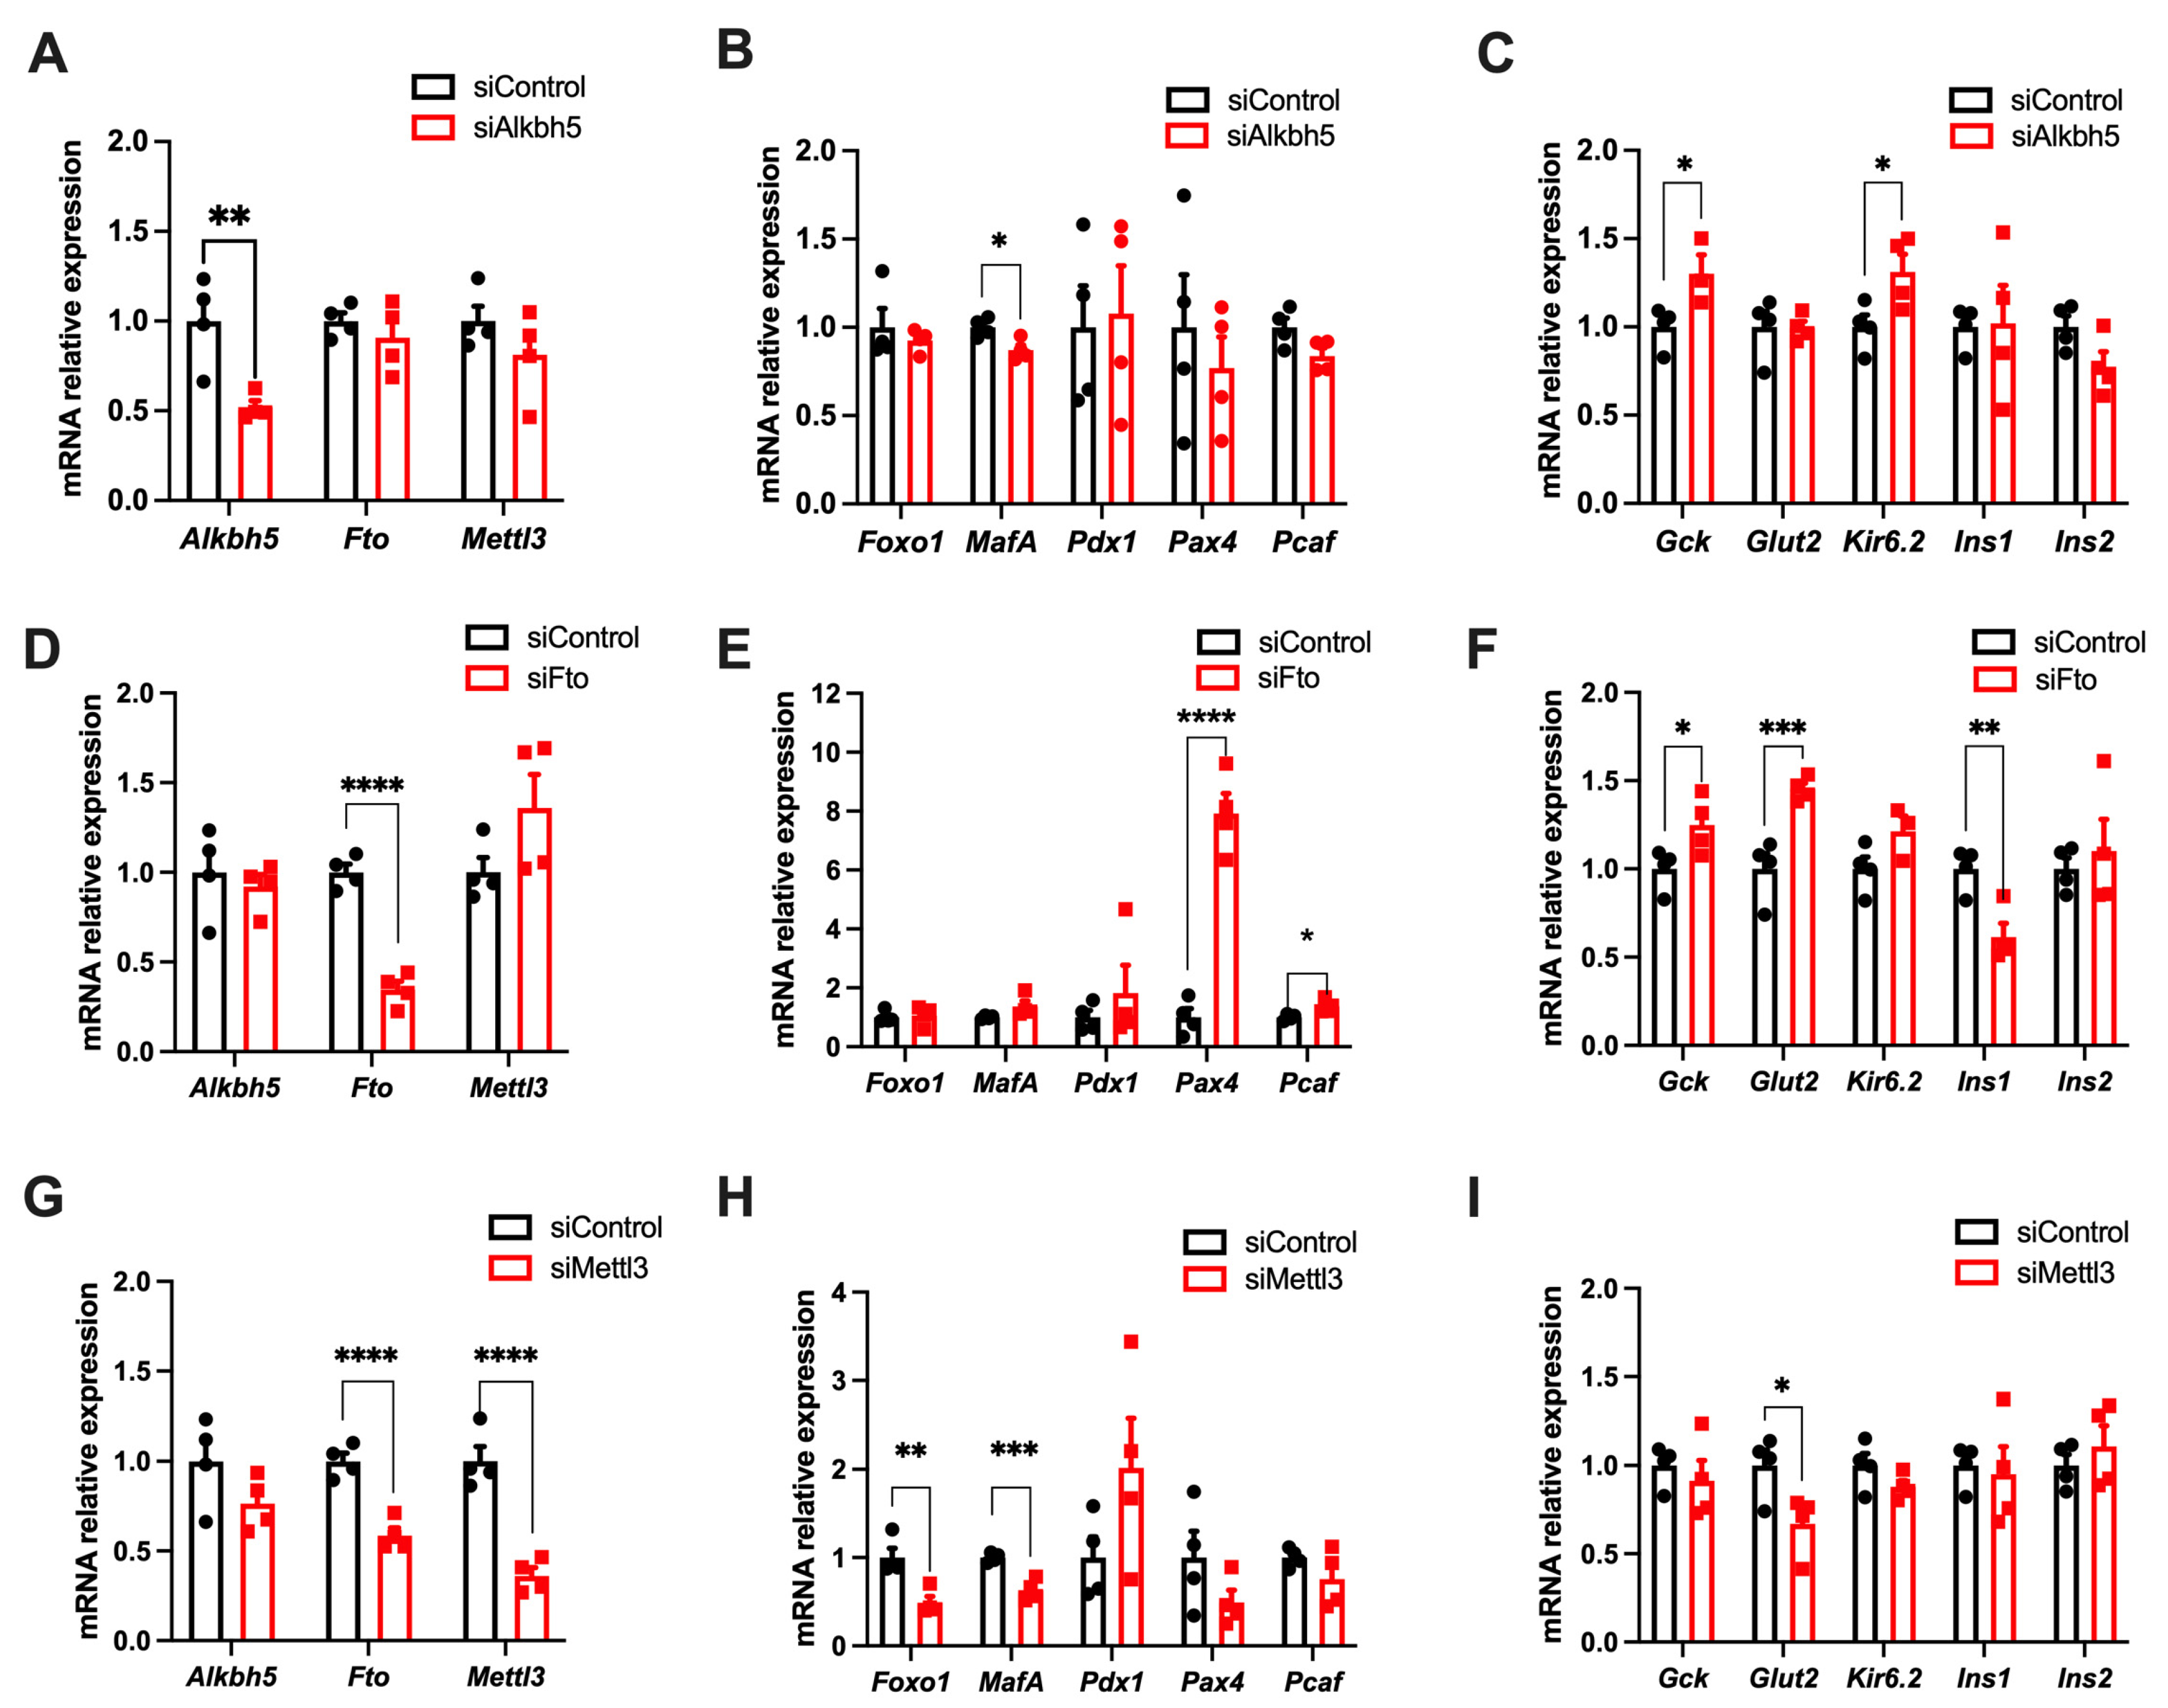
3.6. m6A Enzymes Regulates the Expression of Genes Involved in the Function and Identity of Pancreatic β Cells
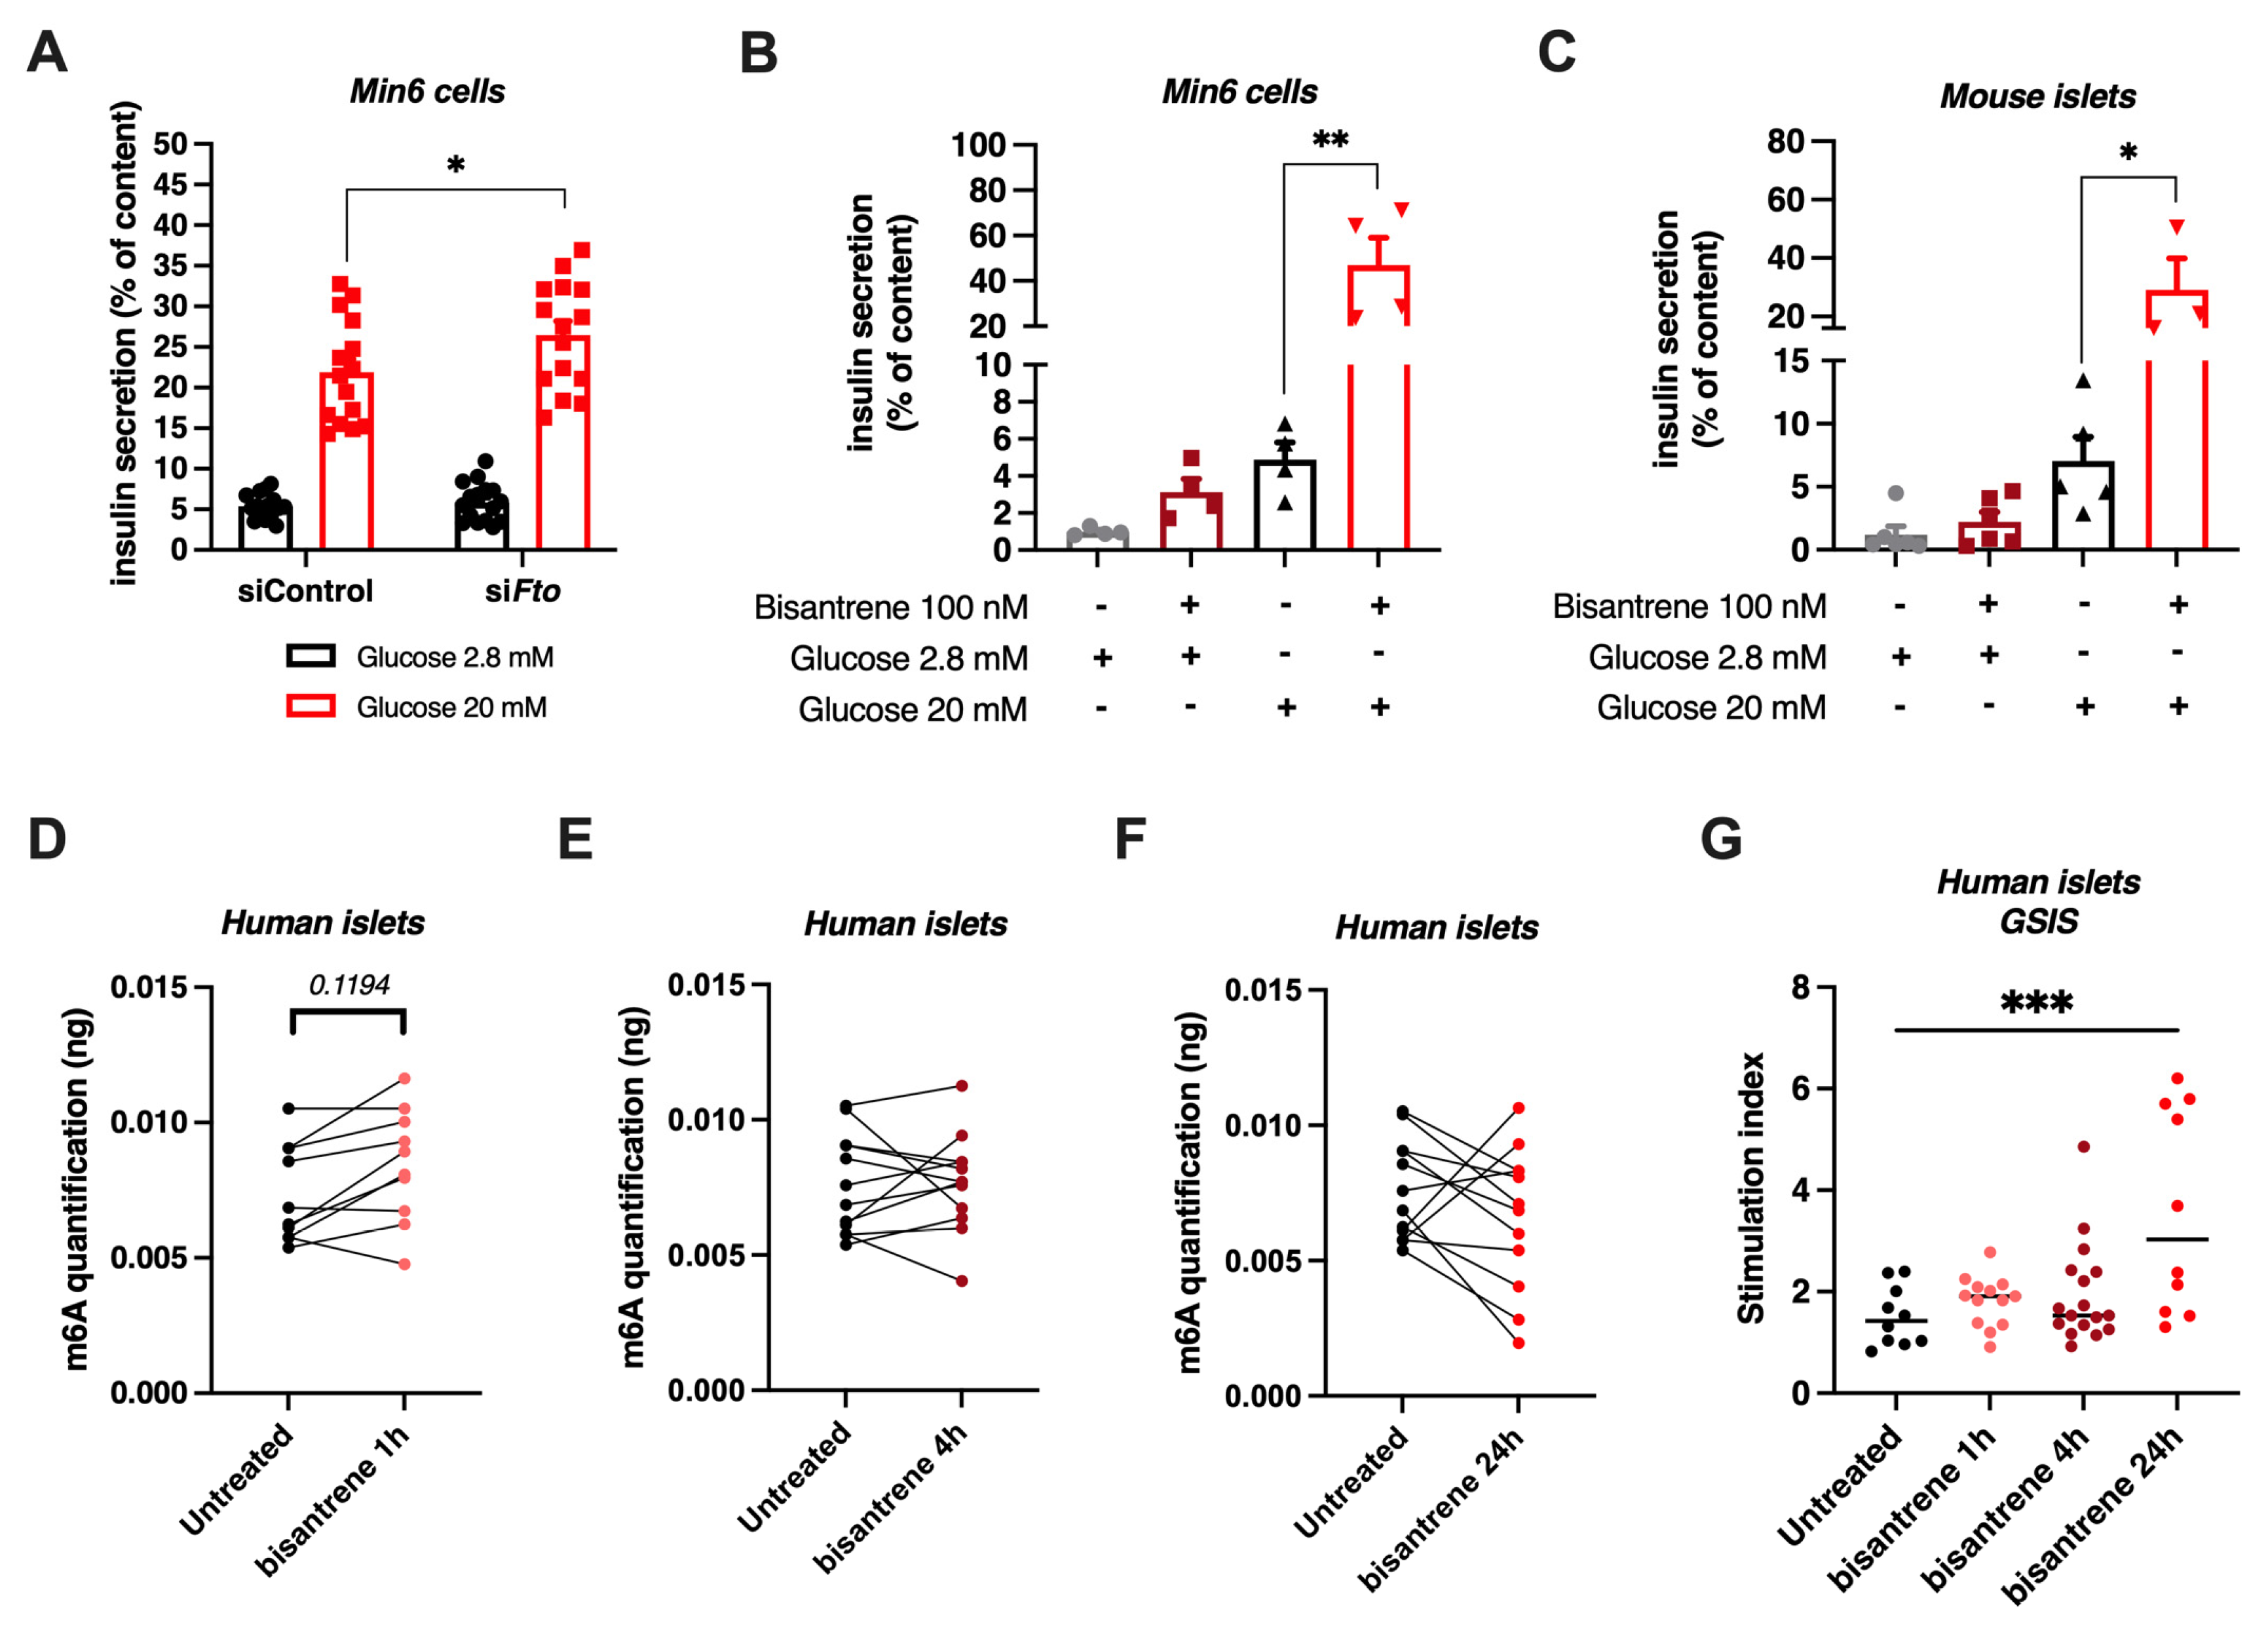
3.7. Knock-Down or Pharmacological Inhibition of FTO Stimulates Glucose-Induced Insulin Secretion
4. Discussion
Supplementary Materials
Author Contributions
Funding
Institutional Review Board Statement
Informed Consent Statement
Data Availability Statement
Acknowledgments
Conflicts of Interest
References
- Ndiaye, F.K.; Ortalli, A.; Canouil, M.; Huyvaert, M.; Salazar-Cardozo, C.; Lecoeur, C.; Verbanck, M.; Pawlowski, V.; Boutry, R.; Durand, E.; et al. Expression and Functional Assessment of Candidate Type 2 Diabetes Susceptibility Genes Identify Four New Genes Contributing to Human Insulin Secretion. Mol. Metab. 2017, 6, 459–470. [Google Scholar] [CrossRef]
- Ohn, J.H.; Kwak, S.H.; Cho, Y.M.; Lim, S.; Jang, H.C.; Park, K.S.; Cho, N.H. 10-Year Trajectory of β-Cell Function and Insulin Sensitivity in the Development of Type 2 Diabetes: A Community-Based Prospective Cohort Study. Lancet Diabetes Endocrinol. 2016, 4, 27–34. [Google Scholar] [CrossRef]
- Weir, G.C.; Bonner-Weir, S. Five Stages of Evolving Beta-Cell Dysfunction during Progression to Diabetes. Diabetes 2004, 53 (Suppl. 3), S16–S21. [Google Scholar] [CrossRef] [Green Version]
- Levy, J.; Atkinson, A.B.; Bell, P.M.; McCance, D.R.; Hadden, D.R. Beta-Cell Deterioration Determines the Onset and Rate of Progression of Secondary Dietary Failure in Type 2 Diabetes Mellitus: The 10-Year Follow-up of the Belfast Diet Study. Diabet. Med. 1998, 15, 290–296. [Google Scholar] [CrossRef]
- De Jesus, D.F.; Kulkarni, R.N. Epigenetic Modifiers of Islet Function and Mass. Trends Endocrinol. Metab. 2014, 25, 628–636. [Google Scholar] [CrossRef] [PubMed]
- Rodriguez, R.; Miller, K.M. Unravelling the Genomic Targets of Small Molecules Using High-Throughput Sequencing. Nat. Rev. Genet. 2014, 15, 783–796. [Google Scholar] [CrossRef]
- Mouchiroud, L.; Eichner, L.J.; Shaw, R.J.; Auwerx, J. Transcriptional Coregulators: Fine-Tuning Metabolism. Cell Metab. 2014, 20, 26–40. [Google Scholar] [CrossRef] [PubMed] [Green Version]
- Rabhi, N.; Denechaud, P.-D.; Gromada, X.; Hannou, S.A.; Zhang, H.; Rashid, T.; Salas, E.; Durand, E.; Sand, O.; Bonnefond, A.; et al. KAT2B Is Required for Pancreatic Beta Cell Adaptation to Metabolic Stress by Controlling the Unfolded Protein Response. Cell Rep. 2016, 15, 1051–1061. [Google Scholar] [CrossRef] [PubMed] [Green Version]
- Rabhi, N.; Hannou, S.A.; Froguel, P.; Annicotte, J.-S. Cofactors As Metabolic Sensors Driving Cell Adaptation in Physiology and Disease. Front. Endocrinol. 2017, 8, 304. [Google Scholar] [CrossRef] [PubMed] [Green Version]
- Arnes, L.; Sussel, L. Epigenetic Modifications and Long Noncoding RNAs Influence Pancreas Development and Function. Trends Genet. 2015, 31, 290–299. [Google Scholar] [CrossRef] [Green Version]
- Zhao, B.S.; Roundtree, I.A.; He, C. Post-Transcriptional Gene Regulation by MRNA Modifications. Nat. Rev. Mol. Cell Biol. 2017, 18, 31–42. [Google Scholar] [CrossRef] [PubMed]
- Varma Kadumuri, R.; Chandra Janga, S. Epitranscriptomic Code and Its Alterations in Human Disease. Trends Mol. Med. 2018, 24, 886–903. [Google Scholar] [CrossRef] [PubMed]
- Jones, J.D.; Monroe, J.; Koutmou, K.S. A Molecular-Level Perspective on the Frequency, Distribution, and Consequences of Messenger RNA Modifications. Wiley Interdiscip Rev. RNA 2020, 11, e1586. [Google Scholar] [CrossRef]
- Slobodin, B.; Han, R.; Calderone, V.; Vrielink, J.A.F.O.; Loayza-Puch, F.; Elkon, R.; Agami, R. Transcription Impacts the Efficiency of MRNA Translation via Co-Transcriptional N6-Adenosine Methylation. Cell 2017, 169, 326–337.e12. [Google Scholar] [CrossRef] [Green Version]
- Huang, H.; Weng, H.; Zhou, K.; Wu, T.; Zhao, B.S.; Sun, M.; Chen, Z.; Deng, X.; Xiao, G.; Auer, F.; et al. Histone H3 Trimethylation at Lysine 36 Guides M6A RNA Modification Co-Transcriptionally. Nature 2019, 567, 414–419. [Google Scholar] [CrossRef]
- Liu, J.; Yue, Y.; Han, D.; Wang, X.; Fu, Y.; Zhang, L.; Jia, G.; Yu, M.; Lu, Z.; Deng, X.; et al. A METTL3-METTL14 Complex Mediates Mammalian Nuclear RNA N6-Adenosine Methylation. Nat. Chem. Biol. 2014, 10, 93–95. [Google Scholar] [CrossRef] [Green Version]
- Ping, X.-L.; Sun, B.-F.; Wang, L.; Xiao, W.; Yang, X.; Wang, W.-J.; Adhikari, S.; Shi, Y.; Lv, Y.; Chen, Y.-S.; et al. Mammalian WTAP Is a Regulatory Subunit of the RNA N6-Methyladenosine Methyltransferase. Cell Res. 2014, 24, 177–189. [Google Scholar] [CrossRef] [Green Version]
- Schwartz, S.; Mumbach, M.R.; Jovanovic, M.; Wang, T.; Maciag, K.; Bushkin, G.G.; Mertins, P.; Ter-Ovanesyan, D.; Habib, N.; Cacchiarelli, D.; et al. Perturbation of M6A Writers Reveals Two Distinct Classes of MRNA Methylation at Internal and 5′ Sites. Cell Rep. 2014, 8, 284–296. [Google Scholar] [CrossRef] [Green Version]
- Patil, D.P.; Chen, C.-K.; Pickering, B.F.; Chow, A.; Jackson, C.; Guttman, M.; Jaffrey, S.R. M(6)A RNA Methylation Promotes XIST-Mediated Transcriptional Repression. Nature 2016, 537, 369–373. [Google Scholar] [CrossRef]
- Wen, J.; Lv, R.; Ma, H.; Shen, H.; He, C.; Wang, J.; Jiao, F.; Liu, H.; Yang, P.; Tan, L.; et al. Zc3h13 Regulates Nuclear RNA M6A Methylation and Mouse Embryonic Stem Cell Self-Renewal. Mol. Cell 2018, 69, 1028–1038.e6. [Google Scholar] [CrossRef] [PubMed] [Green Version]
- Yue, Y.; Liu, J.; Cui, X.; Cao, J.; Luo, G.; Zhang, Z.; Cheng, T.; Gao, M.; Shu, X.; Ma, H.; et al. VIRMA Mediates Preferential M6A MRNA Methylation in 3′UTR and near Stop Codon and Associates with Alternative Polyadenylation. Cell Discov. 2018, 4, 10. [Google Scholar] [CrossRef] [Green Version]
- Dina, C.; Meyre, D.; Gallina, S.; Durand, E.; Körner, A.; Jacobson, P.; Carlsson, L.M.S.; Kiess, W.; Vatin, V.; Lecoeur, C.; et al. Variation in FTO Contributes to Childhood Obesity and Severe Adult Obesity. Nat. Genet. 2007, 39, 724–726. [Google Scholar] [CrossRef] [PubMed]
- Jia, G.; Fu, Y.; Zhao, X.; Dai, Q.; Zheng, G.; Yang, Y.; Yi, C.; Lindahl, T.; Pan, T.; Yang, Y.-G.; et al. N6-Methyladenosine in Nuclear RNA Is a Major Substrate of the Obesity-Associated FTO. Nat. Chem. Biol. 2011, 7, 885–887. [Google Scholar] [CrossRef] [PubMed]
- Zheng, G.; Dahl, J.A.; Niu, Y.; Fedorcsak, P.; Huang, C.-M.; Li, C.J.; Vågbø, C.B.; Shi, Y.; Wang, W.-L.; Song, S.-H.; et al. ALKBH5 Is a Mammalian RNA Demethylase That Impacts RNA Metabolism and Mouse Fertility. Mol. Cell 2013, 49, 18–29. [Google Scholar] [CrossRef] [Green Version]
- Dominissini, D.; Moshitch-Moshkovitz, S.; Schwartz, S.; Salmon-Divon, M.; Ungar, L.; Osenberg, S.; Cesarkas, K.; Jacob-Hirsch, J.; Amariglio, N.; Kupiec, M.; et al. Topology of the Human and Mouse M6A RNA Methylomes Revealed by M6A-Seq. Nature 2012, 485, 201–206. [Google Scholar] [CrossRef]
- Ke, S.; Alemu, E.A.; Mertens, C.; Gantman, E.C.; Fak, J.J.; Mele, A.; Haripal, B.; Zucker-Scharff, I.; Moore, M.J.; Park, C.Y.; et al. A Majority of M6A Residues Are in the Last Exons, Allowing the Potential for 3′ UTR Regulation. Genes Dev. 2015, 29, 2037–2053. [Google Scholar] [CrossRef] [PubMed] [Green Version]
- Meyer, K.D.; Saletore, Y.; Zumbo, P.; Elemento, O.; Mason, C.E.; Jaffrey, S.R. Comprehensive Analysis of MRNA Methylation Reveals Enrichment in 3′ UTRs and near Stop Codons. Cell 2012, 149, 1635–1646. [Google Scholar] [CrossRef] [Green Version]
- Wang, X.; Zhao, B.S.; Roundtree, I.A.; Lu, Z.; Han, D.; Ma, H.; Weng, X.; Chen, K.; Shi, H.; He, C. N(6)-Methyladenosine Modulates Messenger RNA Translation Efficiency. Cell 2015, 161, 1388–1399. [Google Scholar] [CrossRef] [Green Version]
- Xiao, W.; Adhikari, S.; Dahal, U.; Chen, Y.-S.; Hao, Y.-J.; Sun, B.-F.; Sun, H.-Y.; Li, A.; Ping, X.-L.; Lai, W.-Y.; et al. Nuclear m(6)A Reader YTHDC1 Regulates MRNA Splicing. Mol. Cell 2016, 61, 507–519. [Google Scholar] [CrossRef] [Green Version]
- Wang, X.; Lu, Z.; Gomez, A.; Hon, G.C.; Yue, Y.; Han, D.; Fu, Y.; Parisien, M.; Dai, Q.; Jia, G.; et al. N6-Methyladenosine-Dependent Regulation of Messenger RNA Stability. Nature 2014, 505, 117–120. [Google Scholar] [CrossRef]
- Liu, N.; Zhou, K.I.; Parisien, M.; Dai, Q.; Diatchenko, L.; Pan, T. N6-Methyladenosine Alters RNA Structure to Regulate Binding of a Low-Complexity Protein. Nucleic Acids Res. 2017, 45, 6051–6063. [Google Scholar] [CrossRef] [Green Version]
- Roundtree, I.A.; Luo, G.-Z.; Zhang, Z.; Wang, X.; Zhou, T.; Cui, Y.; Sha, J.; Huang, X.; Guerrero, L.; Xie, P.; et al. YTHDC1 Mediates Nuclear Export of N6-Methyladenosine Methylated MRNAs. Elife 2017, 6, e31311. [Google Scholar] [CrossRef]
- Geula, S.; Moshitch-Moshkovitz, S.; Dominissini, D.; Mansour, A.A.; Kol, N.; Salmon-Divon, M.; Hershkovitz, V.; Peer, E.; Mor, N.; Manor, Y.S.; et al. Stem Cells. M6A MRNA Methylation Facilitates Resolution of Naïve Pluripotency toward Differentiation. Science 2015, 347, 1002–1006. [Google Scholar] [CrossRef] [PubMed]
- Fustin, J.-M.; Doi, M.; Yamaguchi, Y.; Hida, H.; Nishimura, S.; Yoshida, M.; Isagawa, T.; Morioka, M.S.; Kakeya, H.; Manabe, I.; et al. RNA-Methylation-Dependent RNA Processing Controls the Speed of the Circadian Clock. Cell 2013, 155, 793–806. [Google Scholar] [CrossRef] [PubMed] [Green Version]
- De Jesus, D.F.; Zhang, Z.; Kahraman, S.; Brown, N.K.; Chen, M.; Hu, J.; Gupta, M.K.; He, C.; Kulkarni, R.N. M6A MRNA Methylation Regulates Human β-Cell Biology in Physiological States and in Type 2 Diabetes. Nat. Metab. 2019, 1, 765–774. [Google Scholar] [CrossRef] [PubMed]
- Liu, J.; Luo, G.; Sun, J.; Men, L.; Ye, H.; He, C.; Ren, D. METTL14 Is Essential for β-Cell Survival and Insulin Secretion. Biochim. Biophys. Acta Mol. Basis Dis. 2019, 1865, 2138–2148. [Google Scholar] [CrossRef]
- Men, L.; Sun, J.; Luo, G.; Ren, D. Acute Deletion of METTL14 in β-Cells of Adult Mice Results in Glucose Intolerance. Endocrinology 2019, 160, 2388–2394. [Google Scholar] [CrossRef] [PubMed]
- Wang, Y.; Sun, J.; Lin, Z.; Zhang, W.; Wang, S.; Wang, W.; Wang, Q.; Ning, G. M6A MRNA Methylation Controls Functional Maturation in Neonatal Murine β-Cells. Diabetes 2020, 69, 1708–1722. [Google Scholar] [CrossRef]
- Shen, F.; Huang, W.; Huang, J.-T.; Xiong, J.; Yang, Y.; Wu, K.; Jia, G.-F.; Chen, J.; Feng, Y.-Q.; Yuan, B.-F.; et al. Decreased N(6)-Methyladenosine in Peripheral Blood RNA from Diabetic Patients Is Associated with FTO Expression Rather than ALKBH5. J. Clin. Endocrinol. Metab. 2015, 100, E148–E154. [Google Scholar] [CrossRef] [Green Version]
- Yang, Y.; Shen, F.; Huang, W.; Qin, S.; Huang, J.-T.; Sergi, C.; Yuan, B.-F.; Liu, S.-M. Glucose Is Involved in the Dynamic Regulation of M6A in Patients With Type 2 Diabetes. J. Clin. Endocrinol. Metab. 2019, 104, 665–673. [Google Scholar] [CrossRef] [PubMed] [Green Version]
- Kerr-Conte, J.; Vandewalle, B.; Moerman, E.; Lukowiak, B.; Gmyr, V.; Arnalsteen, L.; Caiazzo, R.; Sterkers, A.; Hubert, T.; Vantyghem, M.C.; et al. Upgrading Pretransplant Human Islet Culture Technology Requires Human Serum Combined with Media Renewal. Transplantation 2010, 89, 1154–1160. [Google Scholar] [CrossRef]
- Rabhi, N.; Hannou, S.A.; Gromada, X.; Salas, E.; Yao, X.; Oger, F.; Carney, C.; Lopez-Mejia, I.C.; Durand, E.; Rabearivelo, I.; et al. Cdkn2a Deficiency Promotes Adipose Tissue Browning. Mol. Metab. 2018, 8, 65–76. [Google Scholar] [CrossRef]
- Chan, J.Y.; Luzuriaga, J.; Bensellam, M.; Biden, T.J.; Laybutt, D.R. Failure of the Adaptive Unfolded Protein Response in Islets of Obese Mice Is Linked with Abnormalities in β-Cell Gene Expression and Progression to Diabetes. Diabetes 2013, 62, 1557–1568. [Google Scholar] [CrossRef] [PubMed] [Green Version]
- Chehade, J.M.; Gladysz, M.; Mooradian, A.D. Dyslipidemia in Type 2 Diabetes: Prevalence, Pathophysiology, and Management. Drugs 2013, 73, 327–339. [Google Scholar] [CrossRef] [PubMed]
- Watson, M.L.; Macrae, K.; Marley, A.E.; Hundal, H.S. Chronic Effects of Palmitate Overload on Nutrient-Induced Insulin Secretion and Autocrine Signalling in Pancreatic MIN6 Beta Cells. PLoS ONE 2011, 6, e25975. [Google Scholar] [CrossRef] [PubMed]
- Oh, Y.S.; Bae, G.D.; Baek, D.J.; Park, E.-Y.; Jun, H.-S. Fatty Acid-Induced Lipotoxicity in Pancreatic Beta-Cells During Development of Type 2 Diabetes. Front. Endocrinol. 2018, 9, 384. [Google Scholar] [CrossRef] [PubMed]
- Lytrivi, M.; Castell, A.-L.; Poitout, V.; Cnop, M. Recent Insights Into Mechanisms of β-Cell Lipo- and Glucolipotoxicity in Type 2 Diabetes. J. Mol. Biol. 2020, 432, 1514–1534. [Google Scholar] [CrossRef] [PubMed]
- Karaskov, E.; Scott, C.; Zhang, L.; Teodoro, T.; Ravazzola, M.; Volchuk, A. Chronic Palmitate But Not Oleate Exposure Induces Endoplasmic Reticulum Stress, Which May Contribute to INS-1 Pancreatic β-Cell Apoptosis. Endocrinology 2006, 147, 3398–3407. [Google Scholar] [CrossRef] [PubMed] [Green Version]
- Su, R.; Dong, L.; Li, Y.; Gao, M.; Han, L.; Wunderlich, M.; Deng, X.; Li, H.; Huang, Y.; Gao, L.; et al. Targeting FTO Suppresses Cancer Stem Cell Maintenance and Immune Evasion. Cancer Cell 2020, 38, 79–96.e11. [Google Scholar] [CrossRef]
- Church, C.; Lee, S.; Bagg, E.A.L.; McTaggart, J.S.; Deacon, R.; Gerken, T.; Lee, A.; Moir, L.; Mecinović, J.; Quwailid, M.M.; et al. A Mouse Model for the Metabolic Effects of the Human Fat Mass and Obesity Associated FTO Gene. PLoS Genet. 2009, 5, e1000599. [Google Scholar] [CrossRef] [Green Version]
- Church, C.; Moir, L.; McMurray, F.; Girard, C.; Banks, G.T.; Teboul, L.; Wells, S.; Bruning, J.C.; Nolan, P.M.; Ashcroft, F.M.; et al. Overexpression of Fto Leads to Increased Food Intake and Results in Obesity. Nat. Genet. 2010, 42, 1086–1092. [Google Scholar] [CrossRef]
- Karra, E.; O’Daly, O.G.; Choudhury, A.I.; Yousseif, A.; Millership, S.; Neary, M.T.; Scott, W.R.; Chandarana, K.; Manning, S.; Hess, M.E.; et al. A Link between FTO, Ghrelin, and Impaired Brain Food-Cue Responsivity. J. Clin. Invest. 2013, 123, 3539–3551. [Google Scholar] [CrossRef] [PubMed] [Green Version]
- Ke, S.; Pandya-Jones, A.; Saito, Y.; Fak, J.J.; Vågbø, C.B.; Geula, S.; Hanna, J.H.; Black, D.L.; Darnell, J.E.; Darnell, R.B. M6A MRNA Modifications Are Deposited in Nascent Pre-MRNA and Are Not Required for Splicing but Do Specify Cytoplasmic Turnover. Genes Dev. 2017, 31, 990–1006. [Google Scholar] [CrossRef] [PubMed] [Green Version]
- Castellanos-Rubio, A.; Santin, I.; Olazagoitia-Garmendia, A.; Romero-Garmendia, I.; Jauregi-Miguel, A.; Legarda, M.; Bilbao, J.R. A Novel RT-QPCR-Based Assay for the Relative Quantification of Residue Specific M6A RNA Methylation. Sci. Rep. 2019, 9, 4220. [Google Scholar] [CrossRef] [PubMed]
- Linder, B.; Grozhik, A.V.; Olarerin-George, A.O.; Meydan, C.; Mason, C.E.; Jaffrey, S.R. Single-Nucleotide-Resolution Mapping of M6A and M6Am throughout the Transcriptome. Nat. Methods 2015, 12, 767–772. [Google Scholar] [CrossRef]
- Marselli, L.; Piron, A.; Suleiman, M.; Colli, M.L.; Yi, X.; Khamis, A.; Carrat, G.R.; Rutter, G.A.; Bugliani, M.; Giusti, L.; et al. Persistent or Transient Human β Cell Dysfunction Induced by Metabolic Stress: Specific Signatures and Shared Gene Expression with Type 2 Diabetes. Cell Rep. 2020, 33, 108466. [Google Scholar] [CrossRef]


Publisher’s Note: MDPI stays neutral with regard to jurisdictional claims in published maps and institutional affiliations. |
© 2022 by the authors. Licensee MDPI, Basel, Switzerland. This article is an open access article distributed under the terms and conditions of the Creative Commons Attribution (CC BY) license (https://creativecommons.org/licenses/by/4.0/).
Share and Cite
Bornaque, F.; Delannoy, C.P.; Courty, E.; Rabhi, N.; Carney, C.; Rolland, L.; Moreno, M.; Gromada, X.; Bourouh, C.; Petit, P.; et al. Glucose Regulates m6A Methylation of RNA in Pancreatic Islets. Cells 2022, 11, 291. https://doi.org/10.3390/cells11020291
Bornaque F, Delannoy CP, Courty E, Rabhi N, Carney C, Rolland L, Moreno M, Gromada X, Bourouh C, Petit P, et al. Glucose Regulates m6A Methylation of RNA in Pancreatic Islets. Cells. 2022; 11(2):291. https://doi.org/10.3390/cells11020291
Chicago/Turabian StyleBornaque, Florine, Clément Philippe Delannoy, Emilie Courty, Nabil Rabhi, Charlène Carney, Laure Rolland, Maeva Moreno, Xavier Gromada, Cyril Bourouh, Pauline Petit, and et al. 2022. "Glucose Regulates m6A Methylation of RNA in Pancreatic Islets" Cells 11, no. 2: 291. https://doi.org/10.3390/cells11020291