Experimental Clarification of the RWGS Reaction Effect in H2O/CO2 SOEC Co-Electrolysis Conditions


1
Foundation for Research and Technology, Institute of Chemical Engineering Sciences (FORTH/ICE-HT), Patras, GR-26504, Greece
2
Department of Chemical Engineering, University of Patras, GR-56504, Greece
*
Author to whom correspondence should be addressed.
Catalysts 2019, 9(2), 151; https://doi.org/10.3390/catal9020151
Submission received: 31 December 2018
/
Revised: 28 January 2019
/
Accepted: 29 January 2019
/
Published: 2 February 2019
(This article belongs to the Special Issue Emissions Control Catalysis)
Abstract
:In the present investigation, modified X-Ni/GDC electrodes (where X = Au, Mo, and Fe) are studied, in the form of half-electrolyte supported cells, for their performance in the RWGS through catalytic-kinetic measurements. The samples were tested at open circuit potential conditions in order to elucidate their catalytic activity towards the production of CO (rco), which is one of the products of the H2O/CO2 co-electrolysis reaction. Physicochemical characterization is also presented, in which the samples were examined in the form of powders and as half cells with BET, H2-TPR, Air-TPO and TGA re-oxidation measurements in the presence of H2O. In brief, it was found that the rate of the produced CO (rco) increases by increasing the operating temperature and the partial pressure of H2 in the reaction mixture. In addition, the first results revealed that Fe and Mo modification enhances the catalytic production of CO, since the 2wt% Fe-Ni/GDC and 3wt% Mo-Ni/GDC electrodes were proven to perform better compared to the other samples, in the whole studied temperature range (800–900 °C), reaching thermodynamic equilibrium. Furthermore, carbon formation was not detected.
1. Introduction
Solid oxide electrolysis is a contemporary process for CO2 capture/recycling, which is proven as an attractive method to provide CO2 neutral synthetic hydrocarbon fuels. In particular, co-electrolysis of H2O and CO2 in a solid oxide electrolysis cell (SOEC) yields synthesis gas (CO + H2), which in turn can be used towards the formation of various types of synthetic fuels [1,2,3] by applying the Fischer-Tropsch process. According to thermodynamics, SOECs offer benefits for endothermic reactions, such as H2O and/or CO2 electrolysis at temperatures >700 °C, because a larger part of the required electrical energy can be substituted by thermal energy [4,5]. In addition, high temperature can lead to a significant decrease in the internal resistance of the cell and acceleration of the electrode reaction processes due to fast reaction kinetics [4,5,6,7].
H2O/CO2 Co-electrolysis is a much more complex process compared to pure steam or CO2 electrolysis. This is because three reactions take place simultaneously, namely H2O electrolysis, CO2 electrolysis, and the catalytic Reverse Water Gas Shift reaction (RWGS). More specifically, at the cathode of SOECs, two electrochemical reactions take place in parallel at the triple phase boundaries, i.e., H2O and CO2 electrochemical reductions. The oxygen ions (O2−), produced by these reactions, are moved to the anode, through an oxygen ion-conducting electrolyte (Yttria-Stabilized Zirconia − YSZ), where oxygen (O2) gas is formed [8,9]:
Cathode: H2O + 2e− → H2 + O2− ΔH800 °C = 151.8 kJ/mol
CO2 + 2e− → CO + O2− ΔH800 °C = 185.9 kJ/mol
Anode: O2− → ½ O2 + 2e−
Besides the electrolysis reactions mentioned above, the reversible water gas shift (RWGS) catalytic reaction also occurs at the cathode with the co-existence of CO2 and H2O:
Cathode: H2 + CO2 → H2O + CO ΔH800 °C = 36.8 kJ/mol
It thus appears that CO can be produced either electrocatalytically by the reduction of CO2 or catalytically via the RWGS reaction. Questionable conclusions have been proposed in the literature about the role of the RWGS reaction for CO production. Some studies mention that CO is mainly produced electrocatalytically and RWGS has a small participation [10,11,12,13,14,15], while other studies mention that CO is absolutely produced catalytically via the RWGS reaction [16,17]. However, it has not been shown conclusively to which degree the RWGS is responsible for CO production in an SOEC.
Specifically, Mogensen and co-researchers found that the performance of co-electrolysis on an Ni/YSZ cathode varied between the highest pure H2O electrolysis and the lowest CO2 electrolysis, being much closer to the prior process [13,14]. This implies the significant contribution of the RWGS reaction in the H2O/CO2 SOEC co-electrolysis process and also confirms the co-existence of CO2 electrolysis. The above conclusion was supported by recently published results on computational modelling of the direct and indirect (with electro-generated H2) reduction of CO2 [18,19]. The direction of the Water Gas Shift (WGS) reaction could be forward or backward, depending on the operating conditions, indicating that at high temperatures (>838 °C), CO was produced electrochemically and the WGS was shifted in reverse towards H2 and CO2.
In contrast, Yue and Irvine [20] suggested that the RWGS reaction did not contribute critically in catalysing H2O/CO2 co-electrolysis on s (La,Sr)(Cr,Mn)O3 (LSCM) perovskite based cathode. The LSCM cathode displayed higher catalytic activity for pure CO2 electrolysis than pure H2O electrolysis, and the performance for H2O/CO2 co-electrolysis was much closer to pure CO2 electrolysis.
On the other hand, Bae et al., Hartvigsen et al., Kee et al., and Zhao et al. considered that CO production on Ni-based cathodes was mainly from the RWGS reaction, whereas the electrochemical processes are dominated by H2O electrolysis with identical performances for H2O electrolysis and H2O/CO2 co-electrolysis [16,17,21].
According to the above mentioned reports, until now, no agreement has been reached regarding the role of the RWGS reaction in the production of CO. As a result, it is crucial to quantify the degree of CO formation for each reaction. The discrepancies regarding the CO production route can be affected both by the structural characteristics of the electrode/catalyst (specific surface area, reducibility and re-oxidation behaviour, porosity, particle size, ionic and electronic conductivity), but also by the operating conditions (gas composition, temperature, etc.) [9,22]. As reported by Li’s study [10], the heterogeneous thermochemical reactions occur at the external surface of the cathode and they are 20–100 times faster than the electrochemical reactions, which occur close to the electrolyte at the three phase boundaries. Furthermore, structural modifications of the cathode could enhance mass transport and promote CO production through the catalytic RWGS reaction, resulting in H2O/CO2 co-electrolysis performance close to that of H2O electrolysis.
The majority of studies on high temperature H2O/CO2 co-electrolysis utilize Ni-containing ceramic cathodes with YSZ and Gadolinia-Doped Ceria (GDC), similarly to the case of H2O electrolysis [10,11,12,13,14]. Ni-based materials indeed are cheap and exhibit porous structure, high electronic conductivity, appropriate catalytic activity, and a similar Thermal Expansion Coefficient (TEC) with the electrolyte. Consequently, they could act as excellent SOECs cathodes for H2O/CO2 co-electrolysis [7,22,23,24,25,26].
However, SOECs comprising Ni-based cathodes face some critical degradation issues, which are more pronounced with an increasing current density [3,12,14,27,28,29,30,31,32,33]. The main reasons for degradation have been reported to be microstructural changes that take place after prolonged co-electrolysis, resulting in passivation and blocking of the Three-Phase Boundaries (TPB) area [12,13,28,30,31,33,34]. Post-mortem microscopy investigations in the Ni/YSZ electrode have shown irreversible damages of the electrode’s microstructure, such as loss of Ni-YSZ contact, decomposition of YSZ, Ni grain growth, loss of Ni percolation (loss of Ni–Ni contact), and even migration of Ni from the fuel electrode [28,30,31,33]. Taking into account the above, it is critical to develop alternative cathode materials for H2O/CO2 co-electrolysis with improved structural properties.
Previous studies reported that the electrocatalytic efficiency of SOECs can be improved by alloying transition metals with the state of the art (SoA) Ni catalyst [35,36,37,38,39]. Modification by means of alloying may be a promising strategy to promote the catalytic activity due to ligand and strain effects that change the electronic structure [40] of the active element. Recent studies focused on the Ni–Co alloy with Sm-doped ceria (Ni–Co/SDC) as an alternative material, with enhanced performance for H2O electrolysis in SOECs [36]. Specifically, the addition of Co increased the intrinsic catalytic activity of pure Ni and simultaneously expanded the active reaction region [36,41]. Other reports have shown that an Ni–Fe bimetallic cathode, mixed with Ba0.6La0.4CoO3 on La0.9Sr0.1Ga0.8Mg0.2O3 (LSGM) electrolyte, improved the electrochemical performance of the electrode for H2O electrolysis [38] and CO2 electrolysis [39], due to prevention of Ni aggregation. Furthermore, the enhanced performance of the Ni–Fe formulations could be attributed to the increased stability and improved catalytic activity, due to the addition of Fe, as this was concluded by combining experimental results with theoretical Density Functional Theory (DFT) calculations [41].
Our research group have studied the effect of Au and/or Mo doping on the physicochemical and catalytic properties of Ni/GDC for the reactions of catalytic CH4 dissociation and methane steam reforming [23,42,43,44,45] in the presence of H2 and H2S impurities. These modifications resulted in SOFC fuel electrodes with high sulfur and carbon tolerance as well as with improved electrocatalytic activity. Regarding the doping level of Au and Mo, the amount of 3wt% was indicated as an appropriate loading for achieving the most promising results under the examined SOFC conditions. Recently, the 3wt% Au-Ni/GDC electrode was tested under SOEC conditions for the H2O electrolysis process and exhibited improved electrocatalytic performance compared to Ni/GDC [46]. The enhanced performance of the Au-doped cathode was attributed to the creation of a surface Ni–Au solid solution, which causes weaker interplay of absorbed H2Oads and Oads species with the modified cathode. The result is a durable and resistant electrode to surface oxidation with an improved “three phase boundaries” area, especially at temperatures higher than 800 °C [46].
The presented investigation deals with modified X-Ni/GDC electrodes (where X = Au, Mo, Fe), in the form of half-Electrolyte Supported Cells (ESCs), for their performance in the RWGS through catalytic-kinetic measurements. Ni/GDC, 3wt% Au-Ni/GDC, 3wt% Mo-Ni/GDC, 3wt% Au–3wt% Mo-Ni/GDC, and 2wt% Fe-Ni/GDC modified cathodes were tested at Open Circuit Potential (OCP) conditions to elucidate their catalytic activity towards the production of CO (rco), which is one of the products from the H2O/CO2 co-electrolysis reaction. The latter approach is considered as an attempt to create a reference profile for the catalytic performance of the candidate electrodes, by applying the same H2O/CO2/H2 feed conditions as those under the co-electrolysis operational mode. The samples, both in the form of powders and as half cells, were physicochemically characterized, including specific redox stability measurements in the presence of H2O.
2. Results and Discussion
2.1. Physicochemical Characterization
2.1.1. Specific Surface Area Values of Au–Mo–Fe-Modified Powders
The specific surface area values (SSA) for the modified-NiO/GDC samples, calcined in air at 600 and 1100 °C, as well as after reduction with H2 at 850 °C, are presented in Table 1.
The first remark is that all samples exhibit quite similar and low SSA values, which decrease further by increasing the calcination temperature from 600 °C to 1100 °C and after H2 reduction at 850 °C. Furthermore, Mo and Au–Mo modification slightly decrease the SSA of Ni/GDC, while the addition of Fe causes a significant increase in the SSA values up to approximately 70%. Taking into account the generally low values and the ±0.2 m2 g−1 accuracy limits of the measurements, it can be concluded that the reduced Mo and Au–Mo-Ni/GDC powders have similar SSAs with Ni/GDC. On the other hand, the 70% increase in the SSA of the Fe modified sample can be primarily ascribed to the formation of FeOx species, in the oxidized form of the sample, which inhibit the decrease of SSA during reduction.
2.1.2. H2 Reducibility and air Re-Oxidation Behaviour of Au–Mo–Fe-Modified Powders
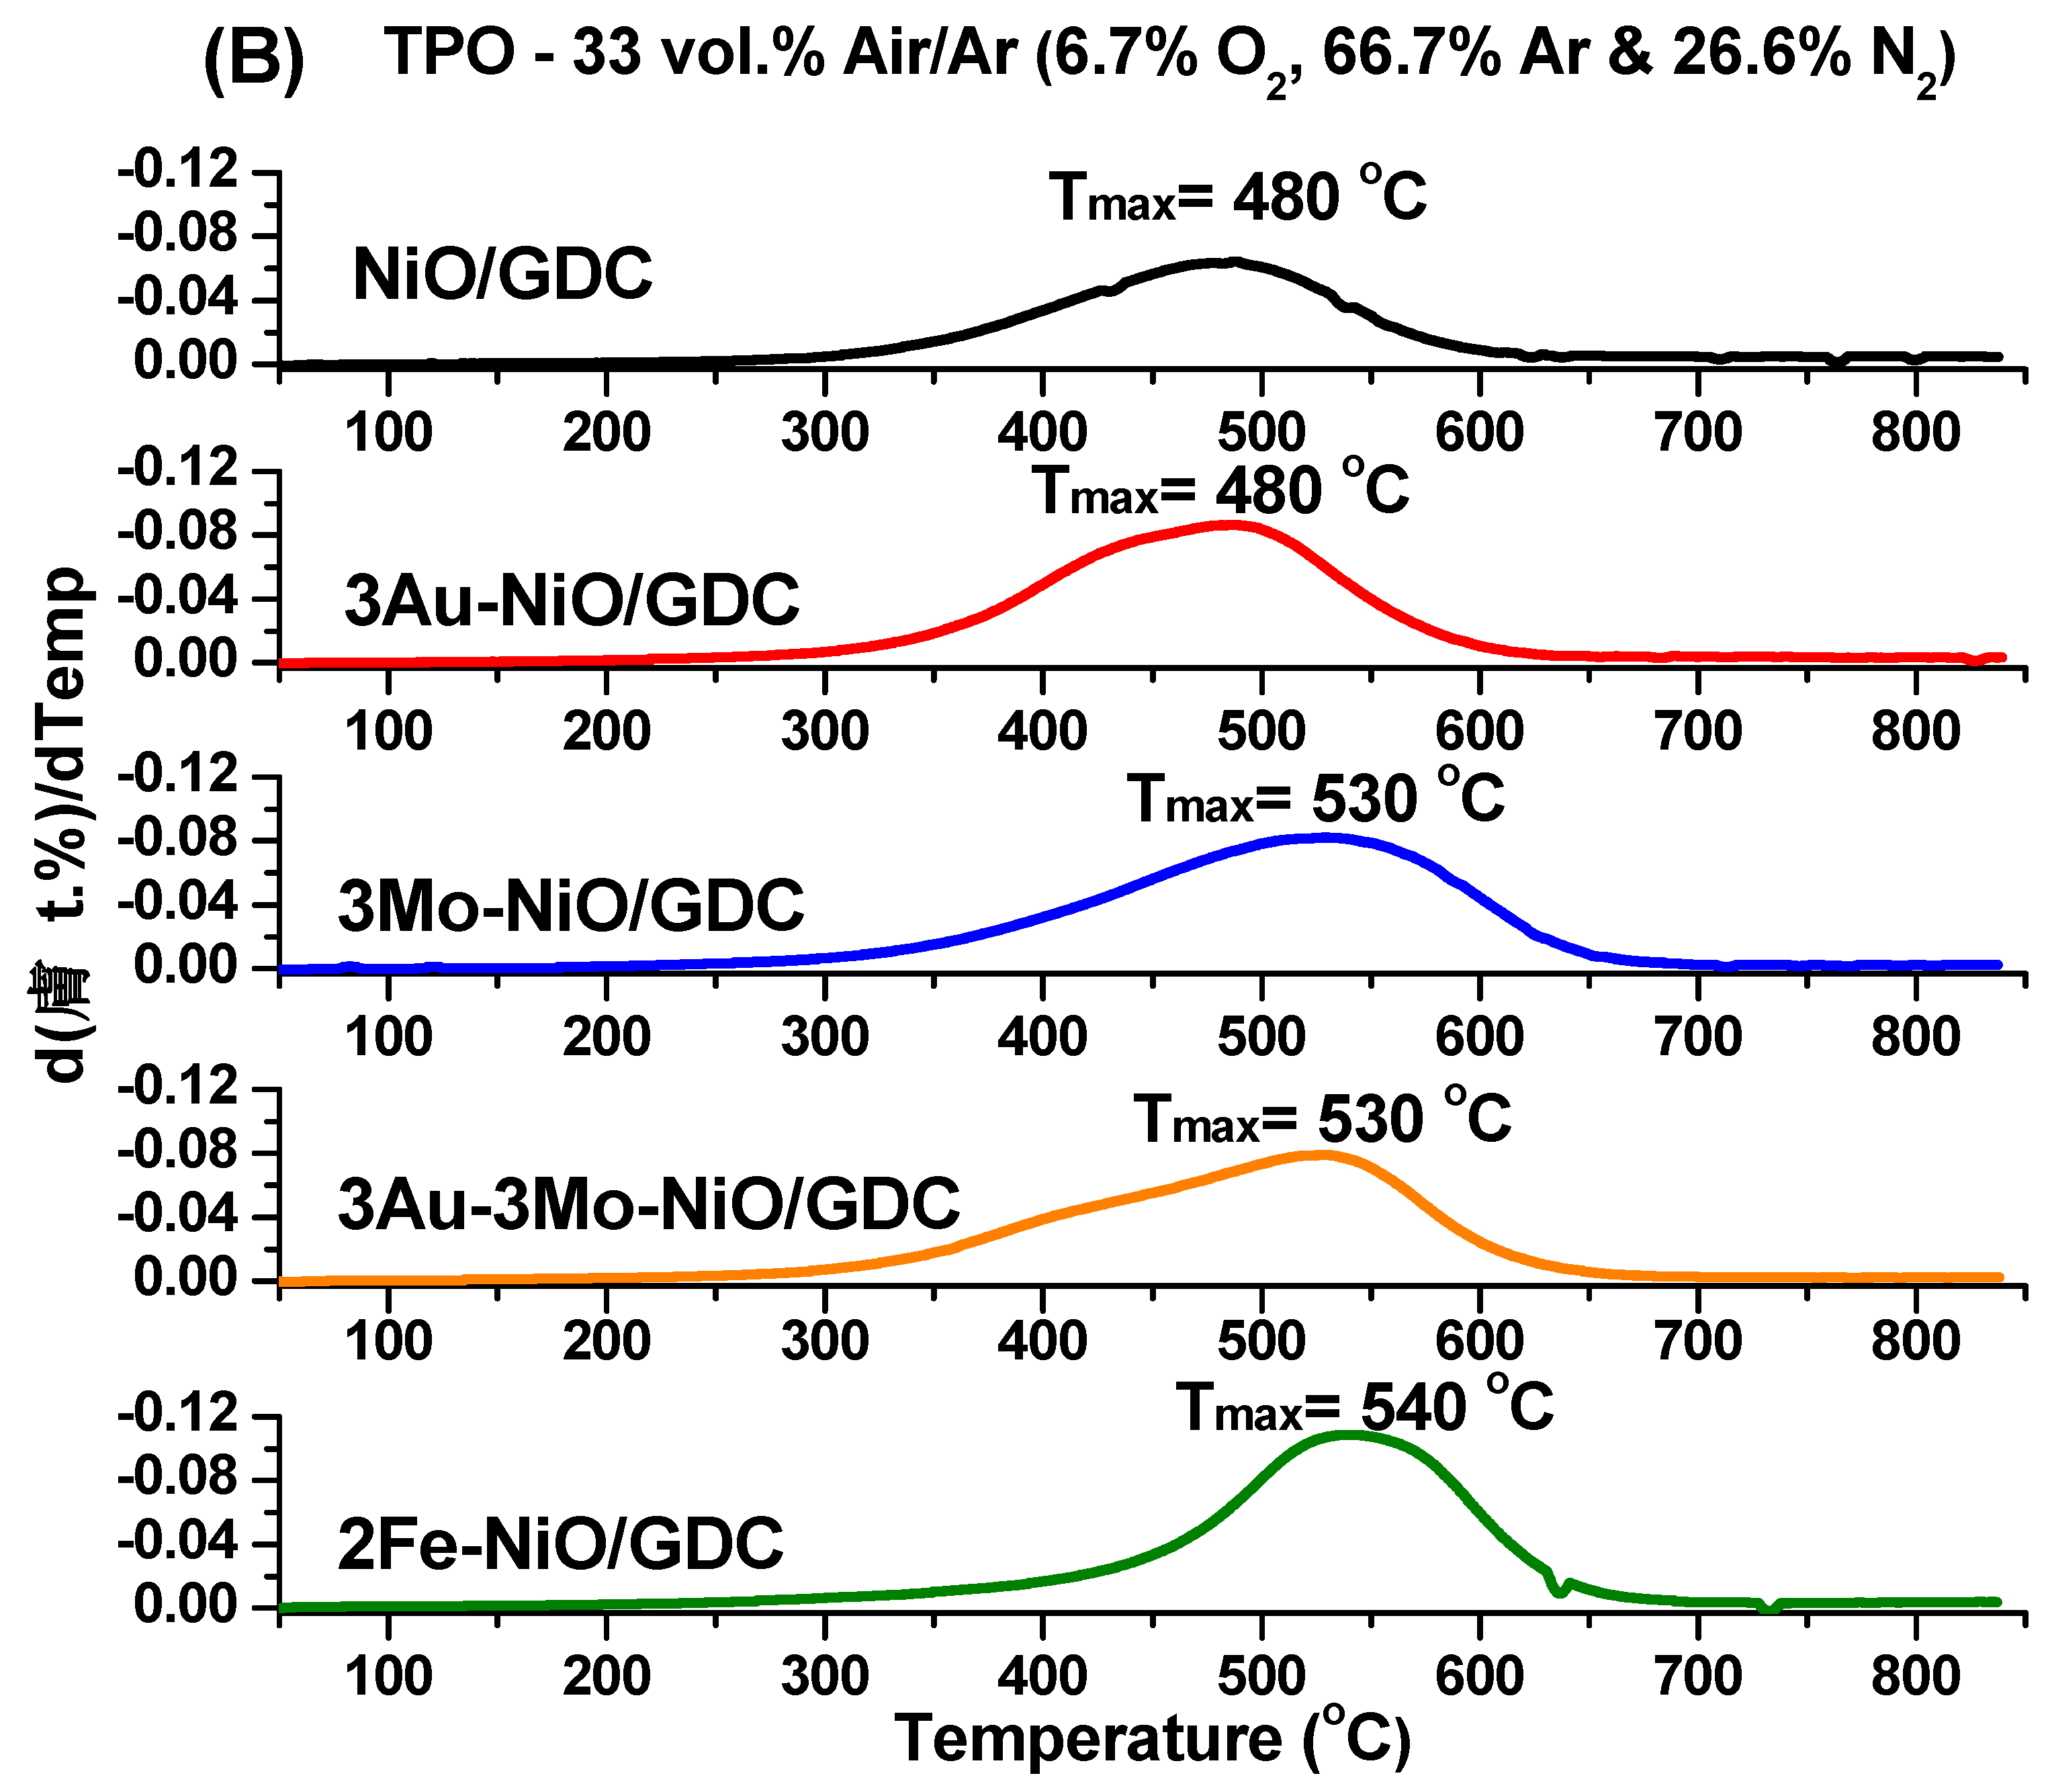
Temperature Programmed Reduction followed by Oxidation (H2-TPR, Air-TPO) measurements were performed, in order to investigate the reducibility and re-oxidation behavior of the prepared composite powders, as well as the existence of possible bulk effects due to the modification with Au, Mo, and Fe. The corresponding H2-TPR and Air-TPO TGA profiles of modified-NiO/GDC samples, calcined at 1100 °C, are presented in Figure 1.
H2-TPR and air-TPO measurements showed different reduction and oxidation behavior in each of the examined modified samples. In particular, two main reduction peaks (Figure 1A) and one oxidation peak (Figure 1B) are mainly observed, which can be attributed to the reduction of NiO species to Ni and the reverse [42,47]. Moreover, the presence of Au does not seem to affect significantly the reduction of NiO. On the other hand, MoO3 and, to a certain extent, Fe inhibit the NiO reduction, implying a stronger Ni–O bond. The inhibition effect of MoO3 is also observed in the case of the ternary 3Au–3Mo-NiO/GDC sample and indicates a bulk interaction between Ni–Au–Mo, which has been thoroughly investigated in previous studies [23,42,43]. In particular, the second broad peak (“shoulder”) at 580 °C, which is observed for the 3Mo-NiO/GDC and 3Au–3Mo-NiO/GDC samples, may be associated with the reduction of MoO3 species, which are reduced at higher temperatures in the range of 600–770 °C [42,47]. The presence of Fe seems to affect the main reduction peak of NiO, in a similar way as MoO3, suggesting the possible formation of a solid solution between Ni and Fe. The latter observation is currently under further clarification.
Upon re-oxidation of the samples, the unmodified Ni/GDC as well as the Au modified sample are oxidized practically at the same temperature with a similar TPO profile. The reduced state of the Fe, Mo-, and Au–Mo- modified samples proved to be more resistant to re-oxidation in 33 vol.% air/Ar (6.7 vol.% O2/Ar), since they had to reach higher temperature for complete re-oxidation.
2.1.3. H2O Re-Oxidation Profiles of Au-Mo-Fe–Modified Powders
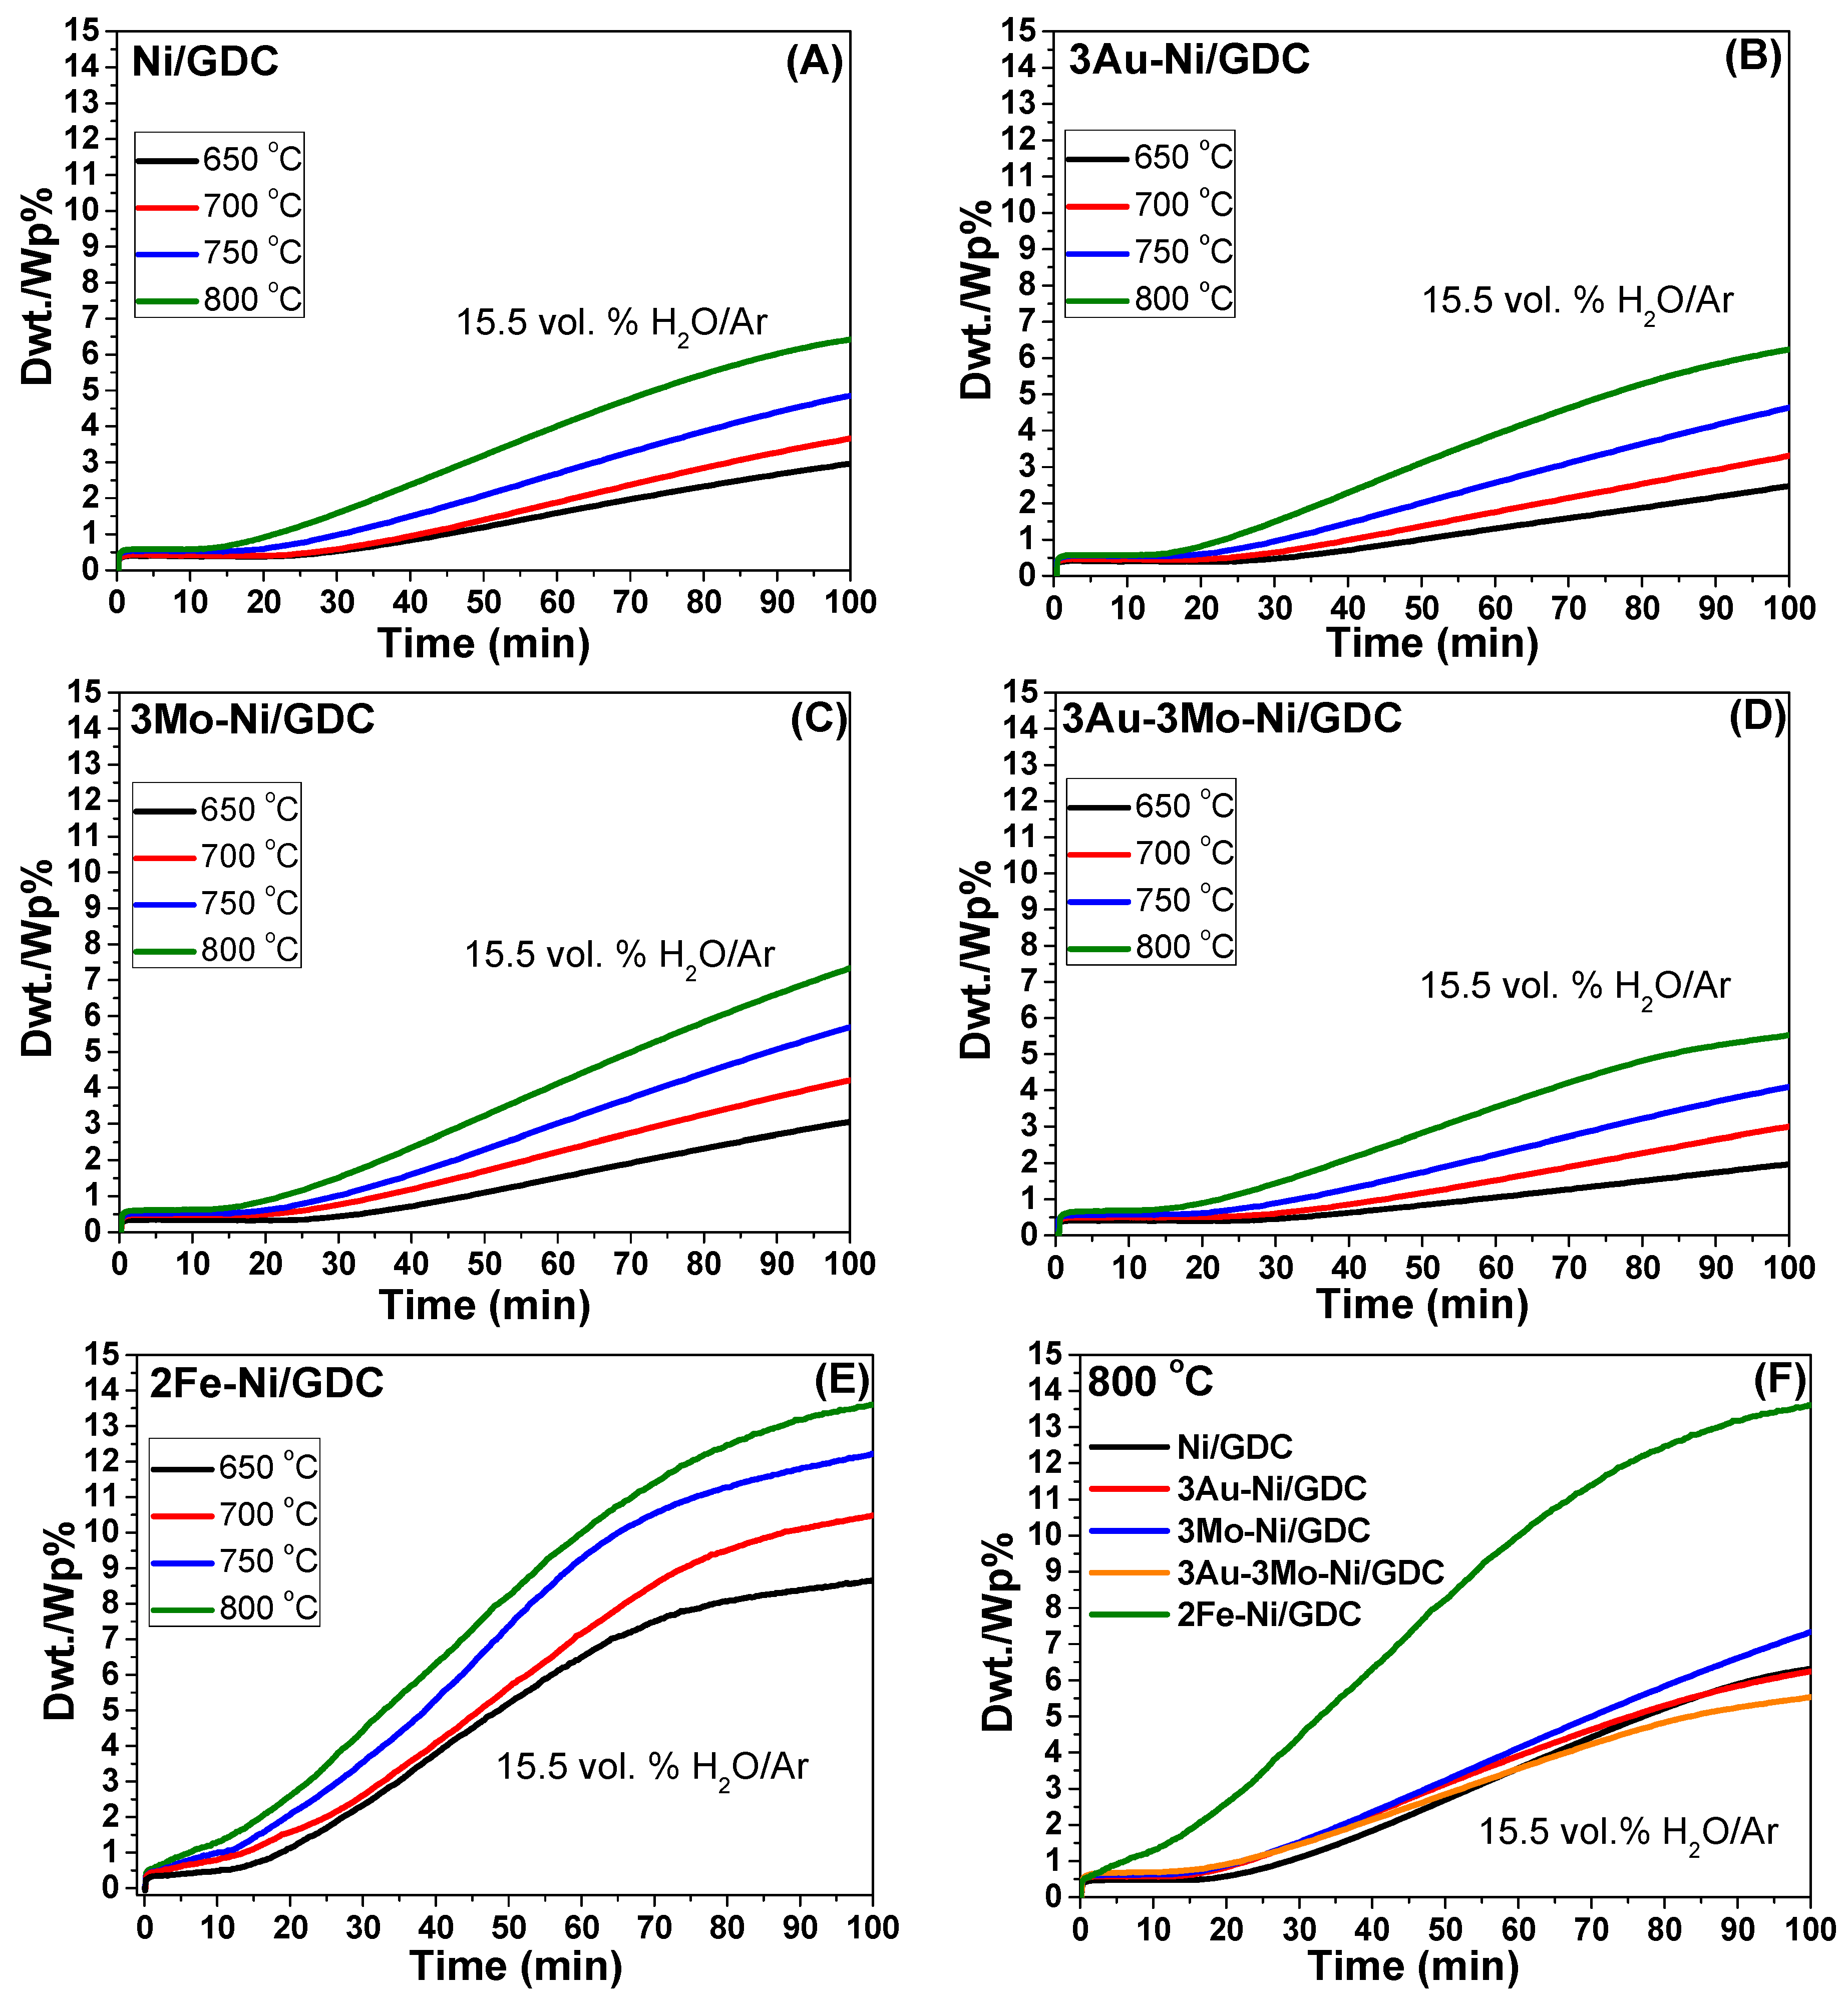
Isothermal-TGA measurements, under 15.5 vol.% H2O/Ar conditions, were carried out at 650 °C, 700 °C, 750 °C, and 800 °C and the results are depicted in Figure 2 and Figure 3. These measurements investigate the activity of the powders for the H2O dissociation reaction and their concomitant re-oxidation rate. H2O acts as an oxidative agent and interacts with the Ni atoms on the surface of each sample towards H2 and NiO [reaction (5)] [46].
Thereafter, there is a progressive diffusion of the absorbed oxygen species (Oads) from the surface in the bulk phase of the sample, which is oxidized further [46,48,49,50]. Figure 2 depicts the H2O re-oxidation profiles, as an increase of the weight (Δwt%), of the pre-reduced Ni/GDC, 3wt% Au-Ni/GDC, 3wt% Mo-Ni/GDC, 3wt% Au–3wt% Mo-Ni/GDC, and 2wt% Fe-Ni/GDC samples in the temperature range between 650–800 °C.
The re-oxidation profiles of the samples in Figure 2 can be separated in three sections [46]. The first section corresponds to the initial sharp increase in weight and is ascribed [46] to the complete, bulk, re-oxidation of the partially reduced CeO2 in GDC and specifically of Ce3+ to Ce4+. The second section occurs during the following 12–25 min of the reaction, where the samples, except for 2Fe-Ni/GDC, keep their reduced state without any changes in their weight. This step is associated [46] to the dissociation of bulk NiH species, which are formed during the prior reduction period, and maintains the samples reduction. NiH dissociation is considered as an activated process, because by decreasing the operating temperature from 800 °C to 650 °C, the specific “delay” period increases from 12 min to 25 min. Τhe first two sections are quite similar for the pre-reduced powders, with identical low SSA values (Table 1). On the other hand, the initial re-oxidation behavior, in the first section, of the pre-reduced 2Fe-Ni/GDC is more intense, indicating the strong effect of H2O.
In the third section of the TG profiles, further re-oxidation takes place [reaction (5)] and the main discrepancies are detected among the samples. In the range of 650–800 °C, the ternary 3Au–3Mo-Ni/GDC sample is the most tolerant in bulk re-oxidation by H2O, while the binary 2Fe-Ni/GDC sample is the least tolerant. The decrease in temperature (800 → 650 °C) leads to inhibition of the bulk re-oxidation, as observed by the reduced slopes in the TG profiles, whereas the trend among the samples does not change. The high tolerance of the 3Au–3Mo-Ni/GDC sample against bulk re-oxidation by H2O is attributed to the synergistic interaction of nickel with gold and molybdenum [23,42].
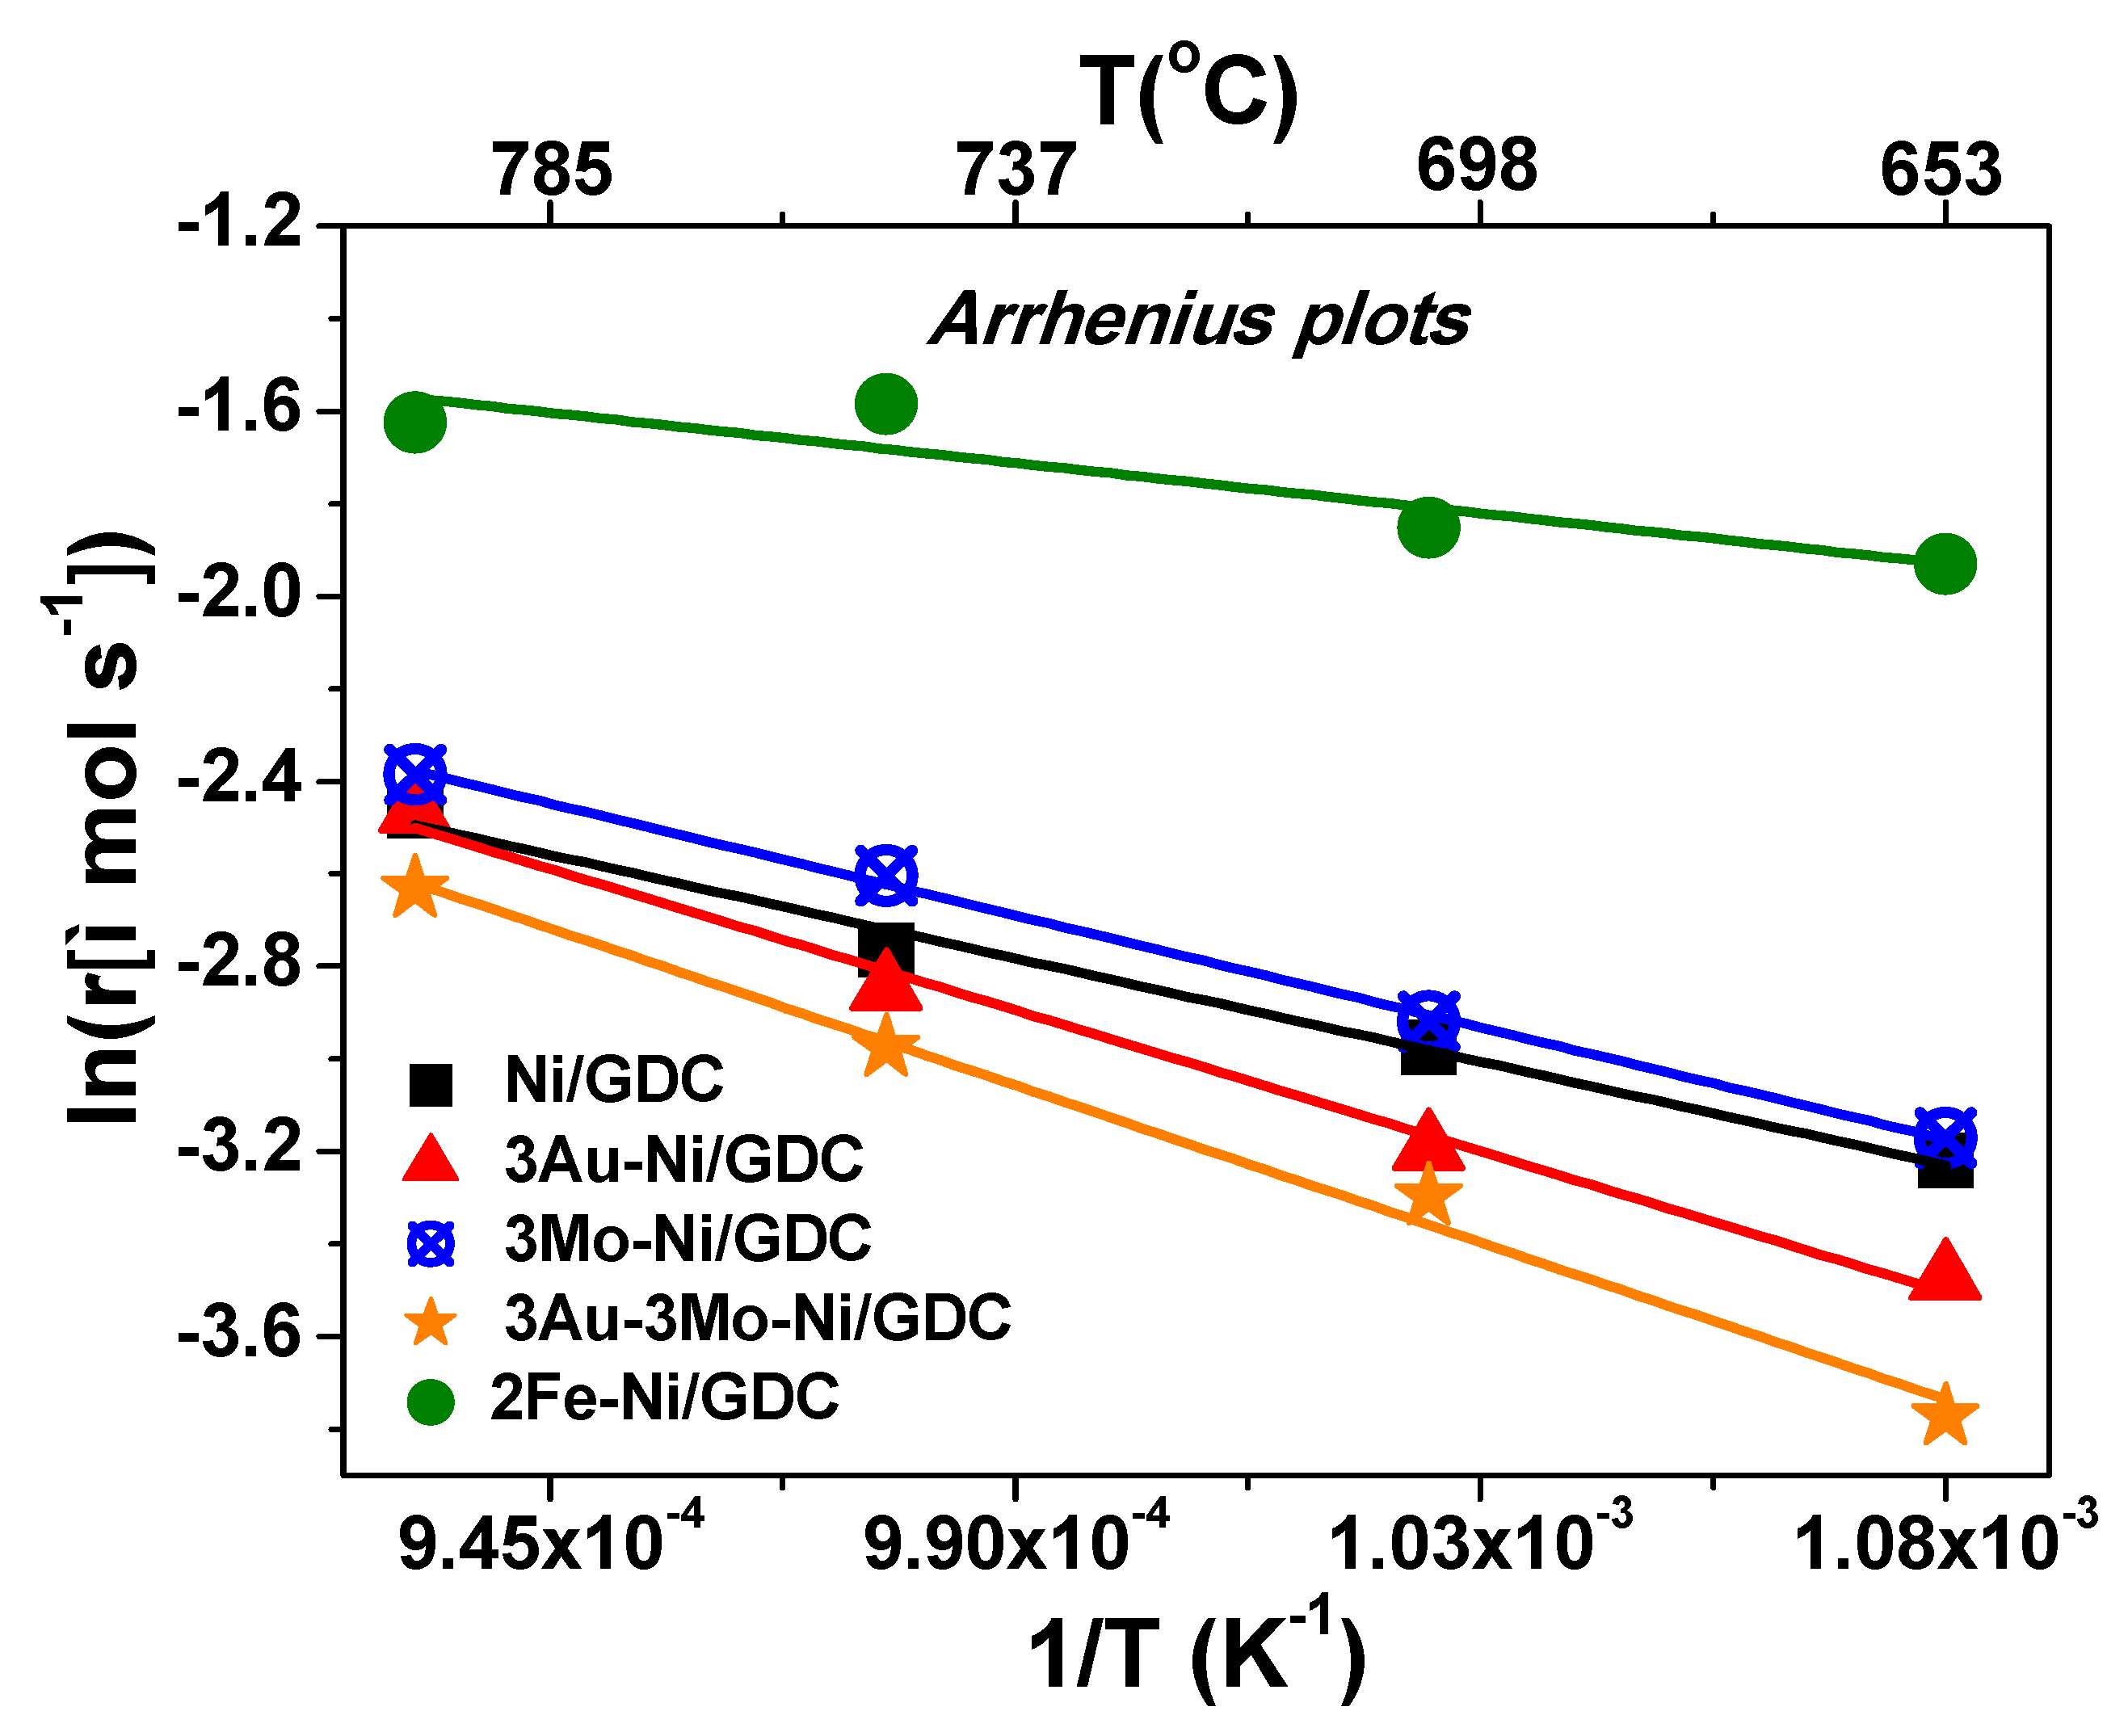
Τhe slope on the linear part of the third section in the TG curves represents the intrinsic dissociation rate of H2O and correspondingly the re-oxidation rate of Ni atoms on each sample [reaction (5)] [46]. Figure 3 depicts the Arrhenius plots of the oxidation rates of the samples, which were calculated from the slopes on the linear parts of the TG profiles (Figure 2). The Arrhenius plots (Figure 3) show that the binary 2Fe-Ni/GDC sample has the highest H2O re-oxidation rates, while the ternary 3Au–3Mo-Ni/GDC has the lowest. This is further confirmed by the calculated apparent activation energies (Ea,ap), which are defined from the Arrhenius plots and are reported in Table 2.
The calculated values verify that the binary 2Fe-Ni/GDC sample exhibits the lowest Ea,ap (20 kJ/mol) for the catalytic dissociation of H2O, whereas the ternary 3Au–3Mo-Ni/GDC sample exhibits the highest Ea,ap (63 kJ/mol). The above behavior can be interpreted by the fact that Ni-Fe interaction reinforces the bond of H2Oads, resulting in a higher re-oxidation rate (lower Ea,ap). On the other hand, following the same interpretation, Ni–Au–Mo interaction weakens the bond of H2Oads, resulting in a lower re-oxidation rate (higher Ea,ap) [46].
The calculated Ea,ap values are in good agreement with our previous study [46] and other studies [51,52,53] in the literature, which focus on theoretical investigations. The binary 2Fe-Ni/GDC sample is the most active for the thermochemical dissociation of H2O and is less resistant against bulk re-oxidation. On the contrary, the ternary 3Au–3Mo-Ni/GDC sample exhibits the lowest activity for the thermochemical dissociation of H2O and the highest tolerance against bulk re-oxidation.
Taking into account the above, H2O, apart from being the main reactant of the co-electrolysis process, is also considered as a potential poisoning agent of the electrode. This means that the bonding strength of the adsorbed oxygen species, which result from H2O decomposition, may induce the re-oxidation of the electrode and finally the deactivation of the sample [46,53]. The H2O poisoning effect in electrolysis and co-electrolysis processes can also be correlated to the CH4 poisoning effect in SOFC applications, where degradation is enhanced by the strong adsorption bond of CH4 on the Ni surface [23,42,43,44,45,54,55]. Thus, the stronger binding of the adsorbed oxygen species, which result from the catalytic dissociation of H2Oads, can similarly cause a poisoning effect on the Ni surface, leading to faster re-oxidation and finally deactivation of the sample [46,53]. According to Besenbacher et al. [56], the surface solid solution between Au and Ni induces significant modifications in the electronic properties of Ni (Fermi level, work function, and d-band center) and affects the bonding strength of the adsorbed species on the surface of the sample.
In this respect, the Au- and Au–Mo- doping of Ni should shift the d-band center to lower energies, with respect to the Fermi level of nickel, thus inhibiting the interaction and the dissociation of H2O. Therefore, the 3Au-Ni/GDC and 3Au–3Mo-Ni/GDC samples are suggested to be the least active samples for the dissociation of H2O, having the highest Ea,app and consequently the lowest binding energies for both H2O and Oads. The binary 2Fe-Ni/GDC is suggested to be the most active sample for the dissociation of H2O, with the lowest Ea,app, resulting in Oads species with the highest binding energy and the potential to cause faster re-oxidation/poisoning of the electrode [46,53] during SOEC operation.
2.2. Catalytic-Kinetic Measurements of the RWGS Reaction
All the prepared samples, in the form of half-electrolyte supported cells, were tested at Open Circuit Potential (OCP) conditions to elucidate their catalytic activity towards the production of CO, which is one of the products from the H2O/CO2 co-electrolysis reaction. Furthermore, the effect of the modification (type of dopant: Au, Mo, Fe) on the catalytic activity for the production of CO, through the RWGS reaction, was also investigated. The latter approach is considered as an attempt to create a reference profile for the catalytic performance of the candidate electrodes, under the same experimental conditions as in co-electrolysis (including the presence of current collector). This is an important step, because it will provide detailed experimental feedback on the possible contribution of the RWGS reaction to the production of CO and the extent of this contribution to the electrochemical reduction of CO2, during the co-electrolysis mode.
In regards to the “homogenous” catalytic production of CO, the rate was found to be negligible, in the range of rco, homogenous = 0.05 μmol/s, for a fuel feed comprising 30 vol.% He − 24.5 vol.% H2O − 24.5 vol.% CO2 − 21 vol.% H2. Concerning the current collector, Ni-mesh shows some catalytic activity for the production of CO (rCO), which increases by increasing the operating temperature and the partial pressure of H2. However, comparative rCO measurements (see Figure S1 in Supplementary Material) of an Ni/GDC electrode with and without the presence of Ni mesh as the current collector, as well as of the bare Ni mesh, suggest that there is no direct catalytic correlation/contribution of the Ni mesh to the activity of the electrocatalysts. This is mainly explained by the fact that Ni/GDC is a porous electrocatalyst with SSABET and thus with more active sites, compared to the metallic nickel mesh, which does not possess similar properties. Consequently, from the point where they co-exist as the electrode and current collector, the catalytic activity is mainly attributed to the electrocatalyst.
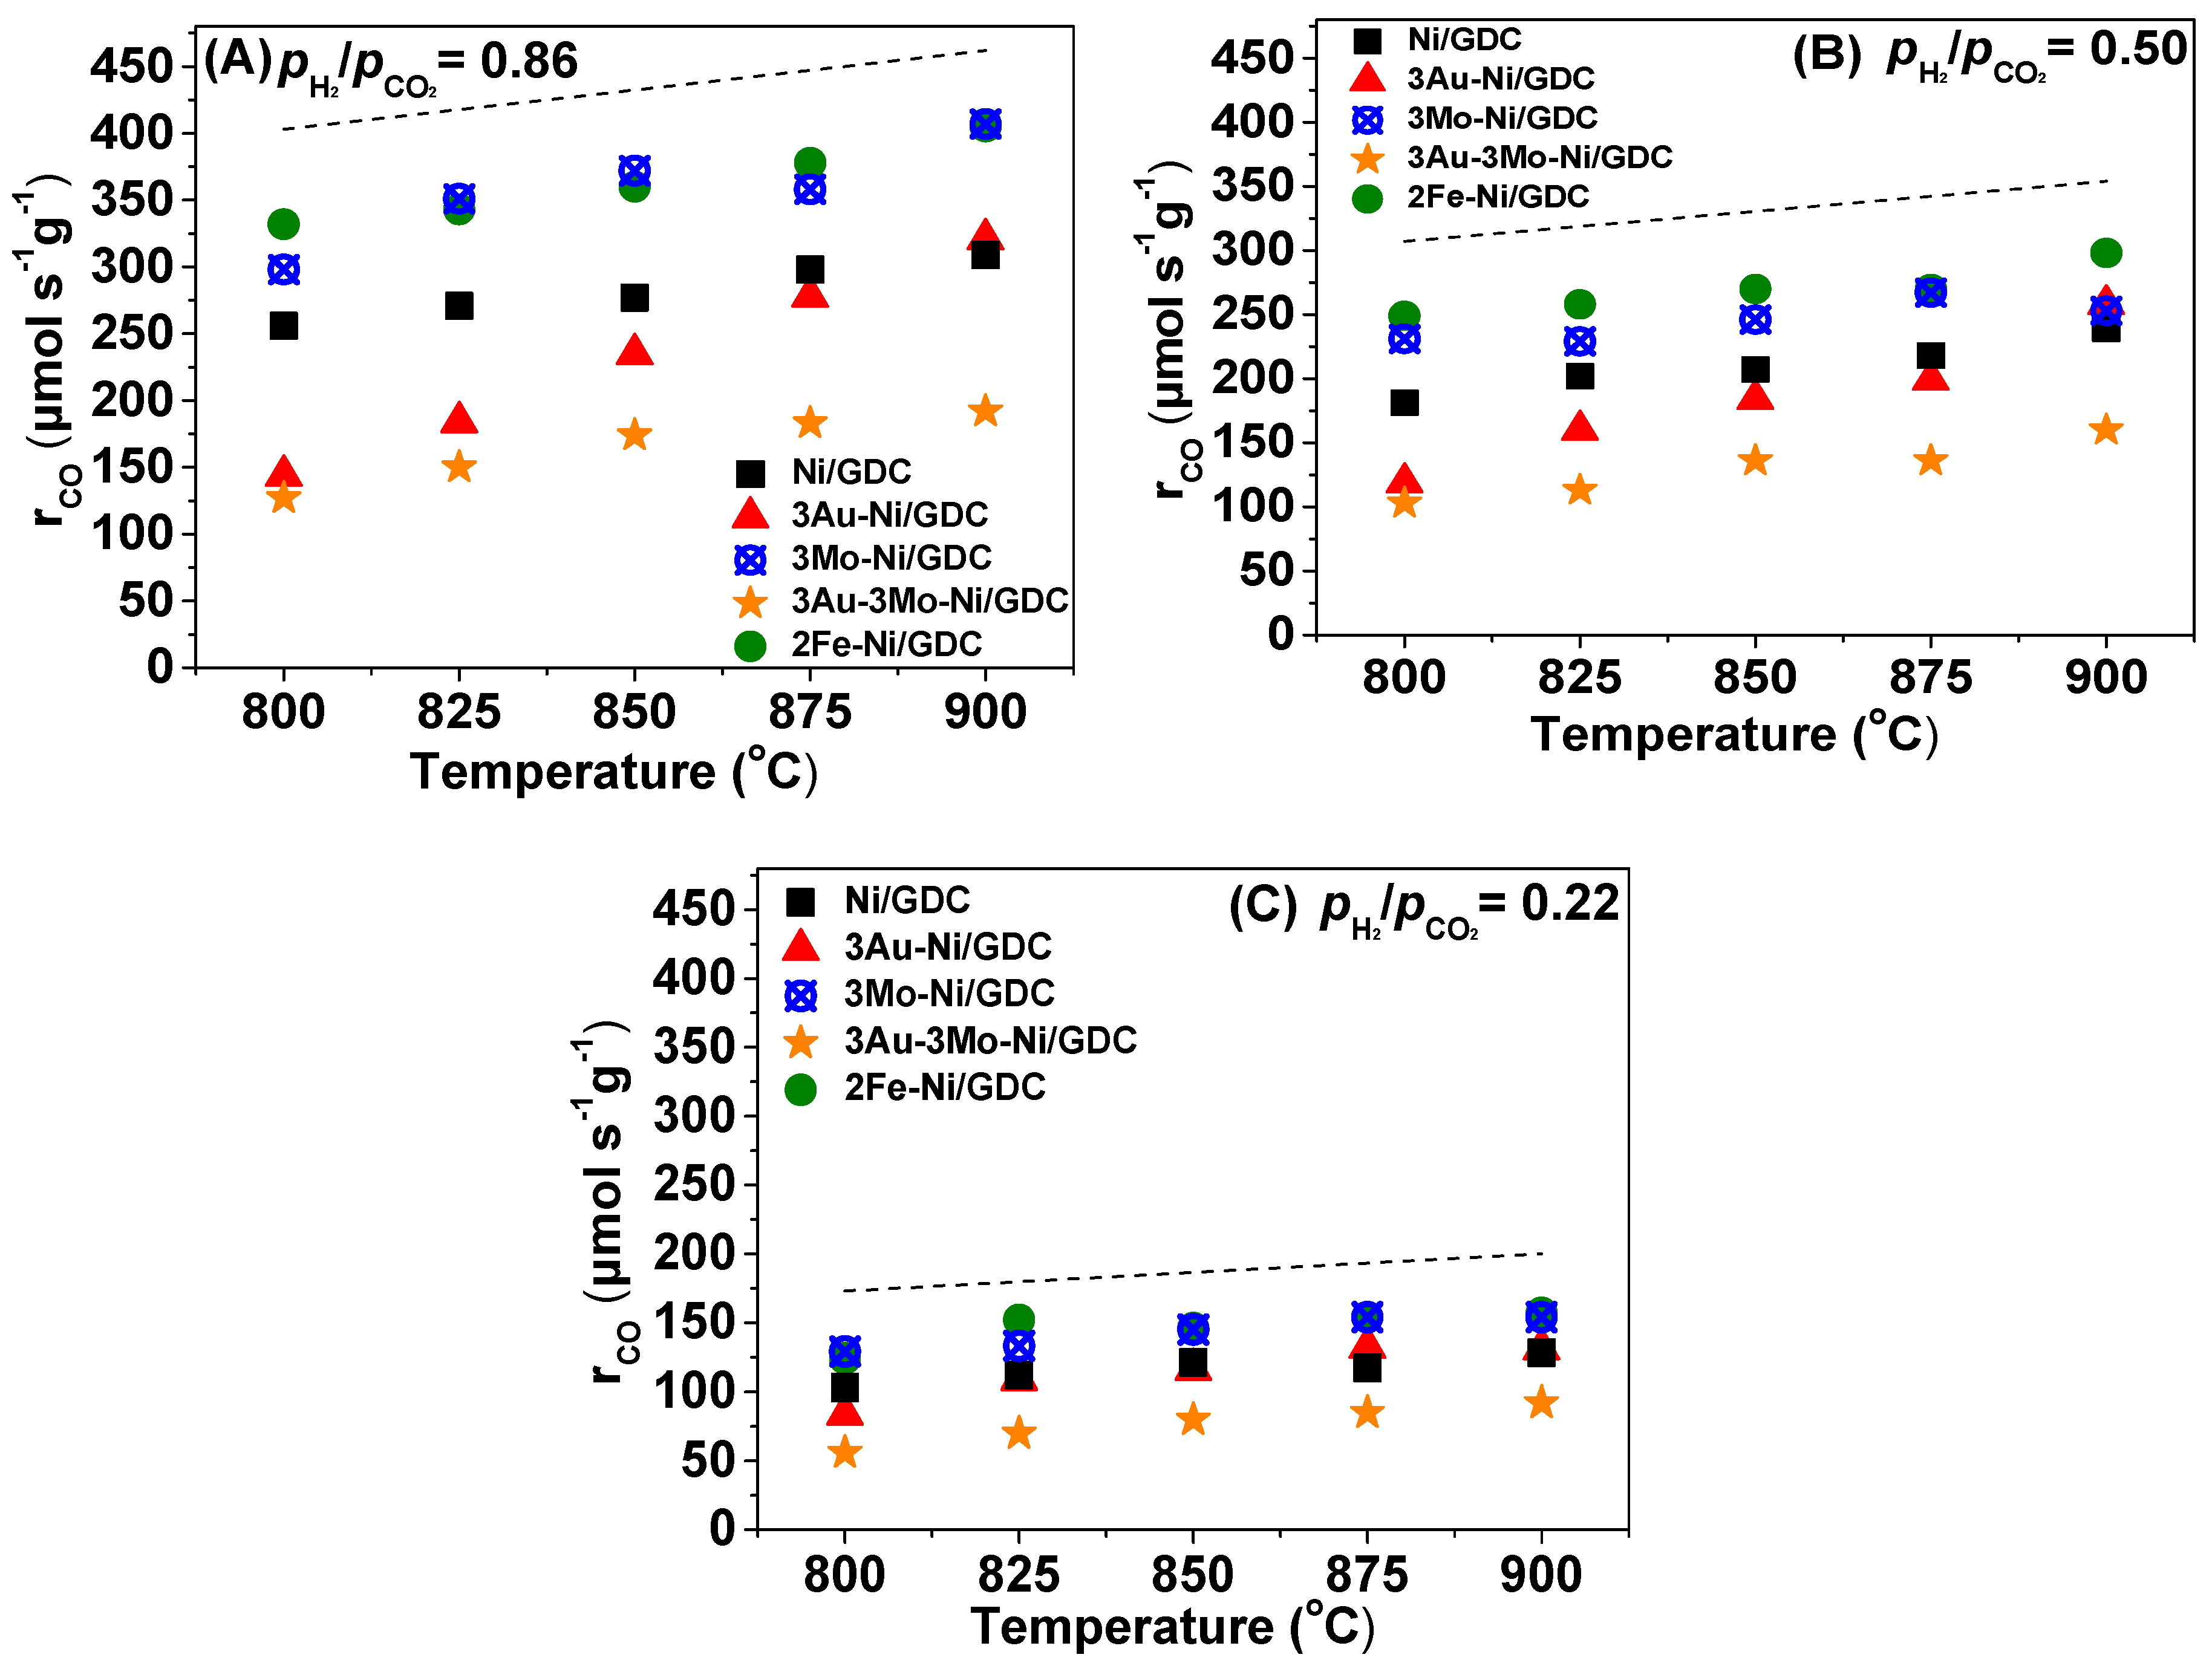
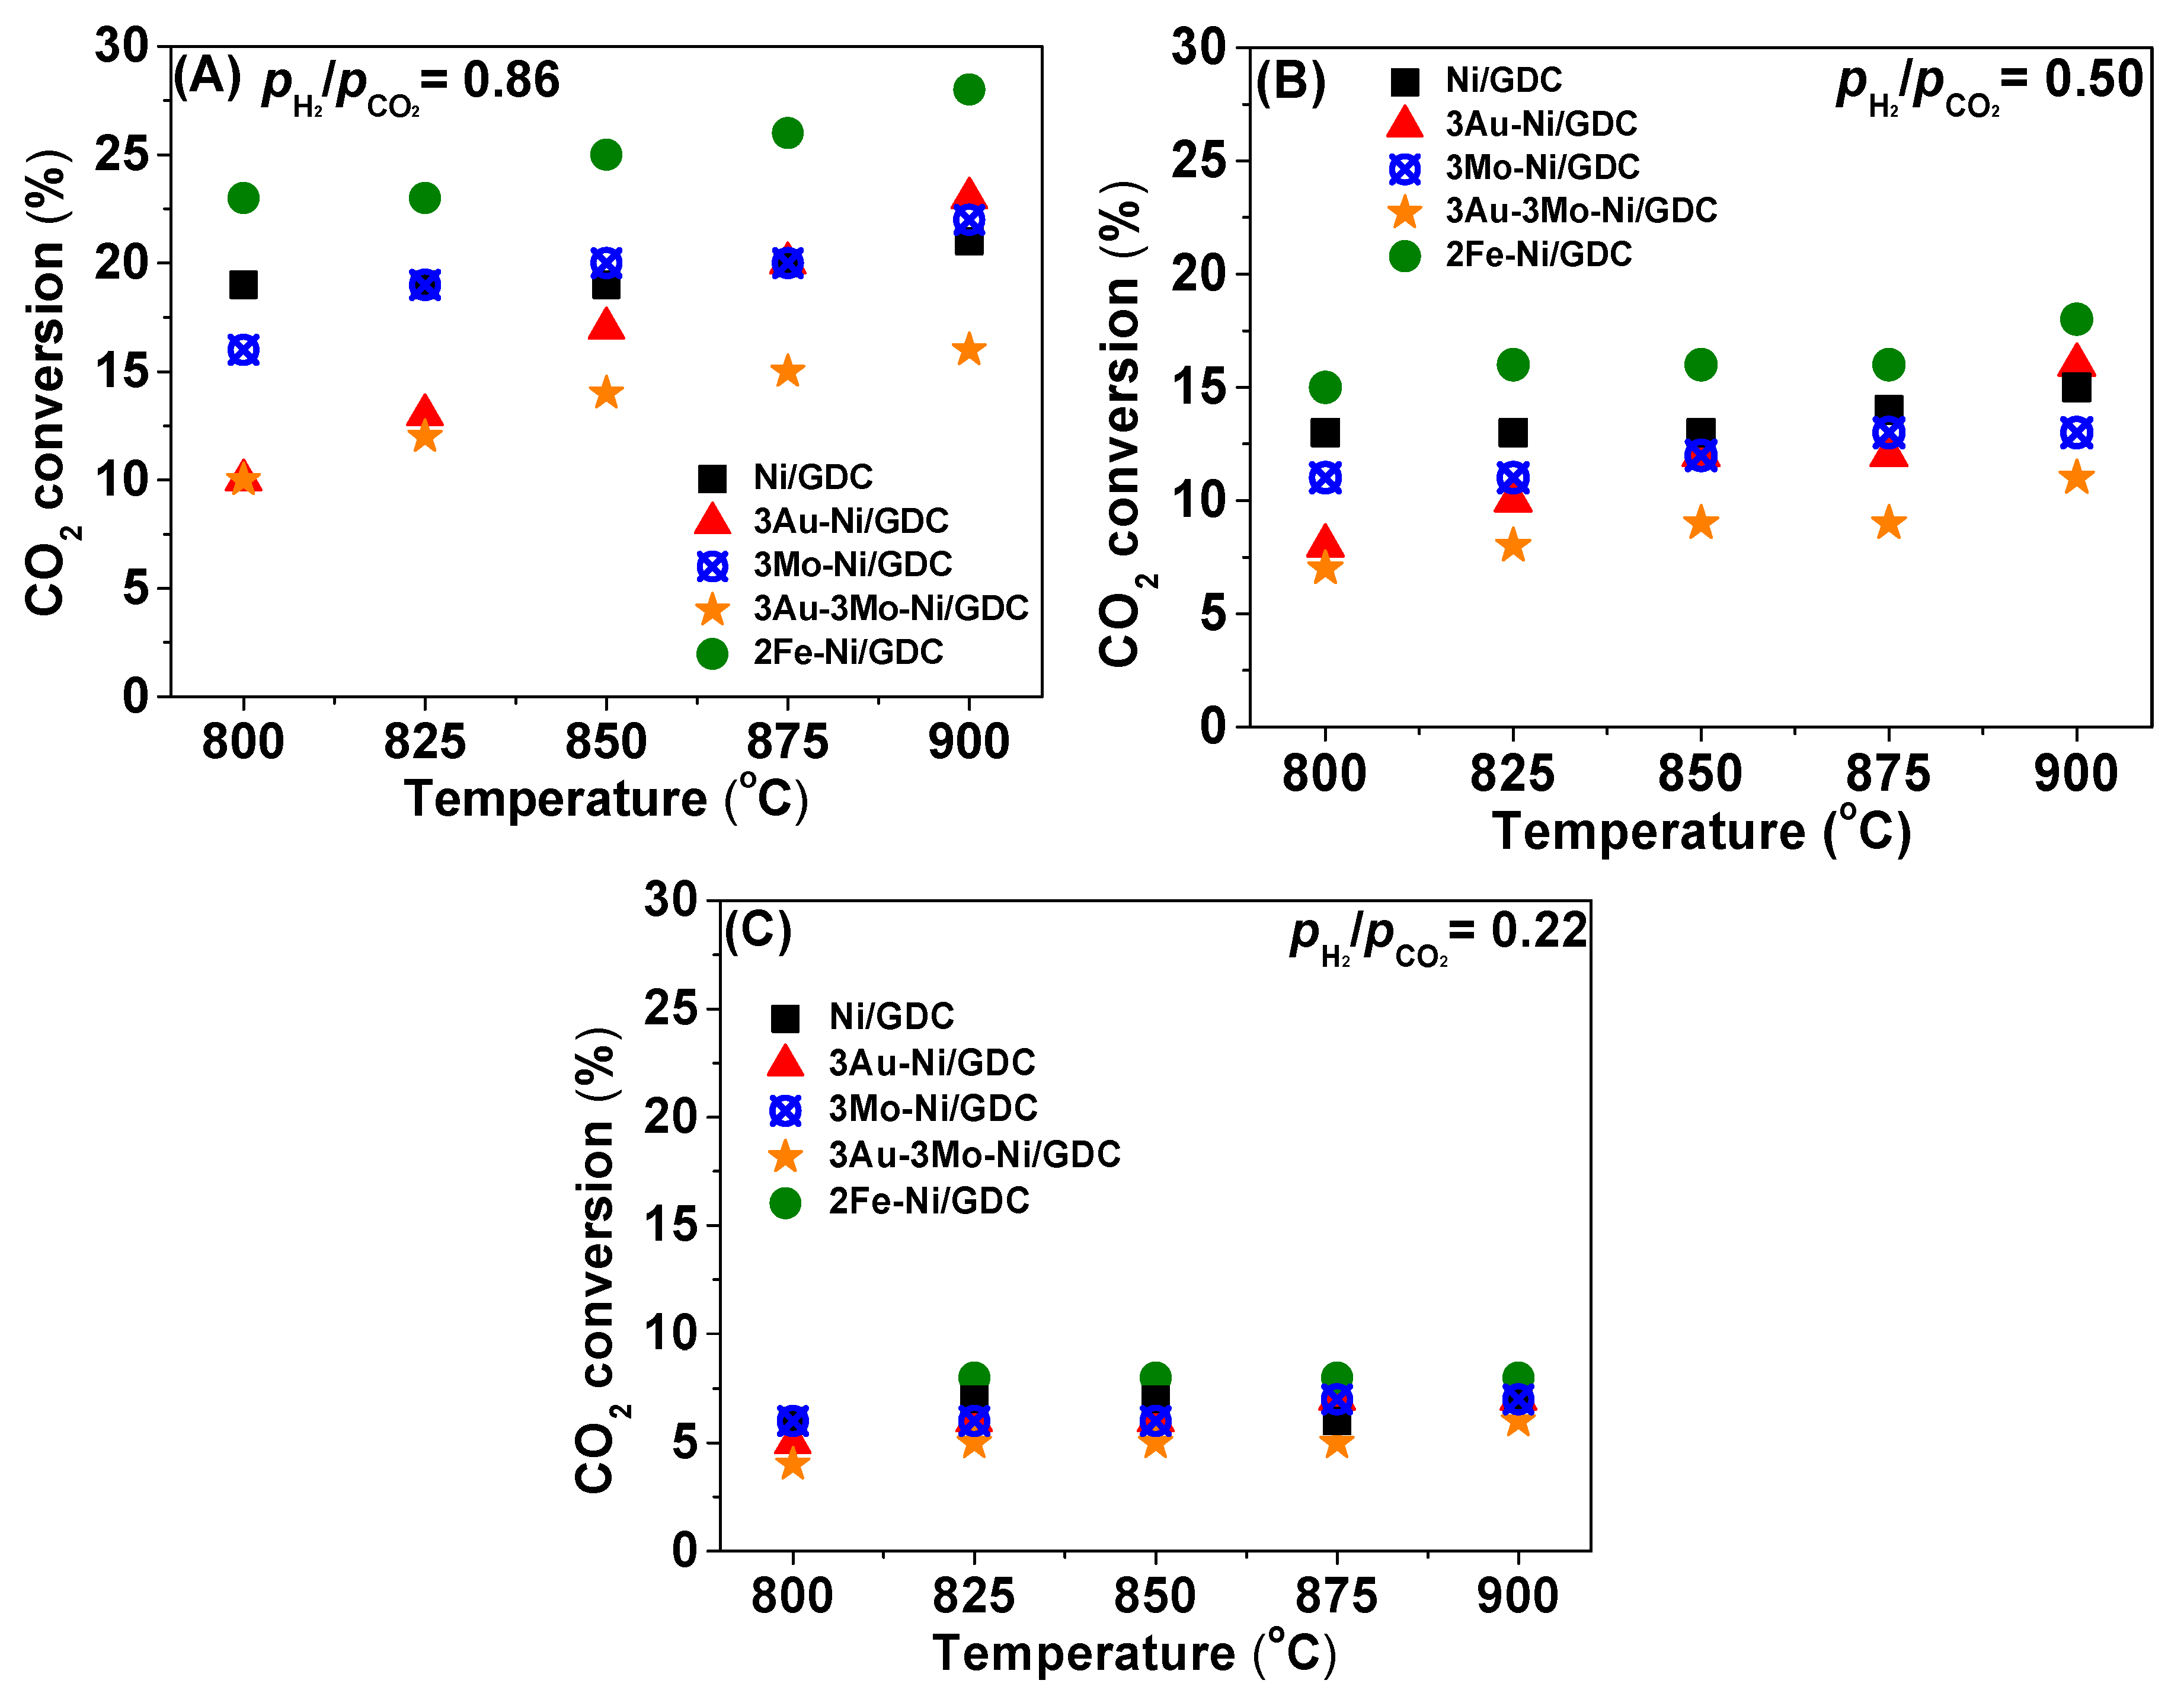
Figure 4 presents the comparison of the produced rCO for the Ni/GDC and for modified-Ni/GDC electrodes, under three different H2O-CO2-H2 mixtures. The corresponding %CO2 conversions are depicted in Figure 5. The values are low enough to be considered in the differential region, apart from the case of 2Fe-Ni/GDC in the reaction mixture (A), which is relatively high. The % conversion of CO2 was calculated by the following formula:
where: and correspond to the rate (μmol/s) of the produced CO and of the introduced CO2 in the reactants feed, respectively.
It is shown (Figure 4 and Figure 5) that 2Fe-Ni/GDC and 3Mo-Ni/GDC have the highest catalytic activity of the examined electrodes for the RWGS reaction. In fact, 2Fe-Ni/GDC is the most active in terms of the produced CO. The above performance is observed for all applied fuel feeds (PH2/PCO2 = 0.86, 0.50 and 0.22), whereas it is enhanced by increasing (i) the operating temperature and (ii) the partial pressure of H2 in the fuel feed. The enhanced catalytic performance of the Fe-modified sample, can be primarily ascribed to the possible stronger adsorption and consequent catalytic dissociation of CO2 on the active sites of the catalyst. This first conclusion is going to be further examined with specific CO2 Temperature Programmed Desorption (TPD) measurements.
Another noteworthy remark is that the produced CO rates were compared to the thermodynamic equilibrium rates (dash line in Figure 4) for the three different H2O-CO2-H2 reaction mixtures. The equilibrium rates were calculated by using the equilibrium constant (Keq) formula that is reported in [57,58]. It was found (Figure 4) that Ni/GDC, the binary Au-, and the ternary Au–Mo- modified samples exhibit CO production rates, which are lower than the thermodynamic equilibrium for all the examined reaction conditions. The performances of 2Fe-Ni/GDC and 3Mo-Ni/GDC are closer to the equilibrium, but cannot be considered as thermodynamically limited.
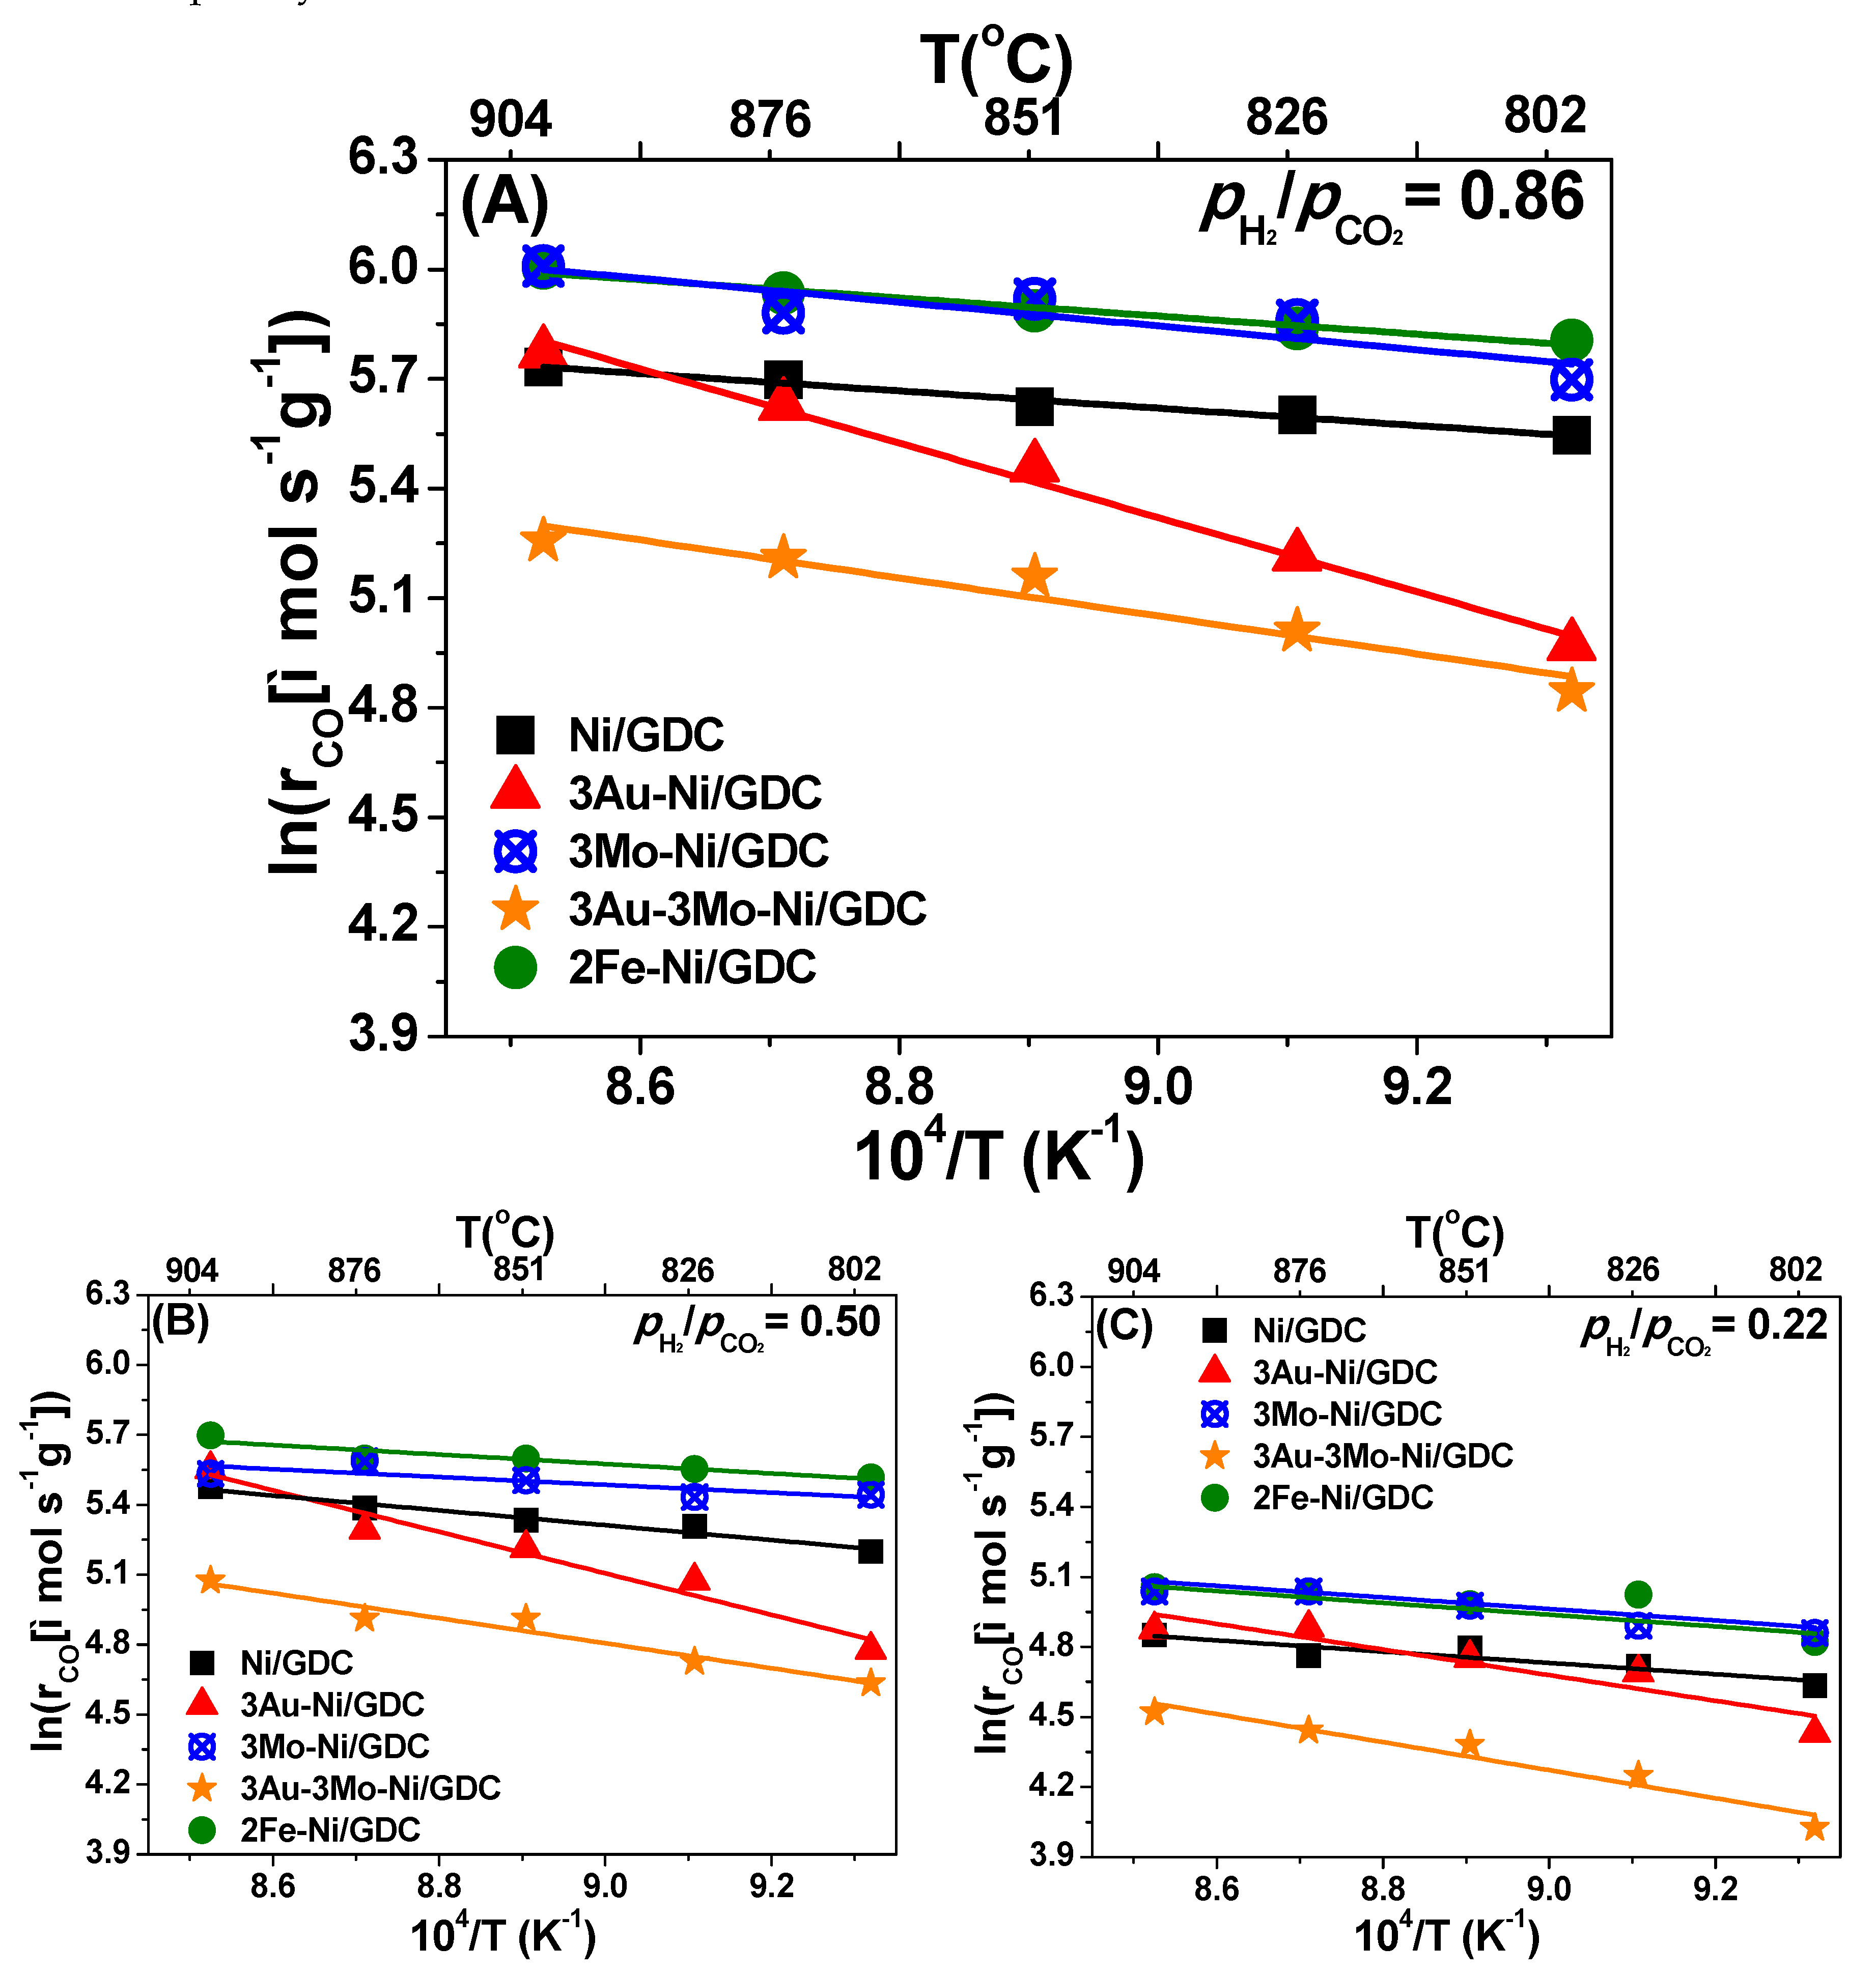
The results from the measurements in Figure 4 can also be presented as Arrhenius plots, depicted in Figure 6, where the derived apparent activation energies (Ea, app) for the production of CO and consequently for the RWGS reaction are listed in Table 3.
The Arrhenius plots and the calculated Ea, app show that 2Fe-Ni/GDC, 3Μο-Ni/GDC, and Ni/GDC have practically the same and the lowest Ea, app. However, the Fe- and Mo- modified samples exhibit higher pre-exponential factors, compared to Ni/GDC, which explains the higher production rates of CO. 3Au-Ni/GDC shows overall the highest Ea, app, which is an additional indication for its worst catalytic activity. Finally, the ternary 3Au–3Mo-Ni/GDC sample shows an apparent activation energy, which lies between that for 2Fe-Ni/GDC and 3Au-Ni/GDC. However, the catalytic activity of the ternary sample is the lowest, due to the lower pre-exponential factor compared to the binary Au-modified sample. According to the knowledge of the authors, there are no literature data available for experimentally measured Ea, app, for similar samples and reaction conditions. The so far available data come from theoretical investigations and there is a recent study from Cho et al. [41], who performed DFT calculations to evaluate the ability of various transition metals to increase the activity of Ni for the H2O/CO2 co-electrolysis. In particular, they computed the activation energies of specific elementary reaction steps and in the case of the RWGS on Ni(111), the Ea was found to be approximately 46 kJ/mole, which is very close to the values that were experimentally calculated in the present study.
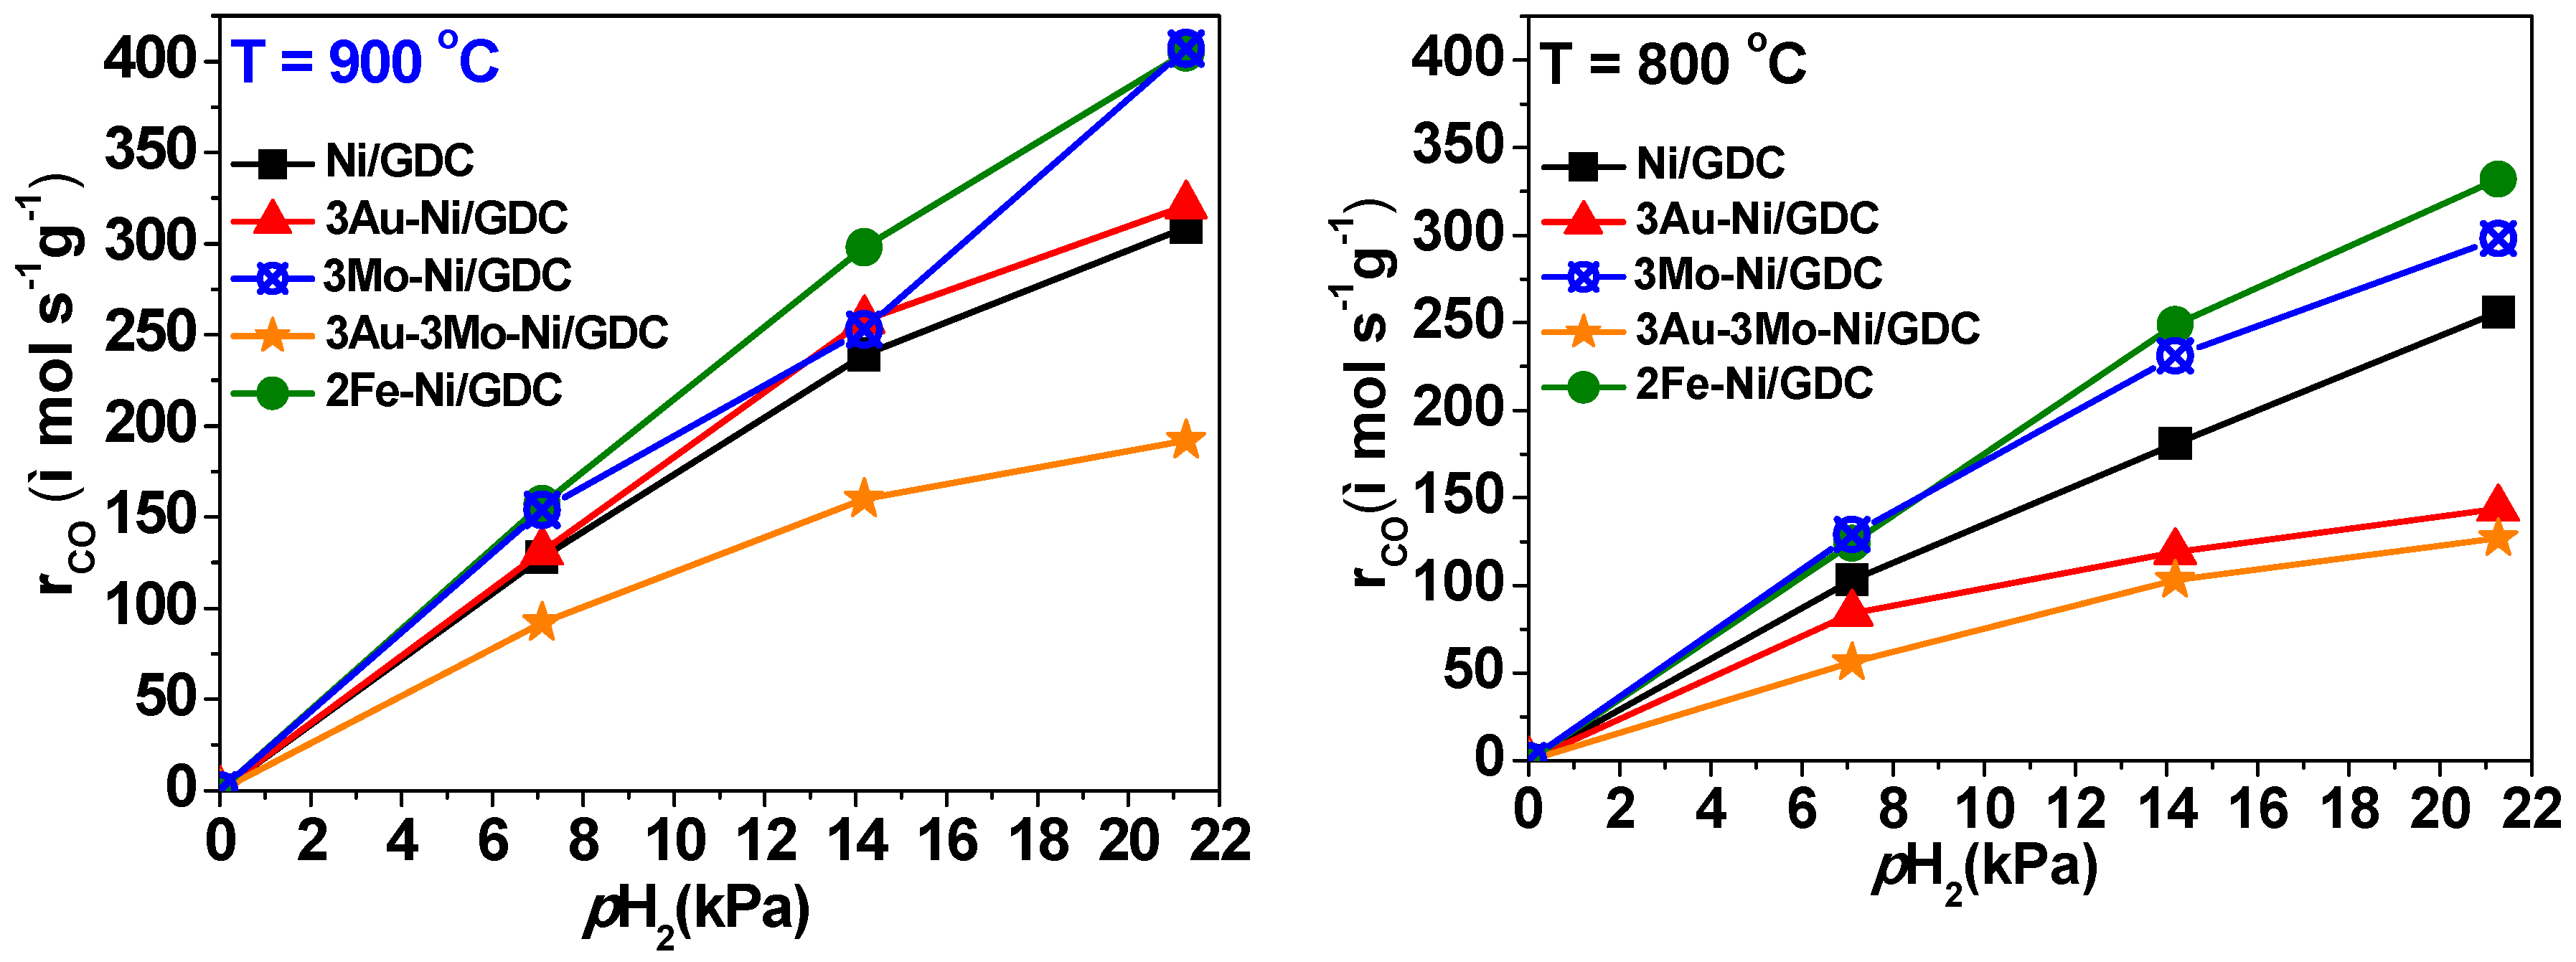
The effect of H2 partial pressure on the catalytic rate of CO production is further verified in Figure 7 for all samples at 900 °C and 800 °C. The 2Fe-Ni/GDC sample is the most active and 3Au–3Mo-Ni/GDC the least one. The 3Au-Ni/GDC catalyst at 900 °C shows similar performance with that of Ni/GDC. In addition, by decreasing the temperature at 800 °C, the catalytic activity of 3Au-Ni/GDC exhibits the highest reduction. This is apparent from the significant decrease in the slope of the corresponding curve (Figure 7) from 800 °C to 900 °C and can be further explained from the calculated Ea, app (Table 3), which is the highest from all samples. Finally, the kinetic behavior of all samples suggests that the production rate of CO exhibits a positive order dependence on the partial pressure of H2.
The fact that in the majority of the samples there is no trend in the Ea, app, by varying the pH2/pCO2 ratios, primarily shows that all samples, apart from the binary Au-modified, have similar intrinsic catalytic activity for the RWGS reaction. This is also concluded from the remark that the effect of the H2 partial pressure on the CO production rate is almost linear. On the other hand, in the case of 3Au-Ni/GDC, there is an increase in Ea, app, by increasing the pH2/pCO2 ratio. This is corroborated from the results in Figure 7, where rCO seems to reach a plateau at high pH2. The latter remarks indicate that the majority of the samples have actives sites that follow a similar reaction mechanism, in regards to the dissociative adsorption of H2 and CO2 towards the RWGS. On the other hand, the reaction mechanism seems to be different in the case of 3Au-Ni/GDC. In particular, it is implied that the high coverage of adsorbed H2 may inhibit the CO2 dissociative adsorption and thus decreases the intrinsic catalytic activity of the specific sample. This suggestion is going to be further clarified through the currently performed H2O/CO2 co-electrolysis measurements.
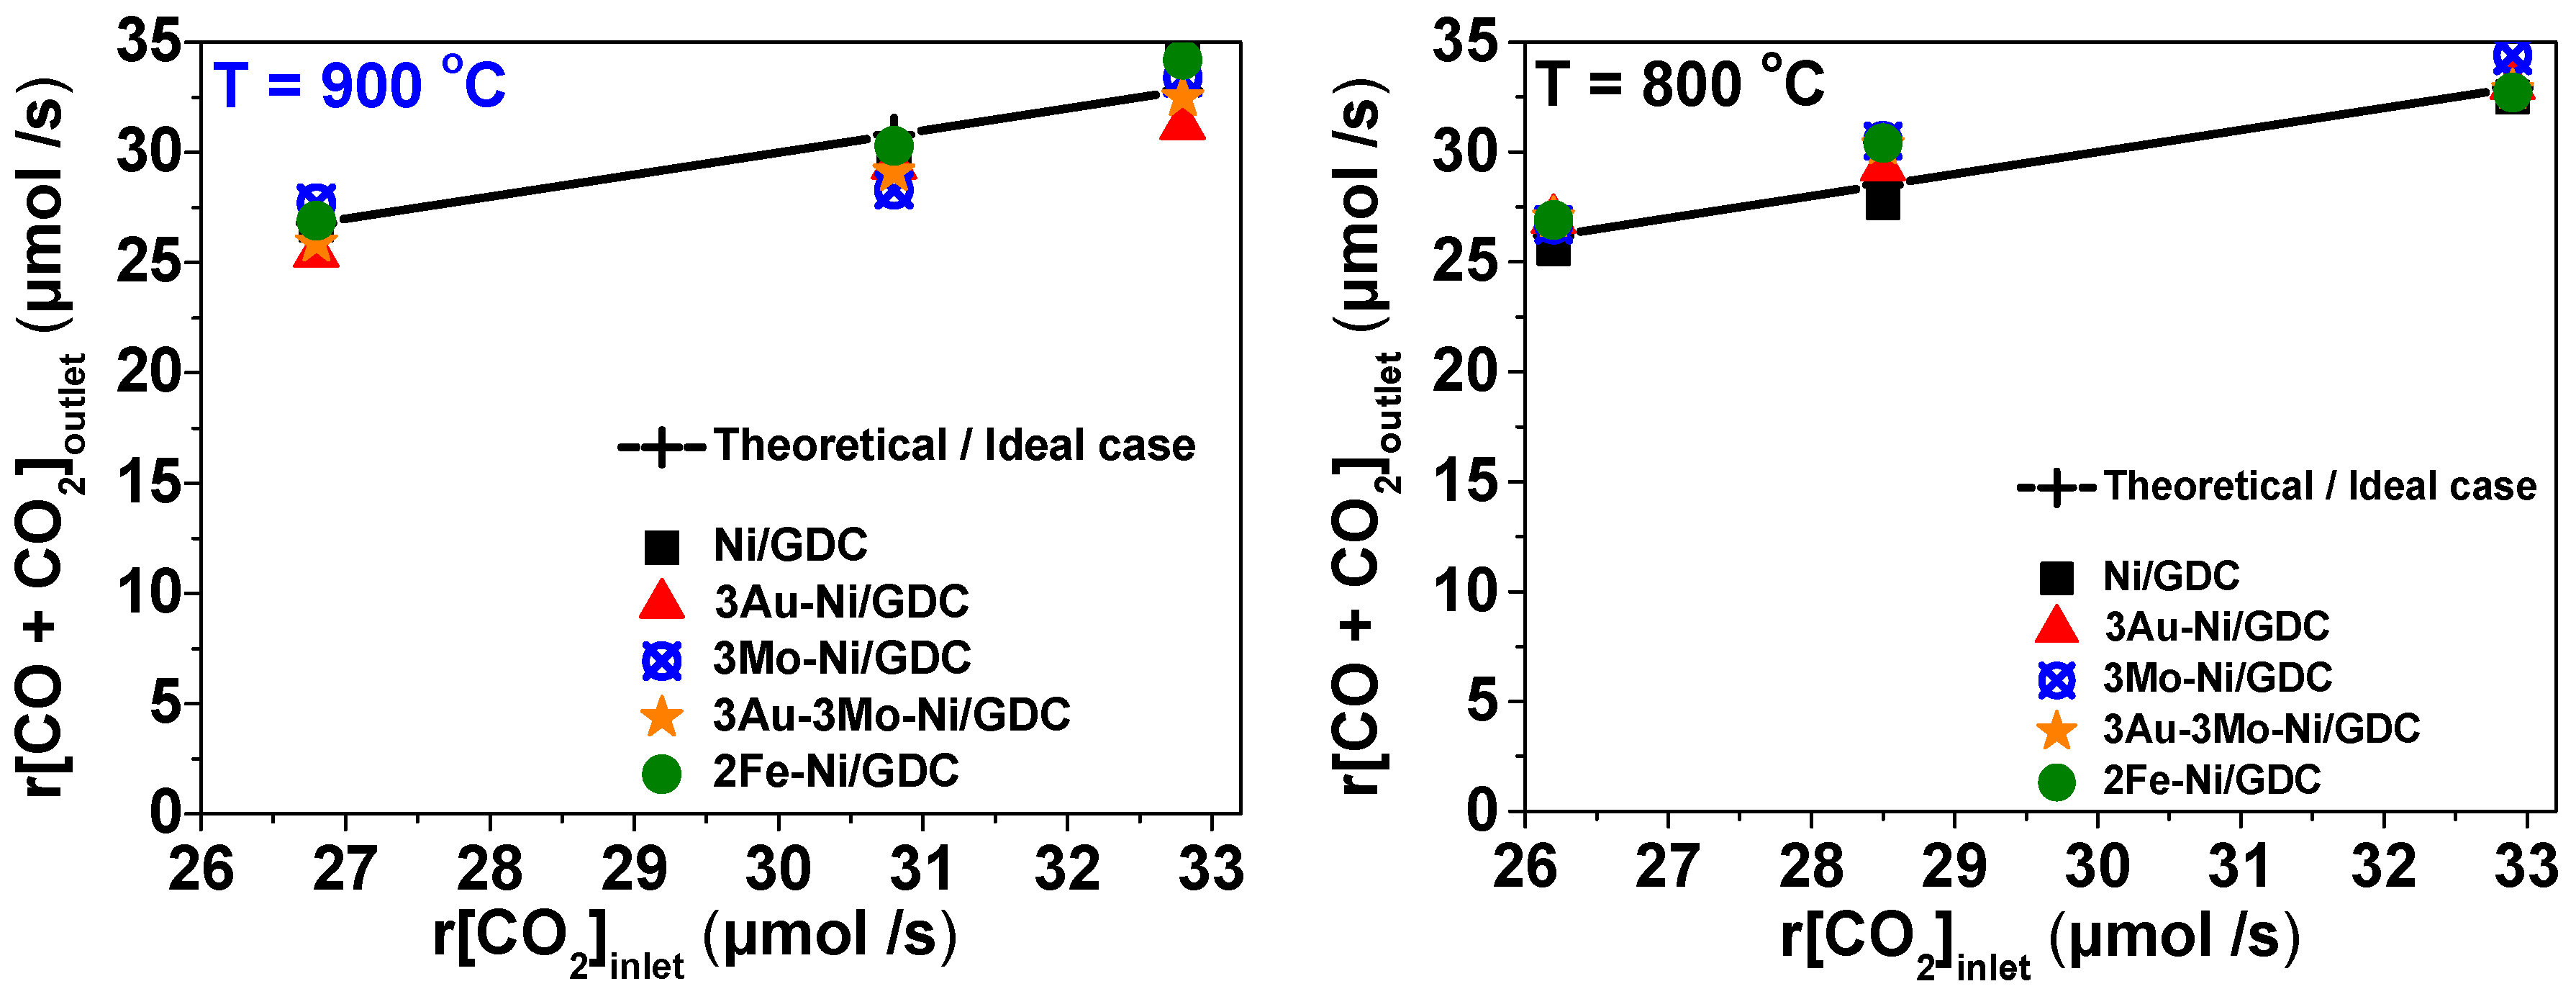
Carbon formation, through the Boudouard reaction (6), was also investigated and the results are presented in Figure 8. The slight scattering of the experimentally measured rates in combination with the theoretical values, where r[CO2]inlet is equal to r[CO + CO2]outlet, suggest that there is no carbon deposition under the examined reaction conditions. This result is also in accordance with the fact that the Boudouard reaction is not thermodynamically favored above 750 °C [59].
Previous studies [1,59,60] reported that at realistic CO2/CO concentrations, during CO2 electrolysis in the range of 650–750 °C, the equilibrium of (6) is shifted towards CO production (reaction (7)) and therefore carbon will not be formed, catalytically, during CO2 electrolysis. In the case where the cell is operated at OCP conditions, as in our case, any coke deposited within the porous, modified or not, Ni/GDC electrode would be oxidized to CO according to the reverse Boudouard reaction (7) and thereby removed. Furthermore, the addition of steam in the feed is reported to remove carbon depositions according to reaction (8) [1,8]:
Boudouard reaction: 2CO → CO2 + C
Reverse Boudouard reaction: CO2 + C → 2CO
Reaction of coke with H2O: C + H2O → CO + H2
3. Materials and Methods
3.1. Preparation of Electrocatalysts
The modified cathode powders were prepared via the Deposition-Precipitation (D.P.) and Deposition-Co Precipitation (D.CP.) methods by using the commercial NiO/GDC cermet (65wt% NiO-35wt% GDC, Marion Technologies, Verniolle, France) as the support. The precursors for the 3wt% Au-NiO/GDC, 3wt% Mo-NiO/GDC, 3wt% Au−3wt% Mo-NiO/GDC, and 2wt% Fe-NiO/GDC samples were the HAuCl4 (Sigma-Aldrich) or/and (NH4)6Mo7O24 (Sigma-Aldrich, St. Louis, MO, USA) and Fe(NO3)3x9H2O (Sigma-Aldrich, St. Louis, MO, USA) solutions, respectively. Full details about the synthesis can be found elsewhere [42,43]. After filtering, the precipitate was dried at 110 °C for 24 h. All dried powders were calcined at 600 °C/90 min and a part of them at 1100 °C/75 min. The first batch was used for the paste preparation, which is described in the following paragraph. The batch at 1100 °C was used for the physicochemical characterization. In this way, the prepared catalysts were studied at similar thermal stress as the calcined electrode-electrolyte assemblies.
3.2. Preparation of Electrolyte-Supported Half Cells
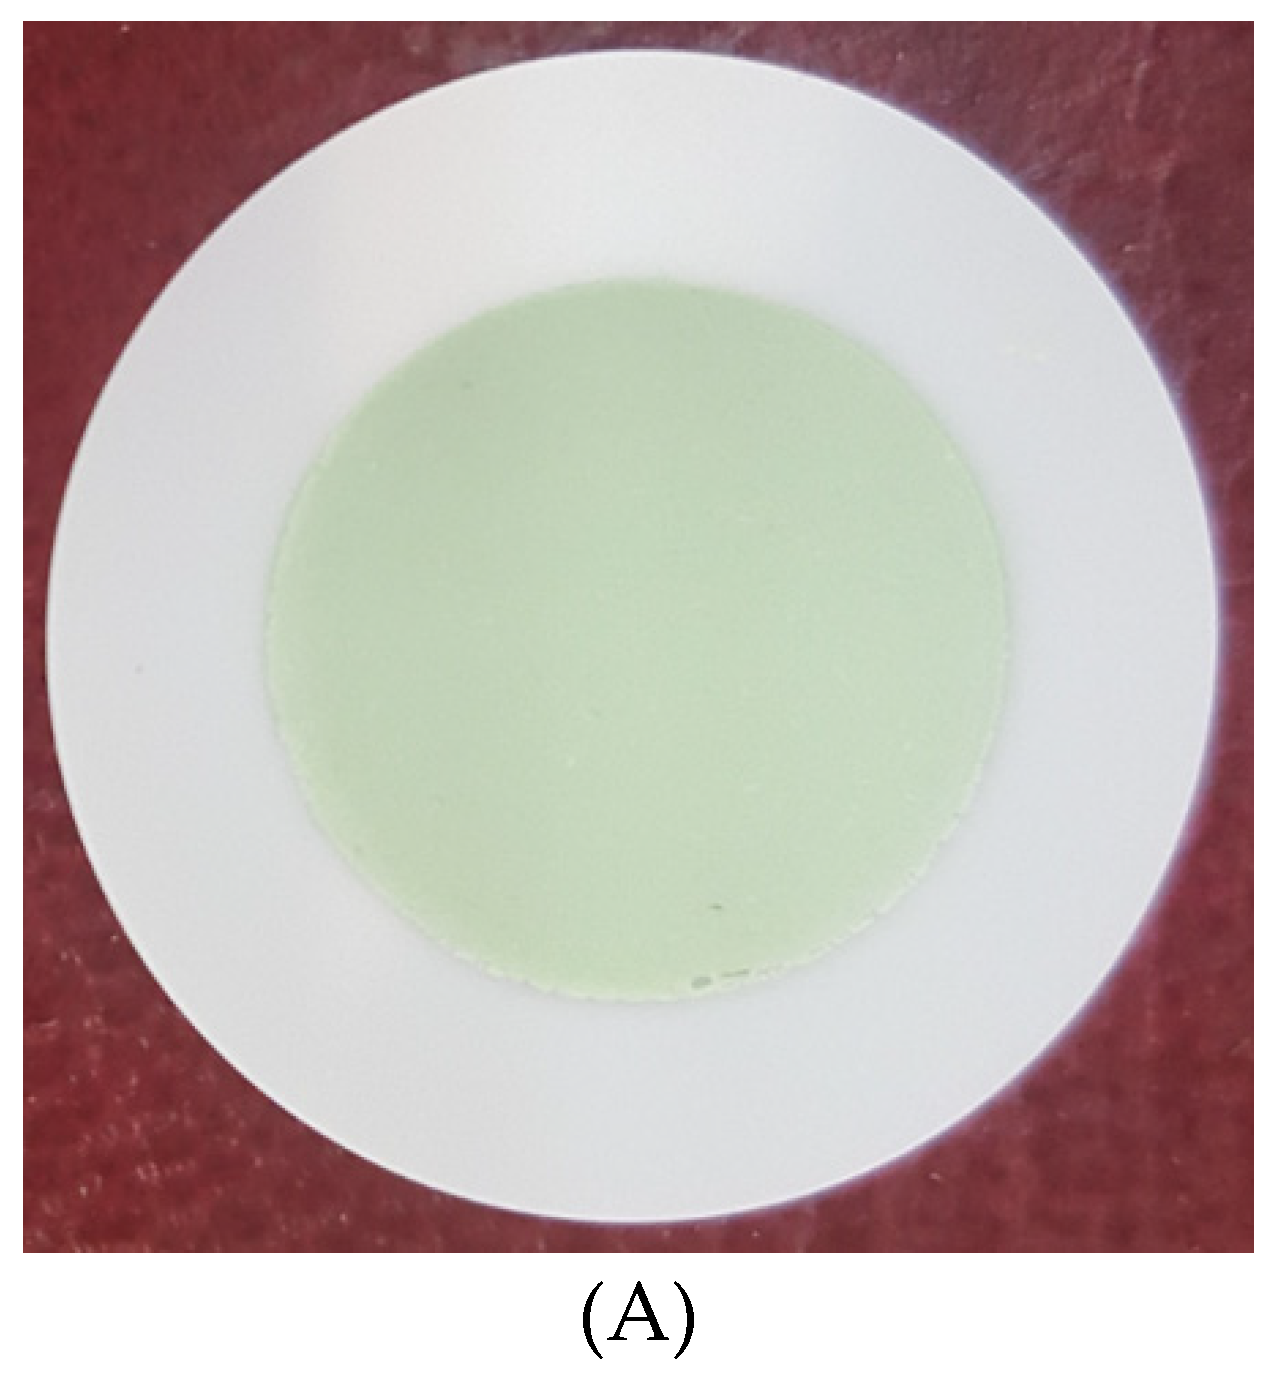
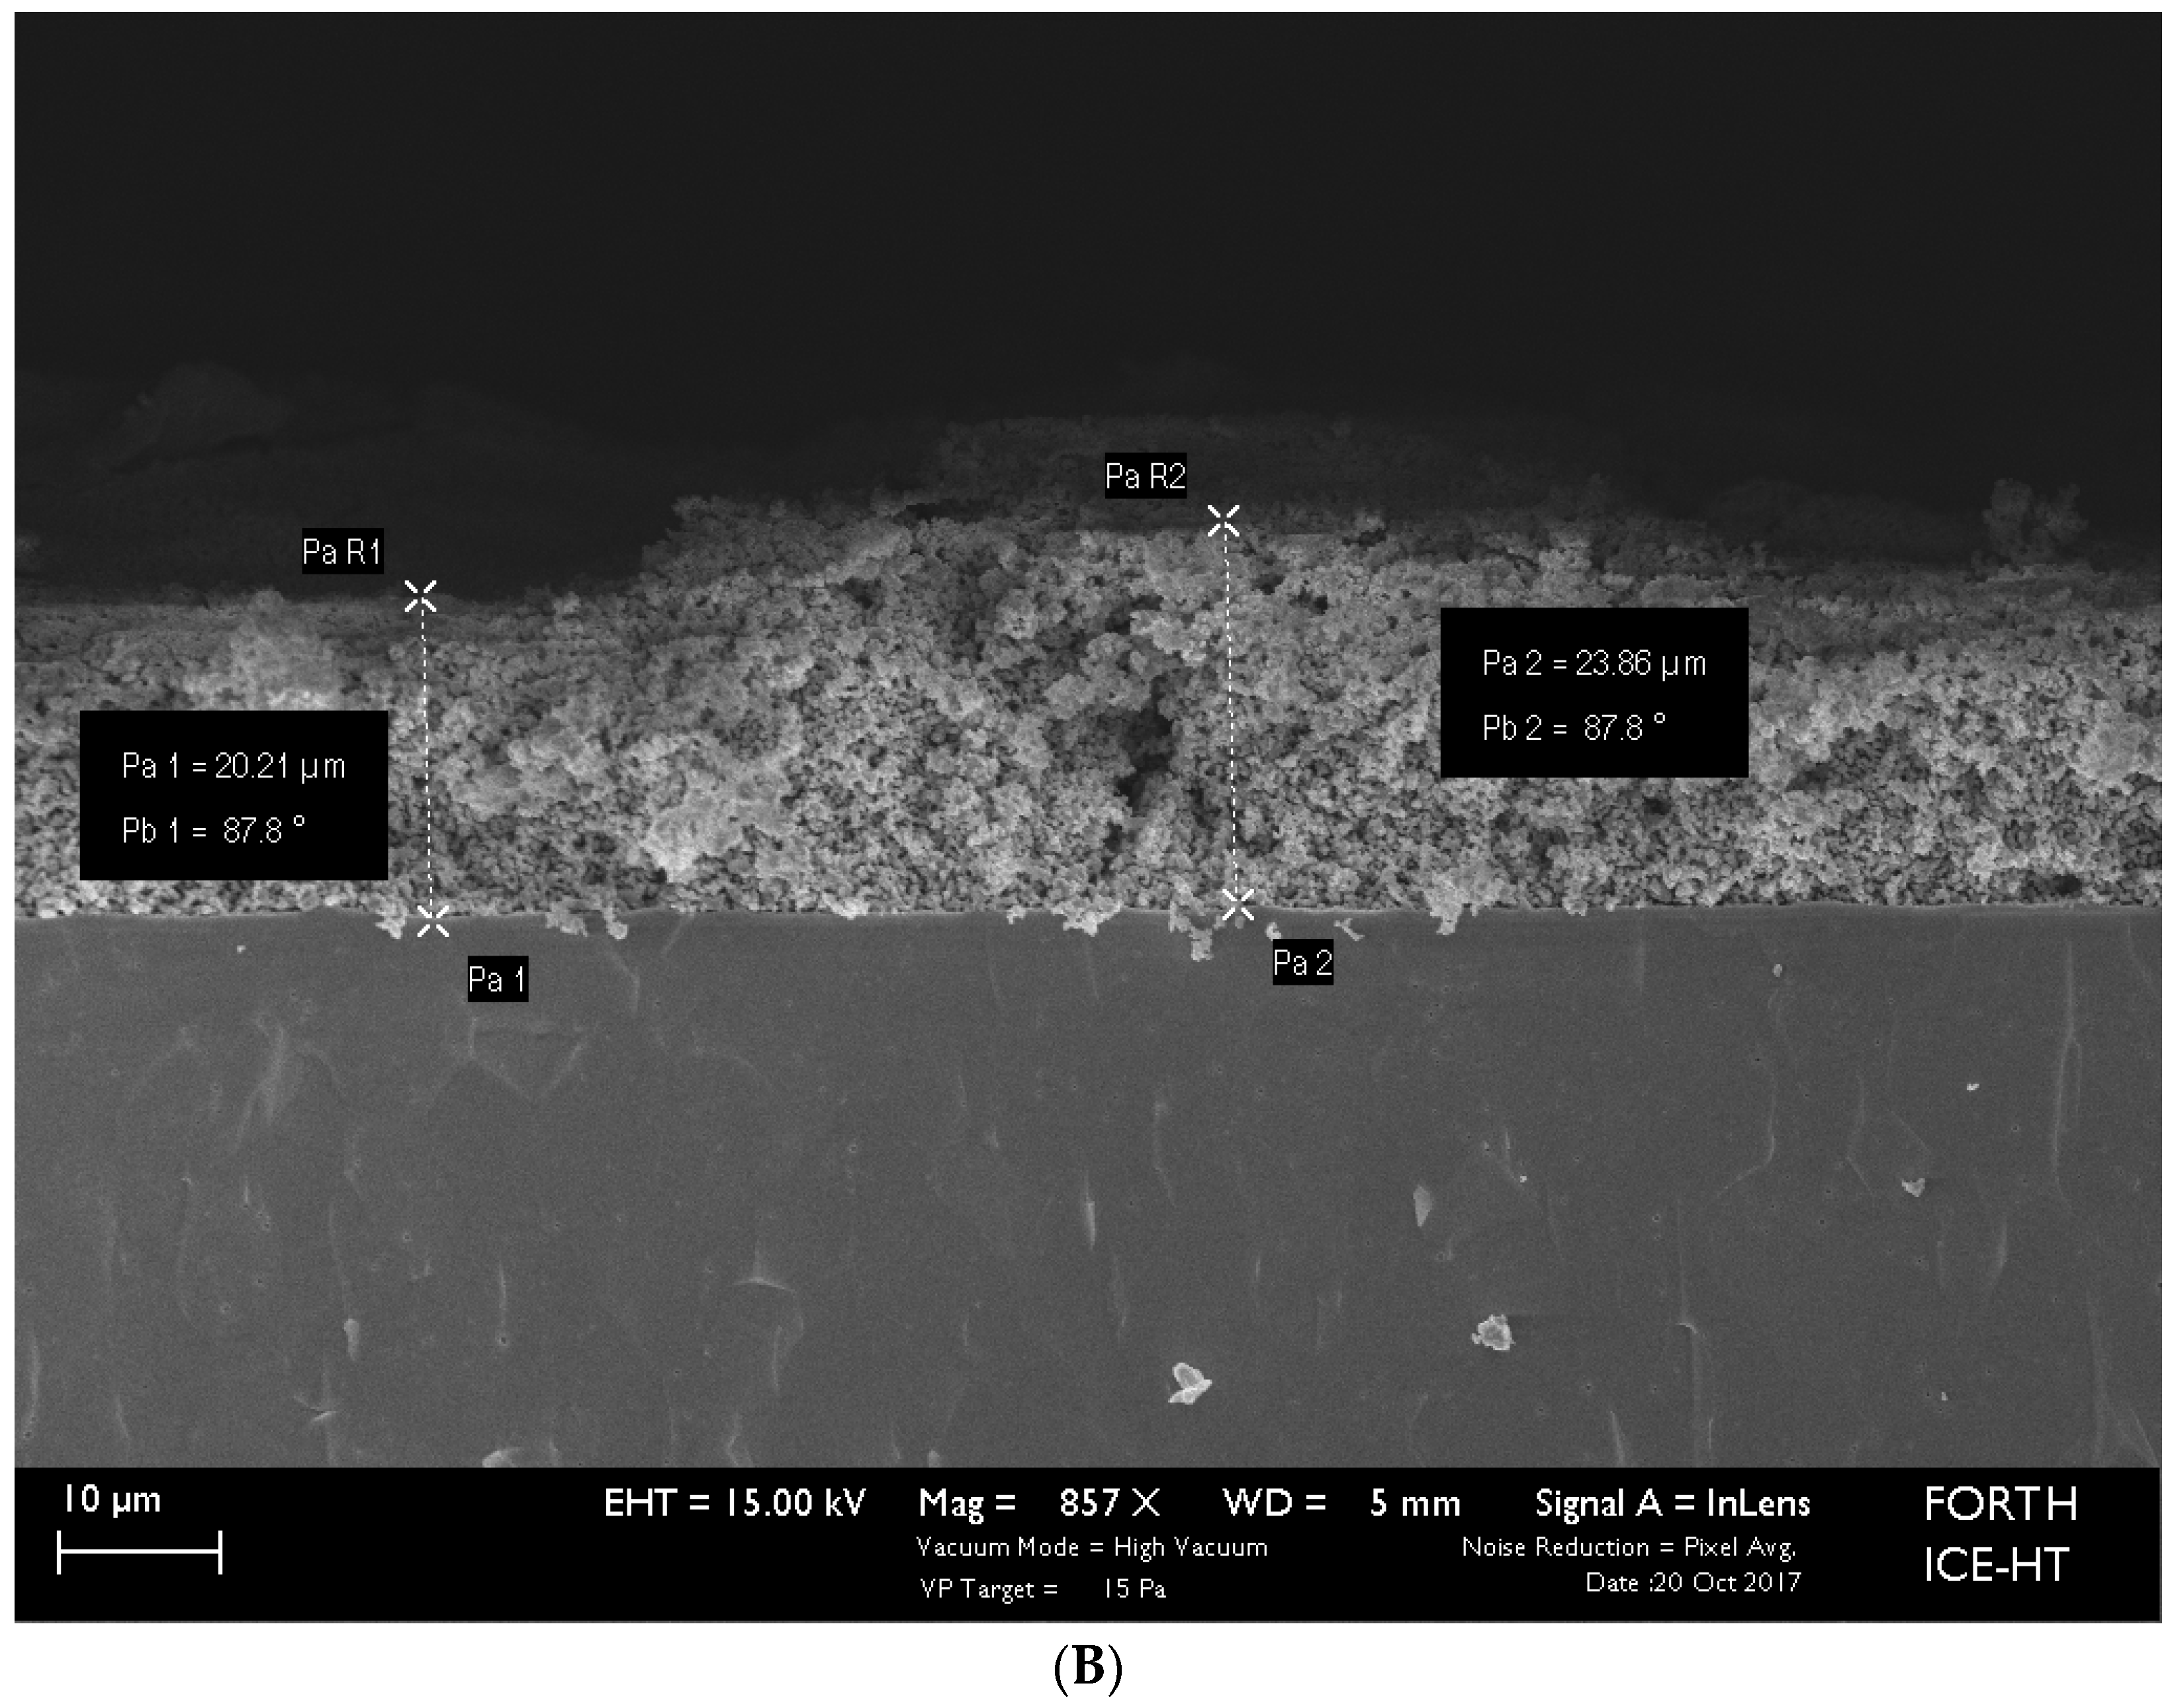
The electrolyte-supported half cells consisted of circular shaped planar 8YSZ electrolyte (by Kerafol) with a 25 mm diameter and 300 μm thickness. The fuel electrode was deposited by using the screen printing technique as reported in previous studies [23,46]. In particular, a paste was prepared by using an appropriate amount of the electrocatalyst (modified NiO/GDC powder), terpineol (Sigma-Aldrich, St. Louis, MO, USA) as the dispersant, and PVB (polyvinylbutyral, Sigma-Aldrich, St. Louis, MO, USA) as binder. After the deposition of the paste, the cell was sintered at 1150 °C with a heating/cooling ramp rate of 2 °C/min. The last temperature is the lowest possible in order to obtain proper adherence of the electrode on the electrolyte, whereas it is equivalent with the calcination temperature of the characterized powders (1100 °C). The examined electrodes were approximately 20 μm thick and their loading varied in the region of 10–12 mg/cm2 with a 1.8 cm2 geometric surface area (Figure 9). The prepared half cells were adjusted on a ceramic YSZ tube and sealed airtight with a glass sealing material manufactured by Kerafol.
3.3. Physicochemical Characterization
The samples, in the form of powders, were characterized with BET, H2-TPR, Air-TPO, and TGA re-oxidation measurements in the presence of H2O.
The BET specific surface area values of the samples were determined from the adsorption isotherms of nitrogen at −196 °C, recorded with a Micromeritics TriStar 3000 apparatus (Micromeritics, Norcross, GA, USA).
The re-oxidation measurements in the presence of H2O, as well as H2-TPR and Air-TPO measurements were carried out with a TA Q50 instrument. The H2O re-oxidation properties of the powders were studied with TGA measurements, at a constant temperature in the range of 650–800 °C. Before the measurement, the samples were pre-reduced in-situ with 80 vol.% H2/Ar at 800 °C for 100 min and then the feed was changed to 15.5 vol.% H2O/Ar. The total flow rate (at STP conditions: 0 °C, 1 atm) was 100 cm3/min and the loading of the measured samples was approximately 50 mg. Steam was introduced in the reactor by passing Ar through a saturator, which was maintained at a fixed temperature (65 °C).
3.4. Catalytic-Kinetic Measurements
The prepared half cells were catalytically investigated at Open Circuit Potential (OCP) conditions for the RWGS reaction, in the presence of Ni mesh. The catalytic experiments were accomplished at temperatures between 800–900 °C under various H2O/CO2/H2 mixtures by keeping in all cases the PH2O/PCO2 ratio constant. In regards to the experimental part of these measurements, H2O was added and handled in the feed in the form of steam, as in the SOEC measurements. Before its evaporation, liquid H2O was pressurized in a container and circulated in the system by means of a liquid water mass flow controller. Then, liquid H2O was evaporated through lines and valves, heated at 160 °C, to prevent water condensation. The flow rate was fixed at 140 cm3/min (at STP conditions: 0 °C, 1 atm), avoiding any mass transfer limitation effects in the reactor. Reactants and products were determined by using an on-line gas chromatograph (Varian CP-3800) with a thermal conductivity detector. Further details regarding the experimental parameters are indicated in the corresponding Figures.
4. Conclusions
The presented study deals with the kinetic investigation of Ni-based (modified or not) electrodes towards their performance for the RWGS reaction. The samples were examined in the form of electrolyte-supported (half) cells and the measured kinetic parameter was the production rate of CO. The main objective was to clarify the effect of the modification on the catalytic activity for the RWGS, which is considered as a key reaction for the CO production under H2O/CO2 co-electrolysis operation. The reaction conditions were similar to those that are applied under co-electrolysis mode.
Redox stability measurements in the presence of H2O showed that the ternary 3Au–3Mo-Ni/GDC electrode is the least active sample for the dissociation of H2O, having the highest Ea,app and consequently the lowest binding energy for the H2Oads. On the other hand, the binary 2Fe-Ni/GDC is the most active sample for the dissociation of H2O, thus having the potential to experience faster re-oxidation. Complementary characterization suggests that the interaction of Ni and Fe (FeOx species in the oxidized form of the sample) during the H2-reduction process increases the SSABET and affects the bulk properties of the binary Ni-Fe/GDC. The interaction can be realized through the possible formation of an Ni-Fe solid solution, which is currently under further clarification and may be responsible for enhancing the catalytic dissociation of H2Oads.
The kinetic study of the candidate electrocatalysts showed that Au modification inhibits the catalytic production of CO, through the RWGS reaction, while modification with Fe or Mo induces an enhancement of rCO. In fact, the 2wt% Fe-Ni/GDC sample is the most active both in terms of %CO2 conversion and of the produced CO. In addition, a negative synergy was observed for the ternary Au–Mo-Ni modified sample. Specifically, the 2wt% Fe-Ni/GDC and 3wt% Mo-Ni/GDC samples showed similar apparent activation energy for the RWGS reaction as that of Ni/GDC, while the 3wt% Au-Ni/GDC and 3wt% Au–3wt% Mo-Ni/GDC samples showed lower Ea,app. The above performance is observed for all applied fuel feeds (PH2/PCO2 = 0.86, 0.50, and 0.22), whereas it is enhanced by increasing (i) the operating temperature and (ii) the partial pressure of H2.
Consequently, the kinetic behavior of all samples suggests that the production rate of CO exhibits a positive order dependence on the partial pressure of H2, whereas carbon formation was not detected. In the case of the most active 2Fe-Ni/GDC sample, it is proposed that Fe-modification may enhance the catalytic dissociative adsorption of CO2 towards the production of CO and this is further investigated. Finally, it is worth mentioning that the RWGS catalytic performance of both Fe- and Mo- modified samples is close to the equilibrium, but cannot be considered as thermodynamically limited.
Overall, the presented results correspond to a reference catalytic profile of the examined modified Ni/GDC samples for the RWGS reaction. These candidate electrocatalysts are currently being examined, as full electrolyte supported cells, in SOEC measurements for the H2O/CO2 co-electrolysis reaction to elucidate any additional effects by the applied current. Moreover, further investigation of the Fe-modification on NiO/GDC for the H2O/CO2 electrolysis processes will occur in the future.
Supplementary Materials
The following are available online at https://www.mdpi.com/2073-4344/9/2/151/s1, Figure S1. Kinetic study of the R.W.G.S. reaction on the nickel mesh (■), Ni/GDC with Ni mesh (●) and Ni/GDC without Ni mesh (△), in the range of 800–900 °C, under two different mixtures: (A) 24.5% H2O − 24.5% CO2 − 21% H2 (PH2/PCO2 = 0.86) and (B) 28% H2O − 28% CO2 − 14% H2 (PH2/PCO2 = 0.50). Dilution of He: 30 vol.% and Ftotal = 140 cm3/min (at STP conditions: 0 °C, 1 atm) in all cases. The loading of Ni/GDC is 11 mg/cm2.
Author Contributions
Conceptualization, S.N. and D.N.; Data curation, E.I.; Formal analysis, E.I.; Funding acquisition, S.N. and D.N.; Investigation, E.I.; Methodology, S.N. and D.N.; Supervision, S.N. and D.N.; Validation, S.N. and D.N.; Writing—original draft, D.N.; Writing—review & editing, S.N., D.N. and E.I.
Funding
The research leading to these results has received funding from the Fuel Cells and Hydrogen 2 Joint Undertaking under the project SElySOs with Grant Agreement No: 671481. This Joint Undertaking receives support from the European Union’s Horizon 2020 Research and Innovation Programme and Greece, Germany, Czech Republic, France, and Norway.
Conflicts of Interest
The authors declare no conflict of interest.
References
- Ebbesen, S.D.; Mogensen, M. Electrolysis of carbon dioxide in Solid Oxide Electrolysis Cells. J. Power Sources 2009, 193, 349–358. [Google Scholar] [CrossRef]
- Graves, C.; Ebbesen, S.D.; Mogensen, M.; Lackner, K.S. Sustainable hydrocarbon fuels by recycling CO2 and H2O with renewable or nuclear energy. Renew. Sustain. Energy Rev. 2011, 15, 1–23. [Google Scholar] [CrossRef]
- Tao, Y.; Ebbesen, S.D.; Mogensen, M.B. Carbon Deposition in Solid Oxide Cells during Co-Electrolysis of H2O and CO2. J. Electrochem. Soc. 2014, 161, F337–F343. [Google Scholar] [CrossRef]
- Moçoteguy, P.; Brisse, A. A review and comprehensive analysis of degradation mechanisms of solid oxide electrolysis cells. Int. J. Hydrogen Energy 2013, 38, 15887–15902. [Google Scholar] [CrossRef]
- Laguna-Bercero, M.A. Recent advances in high temperature electrolysis using solid oxide fuel cells: A review. J. Power Sources 2012, 203, 4–16. [Google Scholar] [CrossRef] [Green Version]
- Petipas, F.; Brisse, A.; Bouallou, C. Benefits of external heat sources for high temperature electrolyser systems. Int. J. Hydrogen Energy 2014, 39, 5505–5513. [Google Scholar] [CrossRef]
- Zhang, X.; Song, Y.; Wang, G.; Bao, X. Co-electrolysis of CO2 and H2O in high-temperature solid oxide electrolysis cells: Recent advance in cathodes. J. Energy Chem. 2017, 26, 839–853. [Google Scholar] [CrossRef]
- Sun, X.; Chen, M.; Jensen, S.H.; Ebbesen, S.D.; Graves, C.; Mogensen, M. Thermodynamic analysis of synthetic hydrocarbon fuel production in pressurized solid oxide electrolysis cells. Int. J. Hydrogen Energy 2012, 37, 17101–17110. [Google Scholar] [CrossRef]
- Kim, S.-W.; Kim, H.; Yoon, K.J.; Lee, J.-H.; Kim, B.-K.; Choi, W.; Lee, J.-H.; Hong, J. Reactions and mass transport in high temperature co-electrolysis of steam/CO2 mixtures for syngas production. J. Power Sources 2015, 280, 630–639. [Google Scholar] [CrossRef]
- Li, W.; Wang, H.; Shi, Y.; Cai, N. Performance and methane production characteristics of H2O–CO2 co-electrolysis in solid oxide electrolysis cells. Int. J. Hydrogen Energy 2013, 38, 11104–11109. [Google Scholar] [CrossRef]
- Mahmood, A.; Bano, S.; Yu, J.H.; Lee, K.-H. Effect of operating conditions on the performance of solid electrolyte membrane reactor for steam and CO2 electrolysis. J. Membr. Sci. 2015, 473, 8–15. [Google Scholar] [CrossRef]
- Sun, X.; Chen, M.; Liu, Y.-L.; Hjalmarsson, P.; Ebbesen, S.D.; Jensen, S.H.; Mogensen, M.B.; Hendriksen, P.V. Durability of Solid Oxide Electrolysis Cells for Syngas Production. J. Electrochem. Soc. 2013, 160, F1074–F1080. [Google Scholar] [CrossRef] [Green Version]
- Ebbesen, S.D.; Graves, C.; Mogensen, M. Production of Synthetic Fuels by Co-Electrolysis of Steam and Carbon Dioxide. Int. J. Green Energy 2009, 6, 646–660. [Google Scholar] [CrossRef]
- Graves, C.; Ebbesen, S.D.; Mogensen, M. Co-electrolysis of CO2 and H2O in solid oxide cells: Performance and durability. Solid State Ion. 2011, 192, 398–403. [Google Scholar] [CrossRef]
- Diethelm, S.; Herle, J.V.; Montinaro, D.; Bucheli, O. Electrolysis and Co-Electrolysis Performance of SOE Short Stacks. Fuel Cells 2013, 13, 631–637. [Google Scholar] [CrossRef]
- Kim-Lohsoontorn, P.; Bae, J. Electrochemical performance of solid oxide electrolysis cell electrodes under high-temperature coelectrolysis of steam and carbon dioxide. J. Power Sources 2011, 196, 7161–7168. [Google Scholar] [CrossRef]
- Stoots, C.; O’Brien, J.; Hartvigsen, J. Results of recent high temperature coelectrolysis studies at the Idaho National Laboratory. Int. J. Hydrogen Energy 2009, 34, 4208–4215. [Google Scholar] [CrossRef] [Green Version]
- Ni, M. 2D thermal modeling of a solid oxide electrolyzer cell (SOEC) for syngas production by H2O/CO2 co-electrolysis. Int. J. Hydrogen Energy 2012, 37, 6389–6399. [Google Scholar] [CrossRef]
- Ni, M. An electrochemical model for syngas production by co-electrolysis of H2O and CO2. J. Power Sources 2012, 202, 209–216. [Google Scholar] [CrossRef]
- Yue, X.; Irvine, J.T.S. (La,Sr)(Cr,Mn)O3/GDC cathode for high temperature steam electrolysis and steam-carbon dioxide co-electrolysis. Solid State Ion. 2012, 225, 131–135. [Google Scholar] [CrossRef]
- Zhan, Z.; Zhao, L. Electrochemical reduction of CO2 in solid oxide electrolysis cells. J. Power Sources 2010, 195, 7250–7254. [Google Scholar] [CrossRef]
- Ebbesen, S.D.; Jensen, S.H.; Hauch, A.; Mogensen, M.B. High Temperature Electrolysis in Alkaline Cells, Solid Proton Conducting Cells, and Solid Oxide Cells. Chem. Rev. 2014, 114, 10697–10734. [Google Scholar] [CrossRef]
- Neofytidis, C.; Dracopoulos, V.; Neophytides, S.G.; Niakolas, D.K. Electrocatalytic performance and carbon tolerance of ternary Au-Mo-Ni/GDC SOFC anodes under CH4-rich Internal Steam Reforming conditions. Catal. Today 2018, 310, 157–165. [Google Scholar] [CrossRef]
- Liang, M.; Yu, B.; Wen, M.; Chen, J.; Xu, J.; Zhai, Y. Preparation of NiO–YSZ composite powder by a combustion method and its application for cathode of SOEC. Int. J. Hydrogen Energy 2010, 35, 2852–2857. [Google Scholar] [CrossRef]
- Kleiminger, L.; Li, T.; Li, K.; Kelsall, G.H. CO2 splitting into CO and O2 in micro-tubular solid oxide electrolysers. RSC Adv. 2014, 4, 50003–50016. [Google Scholar] [CrossRef]
- Marina, O.A.; Pederson, L.R.; Williams, M.C.; Coffey, G.W.; Meinhardt, K.D.; Nguyen, C.D.; Thomsen, E.C. Electrode Performance in Reversible Solid Oxide Fuel Cells. J. Electrochem. Soc. 2007, 154, B452–B459. [Google Scholar] [CrossRef]
- Hjalmarsson, P.; Sun, X.; Liu, Y.-L.; Chen, M. Durability of high performance Ni–yttria stabilized zirconia supported solid oxide electrolysis cells at high current density. J. Power Sources 2014, 262, 316–322. [Google Scholar] [CrossRef]
- Tao, Y.; Ebbesen, S.D.; Mogensen, M.B. Degradation of solid oxide cells during co-electrolysis of steam and carbon dioxide at high current densities. J. Power Sources 2016, 328, 452–462. [Google Scholar] [CrossRef]
- Hauch, A.; Ebbesen, S.D.; Jensen, S.H.; Mogensen, M. Solid Oxide Electrolysis Cells: Microstructure and Degradation of the Ni/Yttria-Stabilized Zirconia Electrode. J. Electrochem. Soc. 2008, 155, B1184–B1193. [Google Scholar] [CrossRef] [Green Version]
- Chen, M.; Liu, Y.-L.; Bentzen, J.J.; Zhang, W.; Sun, X.; Hauch, A.; Tao, Y.; Bowen, J.R.; Hendriksen, P.V. Microstructural Degradation of Ni/YSZ Electrodes in Solid Oxide Electrolysis Cells under High Current. J. Electrochem. Soc. 2013, 160, F883–F891. [Google Scholar] [CrossRef]
- Tietz, F.; Sebold, D.; Brisse, A.; Schefold, J. Degradation phenomena in a solid oxide electrolysis cell after 9000 h of operation. J. Power Sources 2013, 223, 129–135. [Google Scholar] [CrossRef]
- Knibbe, R.; Traulsen, M.L.; Hauch, A.; Ebbesen, S.D.; Mogensen, M. Solid Oxide Electrolysis Cells: Degradation at High Current Densities. J. Electrochem. Soc. 2010, 157, B1209–B1217. [Google Scholar] [CrossRef]
- Hauch, A.; Brodersen, K.; Chen, M.; Mogensen, M.B. Ni/YSZ electrodes structures optimized for increased electrolysis performance and durability. Solid State Ion. 2016, 293, 27–36. [Google Scholar] [CrossRef] [Green Version]
- Papaefthimiou, V.; Niakolas, D.K.; Paloukis, F.; Teschner, D.; Knop-Gericke, A.; Haevecker, M.; Zafeiratos, S. Operando observation of nickel/ceria electrode surfaces during intermediate temperature steam electrolysis. J. Catal. 2017, 352, 305–313. [Google Scholar] [CrossRef]
- Liu, S.; Chuang, K.T.; Luo, J.-L. Double-Layered Perovskite Anode with in Situ Exsolution of a Co–Fe Alloy To Cogenerate Ethylene and Electricity in a Proton-Conducting Ethane Fuel Cell. ACS Catal. 2016, 6, 760–768. [Google Scholar] [CrossRef]
- Nishida, R.; Puengjinda, P.; Nishino, H.; Kakinuma, K.; Brito, M.E.; Watanabe, M.; Uchida, H. High-performance electrodes for reversible solid oxide fuel cell/solid oxide electrolysis cell: Ni-Co dispersed ceria hydrogen electrodes. RSC Adv. 2014, 4, 16260–16266. [Google Scholar] [CrossRef]
- Kim, S.-W.; Park, M.; Kim, H.; Yoon, K.J.; Son, J.-W.; Lee, J.-H.; Kim, B.-K.; Lee, J.-H.; Hong, J. Catalytic Effect of Pd-Ni Bimetallic Catalysts on High-Temperature Co-Electrolysis of Steam/CO2 Mixtures. J. Electrochem. Soc. 2016, 163, F3171–F3178. [Google Scholar] [CrossRef]
- Ishihara, T.; Jirathiwathanakul, N.; Zhong, H. Intermediate temperature solid oxide electrolysis cell using LaGaO3 based perovskite electrolyte. Energy Environ. Sci. 2010, 3, 665–672. [Google Scholar] [CrossRef]
- Wang, S.; Inoishi, A.; Hong, J.-E.; Ju, Y.-W.; Hagiwara, H.; Ida, S.; Ishihara, T. Ni–Fe bimetallic cathodes for intermediate temperature CO2 electrolyzers using a La0.9Sr0.1Ga0.8Mg0.2O3 electrolyte. J. Mater. Chem. A 2013, 1, 12455–12461. [Google Scholar] [CrossRef]
- Back, S.; Jung, Y. Importance of Ligand Effects Breaking the Scaling Relation for Core–Shell Oxygen Reduction Catalysts. ChemCatChem 2017, 9, 3173–3179. [Google Scholar] [CrossRef]
- Cho, A.; Ko, J.; Kim, B.-K.; Han, J.W. Electrocatalysts with Increased Activity for Coelectrolysis of Steam and Carbon Dioxide in Solid Oxide Electrolyzer Cells. ACS Catal. 2018, 967–976. [Google Scholar] [CrossRef]
- Niakolas, D.K.; Athanasiou, M.; Dracopoulos, V.; Tsiaoussis, I.; Bebelis, S.; Neophytides, S.G. Study of the synergistic interaction between nickel, gold and molybdenum in novel modified NiO/GDC cermets, possible anode materials for CH4 fueled SOFCs. Appl. Catal. A Gen. 2013, 456, 223–232. [Google Scholar] [CrossRef]
- Niakolas, D.K.; Ouweltjes, J.P.; Rietveld, G.; Dracopoulos, V.; Neophytides, S.G. Au-doped Ni/GDC as a new anode for SOFCs operating under rich CH4 internal steam reforming. Int. J. Hydrogen Energy 2010, 35, 7898–7904. [Google Scholar] [CrossRef]
- Neofytidis, C.; Athanasiou, M.; Neophytides, S.G.; Niakolas, D.K. Sulfur Tolerance of Au–Mο–Ni/GDC SOFC Anodes Under Various CH4 Internal Steam Reforming Conditions. Top. Catal. 2015, 58, 1276–1289. [Google Scholar] [CrossRef]
- Niakolas, D.K.; Neofytidis, C.S.; Neophytides, S.G. Effect of Au and/or Mo Doping on the Development of Carbon and Sulfur Tolerant Anodes for SOFCs—A Short Review. Front. Environ. Sci. 2017, 5. [Google Scholar] [CrossRef] [Green Version]
- Ioannidou, E.; Neofytidis, C.; Sygellou, L.; Niakolas, D.K. Au-doped Ni/GDC as an Improved Cathode Electrocatalyst for H2O Electrolysis in SOECs. Appl. Catal. B Environ. 2018, 236, 253–264. [Google Scholar] [CrossRef]
- Wandekar, R.V.; Ali, M.; Wani, B.N.; Bharadwaj, S.R. Physicochemical studies of NiO–GDC composites. Mater. Chem. Phys. 2006, 99, 289–294. [Google Scholar] [CrossRef]
- Sarantaridis, D.; Atkinson, A. Redox Cycling of Ni-Based Solid Oxide Fuel Cell Anodes: A Review. Fuel Cells 2007, 7, 246–258. [Google Scholar] [CrossRef]
- Ettler, M.; Timmermann, H.; Malzbender, J.; Weber, A.; Menzler, N.H. Durability of Ni anodes during reoxidation cycles. J. Power Sources 2010, 195, 5452–5467. [Google Scholar] [CrossRef]
- Atkinson, A.; Smart, D.W. Transport of Nickel and Oxygen during the Oxidation of Nickel and Dilute Nickel/Chromium Alloy. J. Electrochem. Soc. 1988, 135, 2886–2893. [Google Scholar] [CrossRef]
- Ghosh, S.; Hariharan, S.; Tiwari, A.K. Water Adsorption and Dissociation on Copper/Nickel Bimetallic Surface Alloys: Effect of Surface Temperature on Reactivity. J. Phys. Chem. C 2017, 121, 16351–16365. [Google Scholar] [CrossRef]
- Gan, L.-Y.; Tian, R.-Y.; Yang, X.-B.; Lu, H.-D.; Zhao, Y.-J. Catalytic Reactivity of CuNi Alloys toward H2O and CO Dissociation for an Efficient Water–Gas Shift: A DFT Study. J. Phys. Chem. C 2012, 116, 745–752. [Google Scholar] [CrossRef]
- Gu, X.-K.; Nikolla, E. Fundamental Insights into High-Temperature Water Electrolysis Using Ni-Based Electrocatalysts. J. Phys. Chem. C 2015, 119, 26980–26988. [Google Scholar] [CrossRef]
- Niakolas, D.K. Sulfur poisoning of Ni-based anodes for Solid Oxide Fuel Cells in H/C-based fuels. Appl. Catal. A Gen. 2014, 486, 123–142. [Google Scholar] [CrossRef]
- Sapountzi, F.M.; Zhao, C.; Boreave, A.; Retailleau-Mevel, L.; Niakolas, D.; Neofytidis, C.; Vernoux, P. Sulphur tolerance of Au-modified Ni/GDC during catalytic methane steam reforming. Catal. Sci. Technol. 2018, 8, 1578–1588. [Google Scholar] [CrossRef]
- Besenbacher, F.; Chorkendorff, I.; Clausen, B.S.; Hammer, B.; Molenbroek, A.M.; Norskov, J.K.; Stensgaard, I. Design of a surface alloy catalyst for steam reforming. Science 1998, 279, 1913–1915. [Google Scholar] [CrossRef]
- Water-Gas Shift Reaction. Available online: https://en.wikipedia.org/wiki/Water-gas_shift_reaction (accessed on 10 December 2018).
- Caitlin, C. Kinetics and Catalysis of the Water-Gas-Shift Reaction: A Microkinetic and Graph Theoretic Approach; Worcester Polytechnic Institute: Worcester, MA, USA, 2006. [Google Scholar]
- Stoots, C.M.; O’Brien, J.E.; Herring, J.S.; Hartvigsen, J.J. Syngas Production via High-Temperature Coelectrolysis of Steam and Carbon Dioxide. J. Fuel Cell Sci. Technol. 2008, 6. [Google Scholar] [CrossRef]
- Sasaki, K.; Teraoka, Y. Equilibria in Fuel Cell Gases: II. The C-H-O Ternary Diagrams. J. Electrochem. Soc. 2003, 150, A885–A888. [Google Scholar] [CrossRef]
Figure 1.
TGA (A) H2-TPR (12 vol.% H2/Ar), and (B) O2-TPO (33 vol.% air) profiles of X-modified NiO/GDC samples (where X= Au, Mo, and Fe). The measurements were performed on powders, calcined at 1100 °C. Ftotal = 60 cm3/min (STP conditions: 0 °C, 1 atm).
Figure 1.
TGA (A) H2-TPR (12 vol.% H2/Ar), and (B) O2-TPO (33 vol.% air) profiles of X-modified NiO/GDC samples (where X= Au, Mo, and Fe). The measurements were performed on powders, calcined at 1100 °C. Ftotal = 60 cm3/min (STP conditions: 0 °C, 1 atm).


Figure 2.
Isothermal TG analysis of the pre-reduced, (A) Ni/GDC, (B) 3wt% Au-Ni/GDC, (C) 3wt% Mo-Ni/GDC, (D) 3wt% Au–3wt% Mo-Ni/GDC, and (E) 2wt% Fe-Ni/GDC samples in the temperature range between 650–800 °C. (F) Comparative TG profiles of the samples at 800 °C. Feed Conditions: 15.5 vol.% H2O/Ar, Ftotal = 100 cm3/min (STP conditions: 0 °C, 1 atm).

Figure 3.
Arrhenius plots of the H2O re-oxidation rate (resulting from the slope of the isothermal TG profiles in Figure 2) for: Ni/GDC, 3wt% Au-Ni/GDC, 3wt% Mo-Ni/GDC, 3wt% Au–3wt% Mo-Ni/GDC, and 2wt% Fe-Ni/GDC Feed Conditions: 15.5 vol.% H2O/Ar, Ftotal = 110 cm3/min (STP conditions: 0 °C, 1 atm).
Figure 3.
Arrhenius plots of the H2O re-oxidation rate (resulting from the slope of the isothermal TG profiles in Figure 2) for: Ni/GDC, 3wt% Au-Ni/GDC, 3wt% Mo-Ni/GDC, 3wt% Au–3wt% Mo-Ni/GDC, and 2wt% Fe-Ni/GDC Feed Conditions: 15.5 vol.% H2O/Ar, Ftotal = 110 cm3/min (STP conditions: 0 °C, 1 atm).

Figure 4.
CO production rates (μmol s−1 g−1) on ESCs comprising: Ni/GDC, 3Au-Νi/GDC, 3Μο-Νi/GDC, 3Au–3Μο-Νi/GDC, and 2Fe-Ni/GDC, as fuel electrodes, in the range of 800–900 °C under three different mixtures: (A) 24.5% H2O − 24.5% CO2 − 21% H2 (PH2/PCO2 = 0.86), (B) 28% H2O − 28% CO2 − 14% H2 (PH2/PCO2 = 0.50), and (C) 31.5% H2O − 31.5% CO2 − 7% H2 (PH2/PCO2 = 0.22). Dilution of He: 30 vol.% and Ftotal = 140 cm3/min (STP conditions: 0 °C, 1 atm) in all cases. The dash line (– –) corresponds to the rCO values in thermodynamic equilibrium. All studied electrodes have similar loading in the range of 10–12 mg/cm2.

Figure 5.
The corresponding %CO2 conversions of ESCs comprising: Ni/GDC, 3Au-Νi/GDC, 3Μο-Νi/GDC, 3Au–3Μο-Νi/GDC, and 2Fe-Ni/GDC, as fuel electrodes, in the range of 800–900 °C under three different mixtures: (A) 24.5% H2O − 24.5% CO2 − 21% H2 (PH2/PCO2 = 0.86), (B) 28% H2O − 28% CO2 − 14% H2 (PH2/PCO2 = 0.50), and (C) 31.5% H2O − 31.5% CO2 − 7% H2 (PH2/PCO2 = 0.22). Dilution of He: 30 vol.% and Ftotal = 140 cm3/min (at STP conditions: 0 °C, 1 atm) in all cases. All studied electrodes have similar loading in the range of 10–12 mg/cm2.

Figure 6.
Arrhenius plots of the CO production rates (μmol s−1 g−1) on ESCs comprising: Ni/GDC, 3Au-Νi/GDC, 3Μο-Νi/GDC, 3Au–3Μο-Νi/GDC, and 2Fe-Ni/GDC, in the range of 800–900 °C, under three different mixtures: (A) 24.5% H2O − 24.5% CO2 − 21% H2 (PH2/PCO2 = 0.86), (B) 28% H2O − 28% CO2 − 14% H2 (PH2/PCO2 = 0.50), and (C) 31.5% H2O − 31.5% CO2 − 7% H2 (PH2/PCO2 = 0.22). Dilution of He: 30 vol.% and Ftotal = 140 cm3/min (at STP conditions: 0 °C, 1 atm) in all cases.

Figure 7.
Steady state effect of the H2 partial pressure (pH2, kPa) on the CO production rates (μmol s−1 g−1) on ESCs comprising: Ni/GDC, 3Au-Νi/GDC, 3Μο-Νi/GDC, 3Au–3Μο-Νi/GDC, and 2Fe-Ni/GDC, for 900 °C and 800 °C. The pH2O/pCO2 ratios are fixed and their values are presented in Table 3.
Figure 7.
Steady state effect of the H2 partial pressure (pH2, kPa) on the CO production rates (μmol s−1 g−1) on ESCs comprising: Ni/GDC, 3Au-Νi/GDC, 3Μο-Νi/GDC, 3Au–3Μο-Νi/GDC, and 2Fe-Ni/GDC, for 900 °C and 800 °C. The pH2O/pCO2 ratios are fixed and their values are presented in Table 3.

Figure 8.
Investigation of the Boudouard reaction at 900 °C and 800 °C under OCP conditions on ESCs comprising: Ni/GDC, 3Au-Νi/GDC, 3Μο-Νi/GDC, 3Au–3Μο-Νi/GDC, and 2Fe-Ni/GDC. Theoretical case where [CO2]inlet is equal to [CO+CO2]outlet is also depicted with a solid line.
Figure 8.
Investigation of the Boudouard reaction at 900 °C and 800 °C under OCP conditions on ESCs comprising: Ni/GDC, 3Au-Νi/GDC, 3Μο-Νi/GDC, 3Au–3Μο-Νi/GDC, and 2Fe-Ni/GDC. Theoretical case where [CO2]inlet is equal to [CO+CO2]outlet is also depicted with a solid line.

Figure 9.
Images of a (half) electrolyte supported cell (ESC) prepared by screen printing: (A) NiO/GDC electrode and (B) SEM cross section perpendicular to the NiO/GDC//YSZ (half) electrolyte-supported cell.
Figure 9.
Images of a (half) electrolyte supported cell (ESC) prepared by screen printing: (A) NiO/GDC electrode and (B) SEM cross section perpendicular to the NiO/GDC//YSZ (half) electrolyte-supported cell.


Table 1.
BET Specific Surface Area (SSABET) of commercial NiO/GDC, and X-modified NiO/GDC samples (where X = Au, Mo, and Fe). The measurements were performed on powders, calcined at 600 °C, 1100 °C, and after H2-reduction at 850 °C. Error/accuracy of SSABET = ±0.2 m2 g−1.
Table 1.
BET Specific Surface Area (SSABET) of commercial NiO/GDC, and X-modified NiO/GDC samples (where X = Au, Mo, and Fe). The measurements were performed on powders, calcined at 600 °C, 1100 °C, and after H2-reduction at 850 °C. Error/accuracy of SSABET = ±0.2 m2 g−1.
| Sample Powder | SSABET (m2 g−1) | ||
|---|---|---|---|
| T = 600 °C, (oxidized) | T = 1100 °C, (oxidized) | After H2-reduction at T = 850 °C | |
| NiO/GDC | 5.3 | 2.9 | 2.0 |
| 3Au-NiO/GDC | 5.4 | 2.7 | 2.1 |
| 3Mo-NiO/GDC | 5.0 | 2.2 | 1.7 |
| 3Au–3Mo-NiO/GDC | 5.1 | 2.4 | 1.8 |
| 2Fe-NiO/GDC | 8.8 | 4.0 | 3.4 |
Table 2.
Apparent activation energies (kJ mol−1) for the dissociation of H2O on commercial Ni/GDC [46], and modified Ni/GDC samples. The values correspond to the slopes of the Arrhenius plots in Figure 3.
| Sample Powder | Ea, app (kJ mol−1) |
|---|---|
| Ni/GDC [46] | 41 |
| 3Au-Ni/GDC [46] | 56 |
| 3Mo-Ni/GDC | 45 |
| 3Au–3Mo-Ni/GDC | 63 |
| 2Fe-Ni/GDC | 20 |
Table 3.
Apparent activation energies (Ea,app, kJ/mol) for the RWGS reaction on ESCs for three different mixtures: (A) 24.5% H2O − 24.5% CO2 − 21% H2 (PH2/PCO2 = 0.86), (B) 28% H2O − 28% CO2 − 14% H2 (PH2/PCO2 = 0.50), and (C) 31.5% H2O − 31.5% CO2 − 7% H2 (PH2/PCO2 = 0.22).
Table 3.
Apparent activation energies (Ea,app, kJ/mol) for the RWGS reaction on ESCs for three different mixtures: (A) 24.5% H2O − 24.5% CO2 − 21% H2 (PH2/PCO2 = 0.86), (B) 28% H2O − 28% CO2 − 14% H2 (PH2/PCO2 = 0.50), and (C) 31.5% H2O − 31.5% CO2 − 7% H2 (PH2/PCO2 = 0.22).
| Sample | Ea, apparent (kJ mol−1) and A* (μmol s−1 g−1), per reaction mixture | |||||
|---|---|---|---|---|---|---|
| PH2/PCO2 = 0.86 | PH2/PCO2 = 0.50 | PH2/PCO2 = 0.22 | ||||
| Ni/GDC | 20 | 2.3 × 10³ | 22 | 3.6 × 10³ | 20 | 1.0 × 10³ |
| 3Au-Ni/GDC | 85 | 1.9 × 10⁶ | 74 | 5.0 × 10⁵ | 46 | 1.5 × 10⁴ |
| 3Mo-Ni/GDC | 27 | 6.5 × 10³ | 14 | 1.1 × 10³ | 21 | 1.4 × 10³ |
| 3Au–3Mo-Ni/GDC | 43 | 1.7 × 10⁴ | 45 | 1.5 × 10⁴ | 50 | 1.6 × 10⁴ |
| 2Fe-Ni/GDC | 21 | 3.3 × 10³ | 19 | 1.6 × 10³ | 21 | 1.3 × 10³ |
*A: The pre-exponential factor in the Arrhenius equation, .
© 2019 by the authors. Licensee MDPI, Basel, Switzerland. This article is an open access article distributed under the terms and conditions of the Creative Commons Attribution (CC BY) license (http://creativecommons.org/licenses/by/4.0/).
Share and Cite
MDPI and ACS Style
Ioannidou, E.; Neophytides, S.; Niakolas, D.K. Experimental Clarification of the RWGS Reaction Effect in H2O/CO2 SOEC Co-Electrolysis Conditions. Catalysts 2019, 9, 151. https://doi.org/10.3390/catal9020151
AMA Style
Ioannidou E, Neophytides S, Niakolas DK. Experimental Clarification of the RWGS Reaction Effect in H2O/CO2 SOEC Co-Electrolysis Conditions. Catalysts. 2019; 9(2):151. https://doi.org/10.3390/catal9020151
Chicago/Turabian StyleIoannidou, Evangelia, Stylianos Neophytides, and Dimitrios K. Niakolas. 2019. "Experimental Clarification of the RWGS Reaction Effect in H2O/CO2 SOEC Co-Electrolysis Conditions" Catalysts 9, no. 2: 151. https://doi.org/10.3390/catal9020151
Note that from the first issue of 2016, this journal uses article numbers instead of page numbers. See further details here.