Article

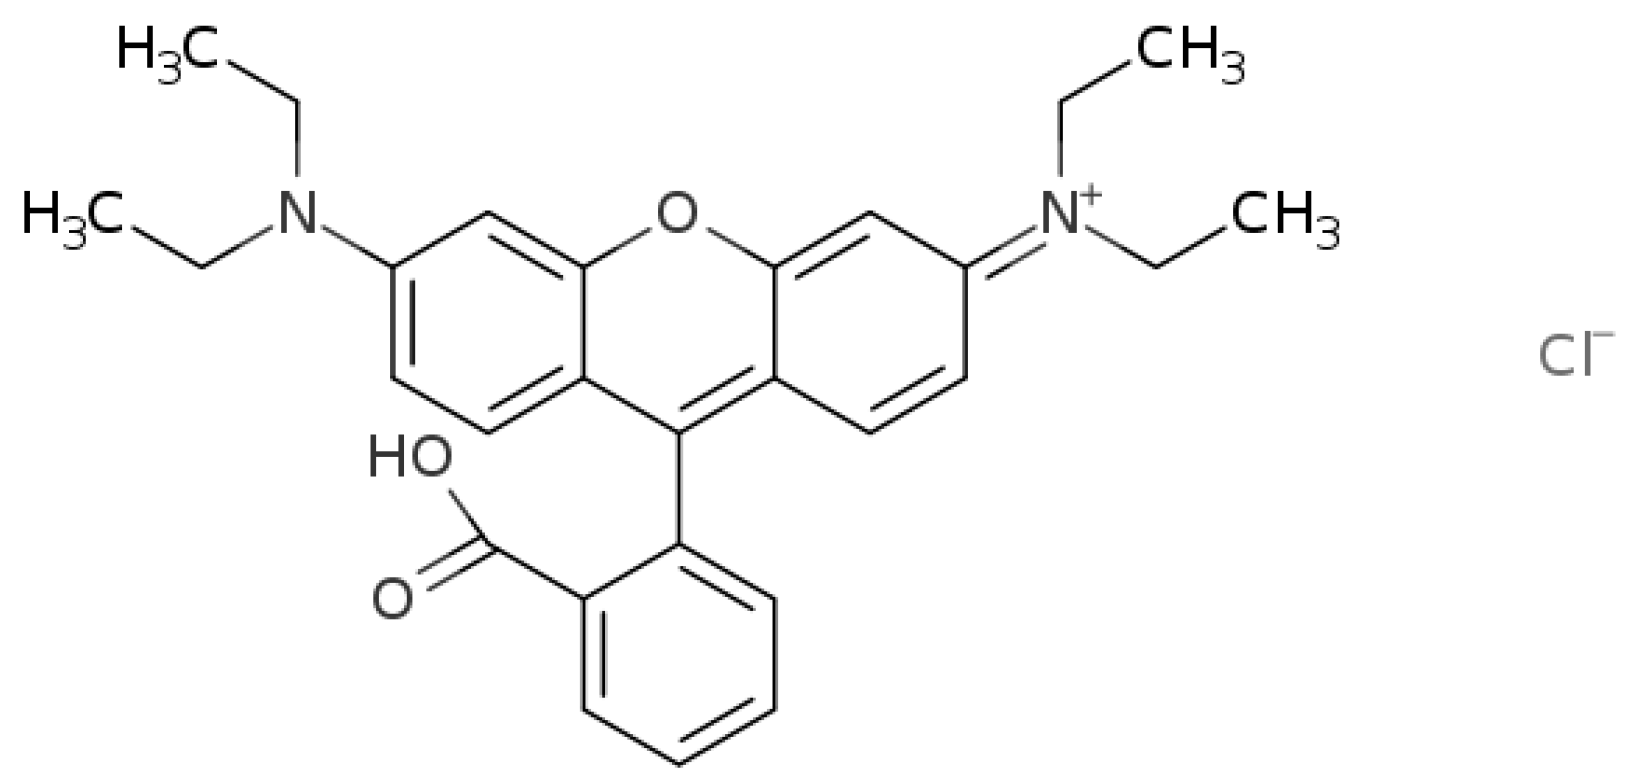
De-Ethylation and Cleavage of Rhodamine B by a Zirconium Phosphate/Silver Bromide Composite Photocatalyst

1
Department of Pharmaceutical Sciences, University of Perugia, Via del Liceo, 1, 06123 Perugia, Italy
2
Department of Chemistry, Biology and Biotechnologies, University of Perugia, Via Elce di Sotto, 8, 06123 Perugia, Italy
*
Authors to whom correspondence should be addressed.
Catalysts 2019, 9(1), 3; https://doi.org/10.3390/catal9010003
Submission received: 15 November 2018 / Revised: 10 December 2018 / Accepted: 17 December 2018 / Published: 21 December 2018
(This article belongs to the Special Issue New Trends in the Photocatalytic Removal of Organic Dyes)

Abstract

:
A composite heterogeneous photocatalyst based on silver bromide was prepared by a reaction of silver exchanged zirconium phosphate (ZrP) and HBr. The ZrP/AgBr composite containing 53 wt% AgBr was tested in the photocatalytic degradation of Rhodamine B (RhB) and exhibited higher catalytic activity with respect to pure AgBr. As a matter of fact, the time needed to achieve a percentage of chromophore cleavage of about 90% was 3 min for the composite versus the 30 min needed for pure AgBr. The ZrP/AgBr composite turned out to be stable for at least three consecutive cycles. The UV-Vis spectra of the RhB solution, recorded at different irradiation times, were also decomposed and the concentration of the species formed by de-ethylation and cleavage processes during photocatalysis were calculated; the data obtained for the AgBr-based catalysis were also compared with those for the AgCl-based catalysis, and the degradation mechanism was suggested for both catalytic systems.

1. Introduction

Composite materials are obtained by combining two or more materials with different properties, with the aim of obtaining novel systems in which the single components work together to obtain new and unique properties [1]. Composite materials are used in several fields, for example in plastic materials, in which an inorganic component is dispersed in a polymer matrix to improve its mechanical properties, as well as to reduce permeation to liquid or gas species.
In catalysis, composite materials are often used to improve the catalytic efficiency of one or both components. In this regard, heterogeneous composite catalysts can be made of one catalytic active species supported on a solid matrix or consist of two active species combined together in order to promote specific interactions that achieve an enhancement of the catalytic activity. In an interesting review by Xie et al. published in 2010 [2], the authors give a detailed list of the various kinds of composite catalysts, organized according to the combination methods of the components, and also a list of the positive effects coming from the use of composite catalysts. Solid supports for active species in heterogeneous catalysis include alumina, silica, titania, zeolites, metal oxides, activated carbons, and polymers. These have been extensively studied [3], together with layered Zr(IV) phosphates and phosphonates [4].
Zirconium monohydrogenphosphate of α-type (α-Zr(HPO4)2⋅H2O, α-ZrP) is a layered material with each layer consisting of ZrO6 octahedra sharing oxygens with six HPO4 tetrahedra through vertices. The POH groups point in the interlayer region and form hydrogen bonds with the water molecules [4,5,6]. It is a cation exchanger and has been used as a solid acid catalyst for several organic reactions. α-ZrP has been also used as solid support for catalytic species such as metal cations, noble metal nanoparticles and metal complexes [4,7]. In 2015, composite photocatalysts made of α-ZrP and AgCl particles were tested in the photo-assisted degradation of Rhodamine B [8]. The authors took advantage of the ion exchange properties of α-ZrP to prepare the composite through a two-step procedure: first, Ag(I)-exchanged ZrP was prepared, then, AgCl was formed by the reaction of the above compound with HCl. The procedure led to an intimate interspersion of the two crystalline phases, resulting in an enhanced photocatalytic activity of the composite with respect to AgCl and to the corresponding ZrP/AgCl physical mixture. The authors proposed several arguments about the roles of ZrP, including:
  • reducing AgCl particle growth and aggregation, thus increasing the number of catalytic active sites;
  • promoting the chemisorption of the protonated dye on its surface and, in turn, the degradation of the chromophore;
  • creating an acidic medium that promotes the formation of species with higher oxidative potential.
Several authors evaluated and compared the behavior of different silver halides in photocatalysis. They found that the partial chemical reduction of Ag(I) ions from the AgX crystal lattice led to the formation of Ag nanoparticles (NPs) and, consequently, of Ag@AgX heterojunctions which improve the visible light absorption by the photocatalysts thanks to the surface plasmon resonance of the Ag NPs [9,10,11,12,13,14,15,16].
Moreover, literature data on the photodegradation of RhB proved that it occurs through two pathways [17,18]:
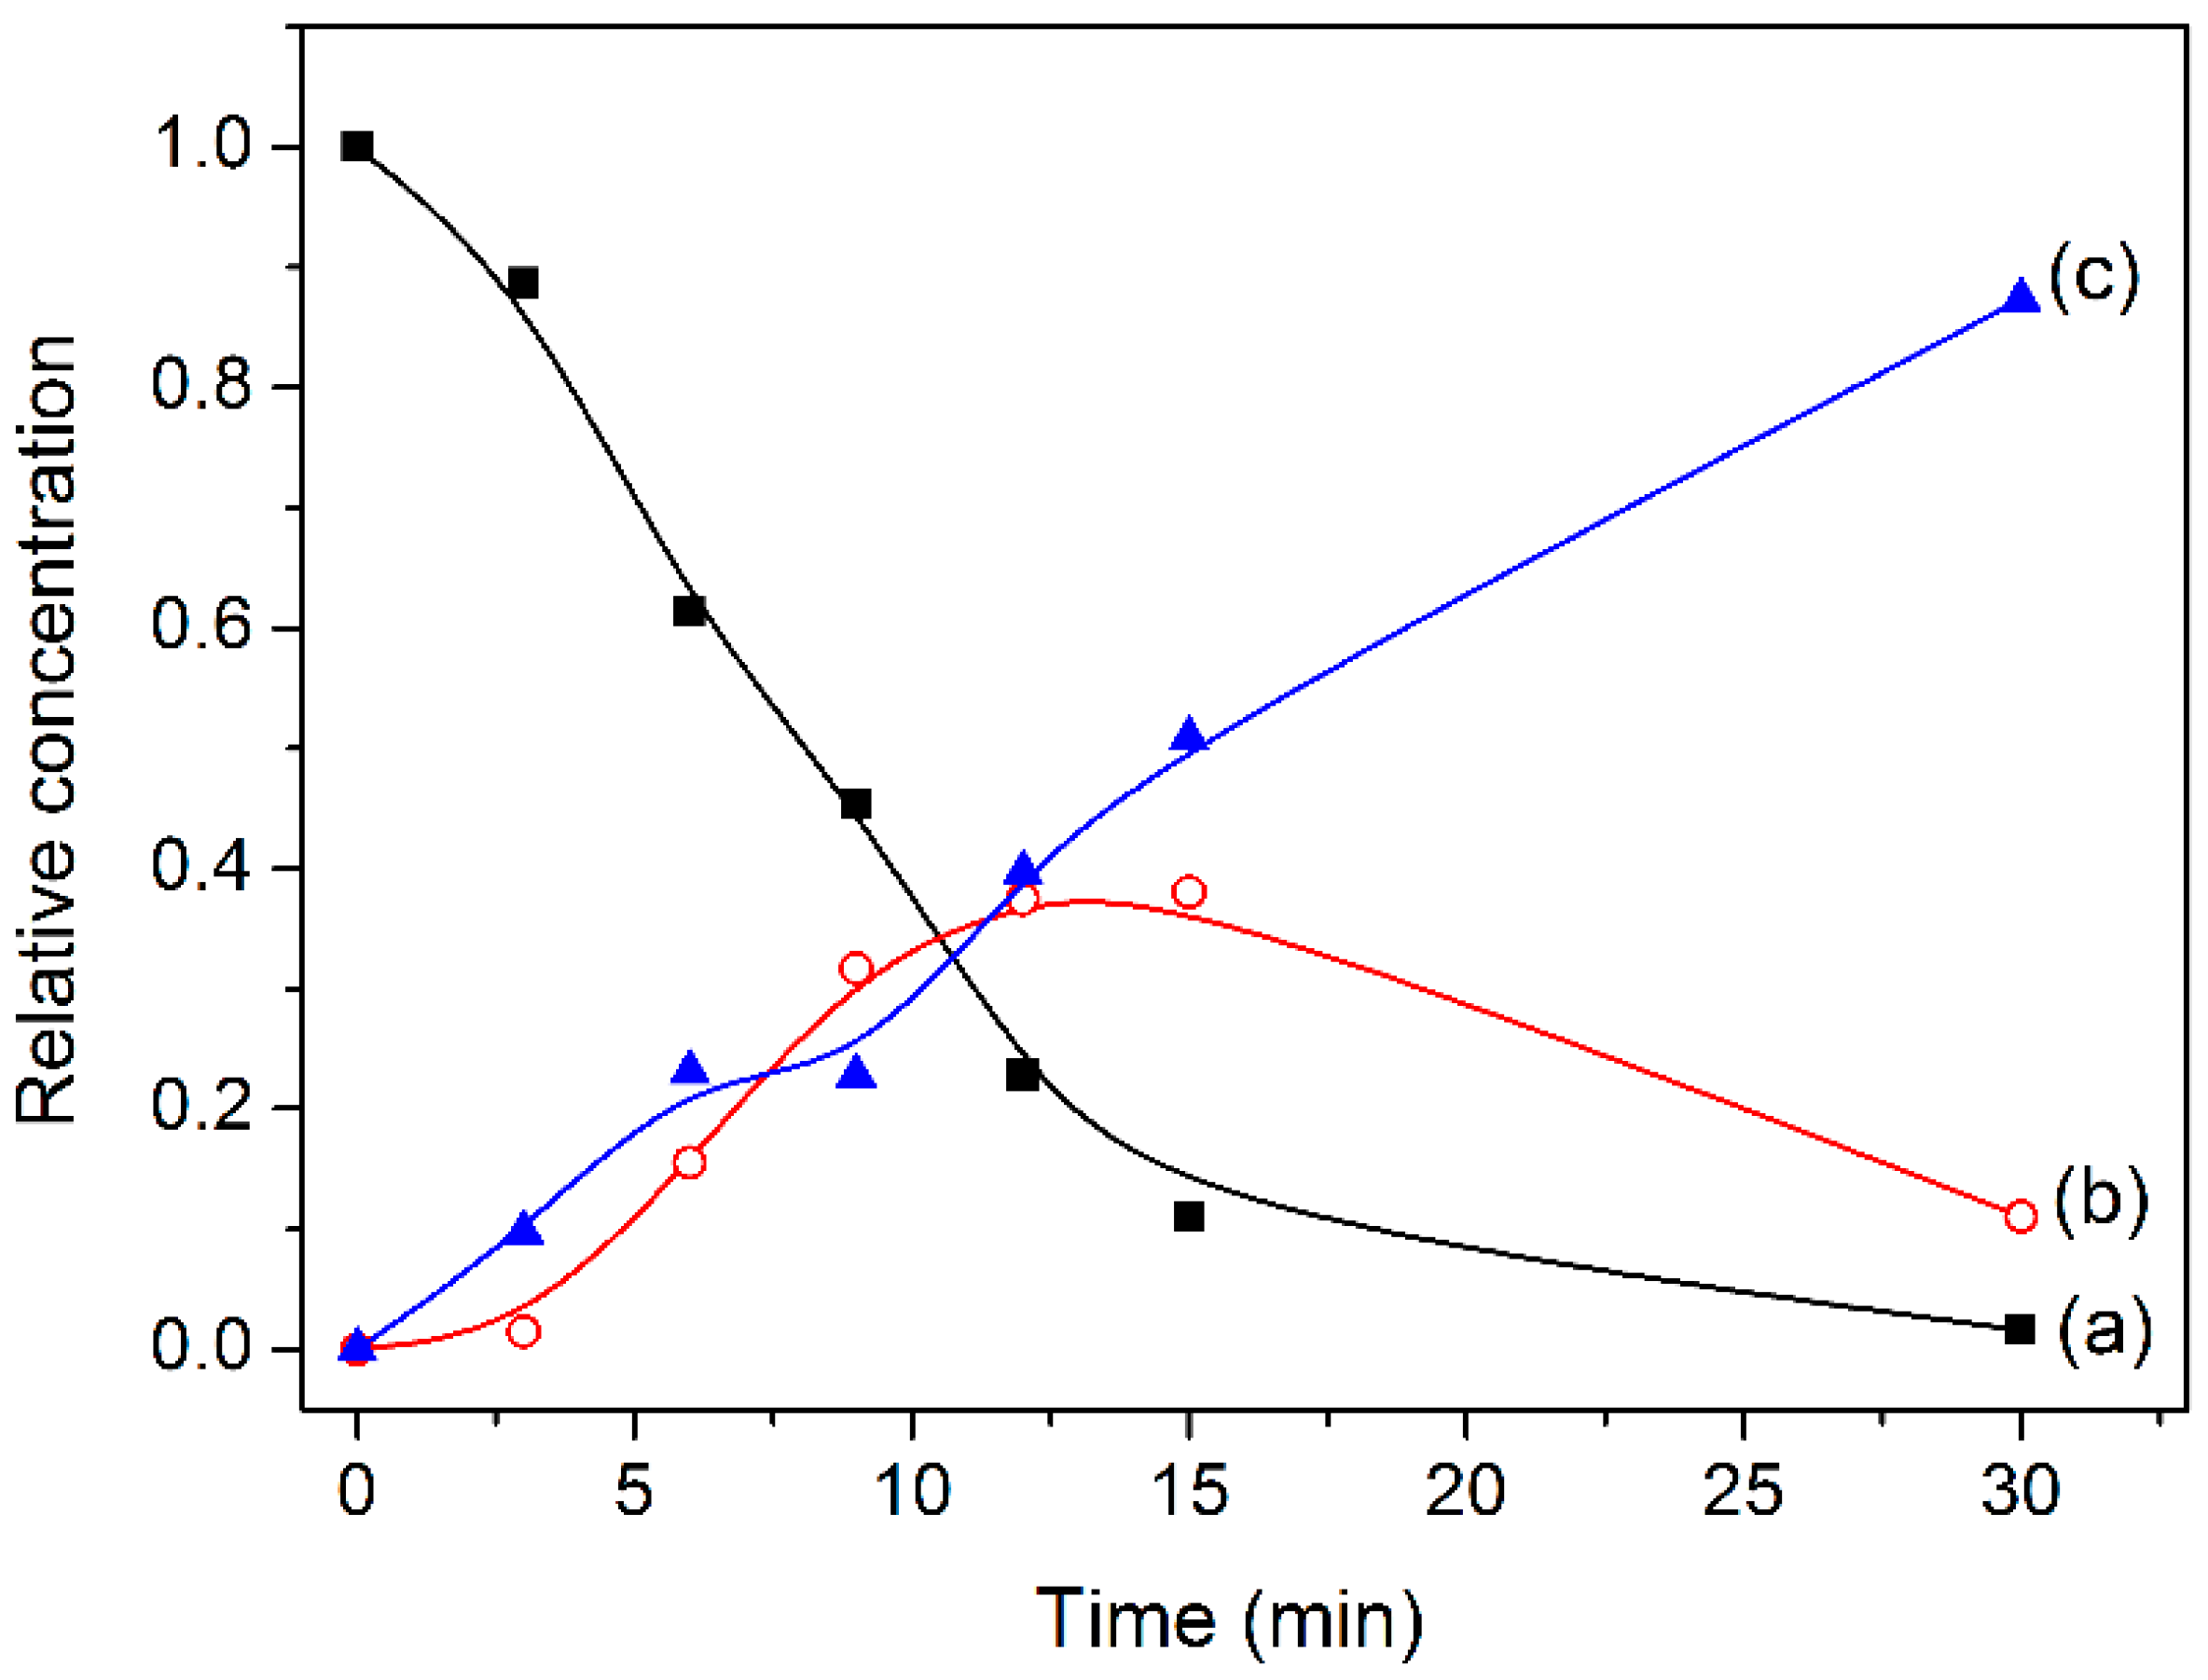
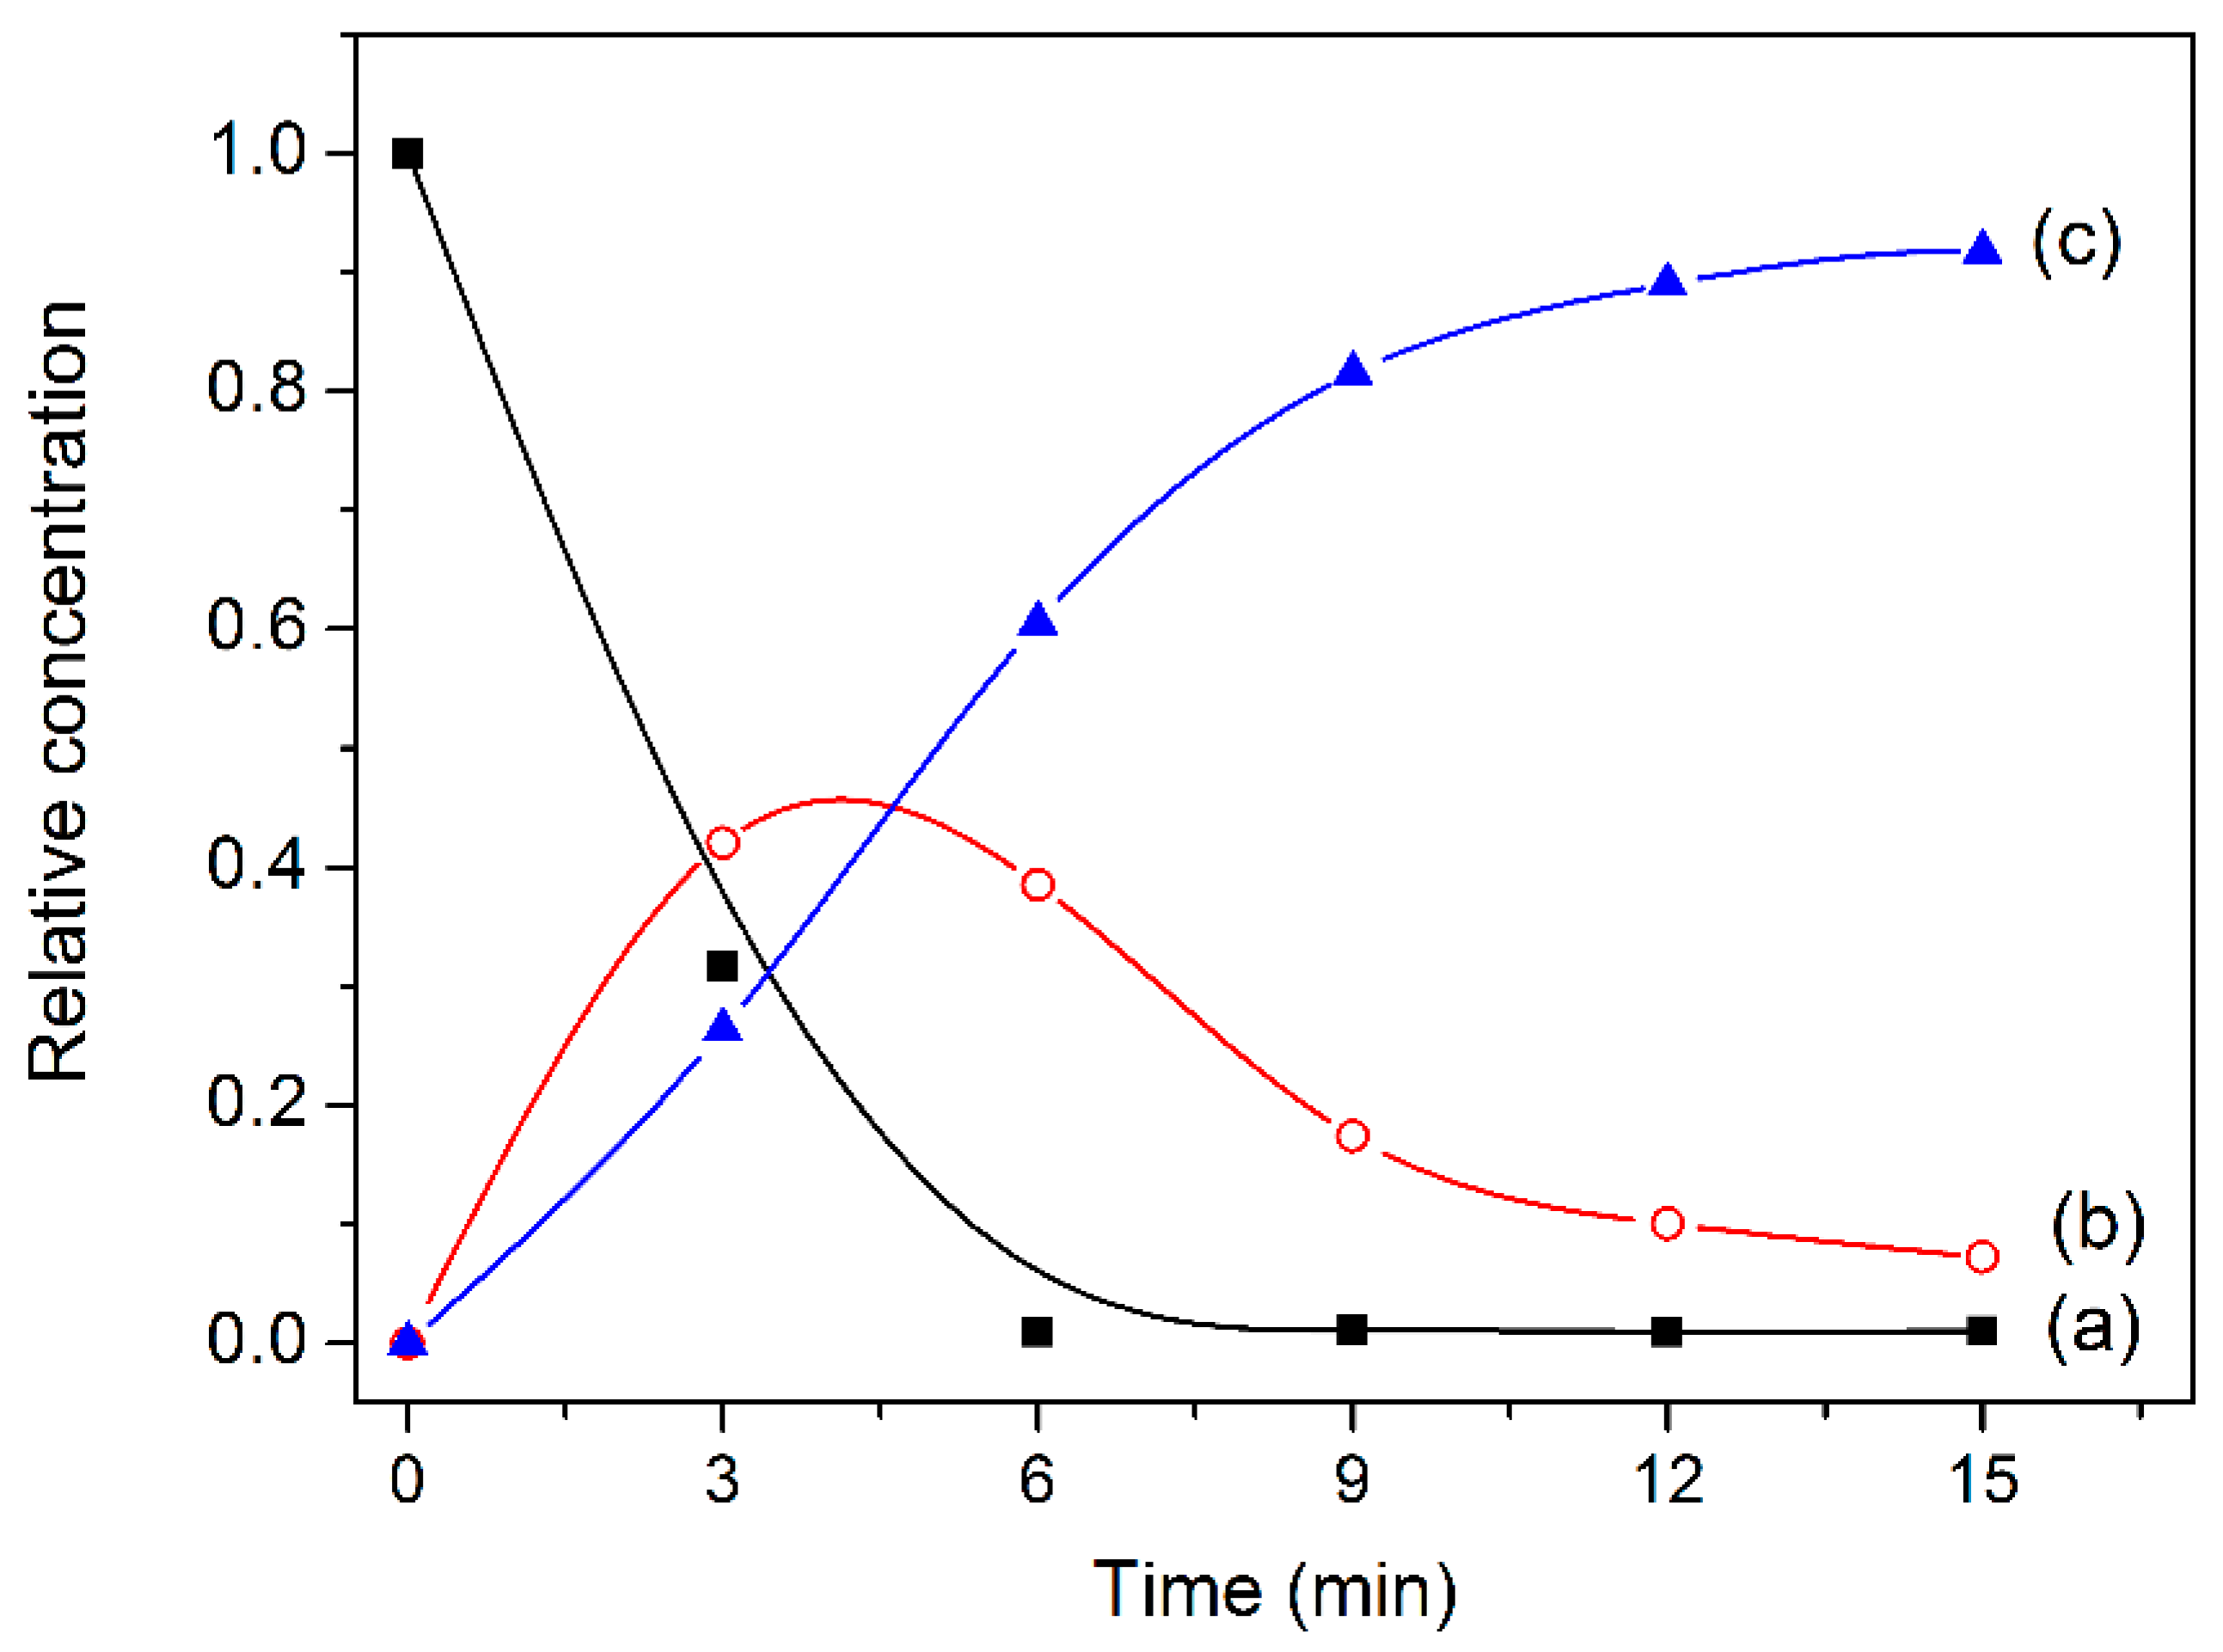
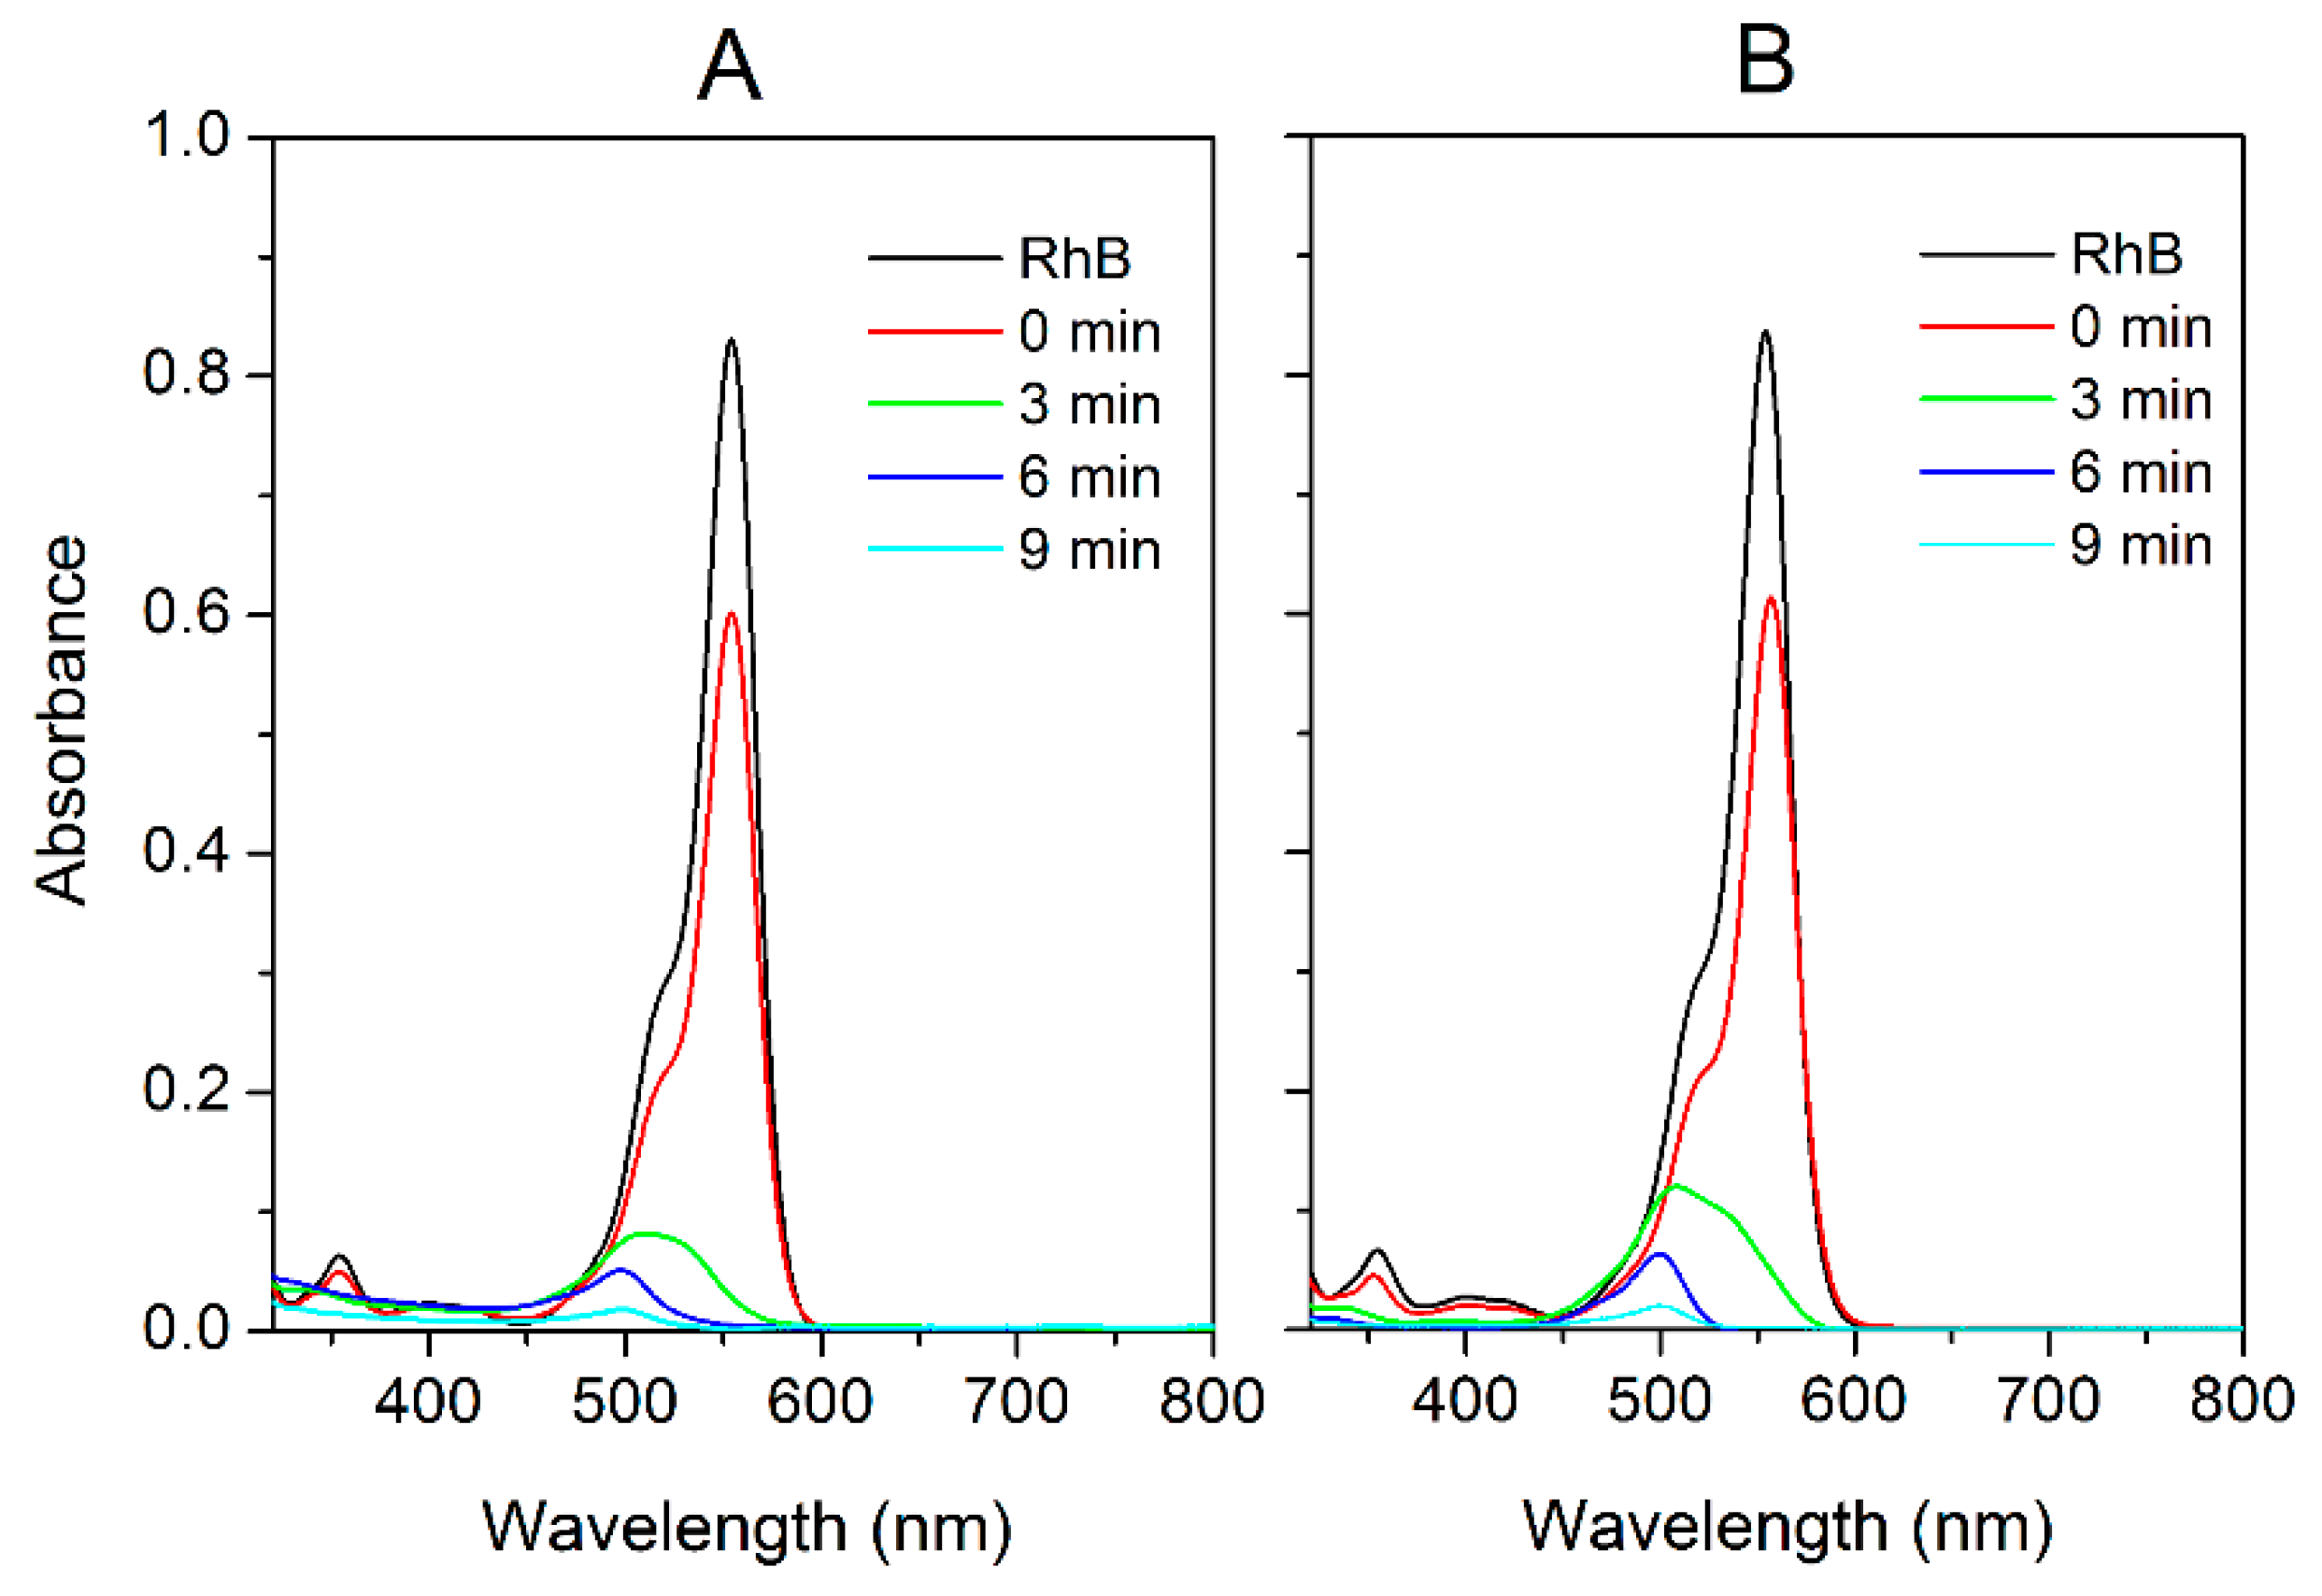
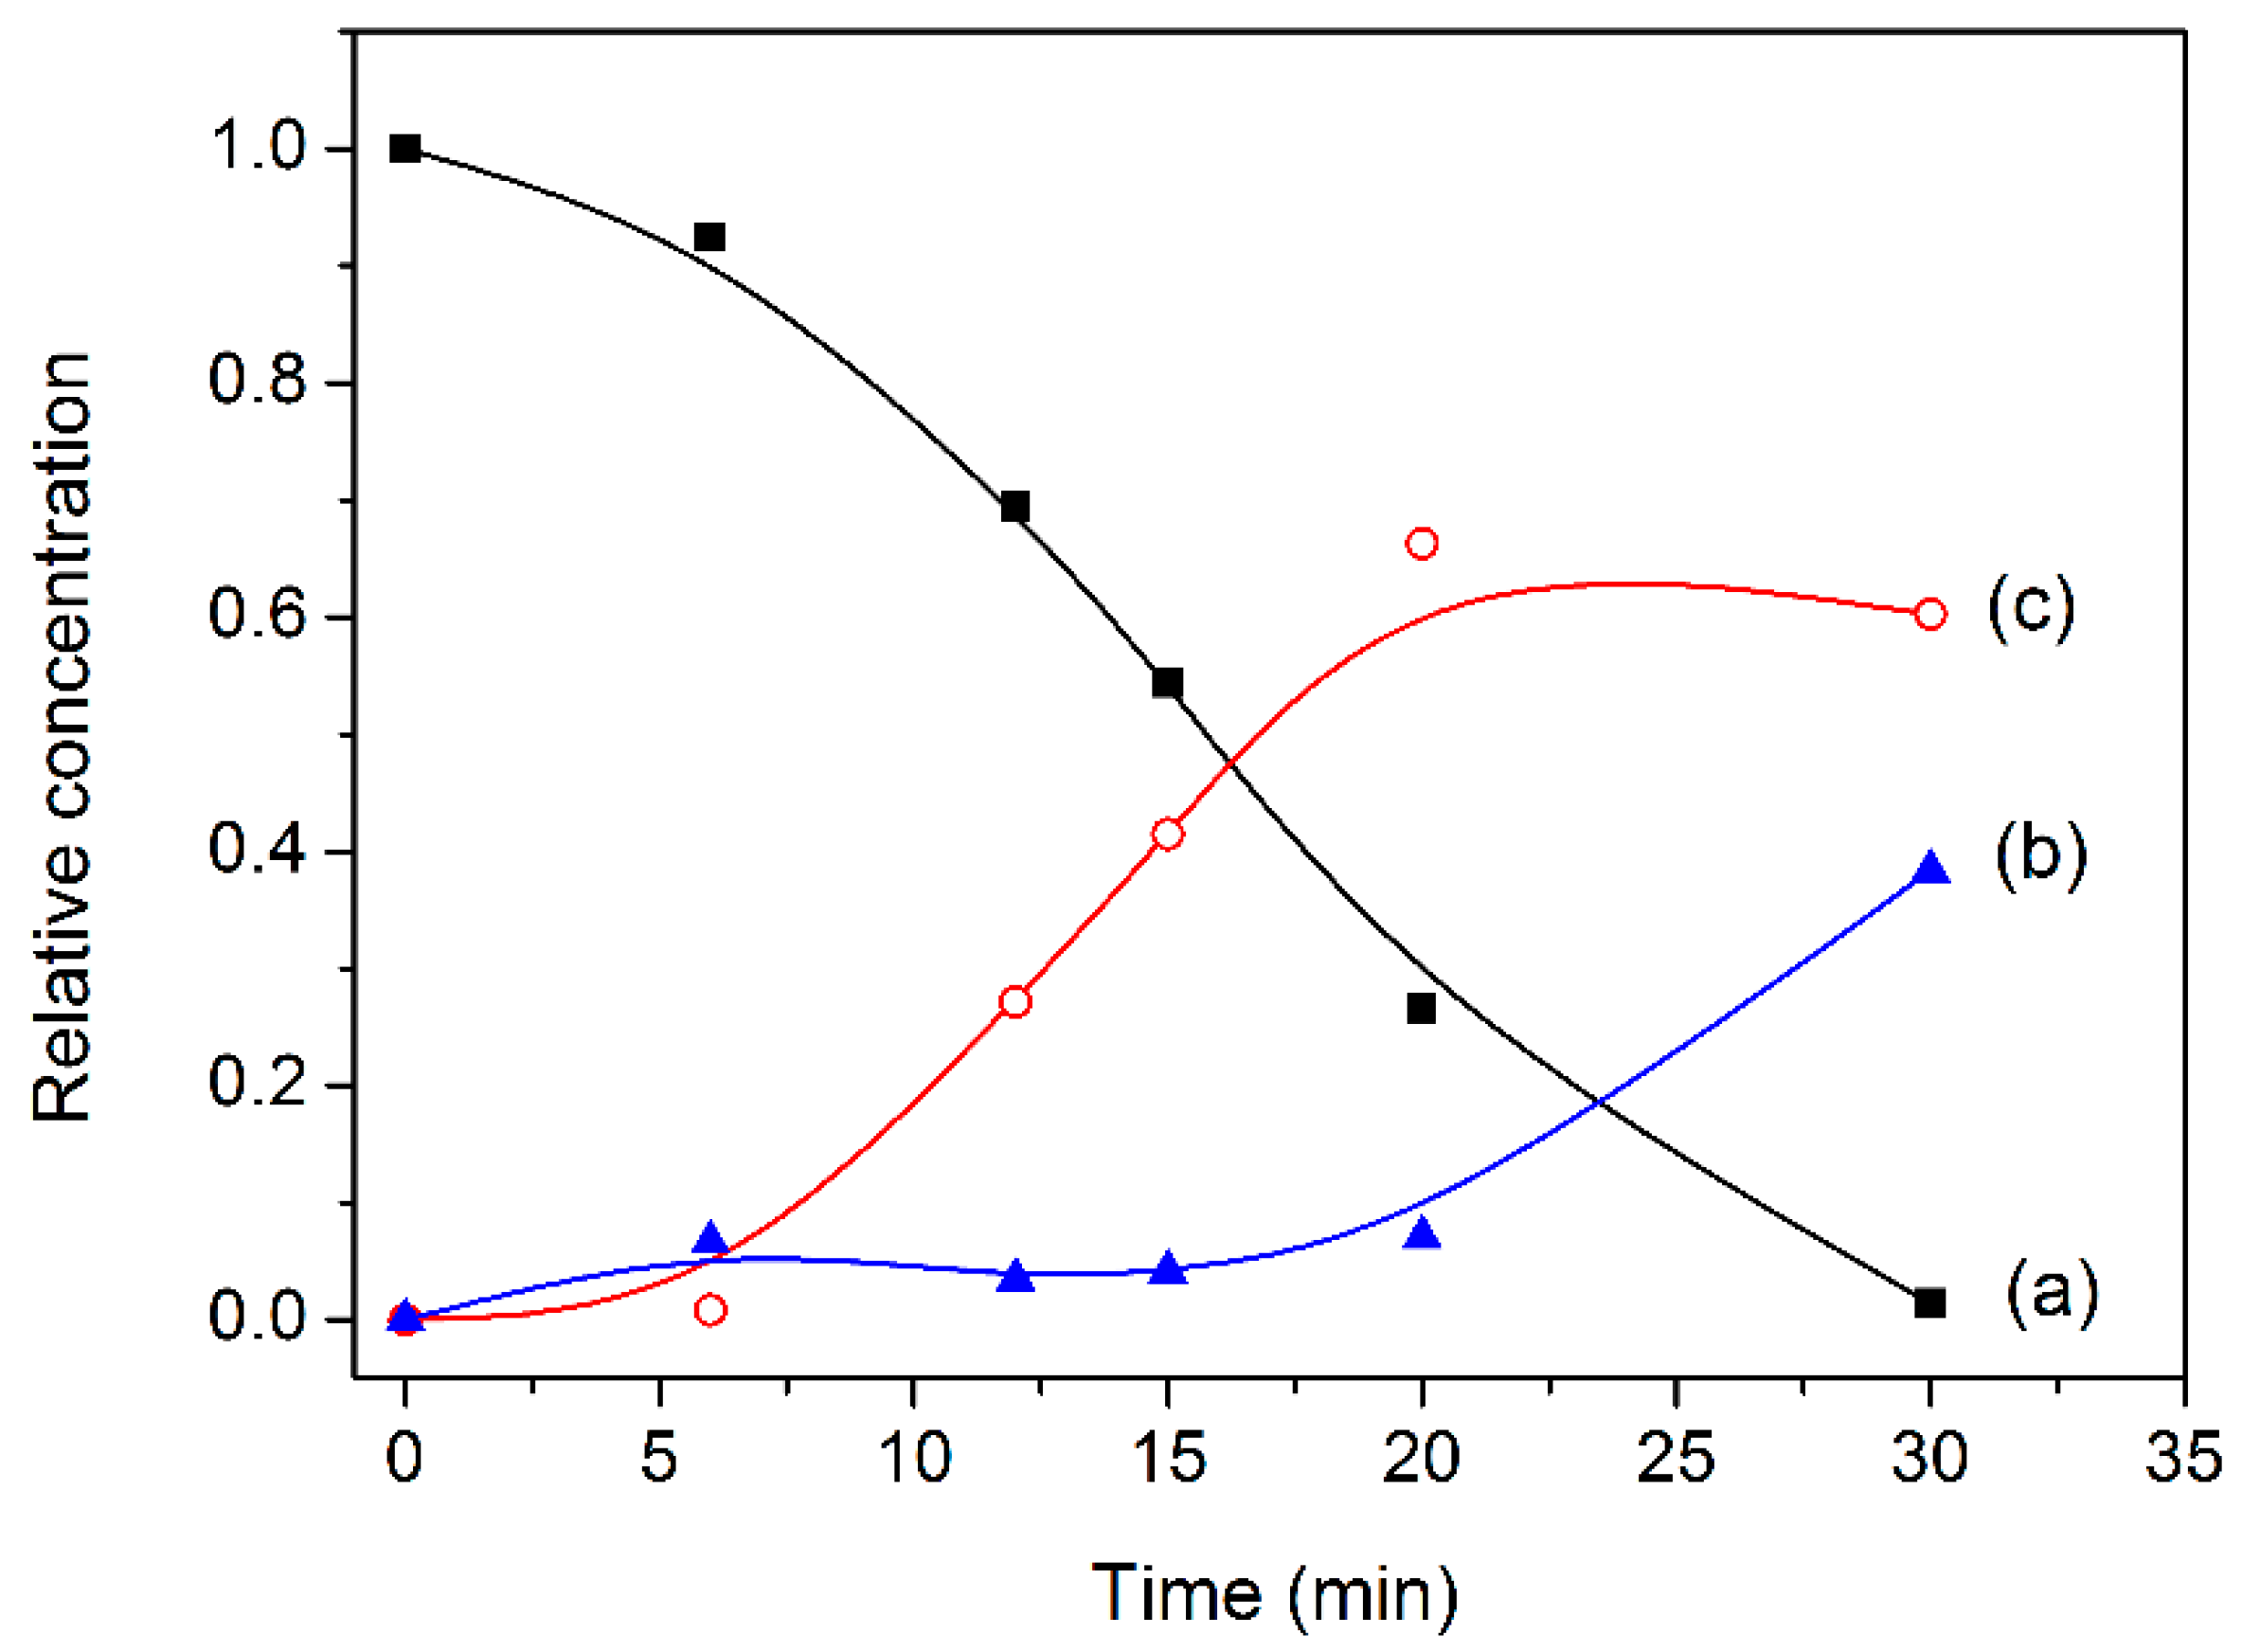
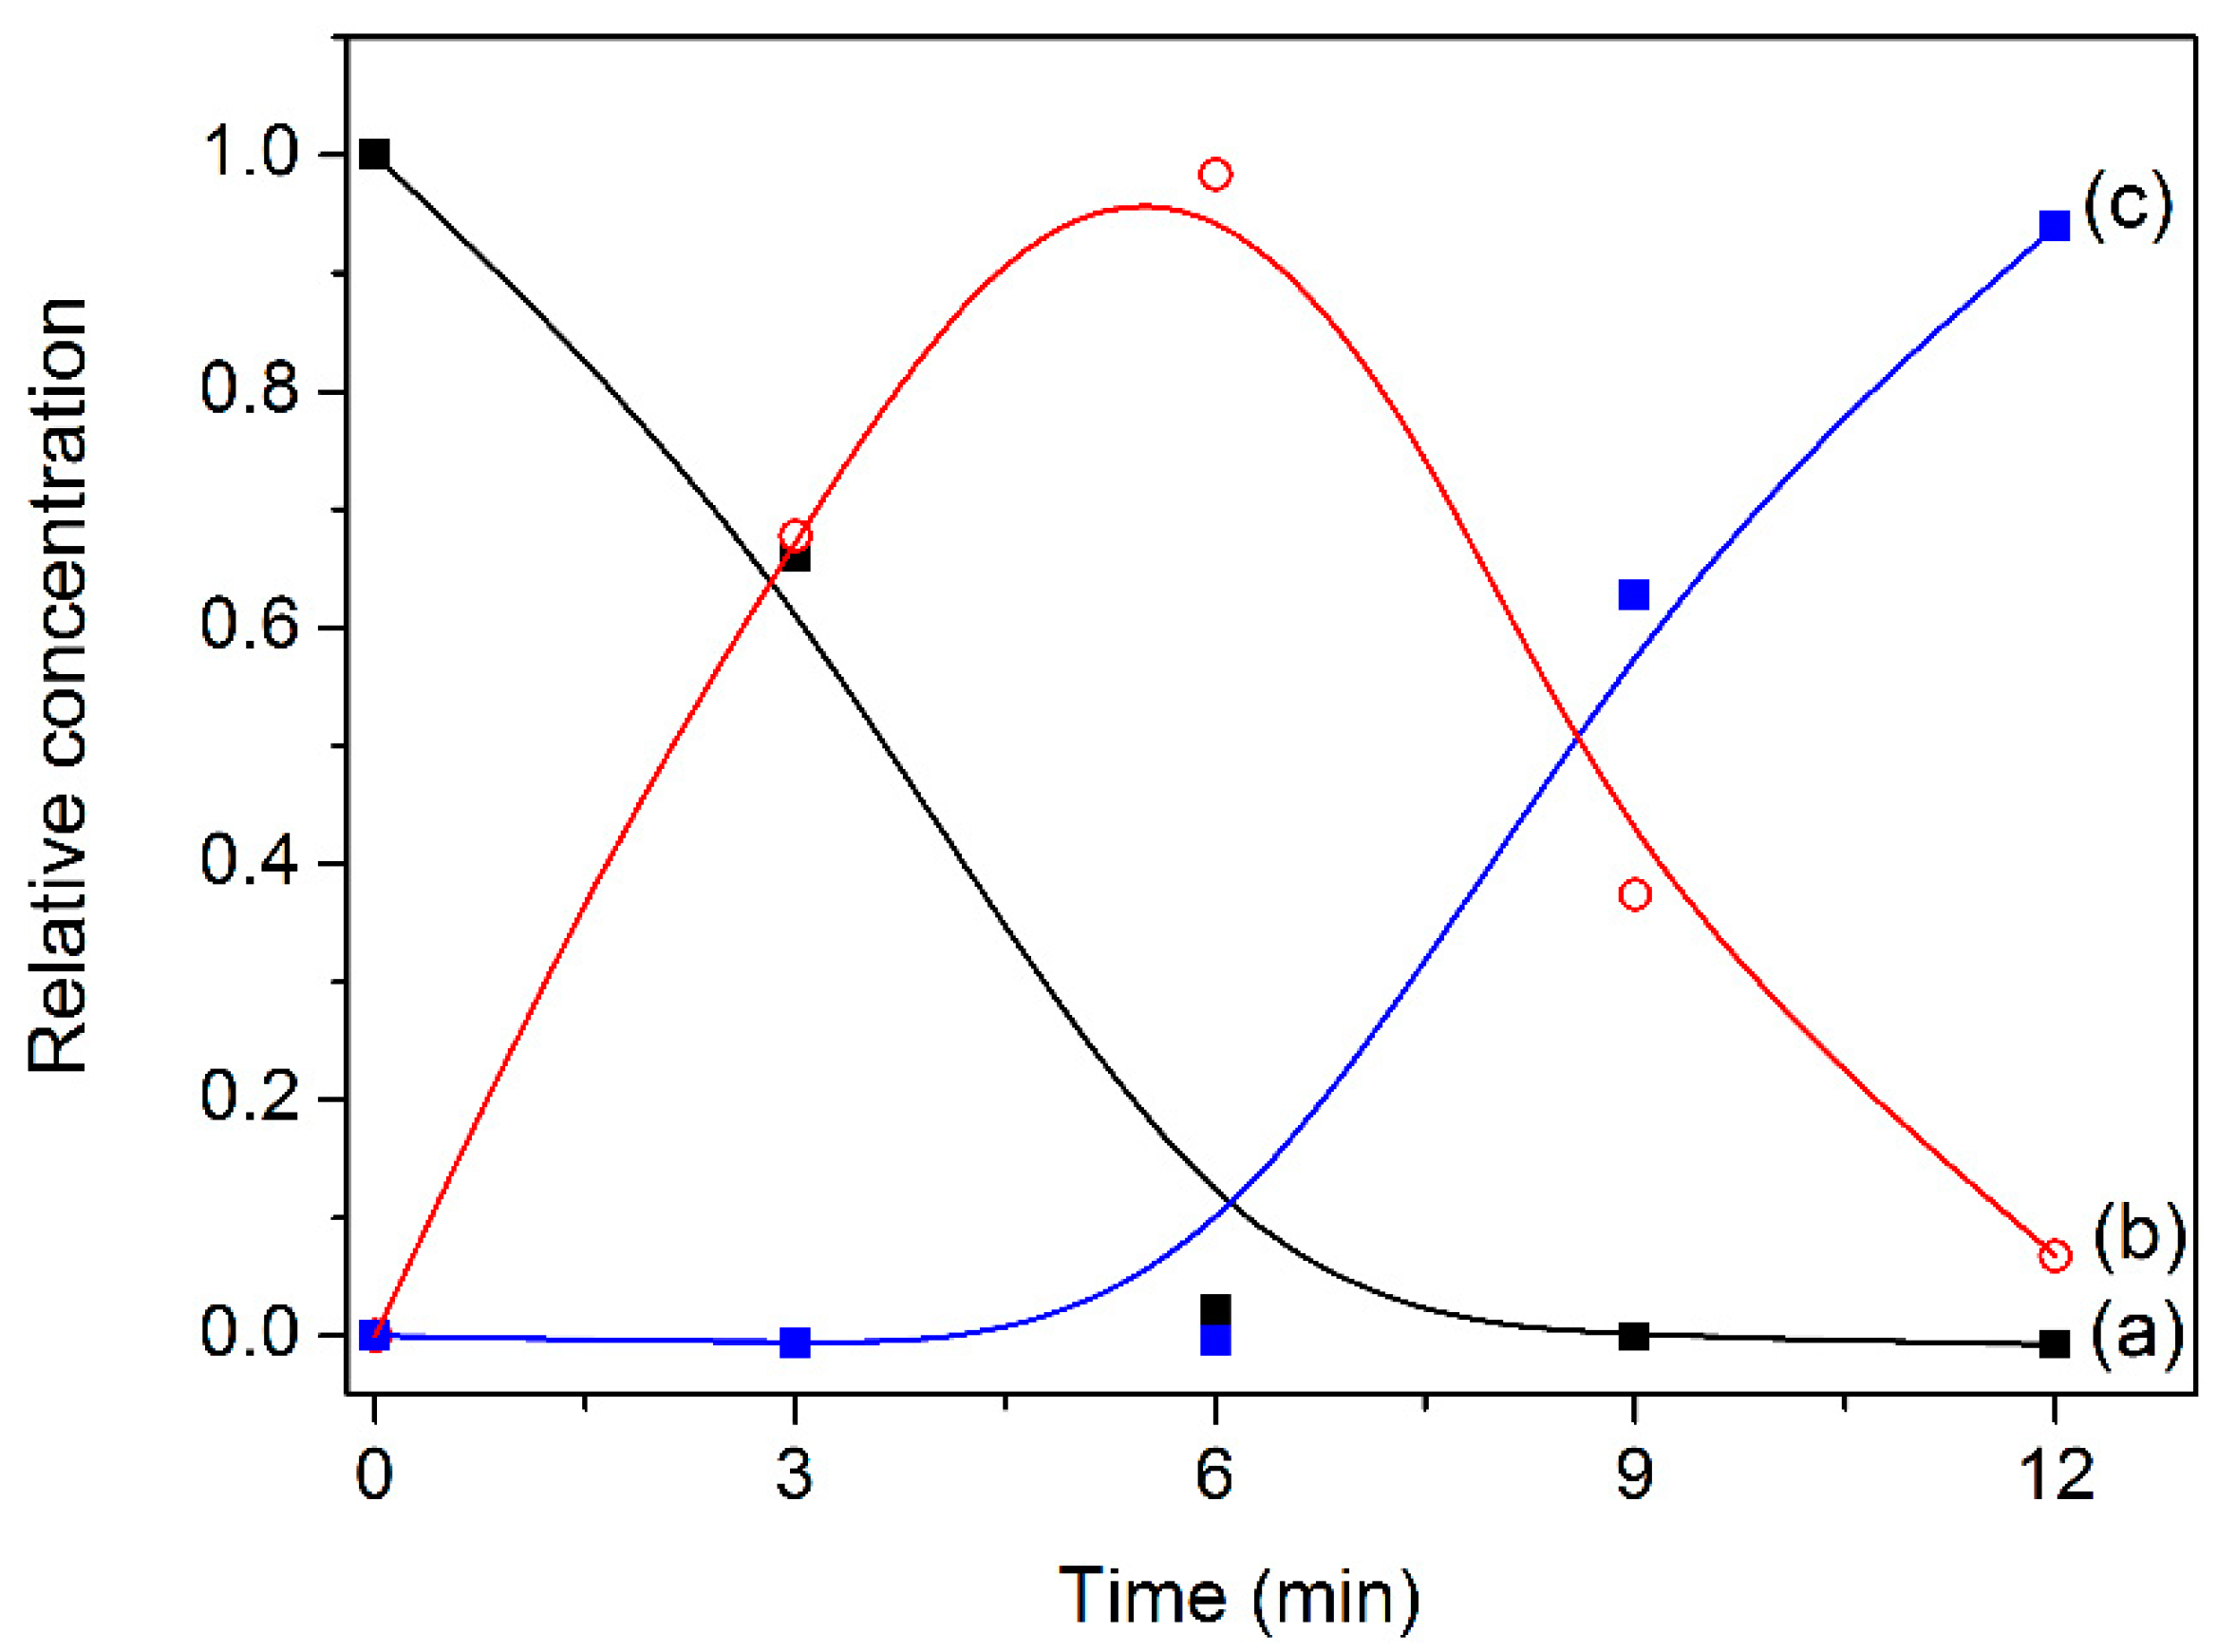
  • de-ethylation, which involves the dye molecules adsorbed on the catalyst surface and occurs in a stepwise manner, leading to the formation of several partially de-ethylated species and finally to the completely de-ethylated form, Rhodamine (Rh);
  • chromophore structure cleavage, mainly occurring in the solution bulk.
The physico-chemical properties of the photocatalyst affect the preference toward one or the other pathway by promoting “molecular selective modification or deeply extent photooxidation” [18]. On the basis of these considerations, it seemed of interest to investigate the catalytic properties of ZrP/AgBr composites in the photodegradation of RhB. The ZrP/AgBr system was prepared according to [8], then characterized by X-Ray diffraction (XRD), Diffusive Reflectance Spectroscopy (DRS) and Scanning Electron Microscopy (SEM) analyses. The photocatalytic behavior of both pure AgBr and ZrP/AgBr was evaluated, as well as the contribution of the above degradation pathways to the RhB disappearance. Comparisons with the performances of pure AgCl and of a similar ZrP/AgCl system were also reported.

2. Results and Discussion

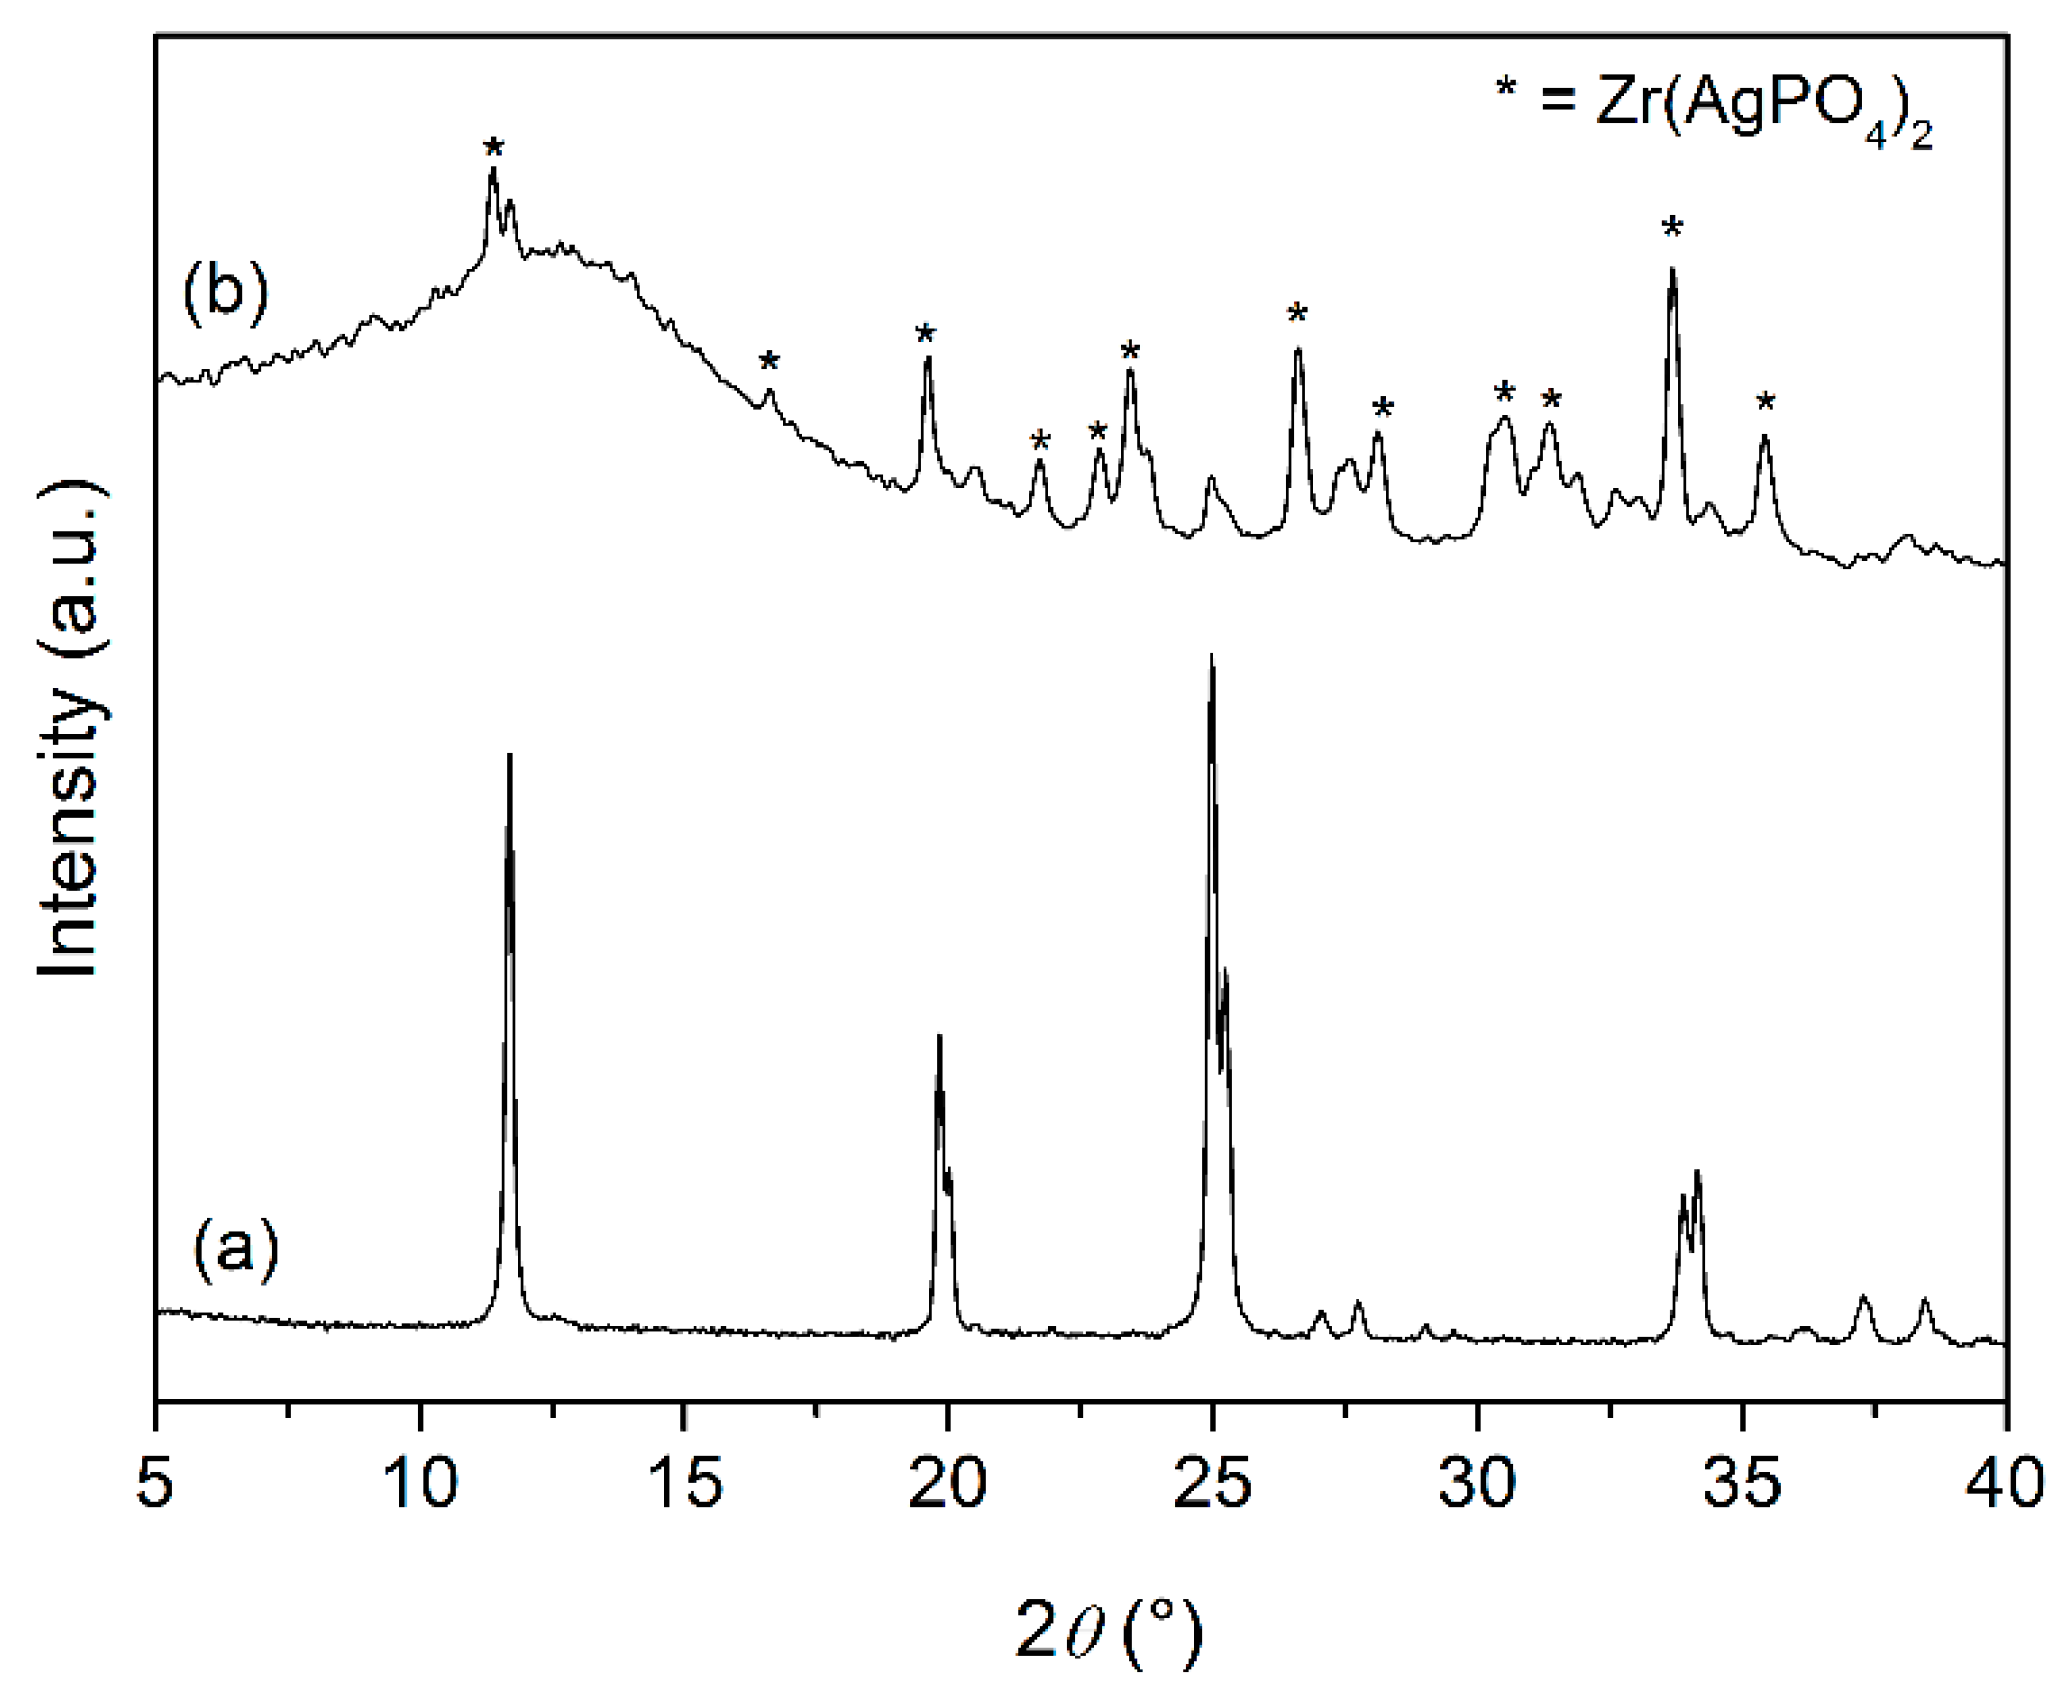
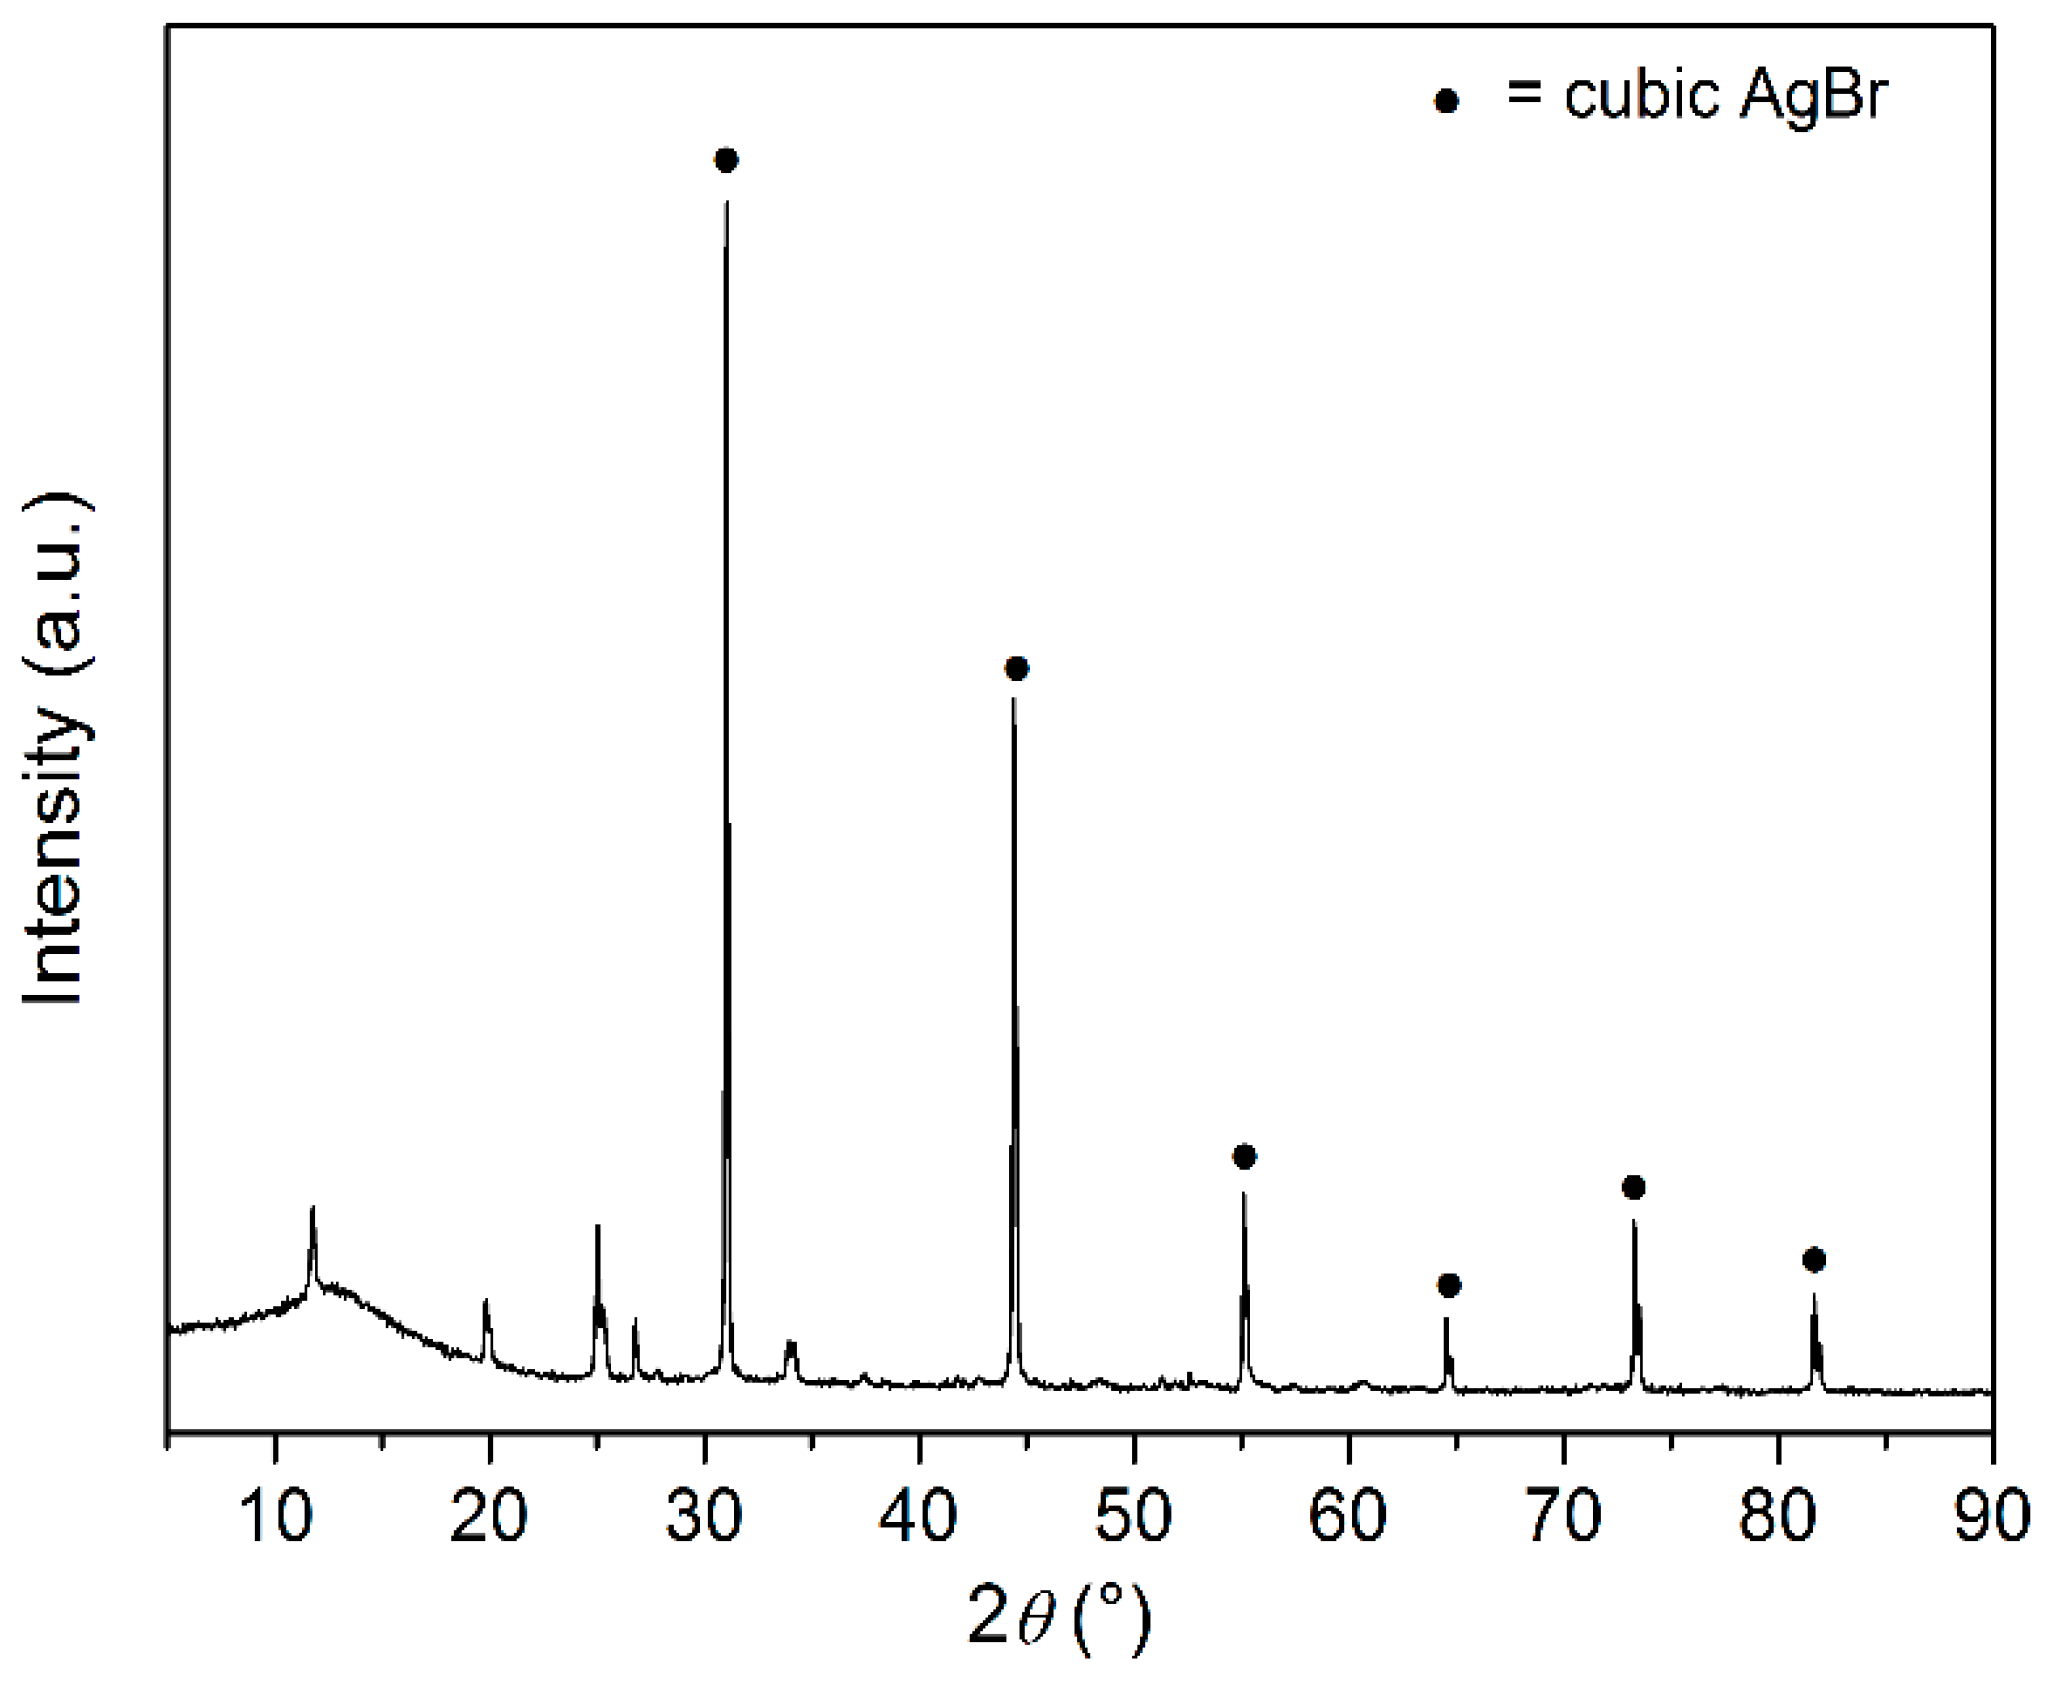
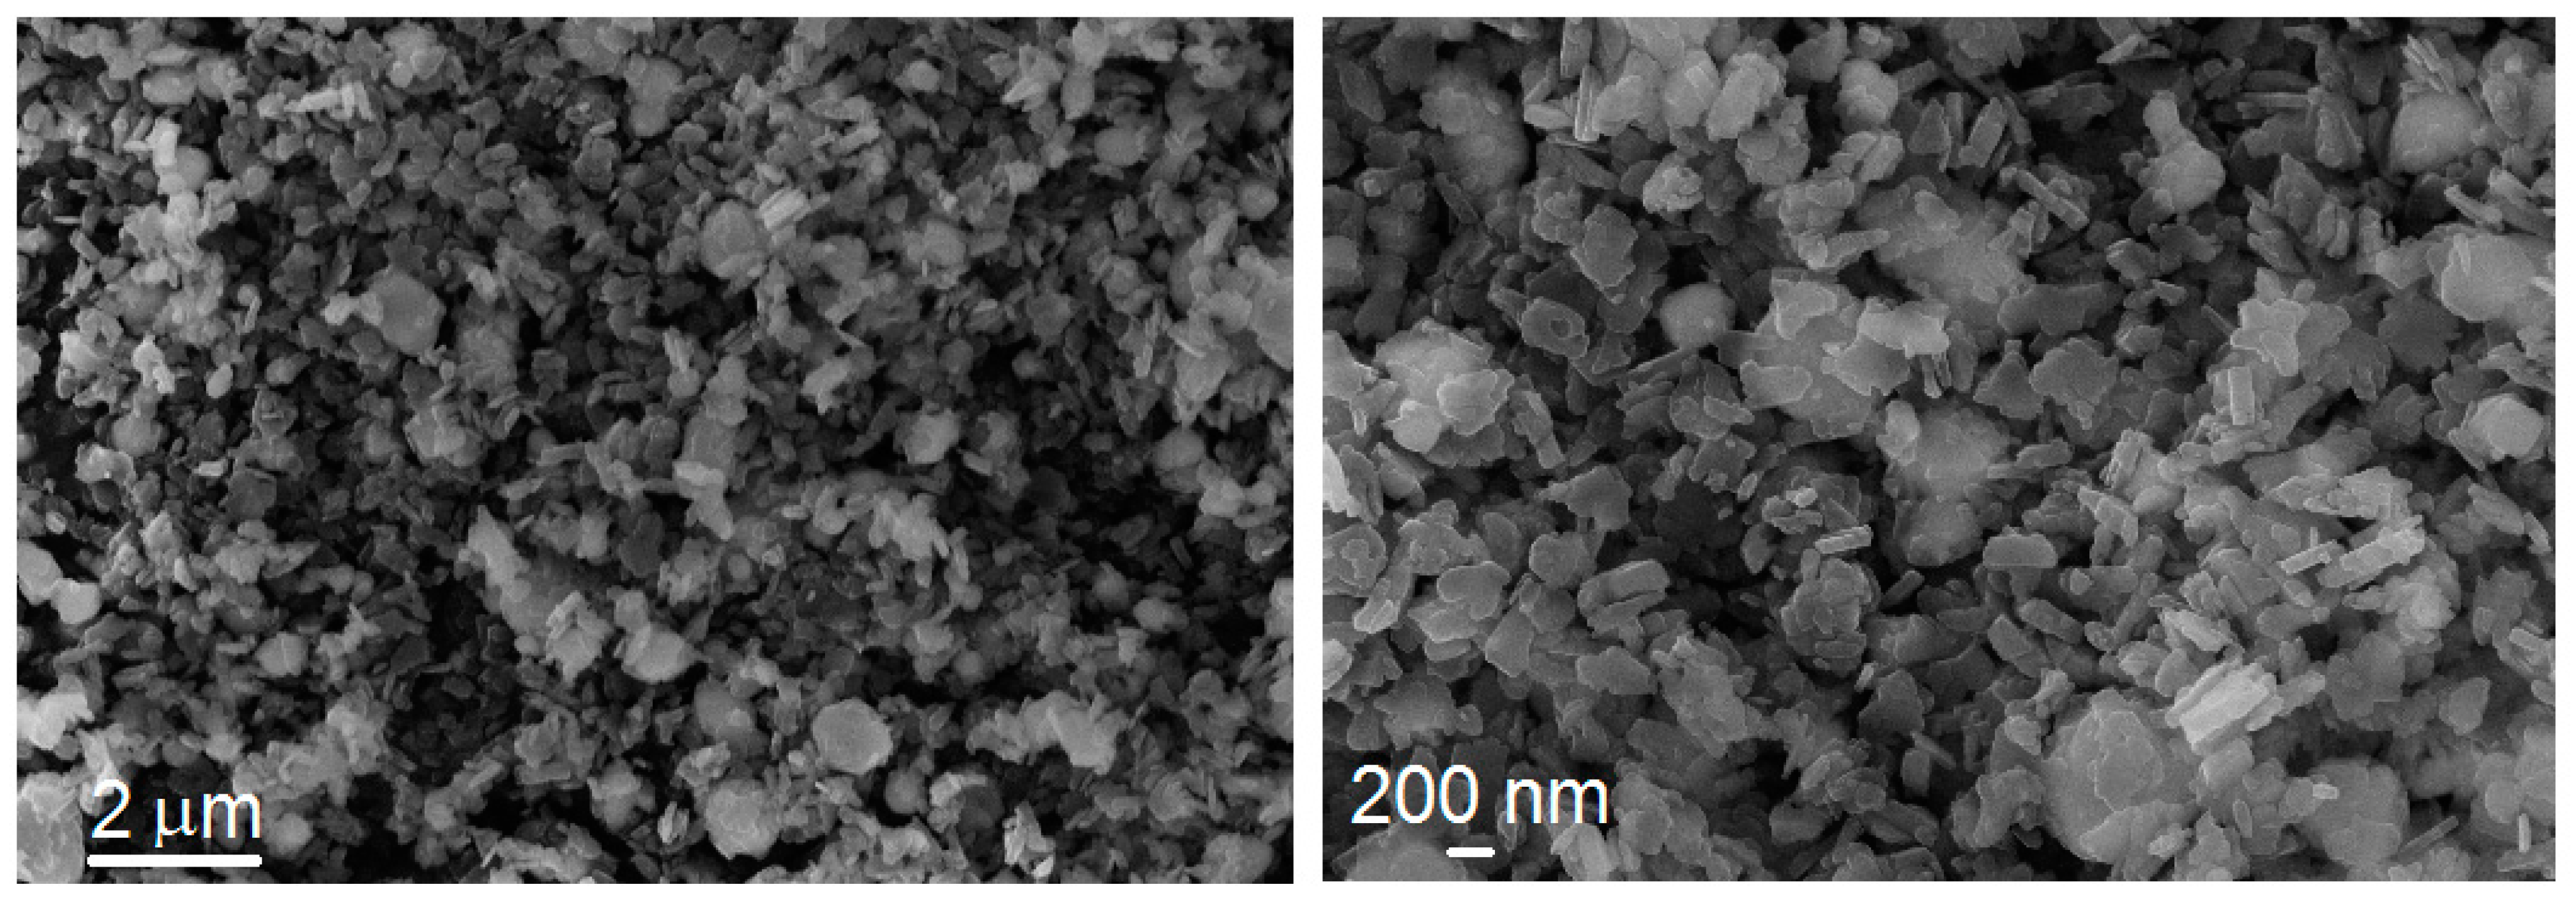
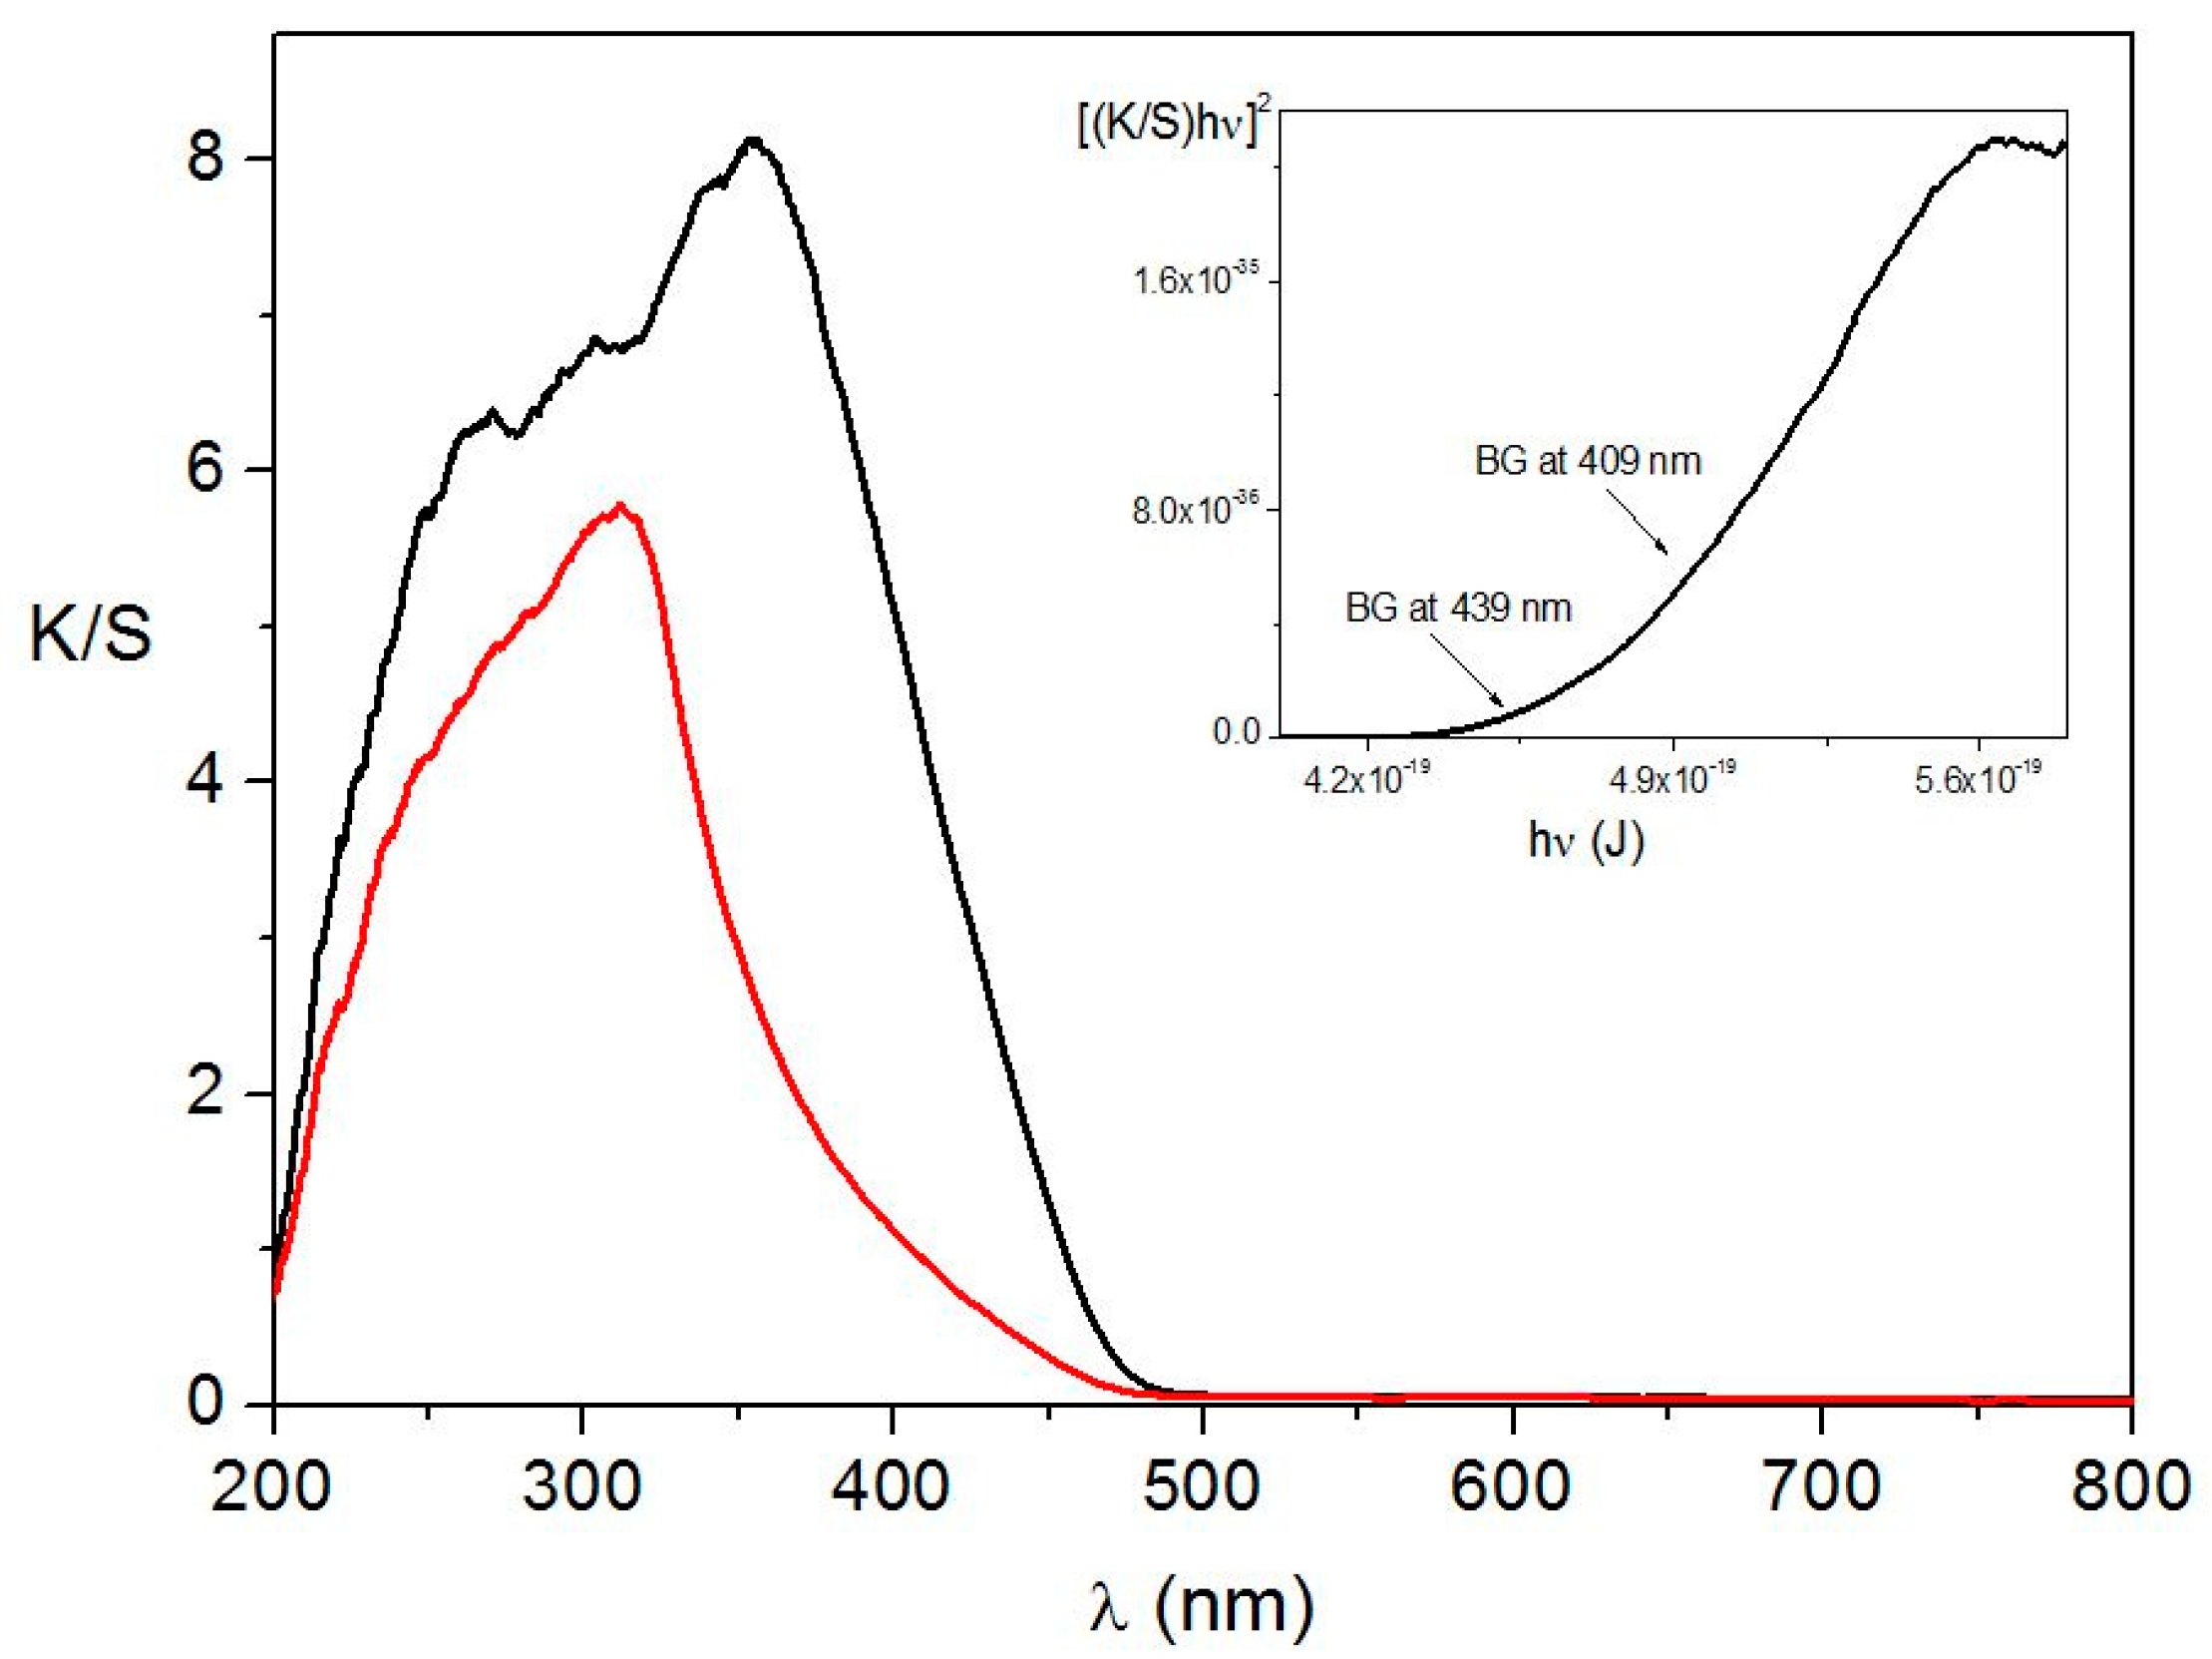
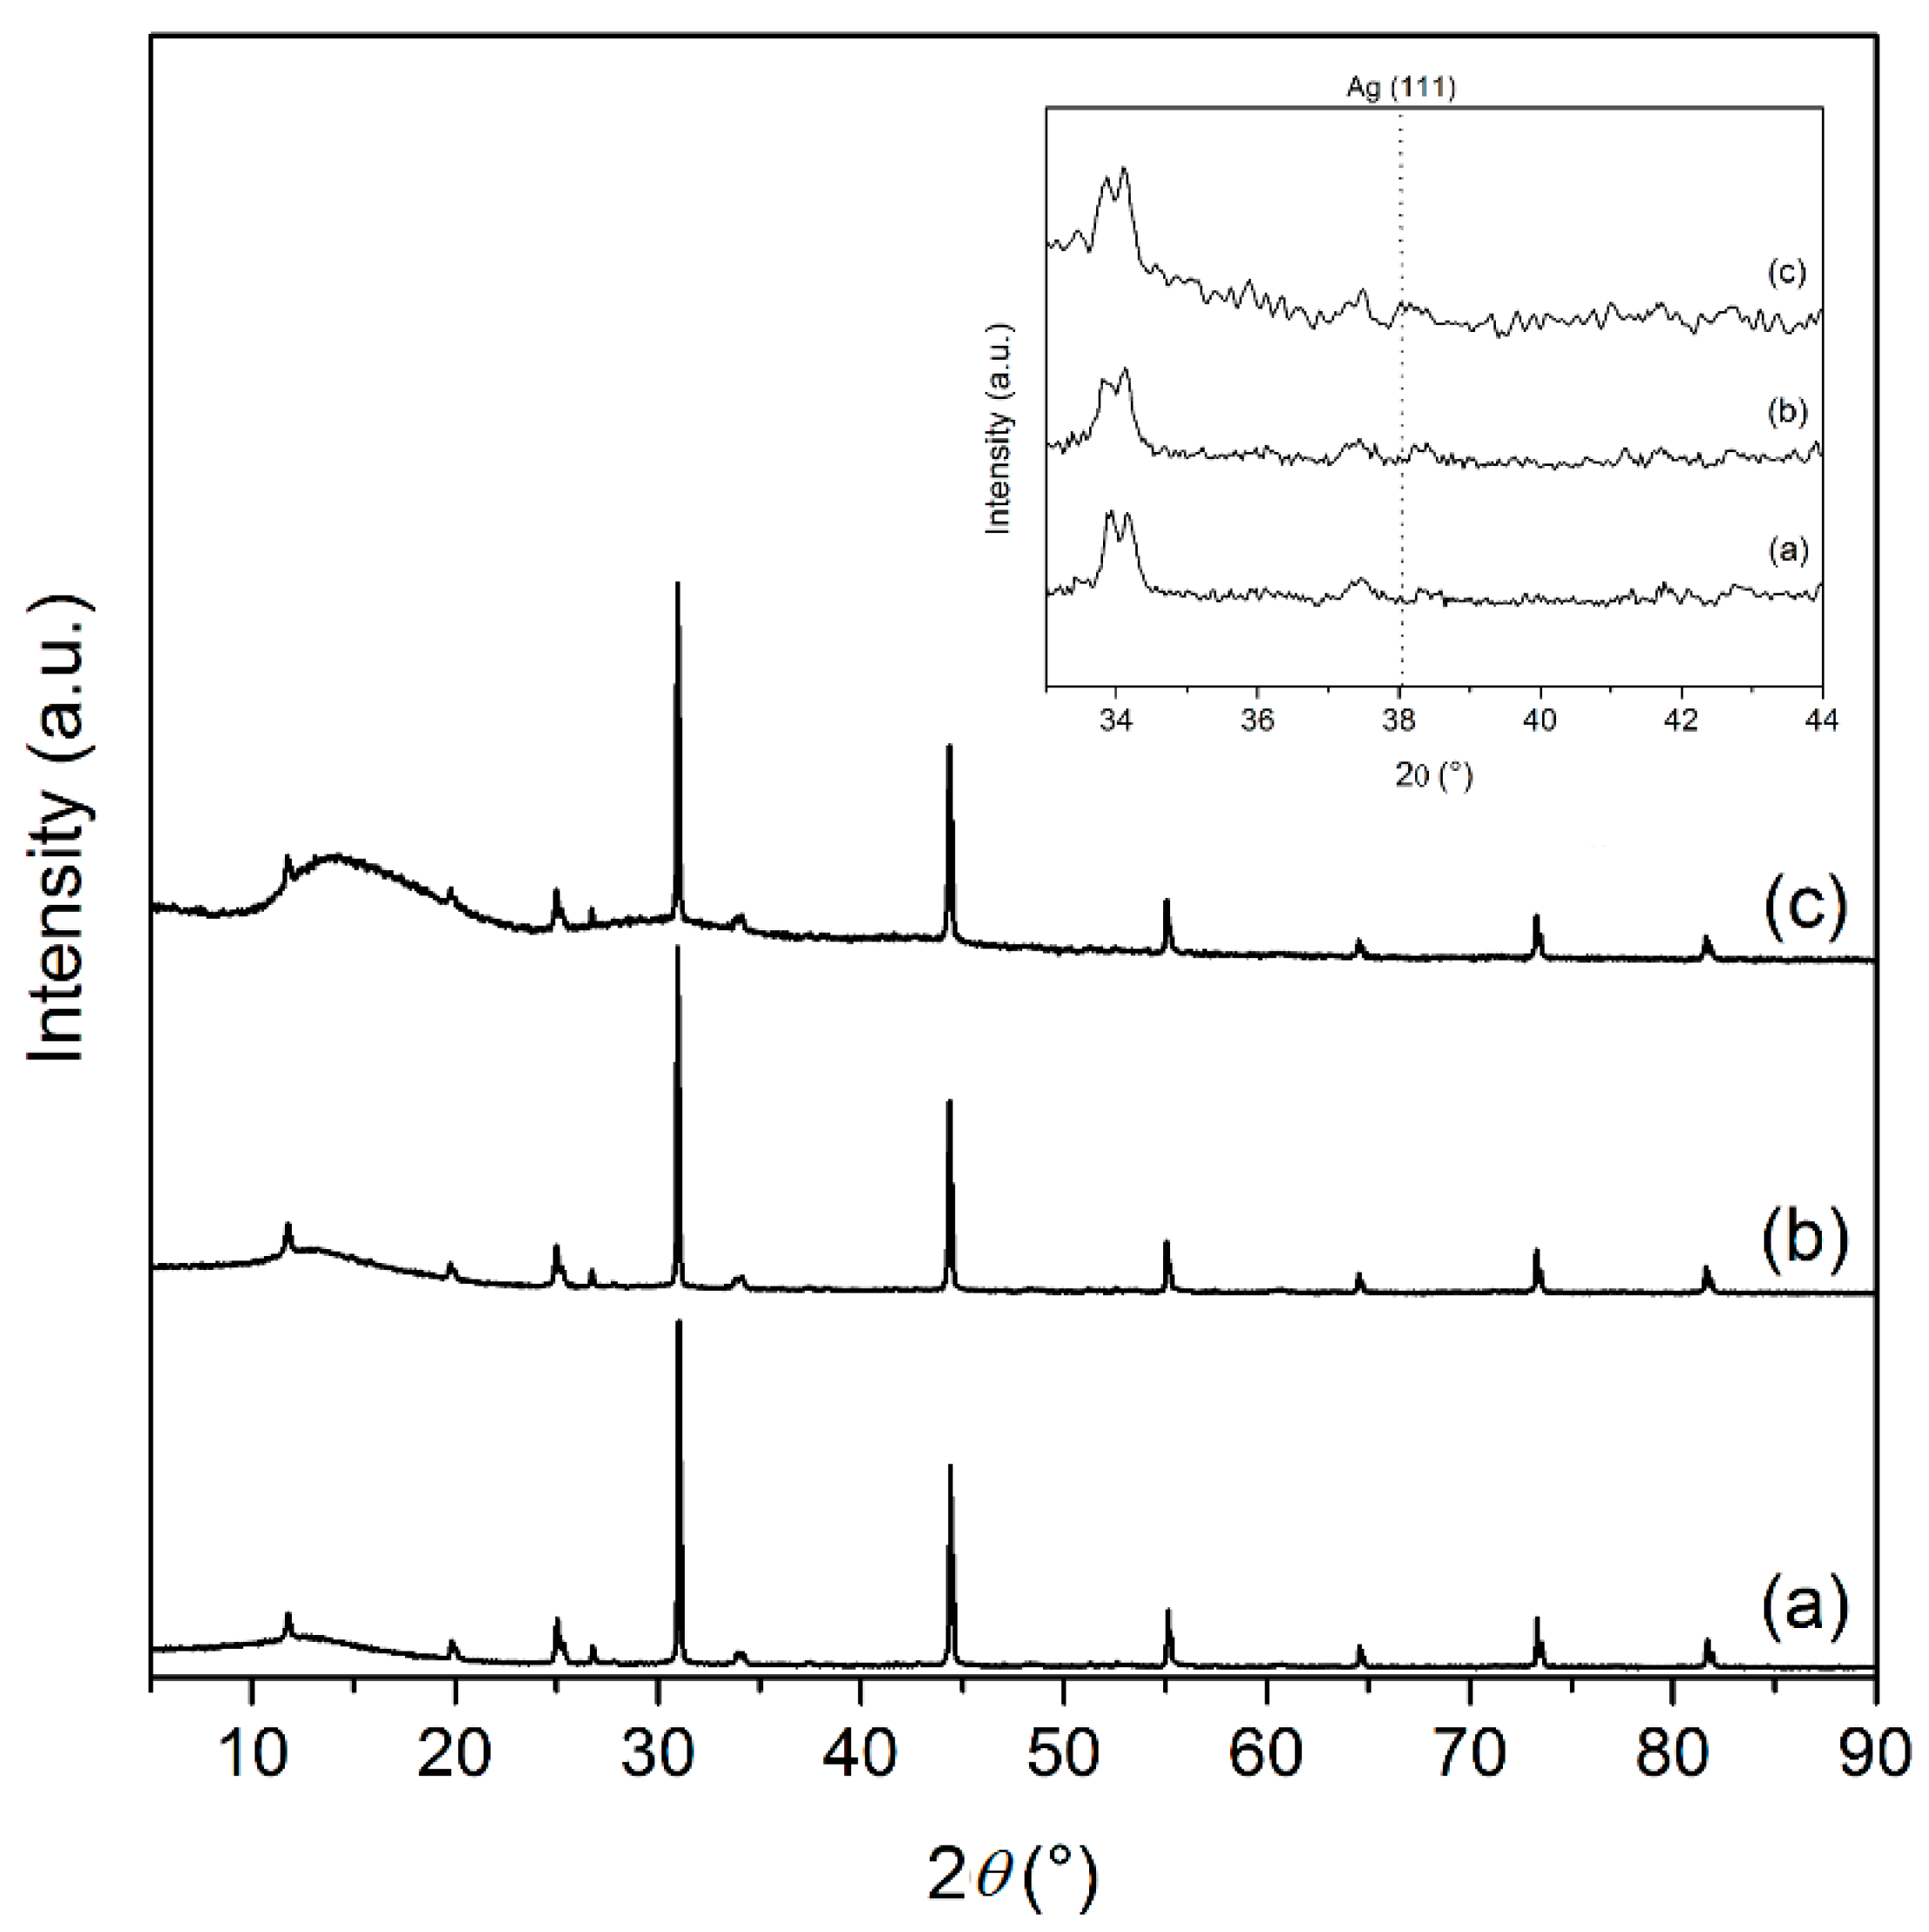
2.1. Preparation and Characterization of the Photocatalyst

Nanocrystalline silver exchanged ZrP was employed for the precipitation of AgBr particles. The choice of this material (instead of the corresponding microcrystalline one) was done on the basis of the results obtained by preliminary experiments, carried out by using microcrystalline silver exchanged ZrP for the synthesis of AgCl particles (unpublished results).
It was found that the morphology of the micro-ZrP/AgCl composites was completely different from that of nano-ZrP/AgCl.
As shown in Supplementary Figure S1, AgCl particles with an average particle size of about 350 nm decorated the surface of the ZrP microcrystals (Supplementary Figure S1A), while they are completely embedded in the nanocrystalline ZrP powder (Supplementary Figure S1B), making their identification difficult. The average size of the particles in Supplementary Figure S1B was around 230 nm.
These data suggested that microcrystalline ZrP is less effective in reducing AgX particle growth and aggregation.
Moreover, the fact that the AgCl particles are completely surrounded by ZrP nanoparticles, and not simply supported, should better prevent leaching and aggregation of the AgX particles during photocatalytic tests.
According to these preliminary findings, the ZrP/AgBr composite material, containing 53 wt% AgBr, has been prepared by the reaction of silver(I) exchanged ZrP (ZrPAg) with an excess of HBr solution, by using a procedure similar to that reported in [8].
Figure 1 shows the XRD patterns of ZrP (A) and the ZrPAg precursor (B). Figure 1A refers to nanocrystalline α-Zr(HPO4)2·H2O, with the typical reflection at 11.6° 2θ due to the (002) crystallographic planes, corresponding to an interlayer distance of 7.6 Å; the peaks at 19.77°, 24.96°, 33.81° 2θ are respectively assigned to the (002), (110), (112), (020) crystallographic planes.
From pattern comparison, the results show that the ZrPAg sample consists of two phases, Zr(AgPO4)2 and residual α-ZrP·H2O. After treatment with HBr, besides the reflections of α-ZrP⋅H2O, those of cubic AgBr appeared at 30.9°, 44.3°, 55.0°, 64.5°, 73.2°, 81.6° 2θ, corresponding to the (200), (220), (222), (400), (420) and (422) crystallographic planes, respectively (Joint Committee on Powder Diffraction Standards, JCPDS, No. 79-0149) (Figure 2).
We evaluated the crystalline domain size of AgBr, from the full width at half maximum, by using the Scherrer equation:
L = K λ β cos θ
where λ is the X-ray wavelength in nanometers (nm), β is the peak width of the diffraction peak profile at half maximum height (corrected for the instrumental broadening) and K is a constant related to crystallite shape, taken as 0.9 for cubic unit cells.
From this calculation, we obtained an average value for the AgBr crystalline domain size of about 280 nm. This value is similar to that obtained for AgCl particles in ZrP/AgCl composites [8].
The particle morphology of the pure AgBr and ZrP/AgBr samples was studied by scanning electron microscopy (SEM). Figure 3 shows a representative SEM image of the pure AgBr sample, consisting of micrometric particles and aggregates, with size ranging from 0.5 μm to about 3 μm.
The morphology of the ZrP/AgBr composite (Figure 4) is completely different and more closely resembles pure ZrP, consisting of nanometric particles with an almost uniform size, than that of pure AgBr. Indeed, it is not easy to identify the AgBr particles, although its mass fraction is comparable with that of ZrP. One could conclude that AgBr and ZrP have similar particle size, of the order of hundreds of nanometers, in agreement with the estimation obtained by the Scherrer equation. This finding proves that in the presence of ZrP, the AgBr particle growth and aggregation is limited to some extent.
Further evidence of the different size of the AgBr particles in the pure sample and in the composite came from the absorption spectra of the two materials, which are shown in Kubelka–Munk units in Figure 5. Both materials begin to absorb at wavelengths shorter than 485 nm. AgBr (black trace) absorbs more strongly than ZrP/AgBr (red trace). In fact, AgBr appears as a more saturated yellow powder than the pale yellow of ZrP/AgBr. According to the procedure explained previously, the analysis of the absorption spectrum of AgBr reveals the presence of at least two direct band gaps: one at 439 nm (2.83 eV) and the other at 409 nm (3.04 eV). The presence of more than one band gap confirms that our AgBr consists of a dimensional distribution of its particles. ZrP/AgBr is also a material with multiple band gaps. It shows at least two band gaps: one at 398 nm (3.12 eV) and the other at 352 nm (3.53 eV). The latter corresponds to the band gap of the host ZrP matrix (see [8] for the absorption spectrum of ZrP); the former is due to the AgBr particles. Since the greater the band gap, the smaller the particle dimensions, [19], these results confirm that in our ZrP/AgBr composite, the AgBr particles are smaller than those in our pure AgBr.

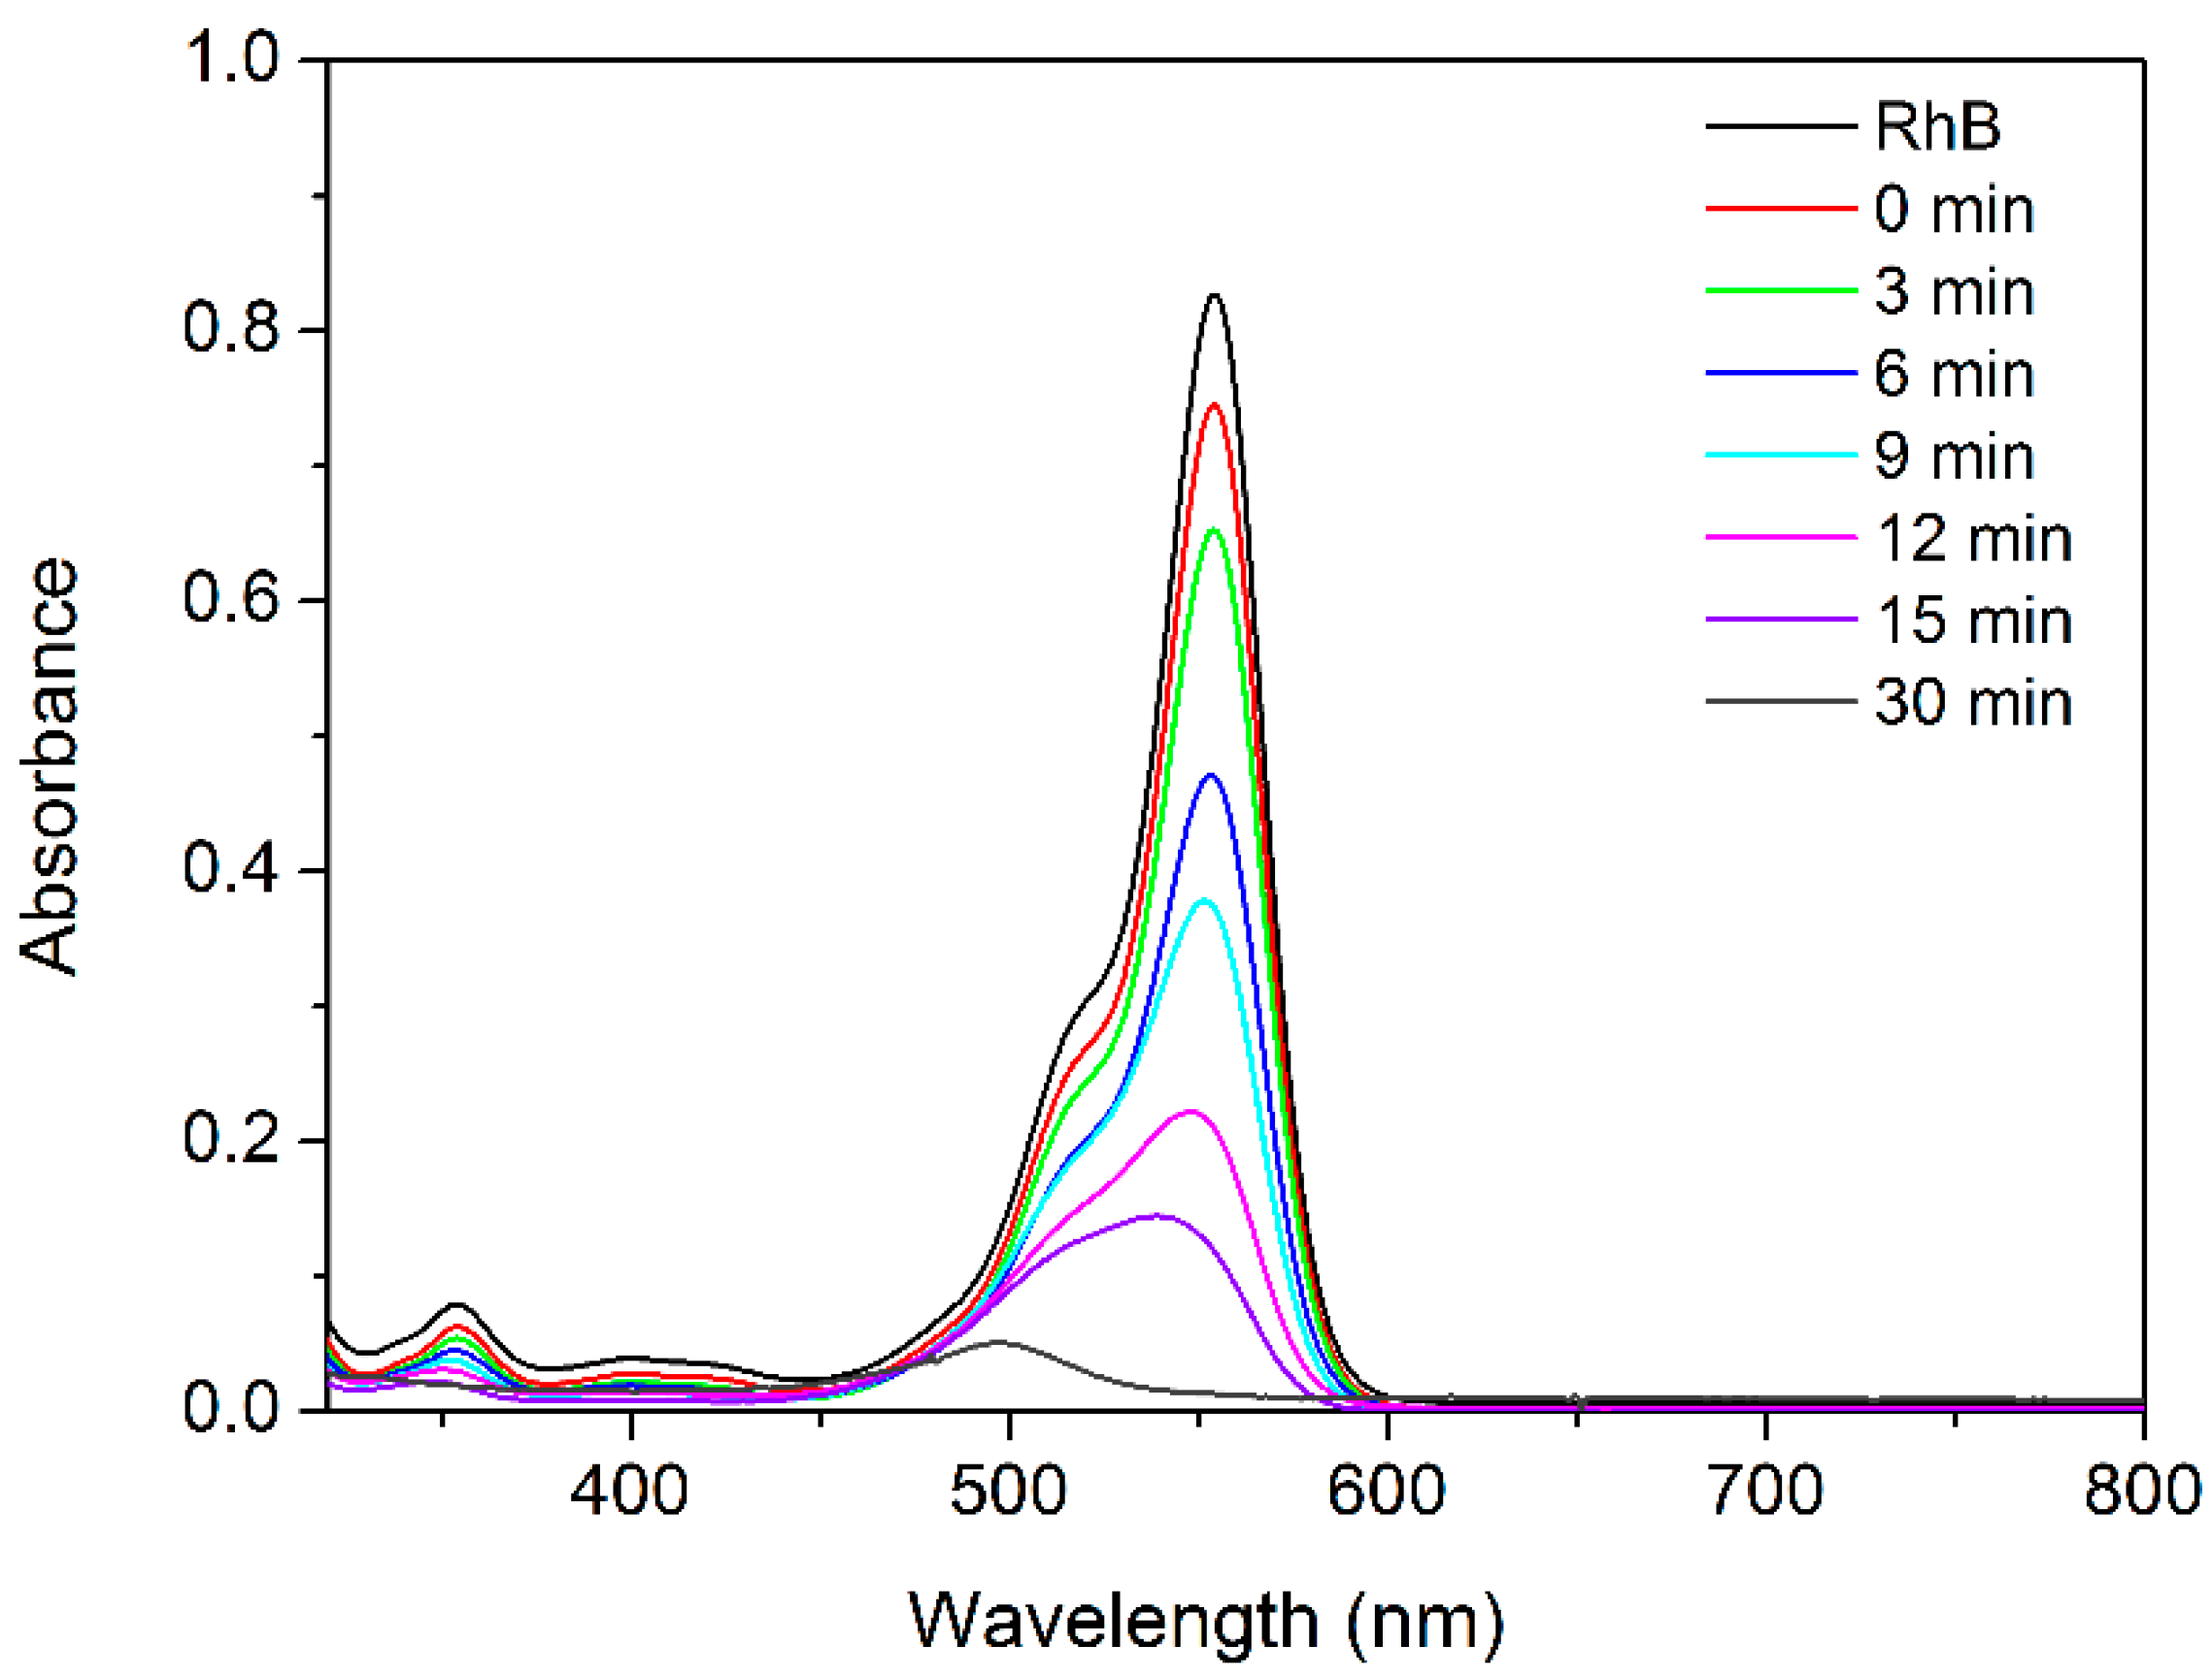
2.2. Photocatalytic Tests

We studied the photocatalytic properties of the ZrP/AgBr composite in the photodegradation of Rhodamine B (RhB), a cationic dye with four ethyl groups bonded to two nitrogen atoms (Figure 6).
In the present work, a weighed amount of the freshly prepared photocatalyst was suspended in 25 mL of a 1 × 10⁻⁵ M RhB solution. The amount of powdered catalyst used in each test has been reported in Table 1.
After equilibration in the dark with the catalyst, the UV-Vis spectra of the RhB solution were collected at given intervals of irradiation time. Catalytic tests under irradiation in the presence of pure ZrP has been reported in a previous paper and proved that it did not have significant catalytic activity toward the photodegradation of RhB [8].
The results obtained with the pure AgBr sample are shown in Figure 7. The decrease in the absorbance after equilibration in the dark (t = 0 min) was due to the adsorption of the dye on the catalyst surface. During irradiation, the absorbance decreases and the absorption maximum (λm) slowly shifts toward lower λ values, from 554 nm to 497 nm. Watanabe et al. in 1977 proved that this ipsochromic shift of λm, observed by illumination of the RhB solution in the presence of a photocatalyst, is due to de-ethylation occurring in a stepwise manner, and to cleavage processes [18].
In order to assess the contribution of de-ethylation and cleavage processes to the RhB degradation, it can be observed, on the basis of the literature [19], that the absorption of the cleaved species lies in the UV region. Therefore, the absorbance, measured at time t and wavelengths λ in the range 450–600 nm (Aλ(t)), depends on the concentrations of RhB and of its de-ethylated species.
Aλ(t) can be written as:
A λ ( t ) = d i = 1 5 ε i , λ C i ( t )
where d = path length of the light beam; εi,λ = molar extinction coefficient of the i species at the wavelength λ; i = 1 for RhB; i = 2 for N,N,N′-triethylated Rh; i = 3 for N,N′-diethylated Rh; i = 4 for N-ethylated Rh; i = 5 for Rh; and Ci(t) = concentration of the i species at time t.
The determination of Aλ(t) at five suitable λ values and the knowledge of the molar extinction coefficients of Rhodamine B and of the four de-ethylated species at each λ value allows us to set up a system of five linear equations whose solution provides the five unknown concentrations. To this aim, we considered the absorbances measured, at a given time, for the λ values of 554 nm, 539 nm, 522 nm, 510 nm and 497 nm, which correspond to the absorption maximum of the species (1), (2), (3), (4) and (5), respectively. As a consequence, the molar extinction coefficient of each species has a significantly higher value in at least one equation, and each species is adequately represented in the equation system. The values of the molar extinction coefficients for each wavelength (εi,λ) were derived from the Watanabe paper [19].
Figure 8 shows the RhB relative concentration, C1(t)/C1(0), where C1(0) is the concentration of RhB at t = 0 min, together with the relative total concentration of the de-ethylated species ( i = 2 5 C i ( t ) / C 1 ( 0 ) ), and the relative concentration of the cleaved species (that is 1 i = 1 5 C i ( t ) / C 1 ( 0 ) ), as a function of time. The concentration of RhB decreased over time and approached zero at 30 min. As shown, the disappearance of RhB is due to both de-ethylation and cleavage; the relative concentration of the de-ethylated species first increases and reaches a maximum (≈ 0.4) around 12–15 min, then decreases to ≈ 0.1 at 30 min.
The concentration of the de-ethylated and cleaved species is comparable in the time range 0–12 min, while cleavage prevails on de-ethylation for longer time than 15 min.
The half-life of RhB (t1/2) was 7.92 min, while the percentage of chromophore cleavage was around 91% after 30 min.
Kinetic studies in the presence of ZrP/AgBr were carried out by using different amounts of photocatalyst; the maximum amount was chosen in order to have an AgBr content as high as that used for the test with the pure sample.
The temporal evolution of the UV-Vis spectra of RhB in the three experiments with ZrP/AgBr are shown in Figure 9. An ipsochromic shift of λm was observed, and an almost complete disappearance of the band in the visible region (chromophore cleavage > 90%) occurred within a maximum of 6 min, 12 min and 15 min in the presence of 1.1 mg, 0.73 mg, 0.45 mg AgBr/mL RhB, respectively.
The relative concentration of RhB, de-ethylated and cleaved species as a function of time was calculated for the catalytic test carried out with the lowest amount of ZrP/AgBr by applying Equation (2) to the absorbance values of Figure 9C; the results are shown in Figure 10.
The general trends are similar to those observed for pure AgBr, but the whole process is faster, with the half-life of RhB being 2.31 min. At three minutes, de-ethylated species accounted for 42% of the initial concentration, while about 30% underwent cleavage. Cleavage clearly prevails over de-ethylation in the time range 6–15 min.
It was also interesting to compare the results of the present paper with those obtained by Liang et al. in 2013 in the photocatalytic degradation of RhB by using Ag@AgBr-intercalated K4Nb6O17 [20]. By using a comparable amount of photocatalyst (about 1 mg/mL RhB), they needed a much longer time (120 min) in order to achieve a similar percentage of RhB photodegradation (about 96%).
In order to assay the stability of the ZrP/AgBr composite, three consecutive tests have been carried out with the highest amount of photocatalyst. Before each test, the recovered catalyst was washed with deionised water and dried over P2O5. The UV-Vis spectra collected during the second and third test are shown in Figure 11.
A slight loss of performance was observed after the first cycle, but the performance was in any case much higher with respect to that of fresh pure AgBr, with the percentage of cleavage being around 90% after six minutes.
The XRD patterns of the catalyst sample recovered after each test and shown in Figure 12 did not highlight significant changes as a consequence of repeated cycles of irradiation. The enlarged view of the pattern around 38° 2θ (see the inset of Figure 12) put in evidence the presence of a broad reflection of low intensity at 38.1° 2θ after three cycles, which can be assigned to the (111) crystallographic plane of metallic silver, formed as a consequence of the sample irradiation. However, the fact that metallic silver is not clearly detected for at least three cycles suggested that the ZrP/AgBr catalyst has a good stability toward light irradiation and this result is also confirmed by the fact that its performance remained high during the repeated catalytic tests.

2.3. Catalytic Behavior of ZrP/silver Halides

In order to provide an overview on the catalytic behavior of ZrP/silver halide composites, kinetic data collected for the AgCl and ZrP/AgCl catalysts (previously tested for the photodegradation of RhB [8]) have been analyzed by the same system of five linear equations used for AgBr-based catalysts, and the relative concentration of RhB, de-ethylated and cleaved species were then calculated as a function of time. The obtained results are shown in Figure 13 and Figure 14 for pure AgCl and for the ZrP/AgCl composite containing about 58 wt% AgCl, respectively.
Compared to AgBr, de-ethylation is basically the only process occurring within the first 20 min. The difference between de-ethylation and cleavage is even more pronounced in the kinetics with ZrP/AgCl; as a matter of fact, the complete disappearance of RhB, observed at six minutes, is entirely due to de-ethylation, while the de-ethylated species are cleaved in the time range 6–12 min.
The half-life of RhB was 15.8 min and 3.01 min for the kinetics with AgCl and ZrP/AgCl, respectively.
It is also observed that the relative rate of the cleavage, with respect to that of the de-ethylation, is higher for the AgBr-based catalysts than for those based on AgCl.
To get further insights into the kinetics of the dye degradation for the different catalysts, the relative concentration of RhB, calculated from the various experiments, was plotted as a function of t / t 1 / 2 ; the results are shown in Figure 15.
Surprisingly, all data sets lie along the same curve, suggesting that the first step of RhB photodegradation is the same for all four catalytic systems. Therefore, it is suggested that, as in the case of ZrP/AgCl, and now for AgCl, AgBr and ZrP/AgBr, the degradation process starts with RhB de-ethylation, followed by cleavage of the de-ethylated species.

3. Experimental

3.1. Chemicals

Zirconyl propionate (ZrO1.26(C2H5COO)1.49, molecular weight (MW) = 220 Da) was kindly supplied by MEL Chemicals, Manchester, UK. Concentrated orthophosphoric acid (85%, 14.8 M) and propanol were purchased from Fluka (Milano, Italy) and Carlo Erba (Milano, Italy), respectively. All other reagents were from Aldrich (Milano, Italy) and used without further purification.

3.2. Synthesis of the ZrP/AgBr Composite

Nanocrystalline ZrP, prepared as reported in [21], was used for the synthesis of the ZrP/AgBr composite. First, silver exchanged zirconium phosphate was prepared by a H+/Ag+ ion exchange reaction, carried out as follows: 133 mL of a 5 × 10⁻² M silver acetate solution was added to 1 g of nanocrystalline ZrP powder suspended in water, so that the Ag/Zr molar ratio was 2.0. The mixture was left stirring in the dark at room temperature for five hours. The solid recovered after centrifugation was washed with water and dried at room temperature over P2O5. The P/Zr and Ag/Zr molar ratios, determined by Inductively Coupled Plasma Atomic Emission Spectroscopy ICP AES analysis, were 2.0 and 1.8, respectively, so that the following composition was assigned: ZrAg1.8H0.2(PO4)2 (hereafter indicated as ZrPAg).
AgBr was formed by the reaction of ZrPAg with an excess of 0.5 M HBr (Br/Ag molar ratio ≈ 30) and then washed with 1 × 10⁻³ M HBr. After the reaction, the solid (hereafter indicated as ZrP/AgBr) changed its color from white to pale yellow, due to the presence of AgBr. The ZrP/AgBr composite was finally dried at room temperature over P2O5. The weight percent of AgBr in the composite, calculated from the Ag/Zr molar ratio of the corresponding ZrPAg precursor, was 53 wt%.
A sample of pure AgBr, which was used as reference material, was precipitated by the reaction of silver acetate with an excess of 0.5 M HBr (Br/Ag molar ratio ≈ 30); the solid was then washed with 1 × 10⁻³ M HBr and finally dried at room temperature over P2O5. All materials were sheltered from light before the catalytic tests.

3.3. Techniques

Before the catalytic tests, the powder samples were characterized by inductively coupled plasma-optical emission spectrometry (ICP-OES), X-ray diffraction (XRD) analysis, transmission electron microscopy (TEM) analysis and diffusive reflectance spectroscopy (DRS).
An ICP-OES Varian Liberty spectrometer with axial injection was used to determine the P/Zr and Ag/Zr molar ratio in ZrPAg. A weighed amount of the samples was dissolved in 3 M HF (≈ 2 mL) and then diluted with water.
XRD analysis was carried out with a Philips X’Pert PRO MPD diffractometer (Malvern Panalytical, Malvern, UK) operating at 40 kV and 40 mA, and using Cu Kα radiation and an X’Celerator detector; the step size was 0.0167° and the counting time was 50 s.
SEM analysis was performed by a Zeiss LEO 1525 FE SEM (Zeiss, Jena, Germany), at the LUNA Laboratory of the Department of Physics and Geology of Perugia University. The powder samples were put on an aluminum stub pre-coated with a double sided adhesive conductive carbon tape and coated with a thin layer of chromium.
Diffusive reflectance measurements were carried out by a portable spectrophotometer composed of Avantes parts and a deuterium–halogen lamp (AvaLight-DH-2000-FHS, Avantes, Apeldoorn, The Netherlands). An integrating sphere with a 6 mm diameter viewing aperture and 88 irradiation angle (ISP-30-6) was used to collect and transfer the reflectance signals to an AvaSpec–2048 charge-coupled device (CCD) detector via a quartz fiber-optic system (diameter = 600 μm). The acquisition of the spectra in the range 200–1100 nm was controlled by the AvaSoft software (Version 8 Avantes, Apeldoorn, The Netherlands).
The reflectance values were transformed to Kubelka–Munk units according to Equation (3) [22]:
K S = [ 1 R λ 0 ] 2 2 R λ 0 = F ( R λ 0 )
where K and S represent the apparent absorption and scattering coefficients, respectively, and are functions of wavelength; Rλ0 is the reflectance value experimentally recorded at λ0; and F(Rλ0) is the so-called re-emission function at λ0.
To discern direct and indirect electronic transitions, Equation (4) was used:
α h ν = B ( h ν E g ) n
where α, ν, B, Eg are the absorption coefficient (proportional to the K/S ratio, assuming S is wavelength-independent), the light frequency, a proportional constant, and the band gap energy, respectively. The exponential n rules the character of the transition, which is direct for n = ½, and indirect for n = 2 [23]. In order to distinguish these two kinds of transitions, Equation (2) was rearranged and [ ( K / S ) h ν ] 1 / n was plotted as a function of , obtaining a straight line (Equation (5)):
[ ( K S ) h ν ] 1 / n B 1 / n h ν B 1 / n E g
The ratio between the intercept and the slope gave the right band gap for only one value of n, either ½ or 2.
The photocatalytic tests were performed by studying the photodegradation of Rhodamine B (RhB) dye. With this aim, a 1 × 10⁻⁵ M RhB aqueous solution was prepared. Then, a weighted amount of catalyst powder was suspended in 25 mL of this solution and the mixture was left stirring in the dark for 30 min in order achieve the adsorption equilibrium of the dye onto the catalyst surface. The mixture was irradiated with a 105 W Osram halogen lamp with a UV filter (providing radiation with λ ≥ 350 nm). It was calculated that the UV light emitted by the lamp is less than 2% of the visible light. The sample illumination area was 16 cm2 and the distance between the light source and the upper surface of the liquid was 7.5 cm. The RhB degradation over time was studied by taking up, during irradiation, suitable portions of the mixture, which was centrifuged to separate the solid catalyst from the solution, and then analyzed by a UV-Vis spectrometer. The amount of catalyst used for the catalytic tests has been reported in Table 1.

4. Conclusions

A zirconium phosphate/silver bromide (ZrP/AgBr) composite, containing 53 wt% of AgBr, was prepared by the reaction of hydrobromic acid with silver exchanged ZrP. The AgBr particles in ZrP/AgBr are smaller than those of a pure AgBr sample, synthesized in similar conditions from homogeneous solution.
The photocatalytic properties of pure AgBr and ZrP/AgBr were tested in the photocatalytic degradation of RhB, which was faster with ZrP/AgBr than with pure AgBr with the amount of AgBr being the same or even lower. ZrP/AgBr performed well for at least three consecutive catalytic tests.
Moreover, the visible spectra of the RhB solution at different irradiation times were decomposed in order to determine the relative concentrations of RhB, de-ethylated and cleaved species as a function of time. It was found that the dye was degraded according to two consecutive reactions: stepwise de-ethylation, followed by cleavage of the chromophore structure. The catalytic data obtained for AgBr and ZrP/AgBr were compared with those of the AgCl and ZrP/AgCl systems, finding that, in comparison with the de-ethylation rate, the cleavage rate is higher for the AgBr-based catalysts than for those based on AgCl.

Supplementary Materials

The following are available online at https://www.mdpi.com/2073-4344/9/1/3/s1, Figure S1: SEM pictures of (A) microcrystalline ZrP/AgCl at different magnifications and (B) nanocrystalline ZrP/AgCl (unpublished images).

Author Contributions

M.P. designed the work, elaborated the experimental data, wrote and revised the manuscript. M.C. elaborated the experimental data, wrote and revised the manuscript. M.N. designed the work and revised the paper. A.D. revised the paper. S.C. made the experiments. P.L.G. made the DRS measurements and contributed to write and revise the manuscript.

Funding

This research received no external funding.

Conflicts of Interest

The authors declare no conflict of interest.

References

  1. Hussain, F.; Hojjati, M.; Okamoto, M.; Gorga, R.E. Review article: Polymer-matrix Nanocomposites, Processing, Manufacturing, and Application: An Overview. J. Compos. Mater. 2006, 40, 1511–1575. [Google Scholar] [CrossRef]
  2. Xie, Z.; Liu, Z.; Wang, Y.; Yang, Q.; Xu, L.; Ding, W. An Overview of Recent Development in Composite Catalysts from Porous Materials for Various Reactions and Processes. Int. J. Mol. Sci. 2010, 11, 2152–2187. [Google Scholar] [CrossRef] [PubMed] [Green Version]
  3. Carrara, N.; Badano, J.M.; Betti, C.; Lederhos, C.; Busto, M.; Vera, C.; Quiroga, M. New Strategies for Obtaining Inorganic-Organic Composite Catalysts for Selective Hydrogenation, New Advances in Hydrogenation Processes, Maryam Takht Ravanchi; IntechOpen: Rijeka, Croatia, 2017; Available online: http://www.webcitation.org/73nRHpWaa (accessed on 9 November 2018). [CrossRef]
  4. Pica, M. Zirconium Phosphate Catalysts in the XXI Century: State of the Art from 2010 to Date. Catalysts 2017, 7, 190. [Google Scholar] [CrossRef]
  5. Pica, M.; Donnadio, A.; Casciola, M. From microcrystalline to nanosized α-zirconium phosphate: Synthetic approaches and applications of an old material with a bright future. Coord. Chem. Rev. 2018, 374, 218–235. [Google Scholar] [CrossRef]
  6. Clearfield, A.; Costantino, U. Layered metal phosphates and their intercalation chemistry. In Comprehensive Supramolecular Chemistry, Solid-state Supramolecular Chemistry: Two-and Three-Dimensional Inorganic Networks; Alberti, G., Bein, T., Eds.; Pergamon: Oxford, UK, 1996; Volume 7, Chapter 4. [Google Scholar]
  7. Petrucci, C.; Cappelletti, M.; Piermatti, O.; Nocchetti, M.; Pica, M.; Pizzo, F.; Vaccaro, L. Immobilized palladium nanoparticles on potassium zirconium phosphate as an efficient recoverable heterogeneous catalyst for a clean Heck reaction in flow. J. Mol. Catal. A Chem. 2015, 401, 27–34. [Google Scholar] [CrossRef]
  8. Pica, M.; Nocchetti, M.; Ridolfi, B.; Donnadio, A.; Costantino, F.; Gentili, P.L.; Casciola, M. Nanosized zirconium phosphate/AgCl composite materials: A new synergy for efficient photocatalytic degradation of organic dye pollutants. J. Mater. Chem. A 2015, 3, 5525–5534. [Google Scholar] [CrossRef]
  9. Wang, P.; Huang, B.; Daia, Y.; Whangbo, M.-H. Plasmonic photocatalysts: Harvesting visible light with noble metal nanoparticles. Phys. Chem. Chem. Phys. 2012, 14, 9813–9825. [Google Scholar] [CrossRef] [PubMed]
  10. Xia, Y.; Halas, N.J. Shape-Controlled Synthesis and Surface Plasmonic Properties of Metallic Nanostructures. MRS Bull. 2005, 30, 338–348. [Google Scholar] [CrossRef] [Green Version]
  11. Jiang, R.; Li, B.; Fang, C.; Wang, J. Metal/Semiconductor Hybrid Nanostructures for Plasmon-Enhanced Applications. Adv. Mater. 2014, 26, 5274–5309. [Google Scholar] [CrossRef] [PubMed]
  12. Wang, P.; Huang, B.; Qin, X.; Zhang, X.; Dai, Y.; Wei, J.; Whangbo, M.-H. Ag@AgCl: A Highly Efficient and Stable Photocatalyst Active under Visible Light. Angew. Chem. Int. Ed. 2008, 47, 7931–7933. [Google Scholar] [CrossRef] [PubMed]
  13. Wang, P.; Huang, B.; Lou, Z.; Zhang, X.; Qin, X.; Dai, Y.; Zheng, Z.; Wang, X. Synthesis of Highly Efficient Ag@AgCl Plasmonic Photocatalysts with Various Structures. Chem.–A Eur. J. 2010, 16, 538–544. [Google Scholar] [CrossRef] [PubMed]
  14. Han, L.; Wang, P.; Zhu, C.; Zhai, Y.; Dong, S. Facile solvothermal synthesis of cube-like Ag@AgCl: A highly efficient visible light photocatalyst. Nanoscale 2011, 3, 2931–2935. [Google Scholar] [CrossRef] [PubMed]
  15. An, C.; Wang, S.; Sun, Y.; Zhang, Q.; Zhang, J.; Wang, C.; Fang, J. Plasmonic silver incorporated silver halides for efficient photocatalysis. J. Mater. Chem. A 2016, 4, 4336–4352. [Google Scholar] [CrossRef]
  16. Jiang, J.; Li, H.; Zhang, L. New insight into daylight photocatalysis of AgBr@ Ag: Synergistic effect between semiconductor photocatalysis and plasmonic photocatalysis. Chem.–A Eur. J. 2012, 18, 6360–6369. [Google Scholar] [CrossRef] [PubMed]
  17. Chen, F.; Zhao, J.; Hidaka, H. Highly selective deethylation of rhodamine B: Adsorption and photooxidation pathways of the dye on the TiO2/SiO2 composite photocatalyst. Int. J. Photoenergy 2003, 5, 210–217. [Google Scholar] [CrossRef]
  18. Watanabe, T.; Takirawa, T.; Honda, K. Photocatalysis through Excitation of Adsorbates. Rhodamine B Adsorbed to CdS. J. Phys. Chem. 1977, 81, 1845–1851. [Google Scholar] [CrossRef]
  19. De Mello Donegá, C. Synthesis and properties of colloidal heteronanocrystals. Chem. Soc. Rev. 2011, 40, 1512–1546. [Google Scholar] [CrossRef] [PubMed] [Green Version]
  20. Cui, W.; Wang, H.; Liang, Y.; Han, B.; Liu, L.; Hu, J. Microwave-assisted synthesis of Ag@AgBr-intercalated K4Nb6O17 composite and enhanced photocatalytic degradation of Rhodamine B under visible light. Chem. Eng. J. 2013, 230, 10–18. [Google Scholar] [CrossRef]
  21. Pica, M.; Donnadio, A.; Capitani, D.; Vivani, R.; Troni, E.; Casciola, M. Advances in the chemistry of nanosized zirconium phosphates: A new mild and quick route to the synthesis of nanocrystals. Inorg. Chem. 2011, 50, 11623–11630. [Google Scholar] [CrossRef] [PubMed]
  22. Kortuem, G. Reflectance Spectroscopy; Springer: Berlin/Heidelberg, Germany; New York, NY, USA, 1969. [Google Scholar]
  23. Tauc, J.; Grigorovici, R.; Vancu, A. Optical properties and electronic structure of amorphous germanium. Phys. Stat. Sol. 1966, 15, 627–637. [Google Scholar] [CrossRef]
Figure 1. XRD patterns of α-ZrP·H2O (a) and ZrPAg (b). Peaks labelled with an asterisk refer to the Zr(AgPO4)2 phase. a.u. = arbitrary units.
Catalysts 09 00003 g001
Figure 2. XRD pattern of ZrP/AgBr. Peaks labelled with black dots refer to the cubic AgBr phase.
Catalysts 09 00003 g002
Figure 3. Representative SEM image of the pure AgBr sample used as reference.
Catalysts 09 00003 g003
Figure 4. Representative SEM images of ZrP/AgBr at different magnifications.
Catalysts 09 00003 g004
Figure 5. Absorption spectra in Kubelka–Munk units (K/S, where K and S are the apparent absorption and scattering coefficients, respectively) of AgBr (black trace) and ZrP/AgBr (red trace) as a function of the wavelength, λ. The two direct band gaps of AgBr are highlighted in the inset. λ = wavelength. BG = band gap.
Catalysts 09 00003 g005
Figure 6. Chemical structure of Rhodamine B (RhB).
Catalysts 09 00003 g006
Figure 7. Temporal changes of the absorption spectrum of the RhB solution in the presence of pure AgBr.
Catalysts 09 00003 g007
Figure 8. Relative concentration of RhB (a); de-ethylated species (b) and cleaved species (c) as a function of time, calculated according to Equation (2), for the catalytic test with pure AgBr.
Catalysts 09 00003 g008
Figure 9. Temporal changes of the absorption spectrum of the RhB solution in the presence of different amounts of ZrP/AgBr per mL RhB: 1.1 mg (A); 0.73 mg (B); 0.45 mg (C).
Catalysts 09 00003 g009
Figure 10. Relative concentration of RhB (a); de-ethylated species (b) and cleaved species (c) as a function of time, calculated according to Equation (2), for the catalytic test with ZrP/AgBr.
Catalysts 09 00003 g010
Figure 11. UV-Vis spectra collected during the second (A) and third (B) test carried out with ZrP/AgBr (1.1 mg AgBr/ mL RhB).
Catalysts 09 00003 g011
Figure 12. XRD patterns of the ZrP/AgBr photocatalyst collected after the first (a); the second (b) and the third (c) catalytic test.
Catalysts 09 00003 g012
Figure 13. Relative concentration of RhB (a); de-ethylated species (b) and cleaved species (c) as a function of time, calculated according to Equation (2), for the catalytic test with pure AgCl.
Catalysts 09 00003 g013
Figure 14. Relative concentration of RhB (a); de-ethylated species (b) and cleaved species (c) as a function of time, calculated according to Equation (2), for the catalytic test with ZrP/AgCl.
Catalysts 09 00003 g014
Figure 15. Relative concentration of RhB as a function of t / t 1 / 2 , calculated from the catalytic tests carried out with AgX and ZrP/AgX (X = Cl, Br) photocatalysts.
Catalysts 09 00003 g015
Table 1. Amount of catalysts used in each experiment, expressed as mg of photocatalyst, or mg of AgBr, per mL of RhB.
Samplemg Photocatalyst/mL RhBmg AgBr/mL RhB
AgBr1.11.1
ZrP/AgBr2.11.1
1.40.73
0.850.45

