Article

Promotional Effect of Ce on Iron-Based Catalysts for Selective Catalytic Reduction of NO with NH3

1
Key Laboratory of Mesoscopic Chemistry of Ministry of Education School of Chemistry and Chemical Engineering, Nanjing University, Nanjing 210093, China
2
Jiangsu Key Laboratory of Vehicle Emissions Control, Center of Modern Analysis, Nanjing University, Nanjing 210093, China
3
School of Environmental and Chemical Engineering, Chongqing Three Gorges University, Chongqing 404020, China
*
Authors to whom correspondence should be addressed.
Catalysts 2016, 6(8), 112; https://doi.org/10.3390/catal6080112
Submission received: 16 May 2016 / Revised: 13 July 2016 / Accepted: 20 July 2016 / Published: 26 July 2016

Abstract

:
A series of Fe–Ce–Ti catalysts were prepared via co-precipitation method to investigate the effect of doping Ce into Fe–Ti catalysts for selective catalytic reduction of NO with NH3. The NO conversion over Fe–Ce–Ti catalysts was considerably improved after Ce doping compared to that of Fe–Ti catalysts. The Fe(0.2)–Ce(0.4)–Ti catalysts exhibited superior catalytic activity to that of Fe(0.2)–Ti catalysts. The obtained catalysts were characterized by N2 adsorption (BET), X-ray diffraction (XRD), temperature programmed reduction (H2-TPR), temperature programmed desorption (NH3-TPD), Fourier transform infrared (FT-IR) spectrophotometry, thermogravimetric analysis (TGA), and X-ray photoelectron spectroscopy (XPS). The data showed that the introduction of Ce results in higher surface area and better dispersion of active components on the catalyst surface and enhances the amount of surface acid sites. The interactions between Fe and Ce species were found to improve the redox ability of the catalyst, which promotes catalytic performance at low temperature. The XPS results revealed that Fe3+/Fe2+ and Ce4+/Ce3+ coexisted on the catalyst surface and that Ti was in 4+ oxidation state on catalyst surface. Ce doping increased the atomic ratio of Fe/Ti and Ce/Ti and enhanced the surface adsorbed oxygen species. In addition, Fe(0.2)–Ce(0.4)–Ti catalyst also showed better tolerance to H2O and SO2 and up to 92% NO conversion at 270 °C with 200 ppm SO2 added over 25 h, which suggests that it is a promising industrial catalyst for mid-low temperature NH3–selective catalytic reduction (SCR) reaction.

Graphical Abstract

1. Introduction

NOx (NO and NO2), which is emitted primarily from power plants and automobile exhaust gases, is considered a major environmental pollutants and has garnered world-wide research attention due to its toxicity to the air and threat to human health [1,2]. Securing methods to effectively reduce NOx emissions is a crucial endeavor. In recent years, a variety of methods have been developed to reduce NOx emissions. Selective catalytic reduction (SCR) of NOx with NH3 is often applied to remove NOx from stationary sources, for example. The commercial catalysts typically used for SCR are V2O5/TiO2 or V2O5–WO3/TiO2 catalysts, which have high catalytic activity in temperatures from 300–400 °C [1,3]. Unfortunately, there are several problems inherent to existing commercial catalysts such as the decline of N2 selectivity at high temperatures, the environmental toxicity of vanadium species, high conversion of SO2 to SO3, and the relatively narrow activity temperature window [2,3]. There is considerable and urgent demand for alternative catalysts for SCR applications, particularly those that are highly active, environmentally friendly, stable, and vanadium-free.
In recent years, a number of transition metal-containing catalysts, such as FeOx, MnOx, CuOx, and CrOx have been developed as NH3-SCR catalysts. Among them, Fe-based catalysts have attracted special attention due to their excellent catalytic activity, nontoxicity, favorable N2 selectivity, and high hydrothermal stability [4,5,6,7,8,9,10,11]. Feng et al. [5], for example, found that the isolated Fe3+ species forms the main active sites in SCR reactions and that Fe/ZSM-5 catalyst (prepared via the cauliflower-like morphology of ZSM-5 support) exhibits excellent SCR catalytic activity. Zhu et al. [6] reported that Al–Fe–SBA-15 catalysts synthesized by microwave methods exhibit up to 95% NOx conversion at about 360 °C. Compared to single-component catalysts, those with composite components possess improved catalytic activity due to the internal synergistic effect of the active species. Putluru et al. [7] found that 25Mn0.75Fe0.25Ti-DP catalyst prepared by deposition precipitation (DP) has quite high SCR catalytic performance, with relative activity 26.9 times higher than a standard industrial-type VWTi catalyst at 175 °C. Qi and Yang [8] found that Mn–Fe/TiO2 catalysts also have excellent catalytic activity, N2 selectivity, and high resistance to SO2 and H2O. Zhou et al. [9] reported that Fe–Ce–Mn/ZSM-5 catalysts exhibit nearly 100% NO conversion at 300 °C with a gas hourly space velocity (GHSV) of 30,000 h−1, and Zhang and Qu [10] found that Fe–CuOx/ZSM-5 catalysts show higher catalytic activity than FeOx/ZSM-5 or CuOx/ZSM-5 catalysts. In short, the introduction of supplemental Fe ions as promoter is a very effective approach to enhancing the catalytic activity of iron-based catalysts.
Ceria (CeO2), as a catalyst support or catalyst promoter, is of substantial interest to current researchers; it has been studied extensively due to its unique redox properties and oxygen storage capability [12,13,14,15]. It can store and release oxygen via the redox shift between Ce4+ and Ce3+. The transformation between the electrons and formation of oxygen vacancy generated by charge mismatching also leads to the formation of chemisorbed oxygen that benefits the SCR reaction [16]. It also can promote the oxidation of NO to NO2, which results in a “fast SCR” and further enhancement of the SCR reaction [15].
As described above, iron-based catalysts show excellent catalytic activity in terms of NH3–SCR reactions, and Ceria facilitates highly favorable catalytic performance in other metal oxides used as SCR catalysts due to its superior oxygen storage capacity and redox properties. The catalytic behavior of catalysts is closely dependent on the method by which they are prepared as well as their supporting materials and active species. When Ce is introduced to different catalysts (or the catalysts are prepared by different methods,) the resulting manifestations and promotion mechanisms differ. For Fe–Ce catalysts, recent studies have focused on co-precipitation preparation methods without support [17] or supported on H-ß zeolite [4], Beta [18], or TiO2 [19] via ion exchange or impregnation. There have been few reports, however, on the promotional effect of Ce on Fe–Ti catalysts prepared via co-precipitation methods for the express purposes of NO reduction.
In this study, a series of Fe–Ce–Ti catalysts were prepared by co-precipitation technique and applied to NH3–SCR of NO. The catalytic performance of the prepared catalyst was systematically investigated and the effects of Ce on structural, surface, and catalytic properties were investigated using N2 physisorption, X-ray diffraction (XRD), H2 temperature-programmed reduction (H2-TPR), and NH3 temperature-programmed desorption (NH3-TPD), and X-ray photoelectron spectroscopy (XPS). The SO2 and H2O resistance of the catalysts were also surveyed and the used catalysts were investigated using Fourier transform infrared (FT-IR) spectrophotometry and thermogravimetric analysis (TGA).

2. Results and Discussion

2.1. Catalytic Properties of Catalysts

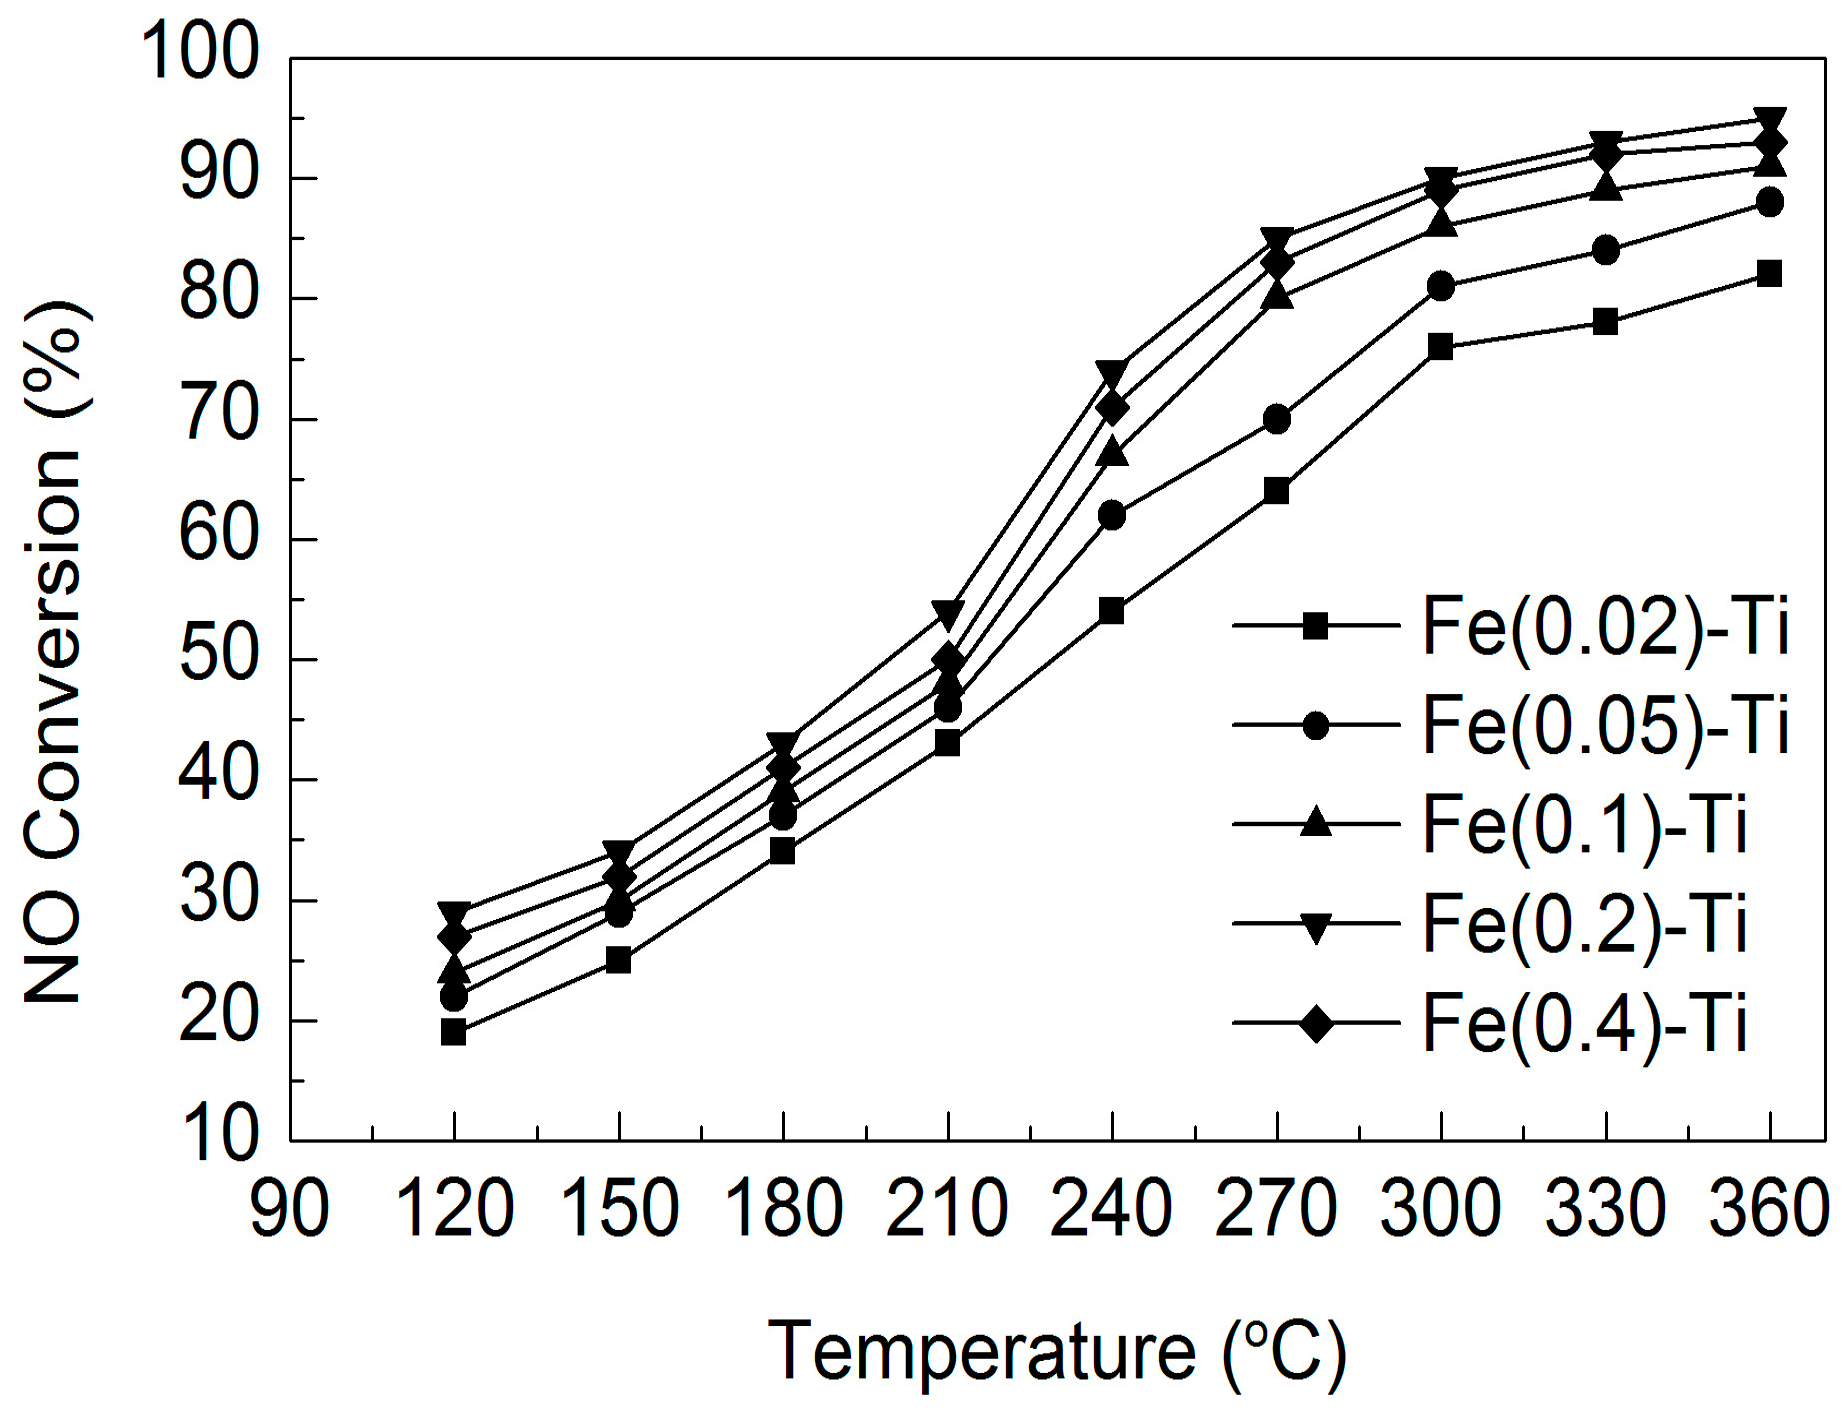
2.1.1. Effect of Iron Loading on Catalytic Activity

The effect of iron loading on Fe–Ti catalytic activity was investigated in the temperature range of 120–360 °C. As shown in Figure 1, the NO conversion of catalysts was observed to be closely related to the amount of iron loading; catalytic activity was ranked by Fe(0.02)–Ti < Fe(0.05)–Ti < Fe(0.1)–Ti <Fe(0.4)–Ti < Fe(0.2)–Ti. For the Fe(0.02)–Ti catalysts, less than 20% NO conversion was obtained at 120 °C and the highest NO conversion was only 82% at 360 °C. The NO conversion of the catalysts increased considerably as the iron load increased from 0.02 to 0.2. The Fe(0.2)–Ti catalysts showed the highest NO conversion over the whole reaction temperature range: more than 85% NO conversion from 270 to 360 °C. When the iron loading further increased to 0.4, the catalytic activity of Fe(0.4)–Ti catalysts decreased slightly. The Fe(0.2)–Ti catalysts exhibited the best NO conversion of all the samples; the optimal of Fe/Ti molar ratio was 0.2.

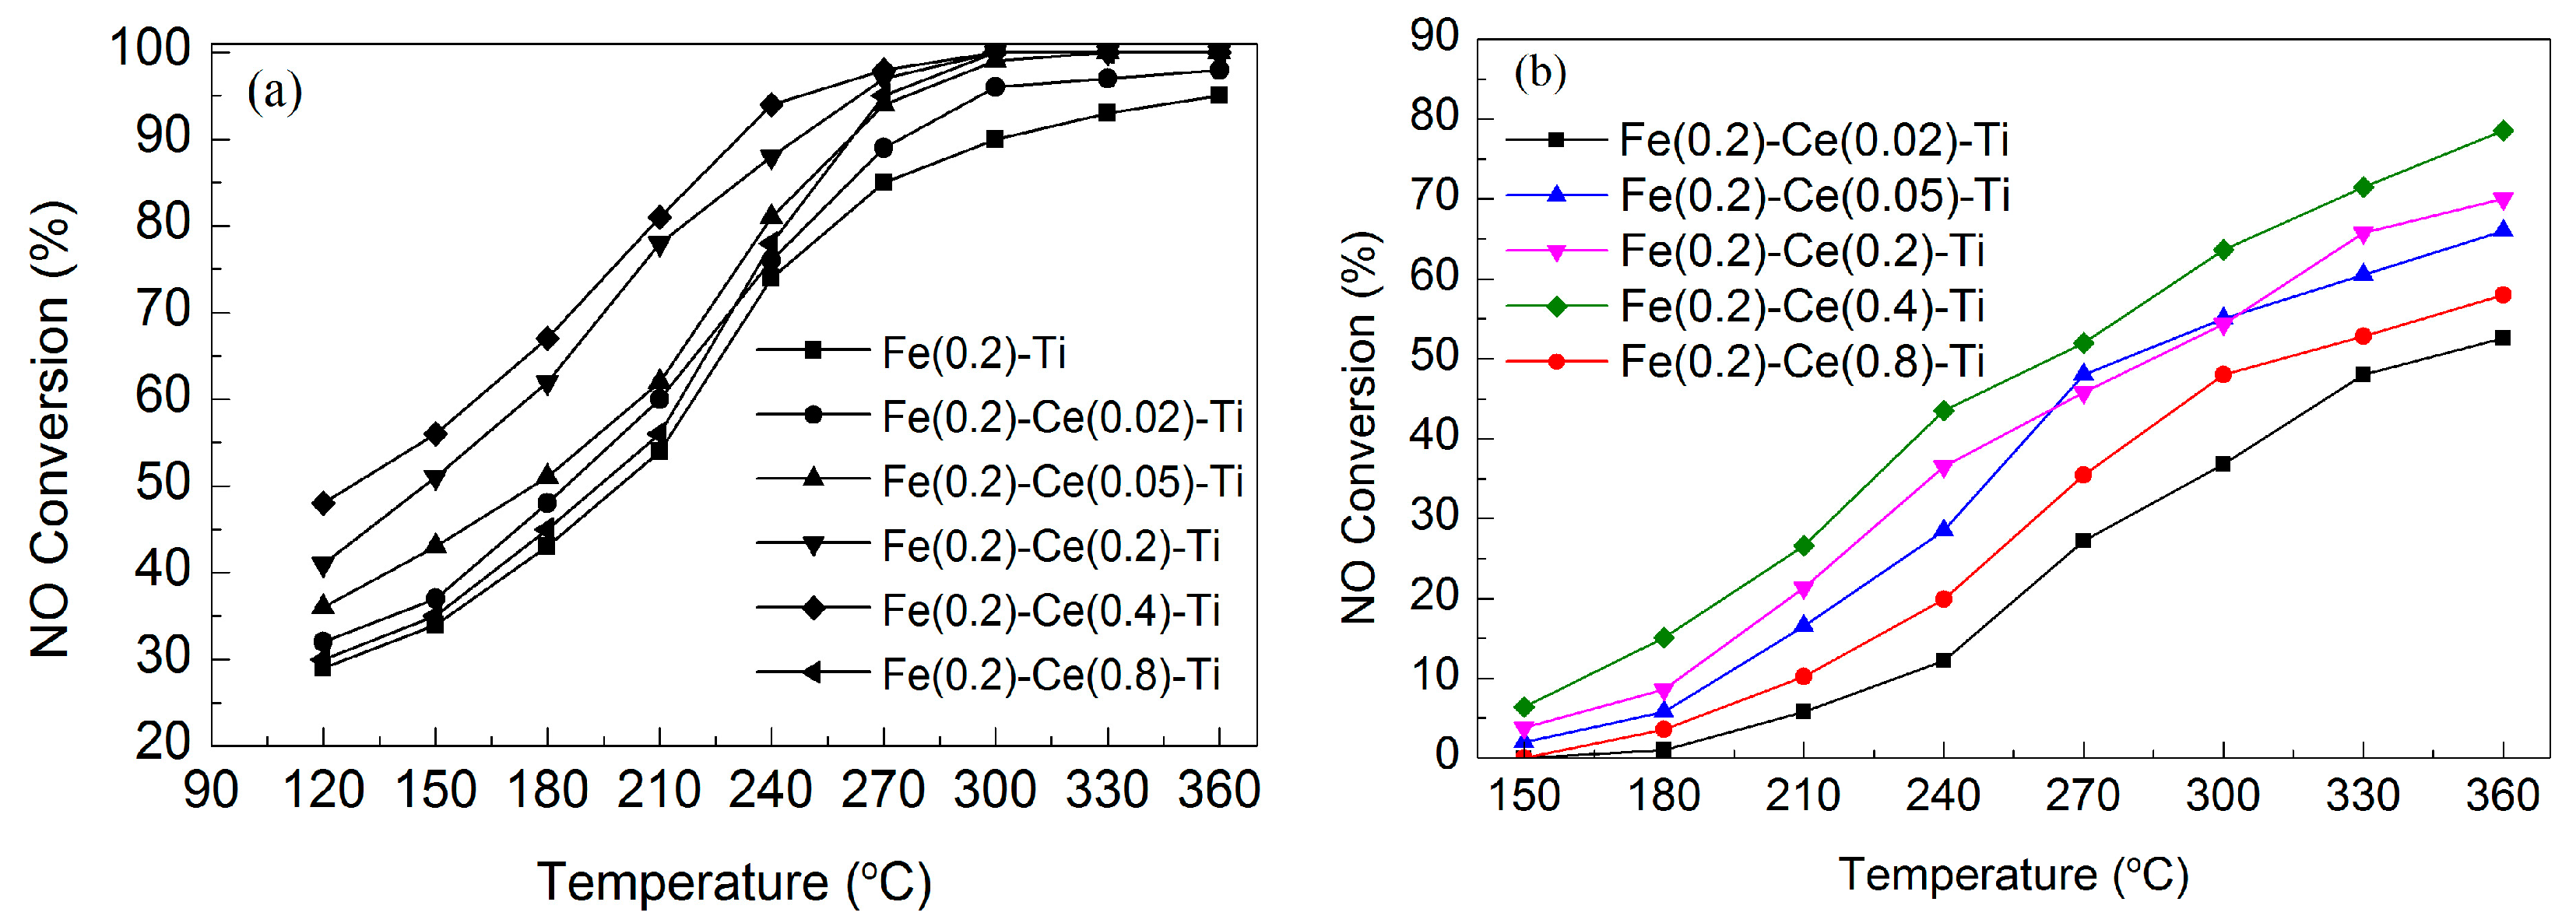
2.1.2. Promotional Effect of Ce on Catalytic Activity

Because the optimal Fe/Ti molar ratio was found to be 0.2, we next prepared a series of Fe(0.2)–Ce(x)–Ti catalysts and ran comparisons among Fe(0.2)–Ti and Fe(0.2)–Ce(x)–Ti catalysts to investigate the promotional effect of Ce doping on catalytic activity. Figure 2 shows the NO conversion of various Fe(0.2)–Ce(x)–Ti catalysts with different Ce/Ti molar ratios under different GHSVs as a function of reaction temperature. As shown in Figure 2a, with a GHSV of 90,000 h−1, the Fe(0.2)–Ti catalysts showed much poorer catalytic activity than others throughout the temperature range. By contrast, after Ce doping, the NO conversion of various Fe(0.2)–Ce(x)–Ti catalysts increased remarkably as temperature increased; catalytic activity was ranked by Fe(0.2)–Ce(0.4)–Ti > Fe(0.2)–Ce(0.2)–Ti > Fe(0.2)–Ce(0.05)–Ti > Fe(0.2)–Ce(0.8)–Ti > Fe(0.2)–Ce(0.02)–Ti > Fe(0.2)–Ti. The Fe (0.2)–Ce(0.4)–Ti catalysts showed optimal catalytic activity, yielding more than 94% NO conversion in the temperature range of 240–360 °C. The catalytic activity of Fe(0.2)–Ce(0.8)–Ti markedly decreased as the Ce–Ti molar ratio further increased to 0.8, especially at low temperatures. Under the GHSV of 180,000 h−1 (shown in Figure 2b), the de-NO efficiency over various Fe(0.2)–Ce–Ti catalysts increased with the increasing reaction temperature. In the whole reaction temperature range, the Fe(0.2)–Ce(0.4)–Ti still exhibited the highest activity and the sequence of catalysts activities were basically consistent with that at GHSV of 90,000 h−1. Based on these results, we confirmed that doping Ce into Fe(0.2)–Ti catalysts is indeed beneficial to improving the catalytic activity for NH3–SCR reactions. The optimal Ce–Ti molar ratio was 0.4.
The NO conversion results of Fe(0.2)–Ti, Ce(0.4)–Ti, and Fe(0.2)–Ce(0.4)–Ti catalysts are shown in Figure 3. NO conversion increased for all catalysts as reaction temperature increased. Compared to the Fe(0.2)–Ti, Ce(0.4)–Ti catalysts, which were comprised of single active components, the Fe(0.2)–Ce(0.4)–Ti catalysts exhibited superior catalytic activity. In effect, binary-component catalysts had the best catalytic activity—there was a synergistic catalytic effect of active species in the SCR reaction.

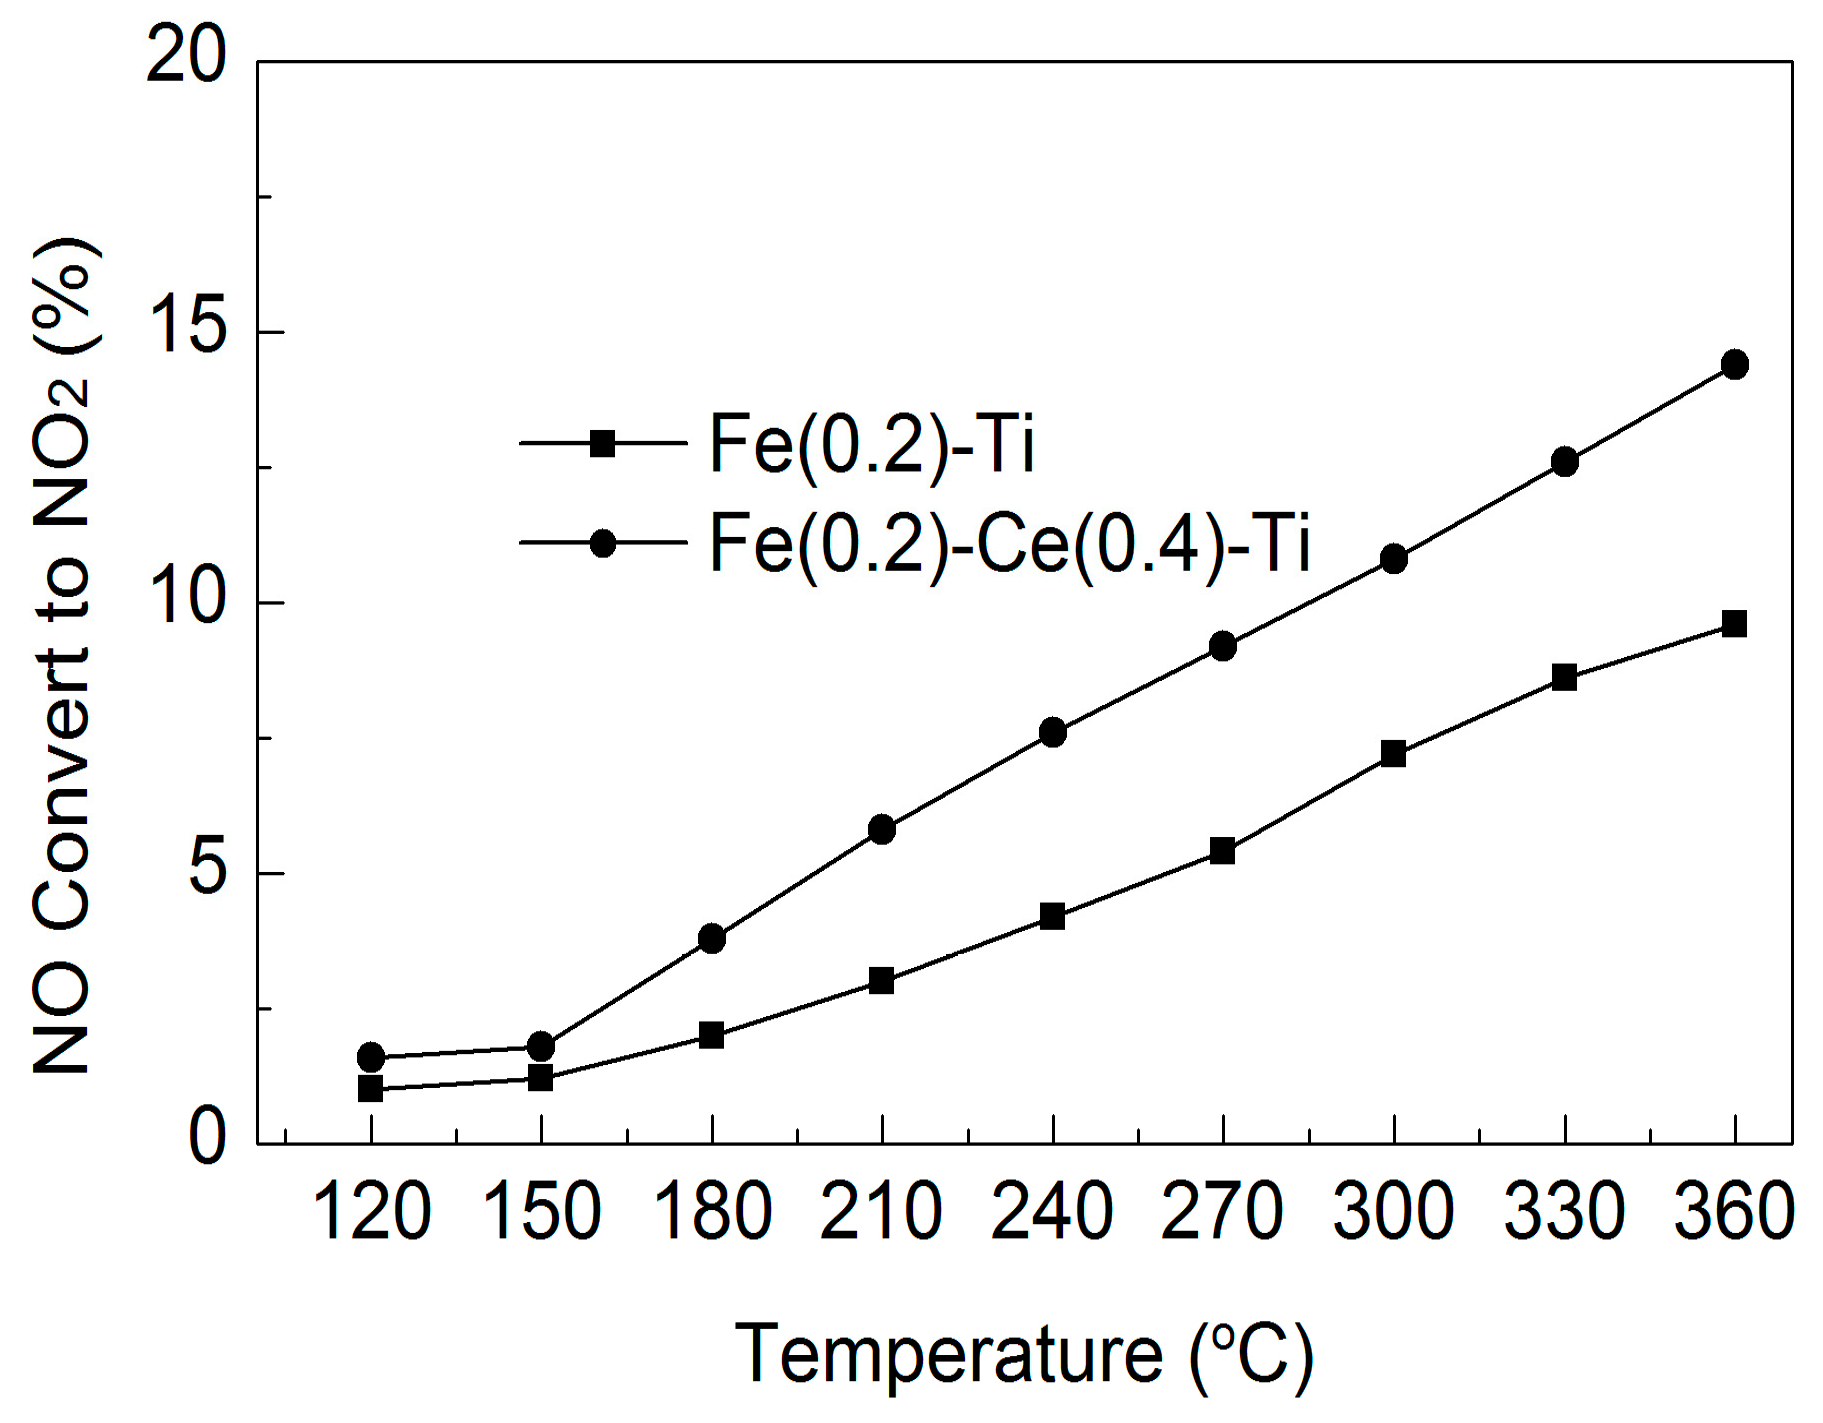
2.1.3. NO Oxidation Characteristics

The oxidation activities of NO to NO2 over Fe(0.2)–Ti and Fe(0.2)–Ce(0.4)–Ti catalysts were investigated in the temperature range of 120–360 °C as shown in Figure 4. Clearly, the oxidation activity of NO to NO2 was limited for Fe(0.2)–Ti catalysts at low temperature but was enhanced as reaction temperature increased. For the Fe(0.2)–Ce(0.4)–Ti catalysts, NO oxidation became stronger after Ce doping. Based on previous studies [8,20,21], the reaction rate of NH3 with NO + NO2 is higher than that with NO only due to the “fast SCR” reaction mentioned in the Introduction. Our Fe(0.2)–Ce(0.4)–Ti catalysts did exhibit stronger oxidation activity of NO to NO2, i.e., higher catalytic activity than other catalysts. Possible reasons for the enhanced oxidation activity of NO to NO2 by Ce doping (as well as the results of H2-TPR and XPS) are discussed below.

2.2. Catalyst Characterization

2.2.1. BET Results

N2 physisorption was conducted to investigate the physical properties of the catalysts described above. The results are shown in Table 1. The BET surface area and pore volume of Fe(0.2)–Ti catalysts were only 76.04 cm2·g−1 and 0.2783 cm3·g−1, respectively. After Ce doping, the BET surface area and pore volume increased; when the Ce/Ti molar ratio increased to 0.2 and 0.4, the BET surface area and pore volume of catalysts increased to 210.85 cm2·g−1, 0.6094 cm3·g−1 and 146.82 cm2·g−1, 0.6456 cm3·g−1, respectively. Further increase in Ce/Ti molar ratio to 0.8 caused the BET surface area and pore volume to decrease slightly but remain higher than that of Fe(0.2)–Ti catalysts. These results clearly indicated that Ce doping enhanced the dispersion of active metal oxides and thus increased the specific area and pore volume of the catalysts (as further confirmed by the XRD results discussed below). Variations in catalytic activity were basically consistent with the surface area variations of the catalysts, especially the pore volume, suggesting that the surface area and pore volume of catalysts are closely related with their catalytic activity. Larger surface area and pore volume provide more active sites for the SCR reaction and thus adsorb more reactant molecules, which promote the reaction and result in the favorable catalytic activity we observed.

2.2.2. XRD Results

Figure 5 shows XRD patterns of different Fe(0.2)–Ce(x)–Ti catalysts (x = 0, 0.02, 0.05, 0.2, 0.4, 0.8). Apparent diffraction peaks corresponding to crystallite Fe2O3 and TiO2 were observed in the Fe(0.2)–Ti catalysts without Ce doping. After Ce doping (Ce/Ti molar ratio = 0.02), conversely, the intensity of Fe2O3 and TiO2 diffraction peaks decreased and no visible peaks attributed to Ce were detected, indicating that the growth of crystallite Fe2O3 and TiO2 was strongly suppressed by the introduction of Ce. With further increase in Ce load (Ce/Ti molar ratio = 0.05, 0.2, 0.4, 0.8), the intensity of diffraction peaks gradually decreased until no visible Fe, Ce, or Ti species phases could be observed, suggesting that the Fe, Ce, and Ti oxides were highly dispersed on the catalyst surface or at least that its particle size was outside the XRD detection limit [8,19]. In brief, these results showed that Ce doping inhibits the crystallinity of metal oxides and enhances the dispersion of active species on the catalyst surface, which is beneficial as far as increasing the surface area and active sites to promote catalytic activity in SCR reactions [4,14]. This is consistent with the BET and catalytic property testing results discussed above.

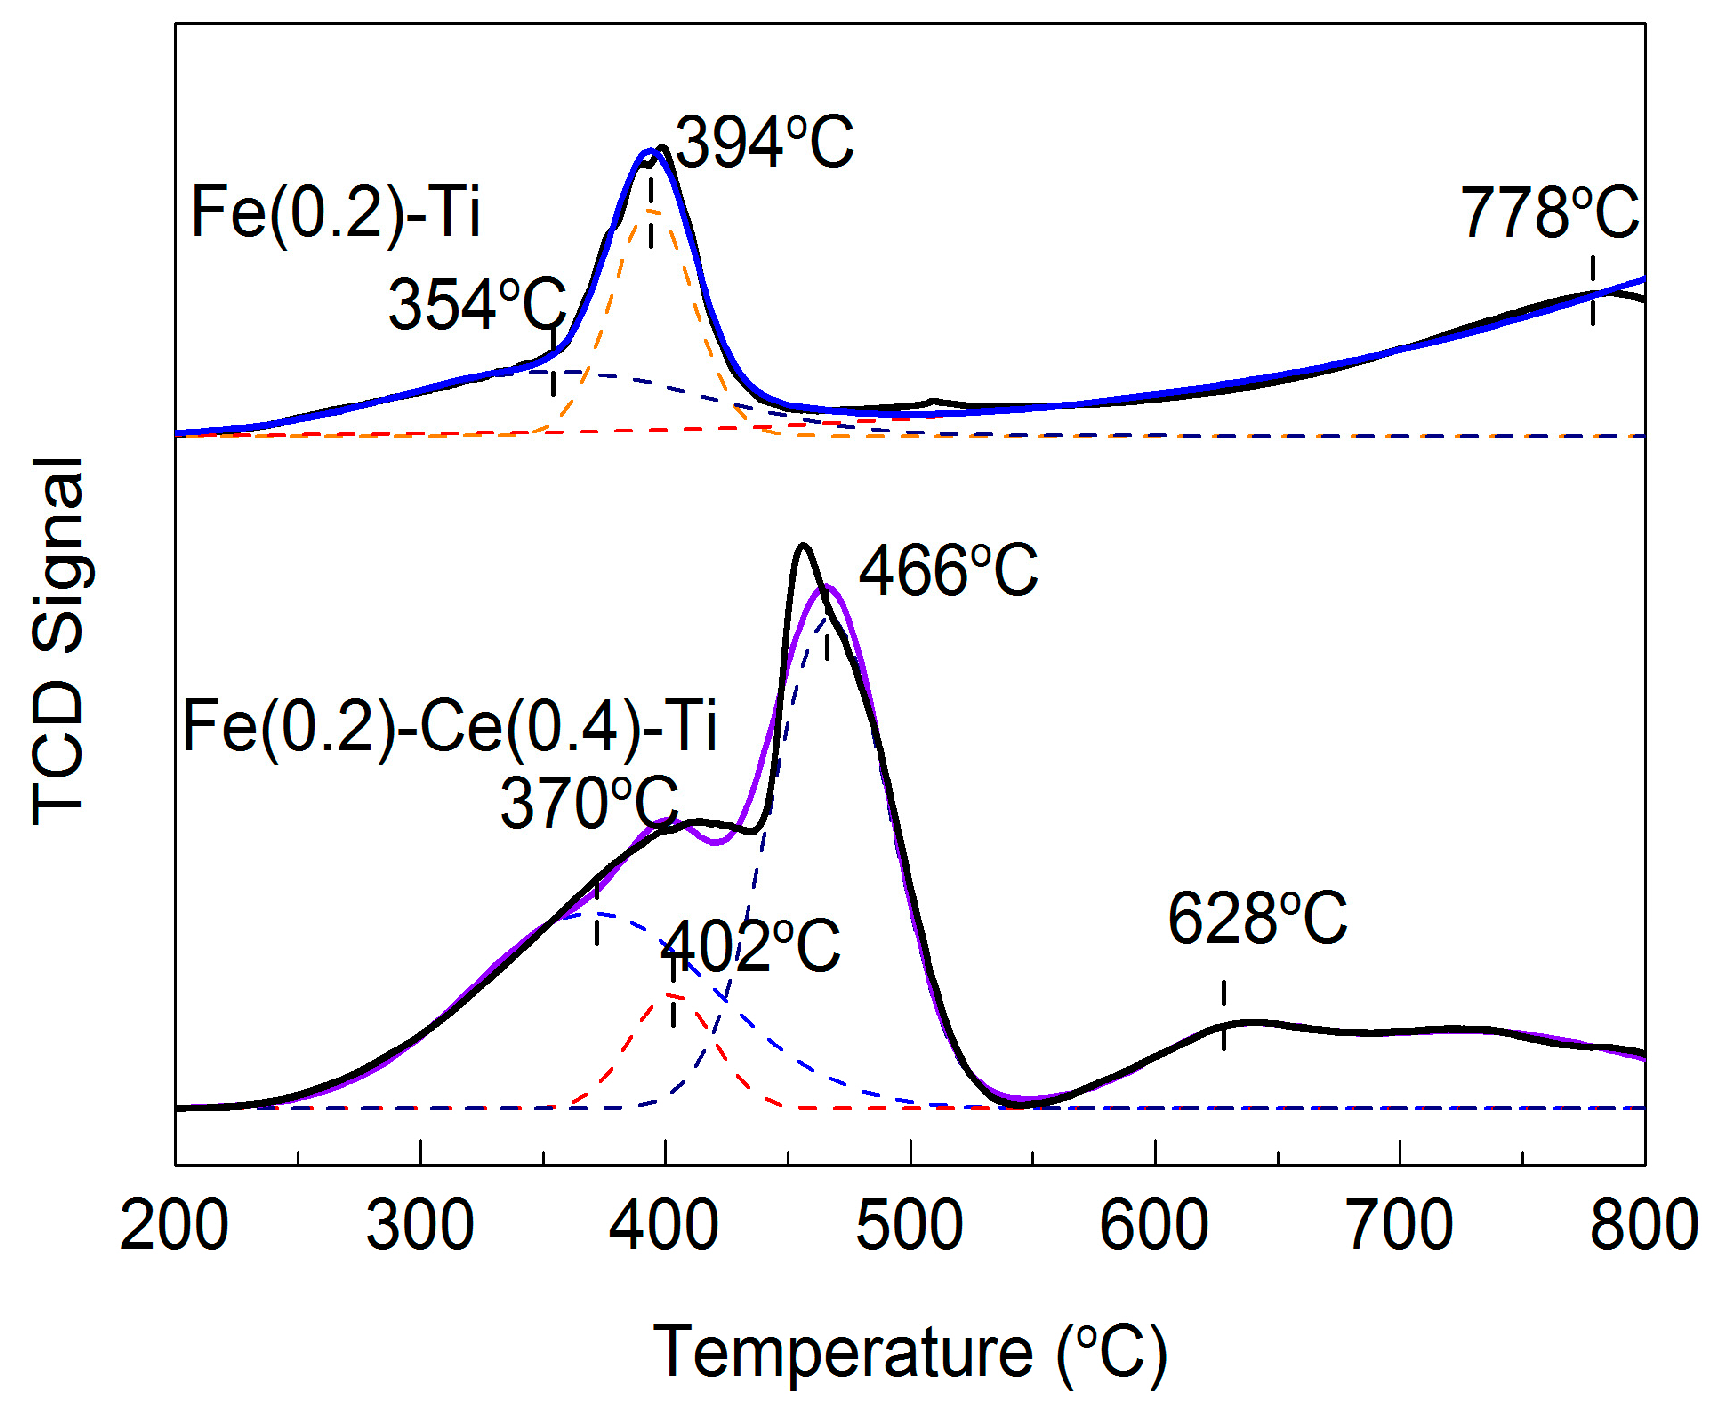
2.2.3. H2-TPR Results

It is commonly accepted that the redox property of catalysts is an important factor in terms of SCR reactions, so we utilized H2-TPR characterization to investigate the effect of Ce doping on catalyst redox properties (Figure 6). For Fe(0.2)–Ti catalysts, three deconvoluted reduction peaks were displayed in the temperature range of 200–800 °C, reflecting the reductive nature of the iron species. The reduction peaks centered at 354 and 394 °C, which indicated greater intensity, can be assigned to the reduction of Fe2O3 to Fe2+ [5,22,23]. The splitting signal we detected may have been due to the various interactions of Fe with Ti or the reduction of Fe3+ located in different sites within the catalyst structure [22]. The third reduction peaks, which showed less intensity and appeared at 778 °C, were attributed to the reduction of Fe2+ to Fe0 [5,19]. After Ce doping, the H2-TPR profile of Fe(0.2)–Ce(0.4)–Ti catalysts showed enhanced reduction peaks. The reduction peaks at 370 °C and 402 °C, which were similar to that of Fe(0.2)–Ti catalysts, were attributed to the reduction of Fe2O3 to Fe2+ while the peaks at 466 °C can be regarded as the reduction of the uppermost layer of Ce4+ to Ce3+ [23,24,25]. The broad reduction peaks at 628 °C can potentially be ascribed to the reduction of Fe2+ to Fe0 and the deeper interior of CeO2 and bulk CeO2 [4,25,26].
Compared to the H2-TPR results of Fe(0.2)–Ti and Fe(0.2)–Ce(0.4)–Ti catalysts, the total reduction peak areas of Fe(0.2)–Ce(0.4)–Ti catalysts were much larger than those of Fe(0.2)–Ti catalysts, especially at low temperatures (<550 °C). This indicated that the Fe(0.2)–Ce(0.4)–Ti catalysts had more reductive species and that more chemisorbed oxygen formed on the catalyst surface after Ce doping (Table 2), which benefited the SCR reaction [19,27,28]. In addition to the enhanced reduction peak areas of the catalyst, the reduction peak of Fe2+ to Fe0 shifted to the lower temperature region—this reflects a strong interaction between Fe and Ce species (as further confirmed by the XPS results shown below) [4]. Considering also the NO + O2 and NO + NH3 + O2 reaction results, this may have been due to the fact that the improved redox properties of Fe(0.2)–Ce(0.4)–Ti catalysts favored the occurrence of a fast SCR reaction, thus enhancing the NO conversion of Fe(0.2)–Ce(0.4)–Ti catalysts [29].

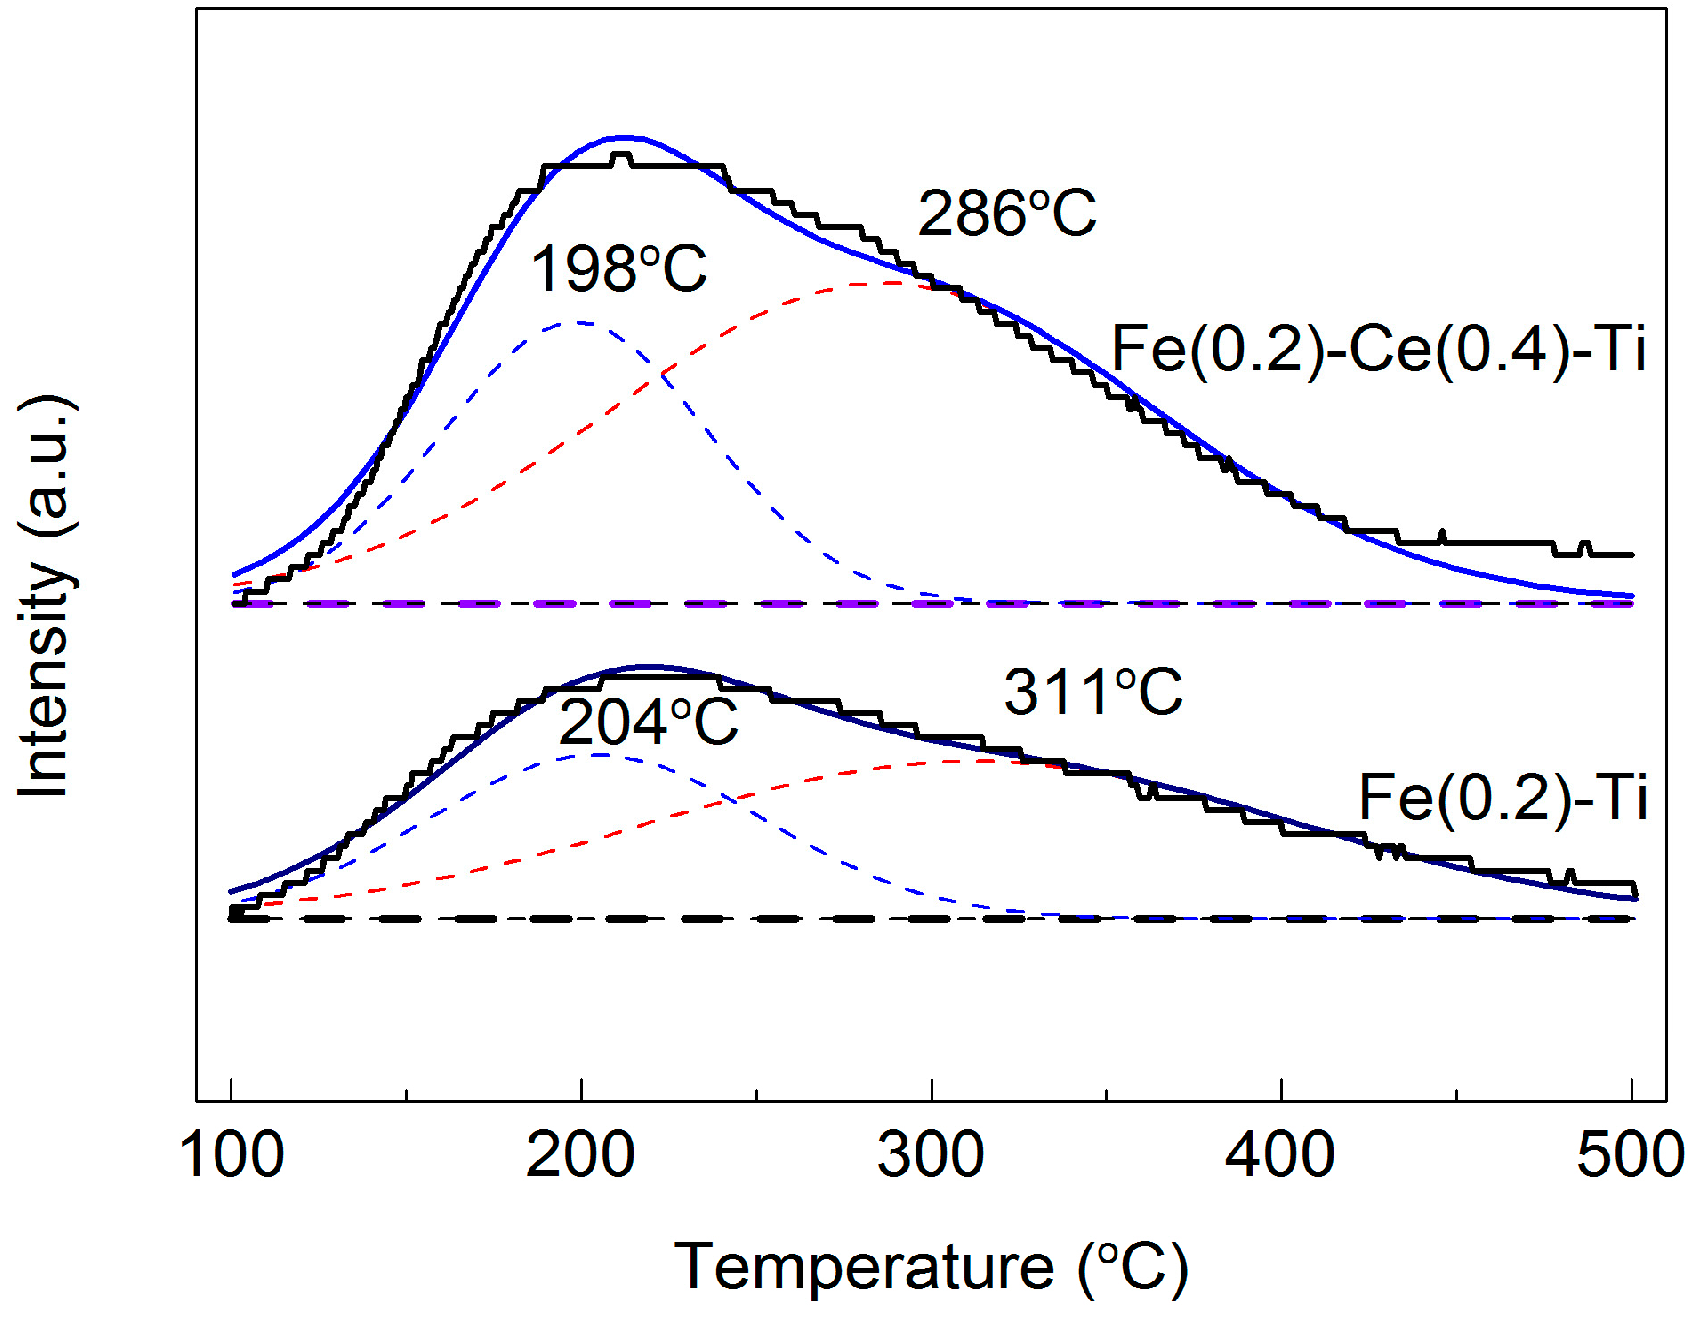
2.2.4. NH3-TPD Results
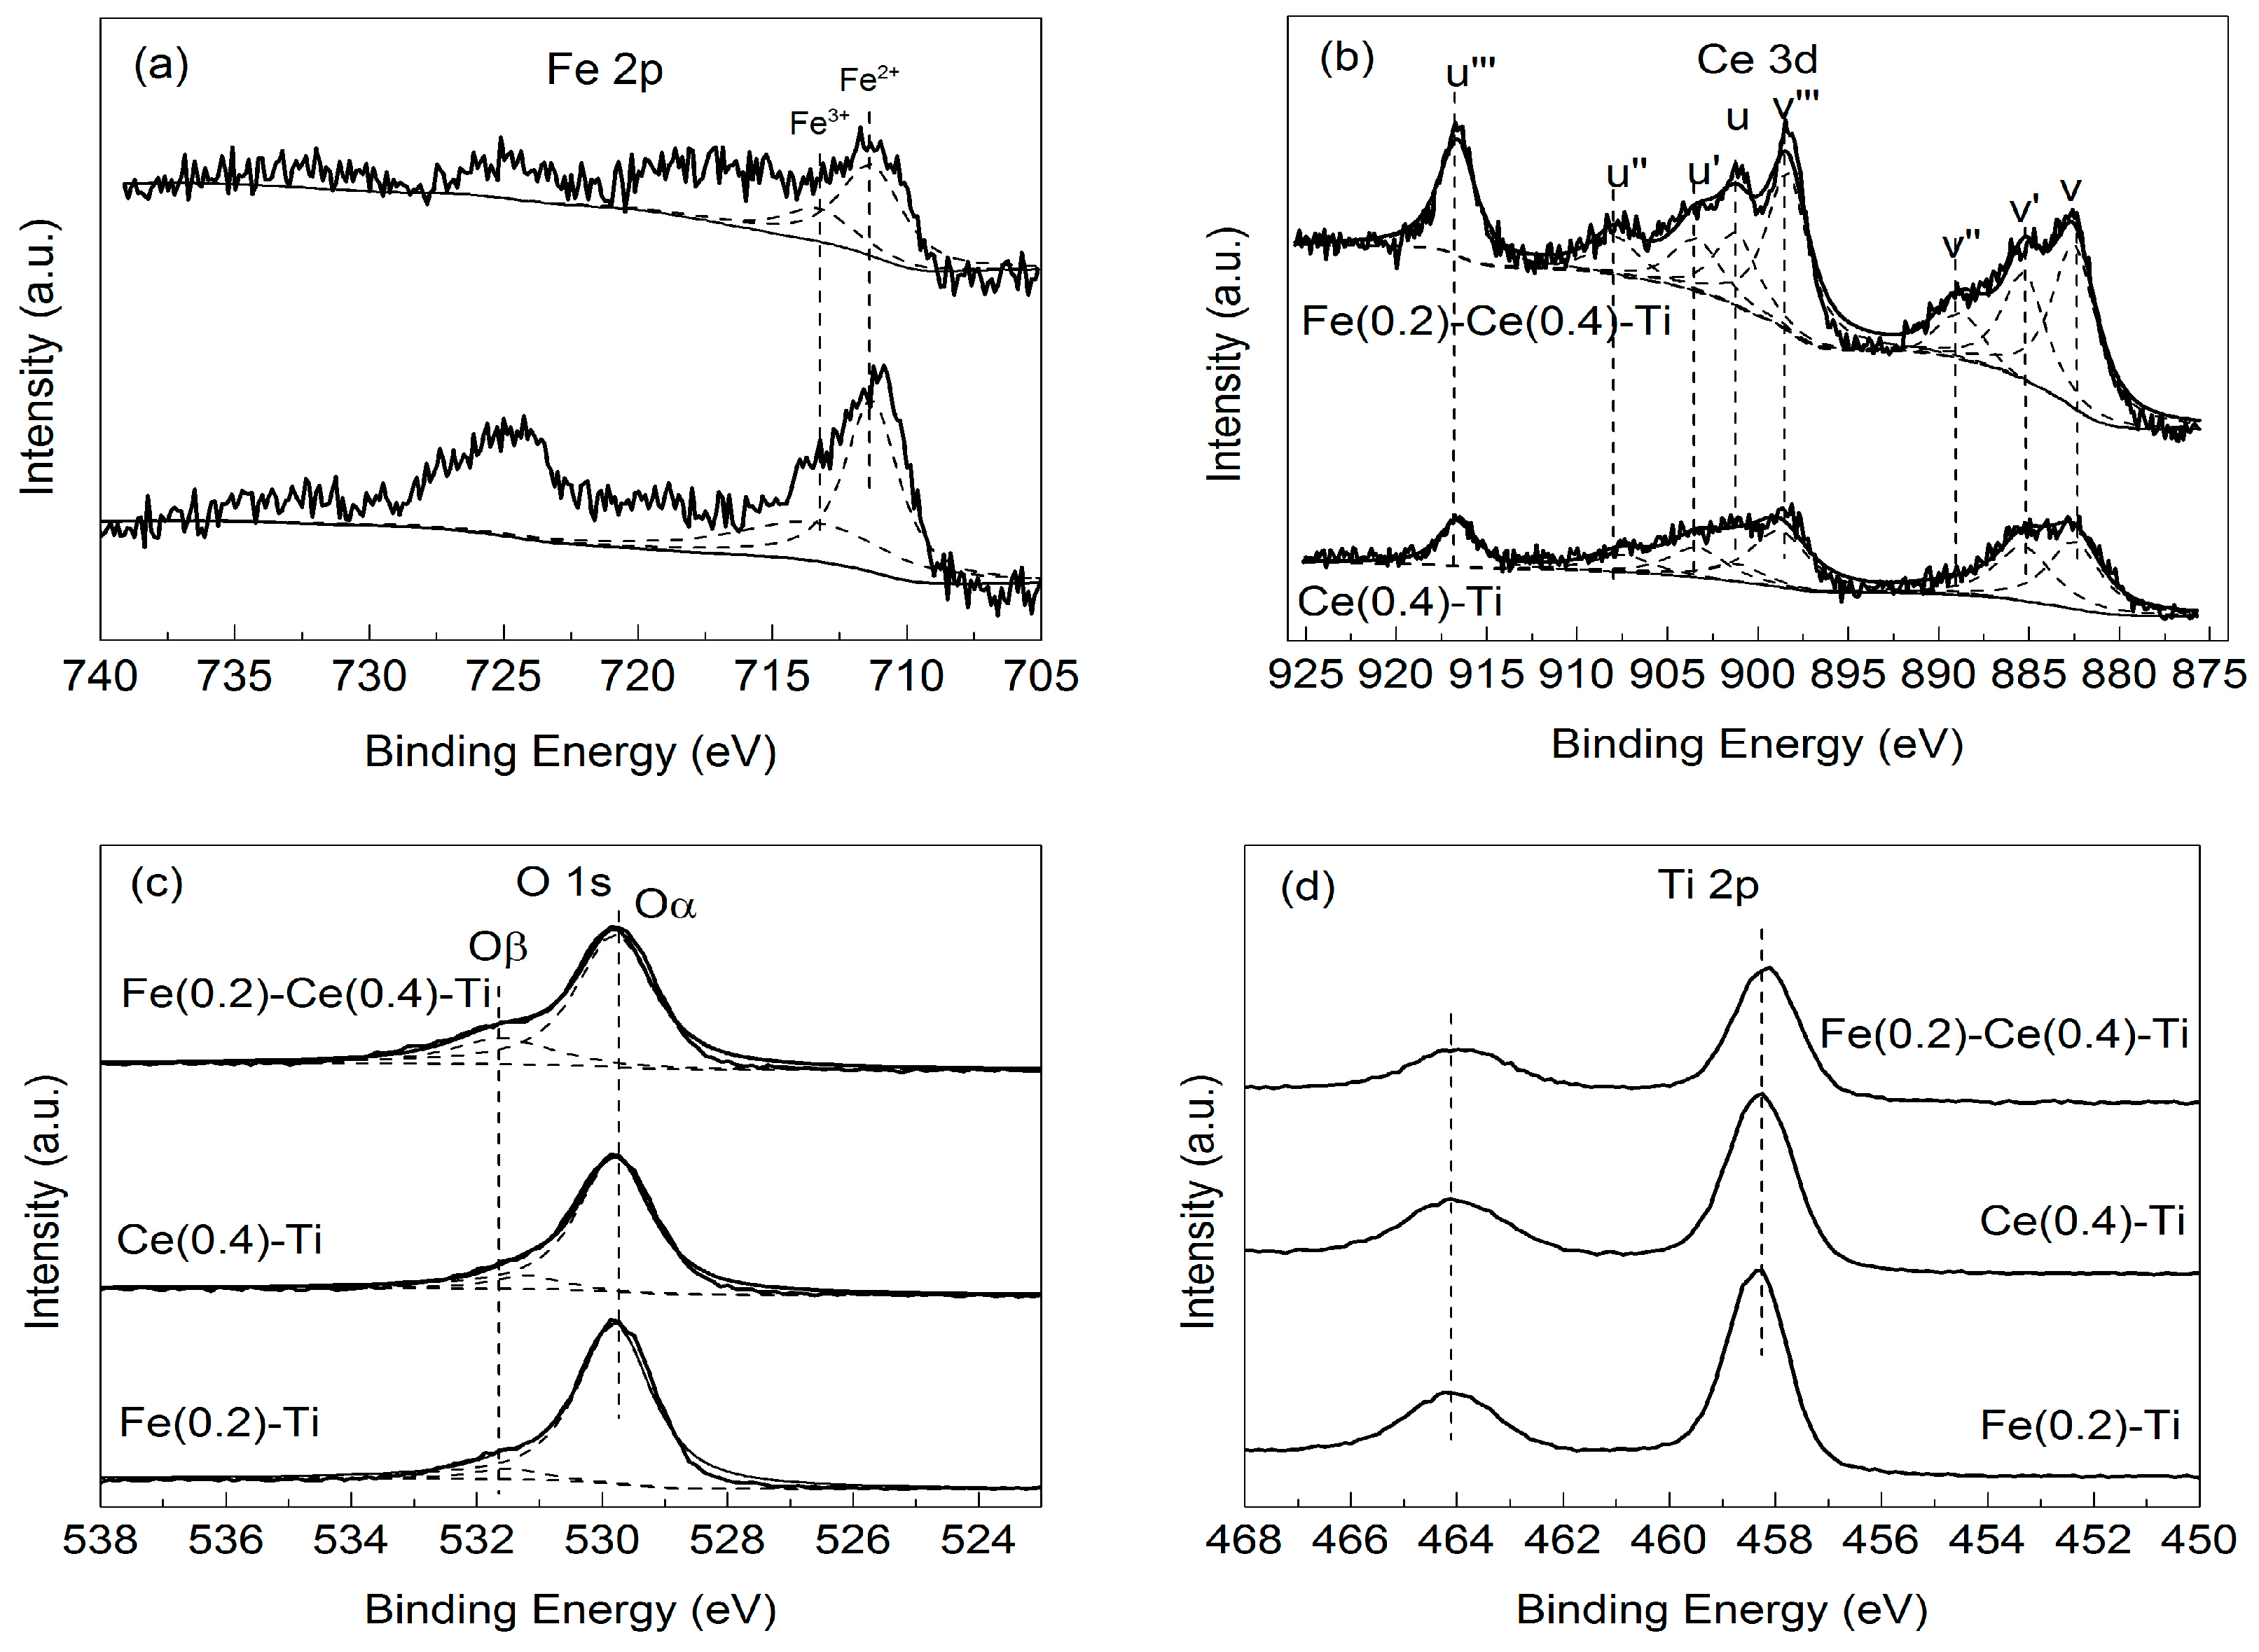
NH3-TPD analysis was conducted to evaluate the effect of Ce doping on the surface acidity of the catalysts. The results are shown in Figure 7. The shape of the Fe(0.2)–Ti and Fe(0.2)–Ce(0.4)–Ti catalyst NH3-TPD curves were similar, and the TPD curves both could be fitted into two peaks. The peaks of Fe(0.2)–Ti and Fe(0.2)–Ce(0.4)–Ti catalysts centered at 204 and 198 °C, respectively, were attributed to NH3 adsorption bounded to weak acid sites while peaks centered at 311 and 286 °C were ascribed to NH3 adsorption from medium and strong acid sites [1,23,30]. Compared to the TPD curves of Fe(0.2)–Ti and Fe(0.2)–Ce(0.4)–Ti catalysts, the peak area significantly increased after the Ce doping. This indicated that Ce doping enhanced the amount of acid sites over the Fe(0.2)–Ce(0.4)–Ti catalysts due to the increase in specific area and new acid sites provided by Ce, both of which favored the SCR reaction.

2.2.5. XPS Results

XPS measurement was carried out to observe the valence state and element content on catalyst surfaces. The photoelectron spectra of Fe 2p, Ce 3d, and O 1s are shown in Figure 8; the surface atomic concentrations, ratios of Fe3+/(Fe2+ + Fe3+) and Ce4+/Ce3+, and different oxygen species obtained via peak fitting are summarized in Table 2.
The results of Fe 2p spectra for Fe(0.2)–Ti and Fe(0.2)–Ce(0.4)–Ti catalysts are displayed in Figure 8a. The binding energies of Fe 2p3/2 for Fe(0.2)–Ti and Fe(0.2)–Ce(0.4)–Ti catalysts were both located at about 711.5 eV and could be separated into two peaks corresponding to the iron in Fe2+ and Fe3+, respectively [4,5]. This observation suggested that Fe2+ and Fe3+ coexisted on the surface of the two catalysts. The relative contents of Fe2+ and Fe3+ were calculated and the ratios of Fe3+/(Fe2+ + Fe3+) were summarized as listed in Table 2, where it the ratio of Fe3+/(Fe2+ + Fe3+) for Fe(0.2)–Ti catalyst is reported as 39.49% but only 29.22% for Fe (0.2)–Ce(0.4)–Ti catalyst. In effect, Ce doping decreased the relative percentage of Fe3+ species on the catalyst surface. The Fe/Ti atomic ratio for Fe(0.2)–Ti catalyst was 0.264; after Ce doping, it increased to 0.303. This indicates that there was a synergistic effect between Fe and Ce and that Ce doping promoted the accumulation of Fe on the catalyst surface.
As listed in Table 2, the proportions of Fe3+ and Ce3+ both decreased after Ce doping while the content of surface adsorbed oxygen increased. Moreover, compared to the binding energy (BE) values of Fe 2p for Fe(0.2)–Ti catalyst, the BE values of Fe 2p for Fe(0.2)–Ce(0.4)–Ti catalyst shifted to lower values. These results can likely be attributed to the synergistic interaction of Fe and Ce via redox equilibrium of Fe3+ + Ce3+ ↔ Fe2+ + Ce4+ [28]. The redox couples between Fe3+/Fe2+ and Ce4+/Ce3+ may have enhanced the redox cycle to promote the formation of oxygen vacancies, ultimately benefiting the formation of surface adsorbed oxygen [16].
Figure 8b displays the Ce 3d XPS spectra of the Ce(0.4)–Ti and Fe(0.2)–Ce(0.4)–Ti catalysts. The bands labeled u and v were attributed to 3d3/2 and 3d5/2, respectively; the bands labeled u’’, v’’, u’’’, and v’’’ were ascribed to Ce4+, while those labeled u’ and v’ were assigned to Ce3+ [29]. These results suggested that both Ce4+ and Ce3+ coexisted on the surface of catalyst. The ratios of Ce4+/Ce3+ for Ce(0.4)–Ti and Fe(0.2)–Ce(0.4)–Ti catalysts as-calculated via peak area integration were 2.23 and 3.43, respectively (Table 2). This demonstrates that the Ce4+ oxidation state was the dominant state of Ce on the surface of the catalysts. Combined with the catalytic property results shown in Figure 3, the coexistence of Ce4+ and Ce3+ on the surface catalyst enabled the process of oxygen storage and release, which was beneficial to the oxidation of NO to NO2 and generated a fast SCR reaction; these factors altogether enhanced the catalytic activity in SCR [13]. The concentration of Ce for Ce(0.4)–Ti was only 1.94% but was 4.50% for Fe(0.2)–Ce(0.4)–Ti catalyst. The greatly increased concentration of Ce on the catalyst surface further verifies that there was interaction between Fe and Ce, which promoted the migration of Ce from the body to the surface of the catalyst.
The XPS spectra of O 1s for the Fe(0.2)–Ti, Ce(0.4)–Ti, and Fe(0.2)–Ce(0.4)–Ti catalysts are shown in Figure 8c. The O 1s spectra of the three catalysts were all easily fitted with two peaks: the peak centered at about 529.8 eV (denoted as Oα) corresponds to lattice oxygen while the peak around 531.5 eV (denoted as Oß) can be assigned to surface adsorbed oxygen species [28]. The ratios of Oß/(Oα + Oß) were 5.9%, 8.5% and 20.1%, respectively, for the Fe(0.2)–Ti, Ce(0.4)–Ti and Fe(0.2)–Ce(0.4)–Ti catalysts; clearly, the Fe(0.2)–Ce(0.4)–Ti catalyst exhibited the highest Oß/(Oα + Oß) ratio. More surface adsorbed oxygen species were formed on the surface of the Fe(0.2)–Ce(0.4)–Ti catalyst, which contributed to the oxidation of NO to NO2 and caused the fast SCR reaction. According to these and the results shown in Figure 3 and Figure 4, the synergetic interaction between Fe and Ce activated more O2 molecules to react with NO and thus enhanced the SCR quality due to the fast SCR reaction.
Figure 8d shows the XPS spectra of Ti 2p for the three catalysts, all of which displayed two peaks (Ti 2p3/2 and Ti 2p1/2). The binding energies of Ti 2p3/2 and Ti 2p1/2 for the three catalysts were all centered at about 458.4 and 464.1 eV, respectively, indicating that Ti was in 4+ oxidation state on the catalyst surface [31,32]. Further, the binding energies of Ti 2p remained practically unchanged, providing more evidence that the increased Ce4+ was due to the synergistic interaction of Fe and Ce species via redox equilibrium of Fe3+ + Ce3+ ↔ Fe2+ + Ce4+ and that the synergistic effect between Fe and Ce species was dominant.

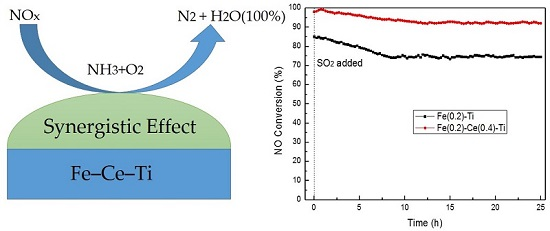
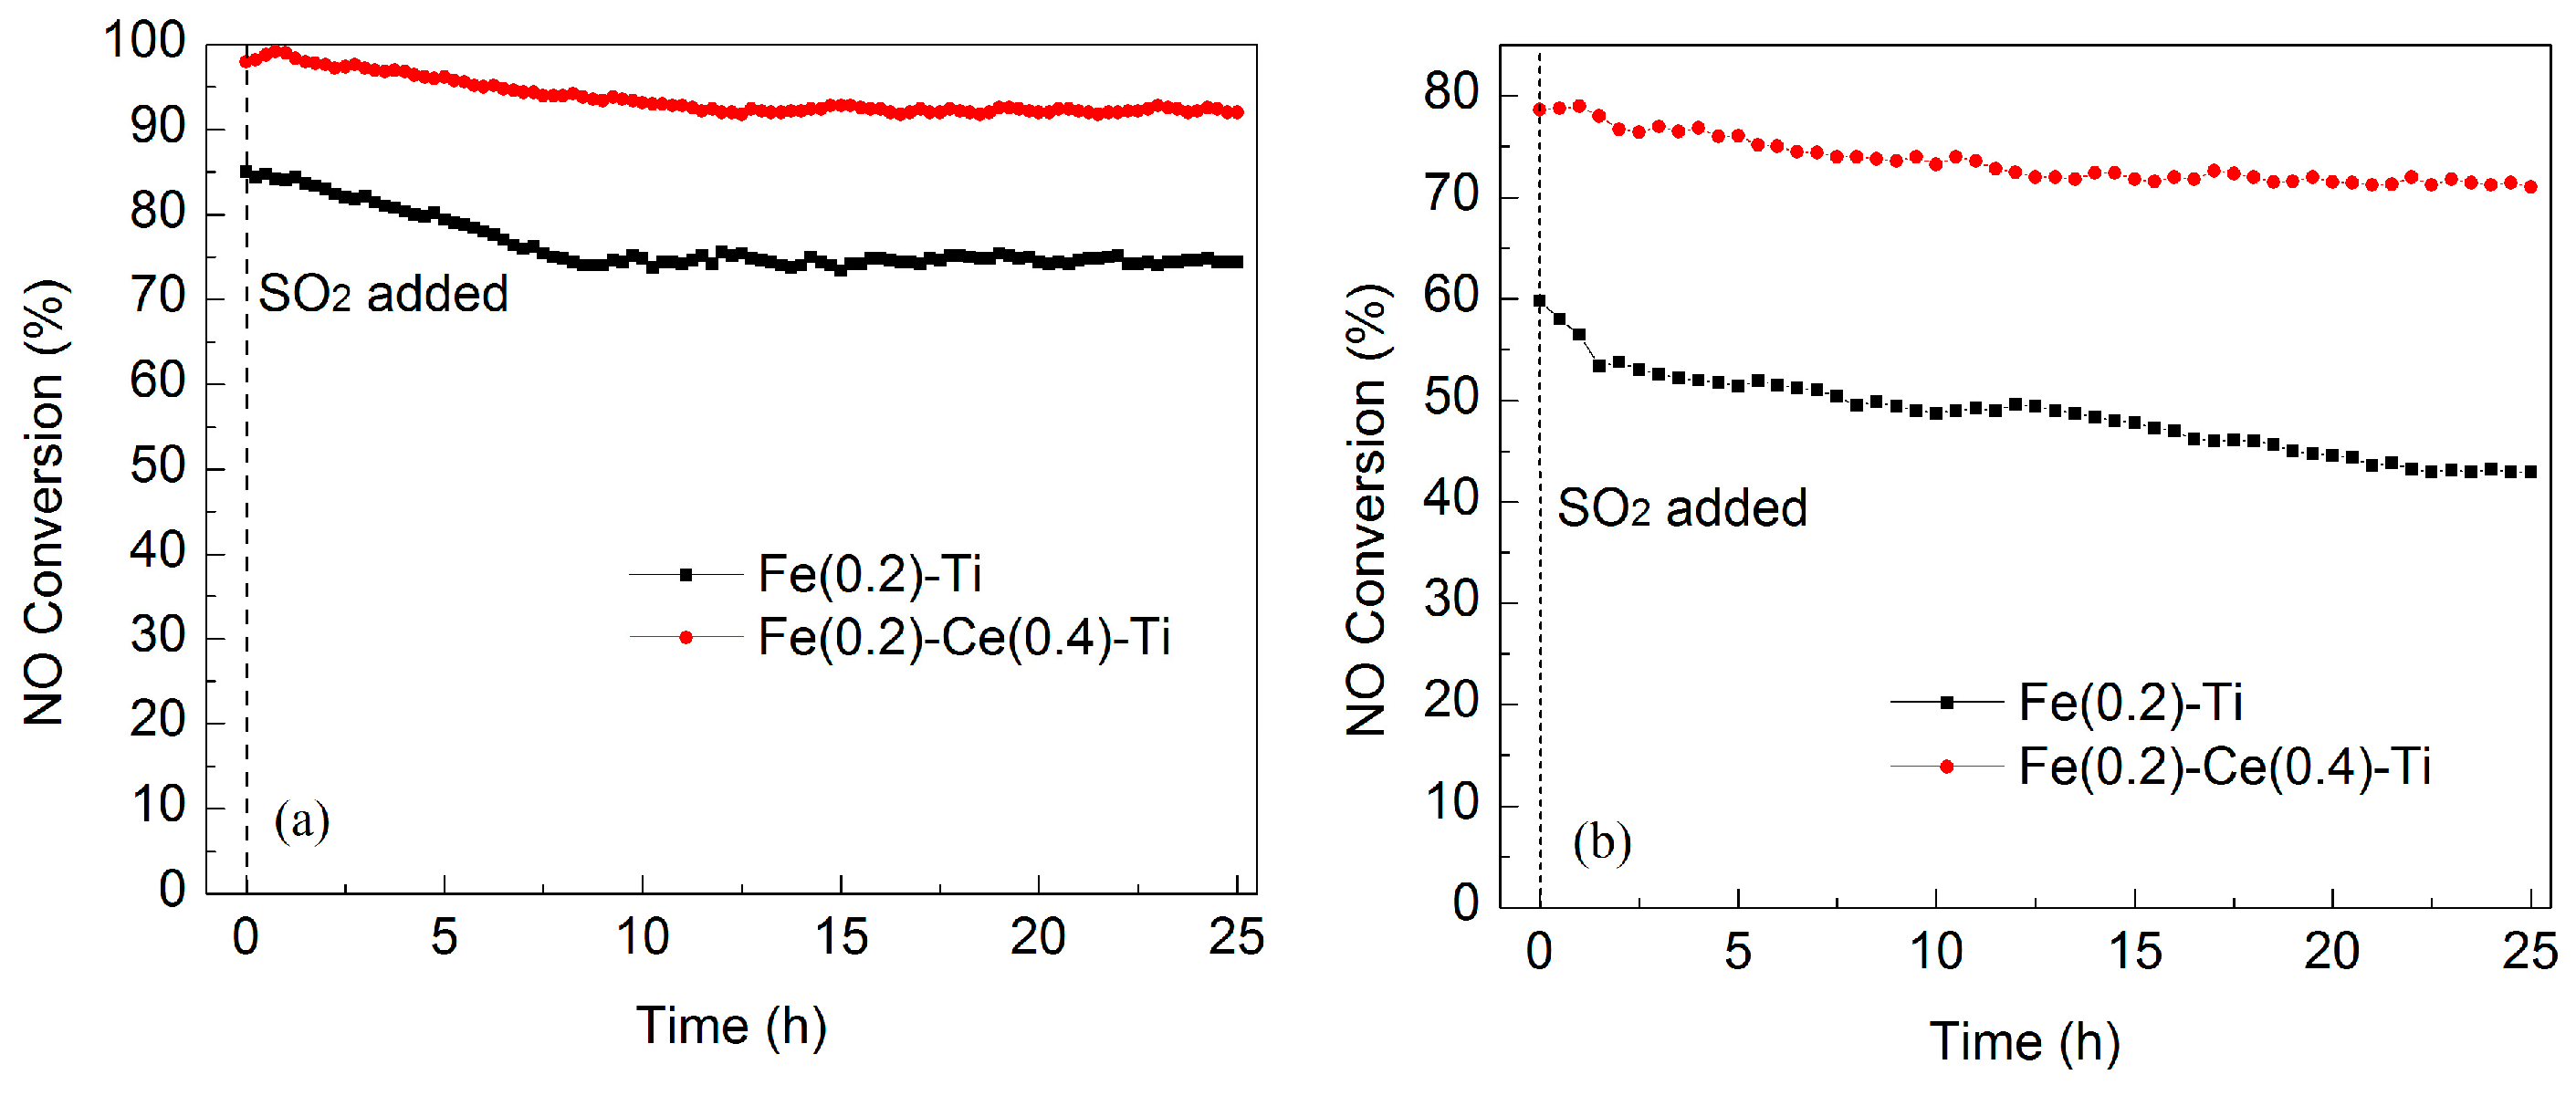
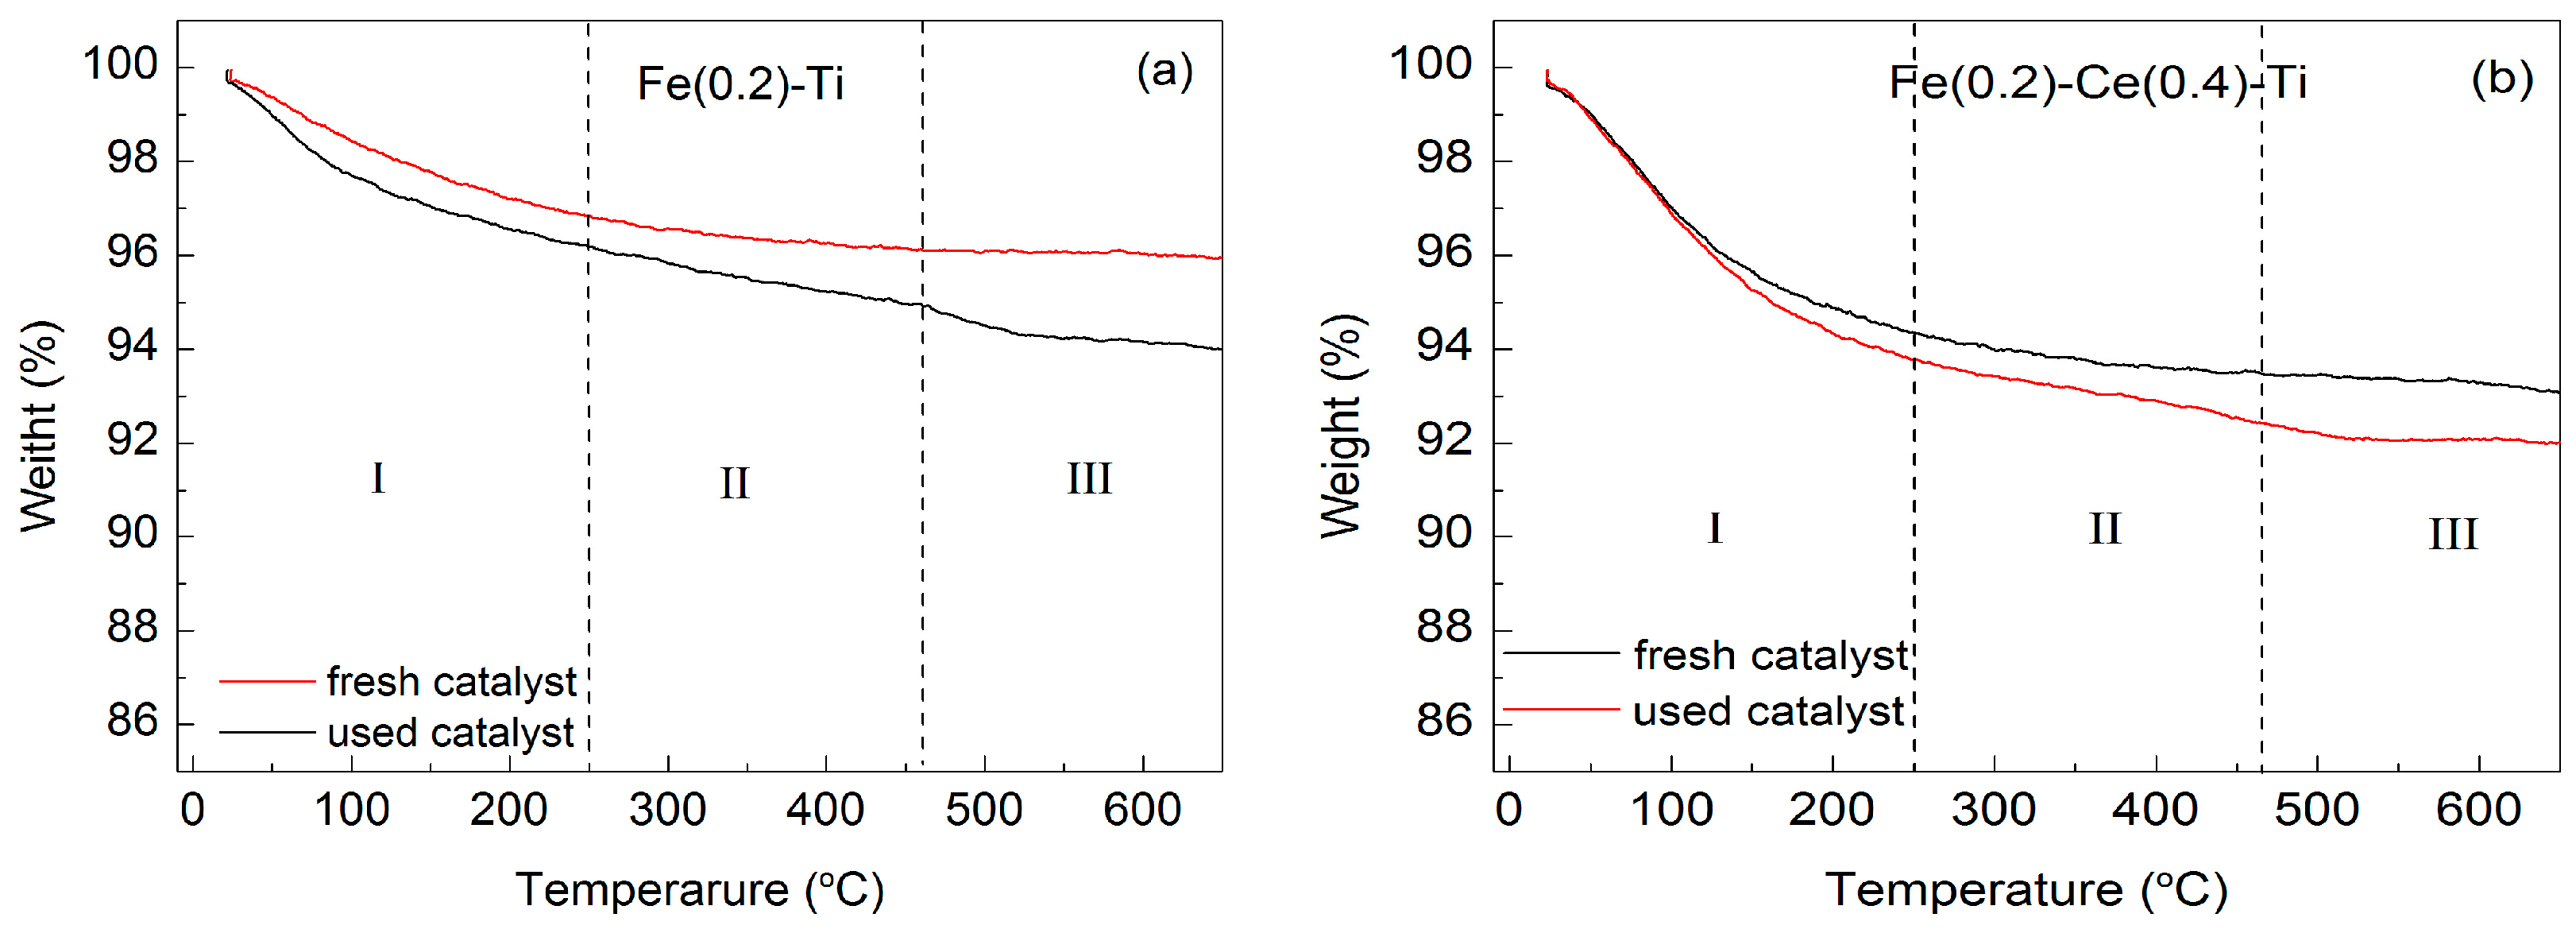
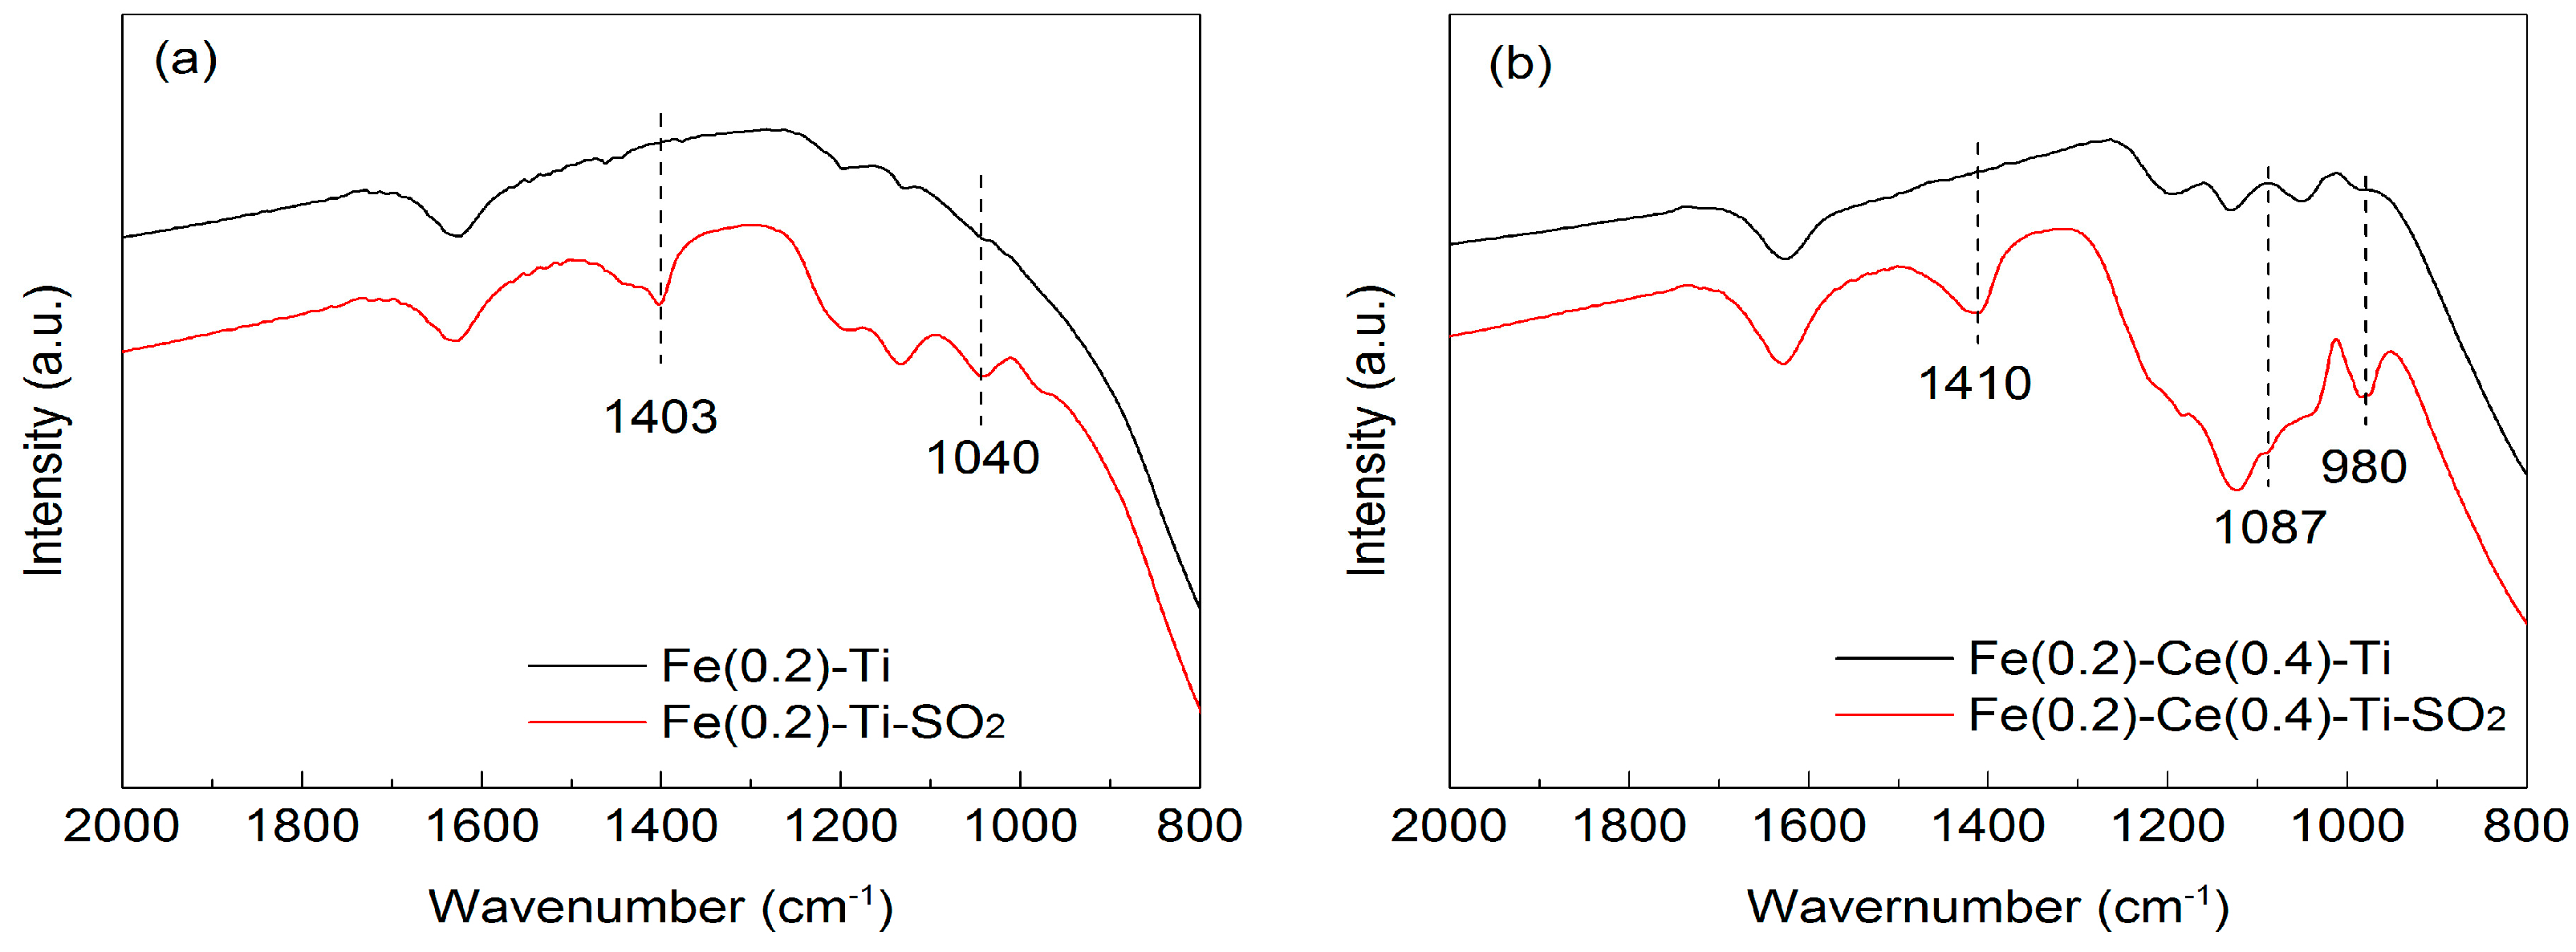
2.3. Influence of SO2 and H2O on SCR Activity of Catalysts

It must be noted that there are traces of SO2 remaining in the flue gases even after desulfurization, because the catalyst may be deactivated in the presence of SO2. Therefore, it is of great importance to investigate the influence of SO2 on the catalytic activity of catalyst [33].
The influence of SO2 on catalytic activity of Fe(0.2)–Ti and Fe(0.2)–Ce(0.4)–Ti catalysts at 270 °C under different GHSVs is shown in Figure 9. As shown in Figure 9a, the steady state NO conversion of Fe(0.2)–Ti catalyst was 85% in the absence of SO2 with a GHSV of 90,000 h−1. The NO conversion gradually decreased to about 75% in 7.5 h after 200 ppm SO2 was introduced into the feed. And finally, NO conversion reached stability at about 74.4%. For the Fe(0.2)–Ce(0.4)–Ti catalysts, the initial NO conversion was 98% and increased slightly within the first 1.5 h after SO2 was introduced. The NO conversion then decreased slightly and reached stability at 92% after 25 h of SO2 exposure. With a GHSV of 150,000 h−1 (at this GHSV value, NO conversion of catalysts was no more than 80% at 270 °C), NO conversion of both catalysts exhibited a further decrease in the presence of 200 ppm SO2, which is shown in Figure 9b. Compared to that of Fe(0.2)–Ti catalyst, the loss of activity for Fe(0.2)–Ce(0.4)–Ti catalyst was less under different GHSVs and the NO conversion still exceeded 92% with 25 h, 200 ppm SO2 treatment with a GHSV of 90,000 h−1, suggesting that the Fe(0.2)–Ce(0.4)–Ti catalyst had better tolerance to SO2 after Ce doping.
The effect of H2O and the synergistic effect of H2O and SO2 on catalytic activity of Fe(0.2)–Ce(0.4)–Ti catalysts with a GHSV of 90,000 h−1 at 270 °C were investigated and the results are shown in Figure 10. Before the H2O was added, the SCR reaction had stabilized for 0.5 h at 270 °C. When 5 vol. % H2O was introduced into the reactant gases, NO conversion gradually decreased to about 94% from its original level and then it almost kept stable. After H2O was cut off, NO conversion basically restored to 96.3%, which was nearly its original level. This indicated the Fe(0.2)–Ce(0.4)–Ti catalysts exhibited good resistance to H2O at 270 °C and the inhibiting effect of H2O on catalysts activity was reversible. When 200 ppm SO2 and 5 vol. % H2O were simultaneously introduced into the reactant gases at 270 °C, the NO conversion slowly decreased to about 90% in about 2 h and then it nearly stayed at this level. When SO2 and H2O were removed, the NO conversion showed some increase but still could not reach its original level, which indicated such effect was irreversible. The reasons for this may be due to the fact that the competitive adsorption between H2O and reaction gases on active sites may happen, which would lead to the decrease of catalyst activity. When H2O was cut off, the effect was basically over and the NO conversion could return to its original level. When H2O and SO2 were simultaneously added, some sulfate species may be formed on the catalysts’ surface in the presence of H2O and SO2, which would indirectly or directly decrease the catalysts’ activity to some extent. The most important observation was that this effect could not be eliminated thoroughly even if the H2O and SO2 were removed.
Thermogravimetric analysis (TGA) was used to investigate the surface species of the sample catalysts. The TGA spectra of the fresh and used Fe(0.2)–Ti and Fe(0.2)–Ce(0.4)–Ti catalysts are shown in Figure 11. Compared to that of fresh catalysts, which only showed one instance of weight loss due to the release of water, the weight loss of used Fe(0.2)–Ti and Fe(0.2)–Ce(0.4)–Ti catalysts were both divisible into three steps where two new weight loss instances were observed at higher temperatures. Step I appeared between room temperature and 250 °C due to the physical desorption of water [34,35]; Step II was observed from 250 to 470 °C and corresponds to the decomposition of ammonium sulfate formed during SCR reaction after SO2 addition on the catalyst surface [11,36]. The last step, above 470 °C, may have been the decomposition of metal sulfates during the heating process [11,37,38]. TGA results clearly indicated that sulfate species were formed on the catalyst surface.
FT-IR analysis provided further evidence for sulfate species formation; the FT-IR spectra of the fresh and used Fe(0.2)–Ti and Fe(0.2)–Ce(0.4)–Ti catalysts are displayed in Figure 12. In comparison with the fresh catalysts, the used Fe(0.2)–Ti and Fe(0.2)–Ce(0.4)–Ti catalysts exhibited new bands at 1410, 1403, 1087, 1040, and 980 cm−1. The strong bands at 1410 and 1403 cm−1 were assigned to NH4+ species [37], while the bands at 1087, 1040, and 980 cm−1 were due to SO42− ions [34,39,40]. These results were consistent with TGA analysis, which likewise indicated that sulfates species were formed on the catalyst surface.
Based on the results of TGA and FT-IR, the decrease of catalysts’ activity had two likely causes: (1) the ammonium sulfate formed during the reaction was deposited on the catalyst surface and covered the active sites, blocking the active channels of the catalyst; and (2) the active components were sulfated by SO2, rendering them unable to generate effective intermediate species and thus inhibiting the SCR reaction [38,41].

3. Materials and Methods

3.1. Catalysts Preparation

The Ce-doped Fe–Ti catalysts were prepared via co-precipitation method. First, 2.68 g Fe(NO3)3·9H2O (Aladdin, Shanghai, China), 5.78 g Ce(NO3)3·6H2O (Aladdin, Shanghai, China), and 8 g Ti(SO4)2 (Sinopharm, Shanghai, China) were added to a 150 mL beaker containing 60 mL deionized water, and the solution was stirred for 30 min. Ammonia solution (25%, AR, Sinopharm, Shanghai, China) was gradually added with continuous stirring until the pH reached 10, followed by stirring for another 1 h. The resulting precipitate was separated by filtration and washed thoroughly by centrifugation with deionized water, then the precipitate was collected and moved to an oven for drying at 120 °C for 12 h. The mixture was then ground and calcined in air at 500 °C for 4 h. Finally, the catalysts were compressed into tablet form and sieved to 40–60 mesh for testing and analysis. For convenience, the first catalyst was denoted as Fe(0.2)–Ce(0.4)–Ti. Catalysts Fe(0.02)–Ti, Fe(0.05)–Ti, Fe(0.1)–Ti, Fe(0.2)–Ti, Fe(0.4)–Ti, Ce(0.4)–Ti, Fe(0.2)–Ce(0.02)–Ti, Fe(0.2)–Ce(0.05)–Ti, Fe(0.2)–Ce(0.2)–Ti, and Fe(0.2)–Ce(0.8)–Ti were fabricated using the same method. The number in brackets represents the Fe/Ti and Ce/Ti molar ratio, respectively.

3.2. Catalysts Characterizations

The specific area, pore volume, and pore size distribution of the catalysts were measured according to N2 adsorption at 77 K by BET method in a Micrometrics ASAP-2020 analyzer (Micromeritics, Norcross, GA, USA). About 100 mg catalyst samples were used after pretreatment in 300 °C for 4 h in a N2/He mixture.
XRD analysis was carried out on a Philips X’pert Pro diffractometer (Philips, Eindhoven, Netherlands) with Ni-filtered Cu Kα radiation (0.15418 nm). The X-ray tube was operated at 40 kV and 40 mA.
H2-TPR experiments were conducted in a U-tube reactor (NJU, Nanjing, China) connected to a thermal conduction detector (TCD) using Ar–H2 (7.0% of H2 by volume, NJTQ, Nanjing, China) as the reducing mixture. Fifty milligram samples were used after pretreatment in N2 stream at 200 °C for 1 h before reduction. The reduction of the samples was recorded form room temperature to 800 °C at a heating rate of 10 °C·min−1.
NH3-TPD experiments were carried out on a Micromeritics AutoChem II 2920 analyzer (Micromeritics, Atlanta, GA, USA); the NH3 desorption was detected with a thermal conductivity detector (TCD). As is typically required for TPD, about a 100 mg sample was pretreated in N2 (40 mL·min−1) at 450 °C for 1 h and then treated with 1 vol. % NH3 (10 mL·min−1) at 100 °C for 1 h until saturation, then the sample was flushed with N2 at 100 °C for 1 h. TPD operation was then completed by heating the sample from 100 to 500 °C at a heating rate of 10 °C·min−1.
XPS measurements were read on a PHI 5000 Versa Probe system (ULVAC-PHI, Chigasaki, Japan) equipped with monochromatic Al Kα radiation (1486.6 eV). The samples were outgassed at room temperature in a ultrahigh-vacuum (UHV) chamber (<5 × 10⁻⁷ Pa) prior to data acquisition. The charging effect of samples was compensated for by C 1s binding energy value of 284.6 eV as an internal reference, which yielded BE values with an accuracy of ±0.1 eV.
TGA measurement was conducted on a Pyris 1 TGA (PerKinElmer, Inc., Boston, MA, USA) instrument with a heating rate of 20 °C·min−1 from room temperature to 650 °C, and FT-IR spectra were recorded in the range of 400–4000 cm−1 on a Nicolet NEXUS870 spectrometer (Nicolet Instruments Inc., Madison, WI, USA).

3.3. Catalytic Activity Measurements

The catalytic activity of the catalysts were measured in a fixed-bed quartz reactor tube with 100 mg samples. The reaction conditions were as follows: 500 ppm NO, 500 ppm NH3, 5 vol. % O2, 5 vol. % H2O (when used) and 200 ppm SO2 (when used) with balance N2, and gas flow rate of 100 mL·min−1. Before catalytic activity measurement, the catalysts were pretreated in a high-purity N2 stream at 200 °C for 1 h and cooled to room temperature. Reaction gases were introduced into the reactor until the catalysts were saturated, then catalytic activity measurements were recorded at different temperatures. All the data were obtained with an online Thermofisher IS10 FT-IR spectrometer (Thermo Fisher Scientific, Madison, WI, USA) equipped with a gas cell (250 mL volume) once the SCR reaction reached a steady state.
The NO conversion was calculated by the following equation:
NO Conversion  = N O i n N O o u t N O i n × 100 %
where NOin and NOout are the inlet and outlet NO concentrations of the reactor, respectively.

4. Conclusions

In this study, we found that Ce doping can markedly enhance the catalytic activity and SO2-resistance of Fe–Ti catalysts. The Fe(0.2)–Ce(0.4)–Ti catalyst exhibited more than 94% NO conversion in a wide temperature range (240–360 °C) and obtained 92% NO conversion in the presence of 200 ppm SO2 at 270 °C for 25 h. The reasons for the superior catalytic activity we observed were as follows.
(1)
The Fe(0.2)–Ce(0.4)–Ti catalyst prepared via co-precipitation had better texture compared to than Fe(0.2)–Ti catalyst, including high surface area and high dispersion of active components on the catalyst surface.
(2)
Doping Ce into Fe(0.2)–Ti catalyst improved its redox ability and greatly increased the amount of acid sites on the surface.
(3)
As Ce load increased, the proportion of Fe3+ and Ce3+ decreased while the content of surface-adsorbed oxygen increased, all due to the interaction between Fe and Ce species.
(4)
The decrease of catalyst activity caused by SO2 was likely due to the deposition of ammonium sulfate and the sulfation of active components during the SCR reaction.

Acknowledgments

This work was supported by the National High Technology Research and Development Program of China (863 Program) (2015AA03A401), and the National Natural Science Foundation of China (51276039, 21573105), and the Fundamental Research Funds for the Central Universities (020514380020, 020514380030), and Postdoctoral Science Foundation of Jiangsu Province, China (1501033A).

Author Contributions

X.W. conceived and designed the experiments; X.W. performed the experiments; L.Z., S.W., W.Z., S.Y. and Y.S. gave technical support and conceptual advice; X.W. wrote the paper; X.W. and L.D. revised the paper.

Conflicts of Interest

The authors declare no conflict of interest.

References

  1. Yang, R.; Huang, H.F.; Chen, Y.J.; Zhang, X.X.; Lu, H.F. Performance of Cr-doped vanadia/titania catalysts for low-temperature selective catalytic reduction of NOx with NH3. Chin. J. Catal. 2015, 36, 1256–1262. [Google Scholar] [CrossRef]
  2. Yi, T.; Zhang, Y.B.; Li, J.W.; Yang, X.G. Promotional effect of H3PO4 on ceria catalyst for selective catalytic reduction of NO by NH3. Chin. J. Catal. 2016, 37, 300–307. [Google Scholar] [CrossRef]
  3. Thirupathi, B.; Smirniotis, P.G. Nickel-doped Mn/TiO2 as an efficient catalyst for the low-temperature SCR of NO with NH3: Catalytic evaluation and characterizations. J. Catal. 2012, 288, 74–83. [Google Scholar] [CrossRef]
  4. Jiang, S.Y.; Zhou, R.X. Ce doping effect on performance of the Fe/β catalyst for NOx reduction by NH3. Fuel Process. Technol. 2015, 133, 220–226. [Google Scholar] [CrossRef]
  5. Feng, B.J.; Wang, Z.; Sun, Y.Y.; Zhan, C.H.; Tang, S.F.; Li, X.B.; Huang, X. Size controlled ZSM-5 on the structure and performance of Fe catalyst in the selective catalytic reduction of NOx with NH3. Catal. Commun. 2016, 80, 20–23. [Google Scholar] [CrossRef]
  6. Zhu, L.; Qu, H.X.; Zhang, L.; Zhou, Q.W. Direct synthesis, characterization and catalytic performance of Al-Fe-SBA-15 materials in selective catalytic reduction of NO with NH3. Catal. Commun. 2016, 73, 118–122. [Google Scholar] [CrossRef]
  7. Putluru, S.S.R.; Schill, L.; Jensen, A.D.; Siret, B.; Tabaries, F.; Fehrmann, R. Mn/TiO2 and Mn-Fe/TiO2 catalysts synthesized by deposition precipitation-promising for selective catalytic reduction of NO with NH3 at low temperatures. Appl. Catal. B 2015, 165, 628–635. [Google Scholar] [CrossRef]
  8. Qi, G.S.; Yang, R.T. Low-temperature selective catalytic reduction of NO with NH3 over iron and manganese oxides supported on titania. Appl. Catal. B 2003, 44, 217–225. [Google Scholar] [CrossRef]
  9. Zhou, G.Y.; Zhong, B.C.; Wang, W.H.; Guan, X.J.; Huang, B.C.; Ye, D.Q.; Wu, H.J. In situ DRIFTS study of NO reduction by NH3 over Fe-Ce-Mn/ZSM-5 catalysts. Catal. Today 2011, 175, 157–163. [Google Scholar] [CrossRef]
  10. Zhang, J.; Qu, H.X. Low-temperature selective catalytic reduction of NOx with NH3 over Fe-Cu mixed oxide/ZSM-5 catalysts containing Fe2CuO4 phase. Res. Chem. Intermed. 2015, 41, 4961–4975. [Google Scholar] [CrossRef]
  11. Wang, X.B.; Gui, K.T. Fe2O3 particles as superior catalysts for low temperature selective catalytic reduction of NO with NH3. J. Environ. Sci. 2013, 25, 2469–2475. [Google Scholar] [CrossRef]
  12. Shan, W.B.; Liu, F.D.; Yu, Y.B.; He, H. The use of ceria for the selective catalytic reduction of NOx with NH3. Chin. J. Catal. 2014, 35, 1251–1259. [Google Scholar] [CrossRef]
  13. Shen, B.X.; Wang, F.M.; Liu, T. Homogeneous MnOx-CeO2 pellets prepared by a one-step hydrolysis process for low-temperature NH3-SCR. Powder Technol. 2014, 253, 152–157. [Google Scholar] [CrossRef]
  14. Shen, B.X.; Yao, Y.; Ma, H.Q.; Liu, T. Ceria modified MnOx/TiO2-pillared clays catalysts for the selective catalytic reduction of NO with NH3 at low temperature. Chin. J. Catal. 2011, 32, 1803–1811. [Google Scholar] [CrossRef]
  15. Shen, B.X.; Liu, T.; Zhao, N.; Yang, X.Y.; Deng, L.D. Iron-doped Mn-Ce/TiO2 catalyst for low temperature selective catalytic reduction of NO with NH3. J. Environ. Sci. 2010, 22, 1447–1454. [Google Scholar] [CrossRef]
  16. Zhu, L.; Zhang, L.; Qu, H.X.; Zhong, Q. A study on chemisorbed oxygen and reaction process of Fe-CuOx/ZSM-5 via ultrasonic impregnation method for low-temperature NH3-SCR. J. Mol. Catal. A 2015, 409, 207–215. [Google Scholar] [CrossRef]
  17. Peng, Y.; Yu, W.W.; Su, W.K.; Huang, X.; Li, J.H. An experimental and DFT study of the adsorption and oxidation of NH3 on a CeO2 catalyst modified by Fe, Mn, La and Y. Catal. Today 2015, 242, 300–307. [Google Scholar] [CrossRef]
  18. Li, J.; Jia, L.W.; Jin, W.Y.; Xia, F.; Wang, J.M. Effects of Ce-doping on the structure and NH3-SCR activity of Fe/Beta catalyst. Rare Metal Mater. Eng. 2015, 44, 1612–1616. [Google Scholar]
  19. Shu, Y.; Sun, H.; Quan, X.; Chen, S. Enhancement of catalytic activity over the iron-modified Ce/TiO2 catalyst for selective catalytic reduction of NOx with ammonia. J. Phys. Chem. C 2012, 116, 25319–25327. [Google Scholar] [CrossRef]
  20. Long, R.Q.; Yang, R.T. Temperature-programmed desorption/surface Reaction (TPD/TPSR) study of Fe-exchanged ZSM-5 for selective catalytic reduction of nitric oxide by ammonia. J. Catal. 2001, 198, 20–28. [Google Scholar] [CrossRef]
  21. Koebel, M.; Elsener, M.; Madia, G. Reaction pathways in the selective catalytic reduction process with NO and NO2 at low temperatures. Ind. Eng. Chem. Res. 2001, 40, 52–59. [Google Scholar] [CrossRef]
  22. Romero-Sáez, M.; Divakar, D.; Aranzabal, A.; González-Velasco, J.R.; González-Marcos, J.A. Catalytic oxidation of trichloroethylene over Fe-ZSM-5: Influence of the preparation method on the iron species and the catalytic behavior. Appl. Catal. B 2016, 180, 210–218. [Google Scholar] [CrossRef]
  23. Cao, F.; Su, S.; Xiang, J.; Wang, P.Y.; Hu, S.; Sun, L.S.; Zhang, A.C. The activity and mechanism study of Fe-Mn-Ce/γ-Al2O3 catalyst for low temperature selective catalytic reduction of NO with NH3. Fuel 2015, 139, 232–239. [Google Scholar] [CrossRef]
  24. Wan, Q.; Duan, L.; He, K.B.; Li, J.H. Removal of gaseous elemental mercury over a CeO2-WO3/TiO2 nanocomposite in simulated coal-fired flue gas. Chem. Eng. J. 2011, 170, 512–517. [Google Scholar] [CrossRef]
  25. Yao, X.J.; Xiong, Y.; Zou, W.; Zhang, L.; Wu, S.G.; Dong, X.; Gao, F.; Deng, Y.; Tang, C.J.; Chen, Z.; et al. Correlation between the physicochemical properties and catalytic performances of CexSn1−xO2 mixed oxides for NO reduction by CO. Appl. Catal. B 2014, 144, 152–165. [Google Scholar] [CrossRef]
  26. Zhang, L.; Zou, W.X.; Ma, K.L.; Cao, Y.; Xiong, Y.; Wu, S.G.; Tang, C.J.; Gao, F.; Dong, L. Sulfated temperature effects on the catalytic activity of CeO2 in NH3-selective catalytic reduction conditions. J. Phys. Chem. C 2015, 119, 1155–1163. [Google Scholar] [CrossRef]
  27. Zhang, X.P.; Shen, B.X.; Wang, K.; Chen, J.H. A contrastive study of the introduction of cobalt as a modifier for active components and supports of catalysts for NH3-SCR. J. Ind. Eng. Chem. 2013, 19, 1272–1279. [Google Scholar] [CrossRef]
  28. Wu, S.G.; Zhang, L.; Wang, X.B.; Zou, W.X.; Cao, Y.; Sun, J.F.; Tang, C.J.; Gao, F.; Deng, Y.; Dong, L. Synthesis, characterization and catalytic performance of FeMnTiOx mixed oxides catalyst prepared by a CTAB-assisted process for mid-low temperature NH3-SCR. Appl. Catal. A 2015, 505, 235–242. [Google Scholar] [CrossRef]
  29. Zhang, L.; Li, L.L.; Cao, Y.; Xiong, Y.; Wu, S.G.; Sun, J.F.; Tang, C.J.; Gao, F.; Dong, L. Promotional effect of doping SnO2 into TiO2 over a CeO2/TiO2 catalyst for selective catalytic reduction of NO by NH3. Catal. Sci. Technol. 2015, 5, 2188–2196. [Google Scholar] [CrossRef]
  30. Shen, B.X.; Yao, Y.; Chen, J.H.; Zhang, X.P. Alkali metal deactivation of Mn-CeOx/Zr-delaminated-clay for the low-temperature selective catalytic reduction of NOx with NH3. Microporous Mesoporous Mater. 2013, 180, 262–269. [Google Scholar]
  31. Cheng, K.; Liu, J.; Zhang, T.; Li, J.M.; Zhao, Z.; Wei, Y.C.; Jiang, G.Y.; Duan, A.J. Effect of Ce doping of TiO2 support on NH3-SCR activity over V2O5-WO3/CeO2-TiO2 catalyst. J. Environ. Sci. 2014, 26, 2106–2113. [Google Scholar] [CrossRef] [PubMed]
  32. Wu, Z.B.; Jin, R.B.; Wang, H.Q.; Liu, Y. Effect of ceria doping on SO2 resistance of Mn/TiO2 for selective catalytic reduction of NO with NH3 at low temperature. Catal. Commun. 2009, 10, 935–939. [Google Scholar] [CrossRef]
  33. Gu, T.T.; Liu, Y.; Weng, X.L.; Wang, H.Q.; Wu, Z.B. The enhanced performance of ceria with surface sulfation for selective catalytic reduction of NO by NH3. Catal. Commun. 2010, 12, 310–313. [Google Scholar] [CrossRef]
  34. Zhang, Q.L.; Zhang, J.H.; Song, Z.X.; Ning, P.; Li, H.; Liu, X. A novel and environmentally friendly SO42−/CeO2 catalyst for the selective catalytic reduction of NO with NH3. J. Ind. Eng. Chem. 2016, 34, 165–171. [Google Scholar] [CrossRef]
  35. Kumar, P.A.; Reddy, M.P.; Ju, L.K.; Hyun-Sook, B.; Phil, H.H. Low temperature propylene SCR of NO by copper alumina catalyst. J. Mol. Catal. A 2008, 291, 66–74. [Google Scholar] [CrossRef]
  36. Shu, Y.; Aikebaier, T.; Quan, X.; Chen, S.; Yu, H.T. Selective catalytic reaction of NOx with NH3 over Ce-Fe/TiO2-loaded wire-mesh honeycomb: Resistance to SO2 poisoning. Appl. Catal. B 2014, 150–151, 630–635. [Google Scholar] [CrossRef]
  37. Huang, J.H.; Tong, Z.Q.; Huang, Y.; Zhang, J.F. Selective catalytic reduction of NO with NH3 at low temperatures over iron and manganese oxides supported on mesoporous silica. Appl. Catal. B 2008, 78, 309–314. [Google Scholar] [CrossRef]
  38. Shen, B.X.; Zhang, X.P.; Ma, H.Q.; Yao, Y.; Liu, T. A comparative study of Mn/CeO2, Mn/ZrO2 and Mn/Ce-ZrO2 for low temperature selective catalytic reduction of NO with NH3 in the presence of SO2 and H2O. J. Environ. Sci. 2013, 25, 791–800. [Google Scholar] [CrossRef]
  39. Chang, H.Z.; Ma, L.; Yang, S.J.; Li, J.H.; Chen, L.; Wang, W.; Hao, J.M. Comparison of preparation methods for ceria catalyst and the effect of surface and bulk sulfates on its activity toward NH3-SCR. J. Hazard. Mater. 2013, 262, 782–788. [Google Scholar] [CrossRef] [PubMed]
  40. Waqif, M.; Bazin, P.; Saur, O.; Lavalley, J.C.; Blanchard, G.; Touret, O. Study of ceria sulfation. Appl. Catal. B 1997, 11, 193–205. [Google Scholar] [CrossRef]
  41. Yu, J.; Guo, F.; Wang, Y.L.; Zhu, J.H.; Liu, Y.Y.; Su, F.B.; Gao, S.Q.; Xu, G.W. Sulfur poisoning resistant mesoporous Mn-base catalyst for low-temperature SCR of NO with NH3. Appl. Catal. B 2010, 95, 160–168. [Google Scholar] [CrossRef]
Figure 1. NO conversion over various Fe–Ti catalysts. Reaction conditions: [NO] = [NH3] = 500 ppm, [O2] = 5 vol. %, N2 balance, and gas hourly space velocity (GHSV) = 90,000 h−1.
Catalysts 06 00112 g001
Figure 2. NO conversion of various Fe–Ce–Ti catalysts at different GHSVs: (a) GHSV = 90,000 h−1 and (b) GHSV = 180,000 h−1. Reaction conditions: [NO] = [NH3] = 500 ppm, [O2] = 5 vol. %, N2 balance.
Catalysts 06 00112 g002
Figure 3. NO conversion over Fe(0.2)–Ti, Ce(0.4)–Ti, and Fe(0.2)–Ce(0.4)–Ti catalysts. Reaction conditions: [NO] = [NH3] = 500 ppm, [O2] = 5 vol. %, N2 balance, and GHSV = 90,000 h−1.
Catalysts 06 00112 g003
Figure 4. Oxidation activity of NO to NO2 by O2 on Fe(0.2)–Ti and Fe(0.2)–Ce(0.4)–Ti catalysts. Reaction conditions: [NO] = 500 ppm, [O2] = 5 vol. %, N2 balance, and GHSV = 90,000 h−1.
Catalysts 06 00112 g004
Figure 5. XRD patterns of Fe(0.2)–Ce(x)–Ti catalysts (x = 0, 0.02, 0.05, 0.2, 0.4, 0.8).
Catalysts 06 00112 g005
Figure 6. H2-TPR profiles for Fe(0.2)–Ti and Fe(0.2)–Ce(0.4)–Ti catalysts.
Catalysts 06 00112 g006
Figure 7. NH3-TPD results of Fe(0.2)–Ti and Fe(0.2)–Ce(0.4)–Ti catalysts.
Catalysts 06 00112 g007
Figure 8. XPS spectra of (a) Fe 2p, (b) Ce 3d, (c) O 1s and (d) Ti 2p for Fe(0.2)–Ti, Ce(0.4)–Ti and Fe(0.2)–Ce(0.4)–Ti catalyst.
Catalysts 06 00112 g008
Figure 9. NO conversion of the Fe(0.2)–Ti and Fe(0.2)–Ce(0.4)–Ti catalysts in the presence of SO2 at 270 °C under different GHSVs: (a) GHSV = 90,000 h−1 and (b) GHSV = 150,000 h−1. Reaction conditions: [NO] = [NH3] = 500 ppm, [SO2] = 200 ppm, [O2] = 5 vol. %, N2 balance.
Catalysts 06 00112 g009
Figure 10. Effect of H2O and SO2 on NO conversion over Fe(0.2)–Ce(0.4)–Ti catalyst at 270 °C. Reaction conditions: [NO] = [NH3] = 500 ppm, [SO2] = 200 ppm (when used), [H2O] = 5 vol. % (when used), [O2] = 5%, N2 balance, and GHSV = 90,000 h−1.
Catalysts 06 00112 g010
Figure 11. Thermogravimetric analysis (TGA) spectra of the fresh and used catalyst (a) Fe(0.2)–Ti and (b) Fe(0.2)–Ce(0.4)–Ti.
Catalysts 06 00112 g011
Figure 12. FT-IR spectra of the fresh and used catalyst: (a) Fe(0.2)–Ti and (b) Fe(0.2)–Ce(0.4)–Ti.
Catalysts 06 00112 g012
Table 1. Physical properties of various catalysts.
SampleBET (cm2·g−1)Pore Volume (cm3·g−1)
Fe(0.2)–Ti76.040.2783
Fe(0.2)–Ce(0.02)–Ti117.420.2611
Fe(0.2)–Ce(0.05)–Ti141.750.3219
Fe(0.2)–Ce(0.2)–Ti210.850.6094
Fe(0.2)–Ce(0.4)–Ti146.820.6456
Fe(0.2)–Ce(0.8)–Ti105.180.3964
Table 2. XPS results of various catalysts.
CatalystFeCeTiOFe/TiCe/TiFe3+/(Fe2+ + Fe3+) (%)Ce4+/Ce3+Oβ/(Oα + Oβ) (%)
Fe(0.2)–Ti4.60-17.4253.660.264-39.49-5.9
Ce(0.4)–Ti-1.9417.7551.21-0.109-2.238.5
Fe(0.2)–Ce(0.4)–Ti3.474.5011.4453.070.3030.39329.223.4320.1

