Communication

Valence Regulation of Ultrathin Cerium Vanadate Nanosheets for Enhanced Photocatalytic CO2 Reduction to CO

1
Key Laboratory of Flexible Electronics (KLOFE), Institution of Advanced Materials (IAM), Nanjing Tech University (NanjingTech), 30 South Puzhu Road, Nanjing 211816, China
2
National Laboratory of Solid State Microstructures, Collaborative Innovation Center of Advanced Microstructures, Department of Physics, Nanjing University, Nanjing 210093, China
3
School of Chemical Engineering, Nanjing University of Science and Technology, Nanjing 210094, China
*
Author to whom correspondence should be addressed.
Catalysts 2021, 11(9), 1115; https://doi.org/10.3390/catal11091115
Submission received: 31 August 2021 / Revised: 13 September 2021 / Accepted: 13 September 2021 / Published: 16 September 2021

Abstract

:
Atomic valence state regulation is an advantageous approach for improving photocatalytic efficiency and product selectivity. However, it is difficult to precisely control the ratio of the different valence states on the surface and the relationship between the surface valence change and catalytic efficiency in the photocatalytic reaction process is unclear. Herein, CeVO4 ultrathin nanosheets were fabricated by one-step solvothermal method with ethanolamine (MEA) as the structure-directing agent. The ratio of the concentrations of intrinsic Ce4+ and Ce3+ ions is precisely modulated from 19.82:100 to 13.33:100 changed by the volume of MEA added without morphology modification. The photocatalytic efficiency increases as the concentrations of intrinsic Ce4+ and Ce3+ ions decrease and CV3 (prepared with 3 mL of MEA) shows the highest CO generation rate approximately 6 and 14 times larger than CV (prepared without MEA) and CV1 (prepared with 1 mL of MEA), respectively, in the photocatalytic CO2 reduction. Interestingly, about 6.8% photo-induced Ce4+ ions were generated on the surface of the catalysts during the photocatalytic CO2 reduction without any phase and morphology changes for CV3. The photocatalytic reaction mechanism is proposed considering the intrinsic and photo-induced Ce4+ ions to obtain efficient photocatalysts.

1. Introduction

Photocatalytic conversion of CO2 to a specific product is highly important for the use of solar-driven deoxidation and hydrogenation reaction of carbon dioxide to lower CO2 concentration in an environmentally friendly manner [1,2,3]. Recently, various vanadate compounds have been investigated as photocatalysts for CO2 reduction, including InVO4 (Eg: 2.7 eV, CO generation rate: 23.8 µmol g−1 h−1) [4], Co-doped BiVO4 (Eg: ~2 eV, CO generation rate: 18.28 µmol g−1 h−1) [5], and LaVO4 (Eg: 2.07 eV, C2H5OH generation rate: 12.7 µmol g−1 h−1) [6]. Among these vanadates, CeVO4 composed of the rare-earth Ce element and ortho-vanadate group is a promising photocatalytic candidate in heterogeneous reaction. In particular, tetragonal CeVO4 has a zircon structure in which [CeO9] polyhedra are connected through edge sharing to the alternating [VO4] tetrahedra along the c axis, and has a low surface energy that facilitates the natural formation of bulk nanostructured materials [7]. As a ternary metal oxide catalyst, CeVO4 shows superior redox and optical properties due to the 4f electronic structure and abundant electronic transitions of its constituent lanthanide metal. With these promising characteristics, the photocatalytic efficiency of CeVO4 nanostructures reported is supposed to be improved for application to CO2 conversion.
Cerium orthovanadate was first reported in the application for photocatalysis in 2007 by Row et al. and it can be applied to photocatalytic reaction because of its advantageous bandgap compared to PrVO4 and NdVO4 [8]. The conduction band of CeVO4 is lowered by excitations from the partially filled 4f orbitals to obtain an effective bandgap of 1.8 eV (band edge: ~680 nm) [9]. The broad light absorption enabled by the low band gap favors the photocatalytic reaction driven by absorption of UV and visible light [10,11]. Ce4+ and Ce3+ ions coexisting on the surface of CeVO4 nanostructures act as the main catalytic centers, and play the key role in the enhanced photocatalytic activity, as demonstrated by theory and experiments [12,13]. Peng et al. reported that Ce3+ ions can be oxidized into Ce4+ upon the substitution of Ca2+ into CeVO4 and this chemically driven charge transfer is irreversible due to the accompanying lattice contraction [14]. The intrinsic Ce4+ ions act as recombination centers of photogenerated charge carriers and have a deleterious effect on the catalytic reaction; however, Ce4+ ions can be changed into Ce3+ ions by a post-treatment process. It was found that conversion between Ce3+ and Ce4+ (denoted as Cep3+/Cep4+) driven by solar light or reactive intermediates is reversible [15] but the charge transfer mechanism is unclear. The relationship between the Cep3+/Cep4+ redox states and the catalytic activity must be understood for the further improvement of the photocatalytic performance of CeVO4 nanostructures; however, this relationship has rarely been examined in the studies reported in the literature.
Recent reports have demonstrated that the Ce oxidation state is closely correlated with the local structure and chemical environment of the Ce atom. Localization of Ce 4f electrons and the energy levels difference between the V 3d and Ce 4f orbitals generally tends to reduce Ce4+ to Ce3+ [16,17]. The V5+ species (3d states) remain stable in this redox cycle most likely due to its higher 3d energy levels that are form the bandgap states together with the O 2p states of the VO43− ions [18,19]. Based on the Cep3+/Cep4+ pairs, CeVO4 is advantageous for combination with other material to improve the efficiency of photocatalysis. For example, Huo et al. reported that the photocatalytic performance of CeVO4 was greatly improved by the La2O3 media combination via electron transfer enhancement [20]. It was also reported that Ag+ ions can be directly reduced by Ce3+ ions to form CeVO4/Ag heterojunction nanocrystals (NCs) with a high photothermal conversion efficiency. Moreover, cerium vanadate nanostructures were used to detect clioquinol through the evaluation of the redox reaction on the electrode surface [21]. Since modulation of the surface atomic valence state can strongly alter the catalytic efficiency and product selectivity, it is important to study the mechanism and the effects of the Ce valence change for CeVO4 photocatalysts.
Herein, CeVO4 ultrathin nanosheets were synthesized by one-step solvothermal method with ethanolamine (MEA) as the structure-directing agent and then applied to photocatalytic CO2 reduction. The photocatalytic efficiency of CO2 conversion for the CeVO4 nanosheets (referred to CV1–4, corresponding to the different volumes of MEA ranging from 1 to 4 mL) is improved compared to the CV prepared without MEA added. In particular, CV3 shows the maximum CO selectivity (40.97 µmol g−1 h−1) that is 6 and 14 times larger than those of CV and CV1, respectively, which has the lowest concentration of the intrinsic Ce4+ ions. Moreover, the CO generation rate increases with decreasing intrinsic Ce4+/Ce3+ ions ratio that can be modulated by MEA without affecting phase and morphology of the CeVO4. Furthermore, it was found that approximately 6.8% of Cep4+/Cep3+ ion pairs are generated in the photocatalytic reaction process and tend to disappear after thermal treatment. As reactive centers, the Cep4+/Cep3+ ion pairs are advantageous for the photocatalytic CO2 conversion to CO by promoting the molecular adsorption of the otherwise inert CO2. Supported by optical and electrochemical characterization, the possible reactive mechanism is proposed to explain the efficiency and selectivity of the obtained CeVO4 photocatalyst.

2. Results and Discussion

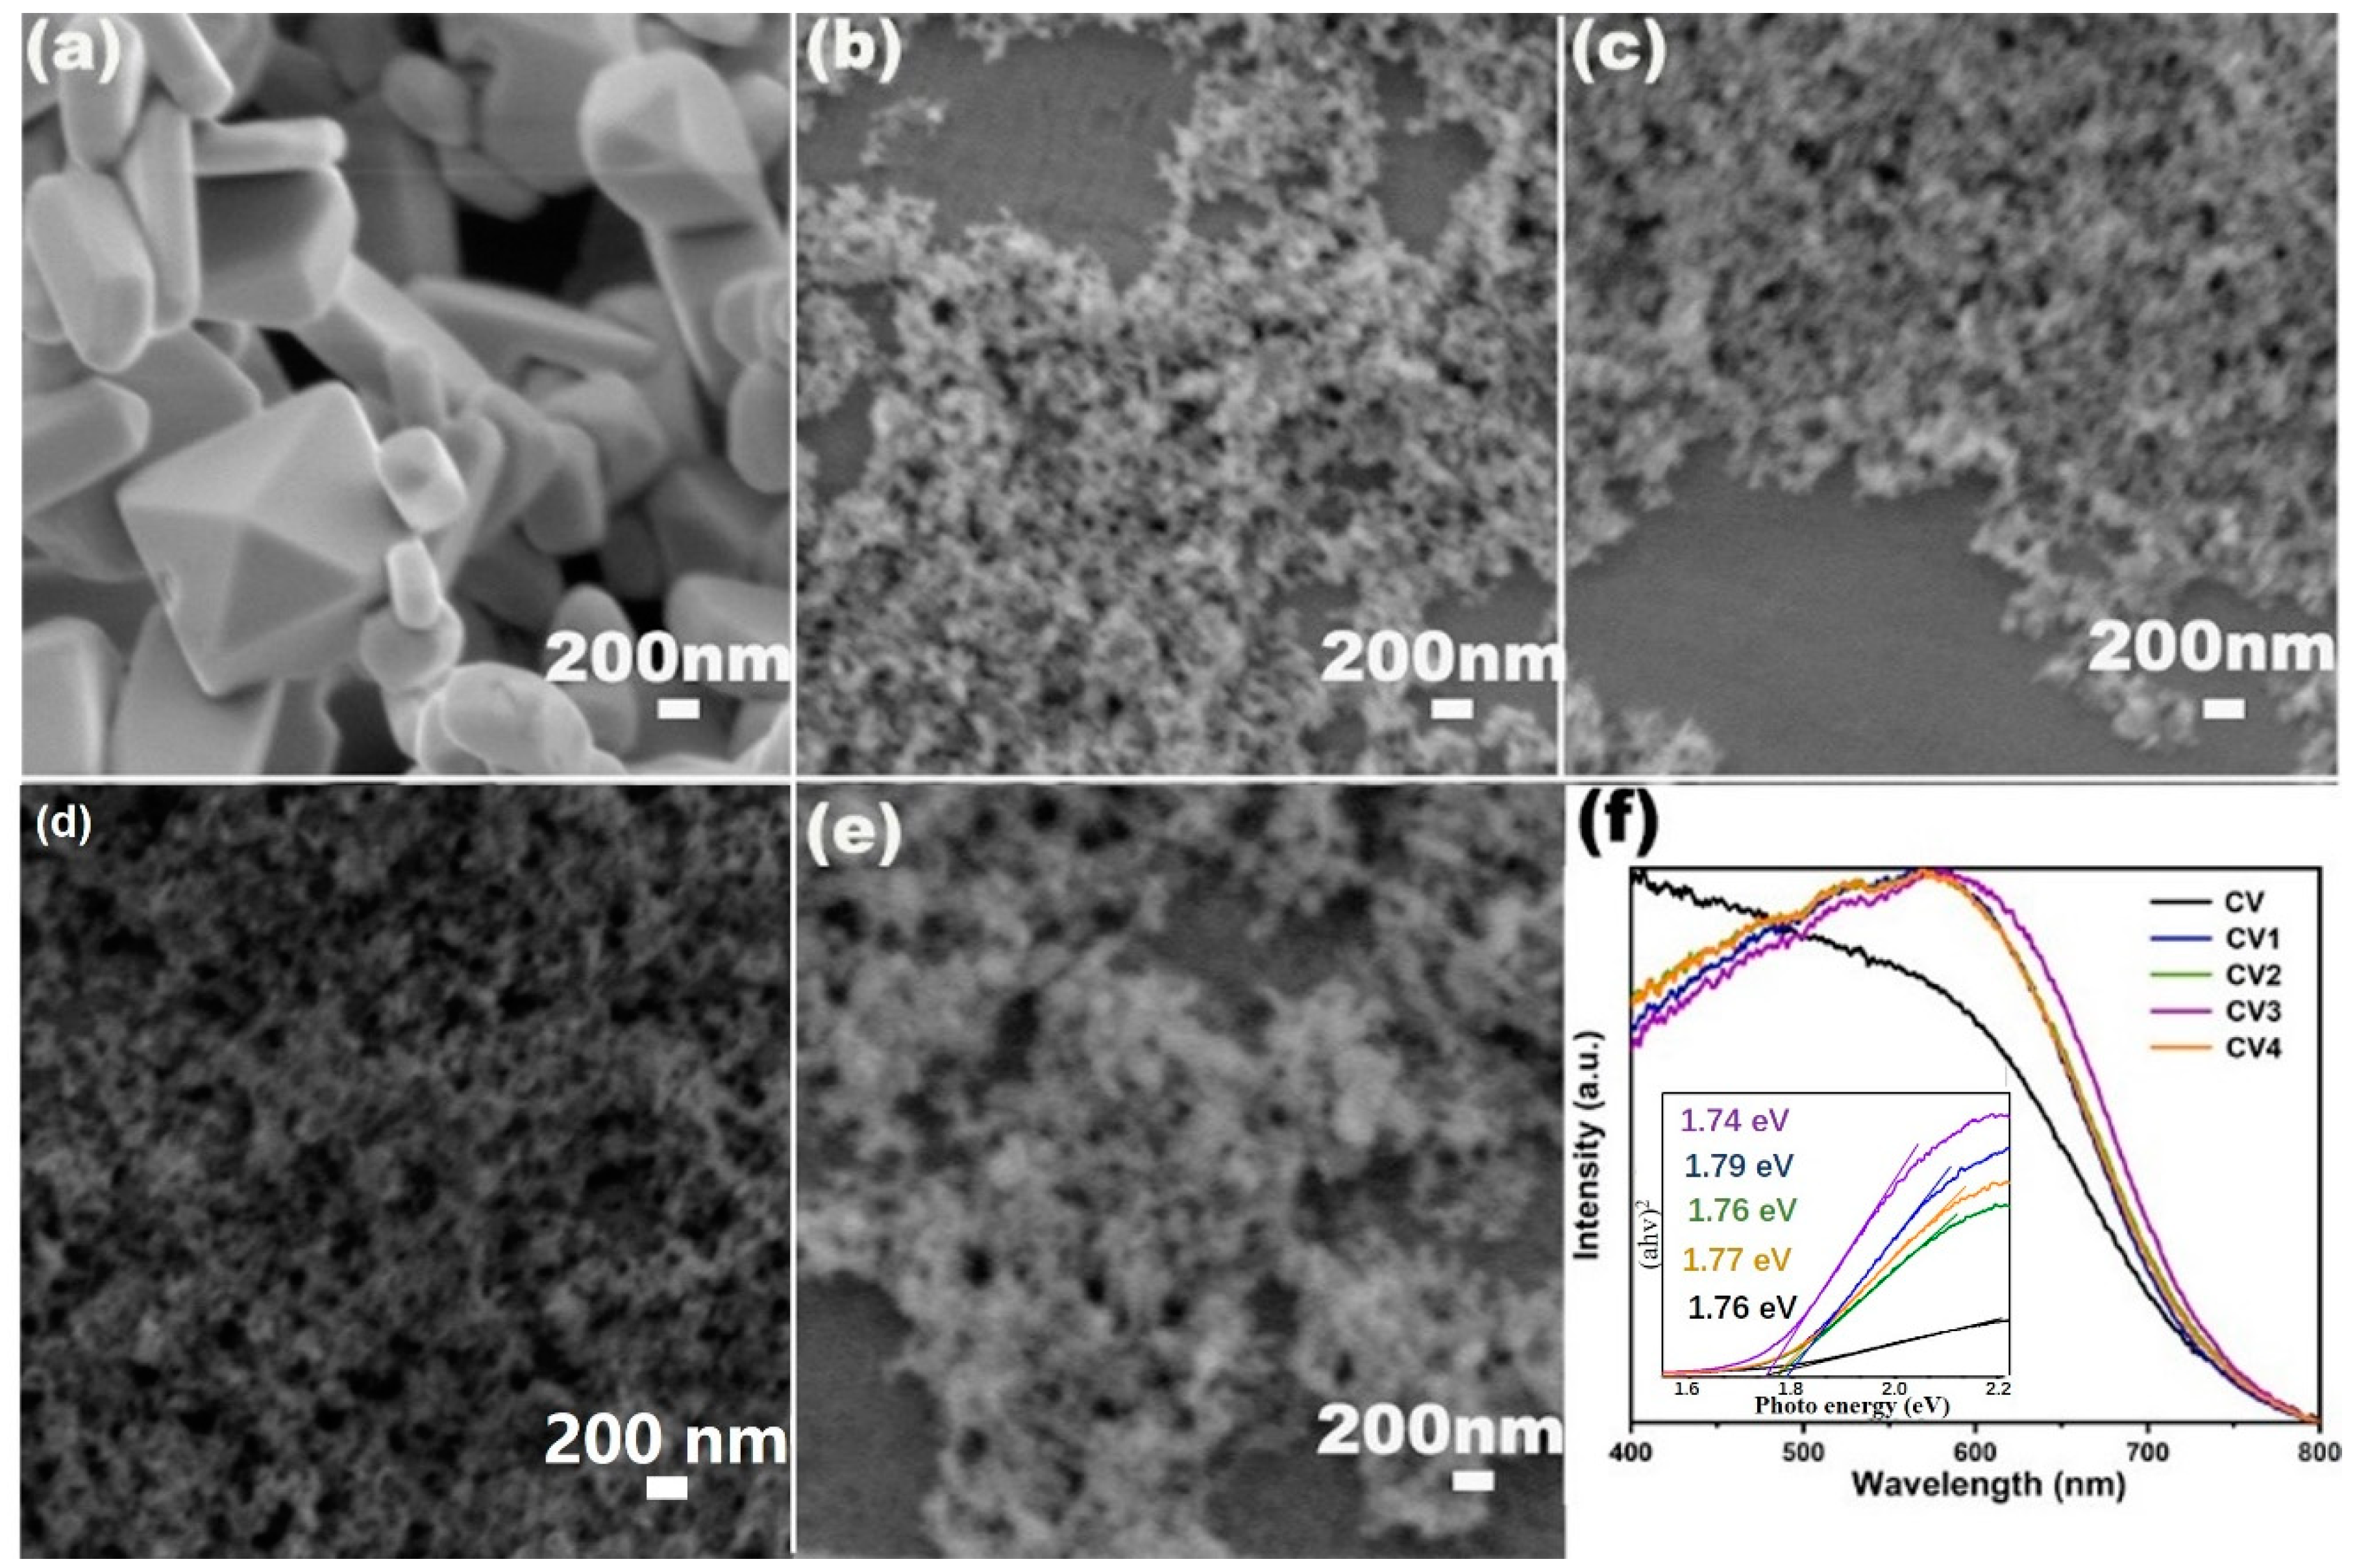
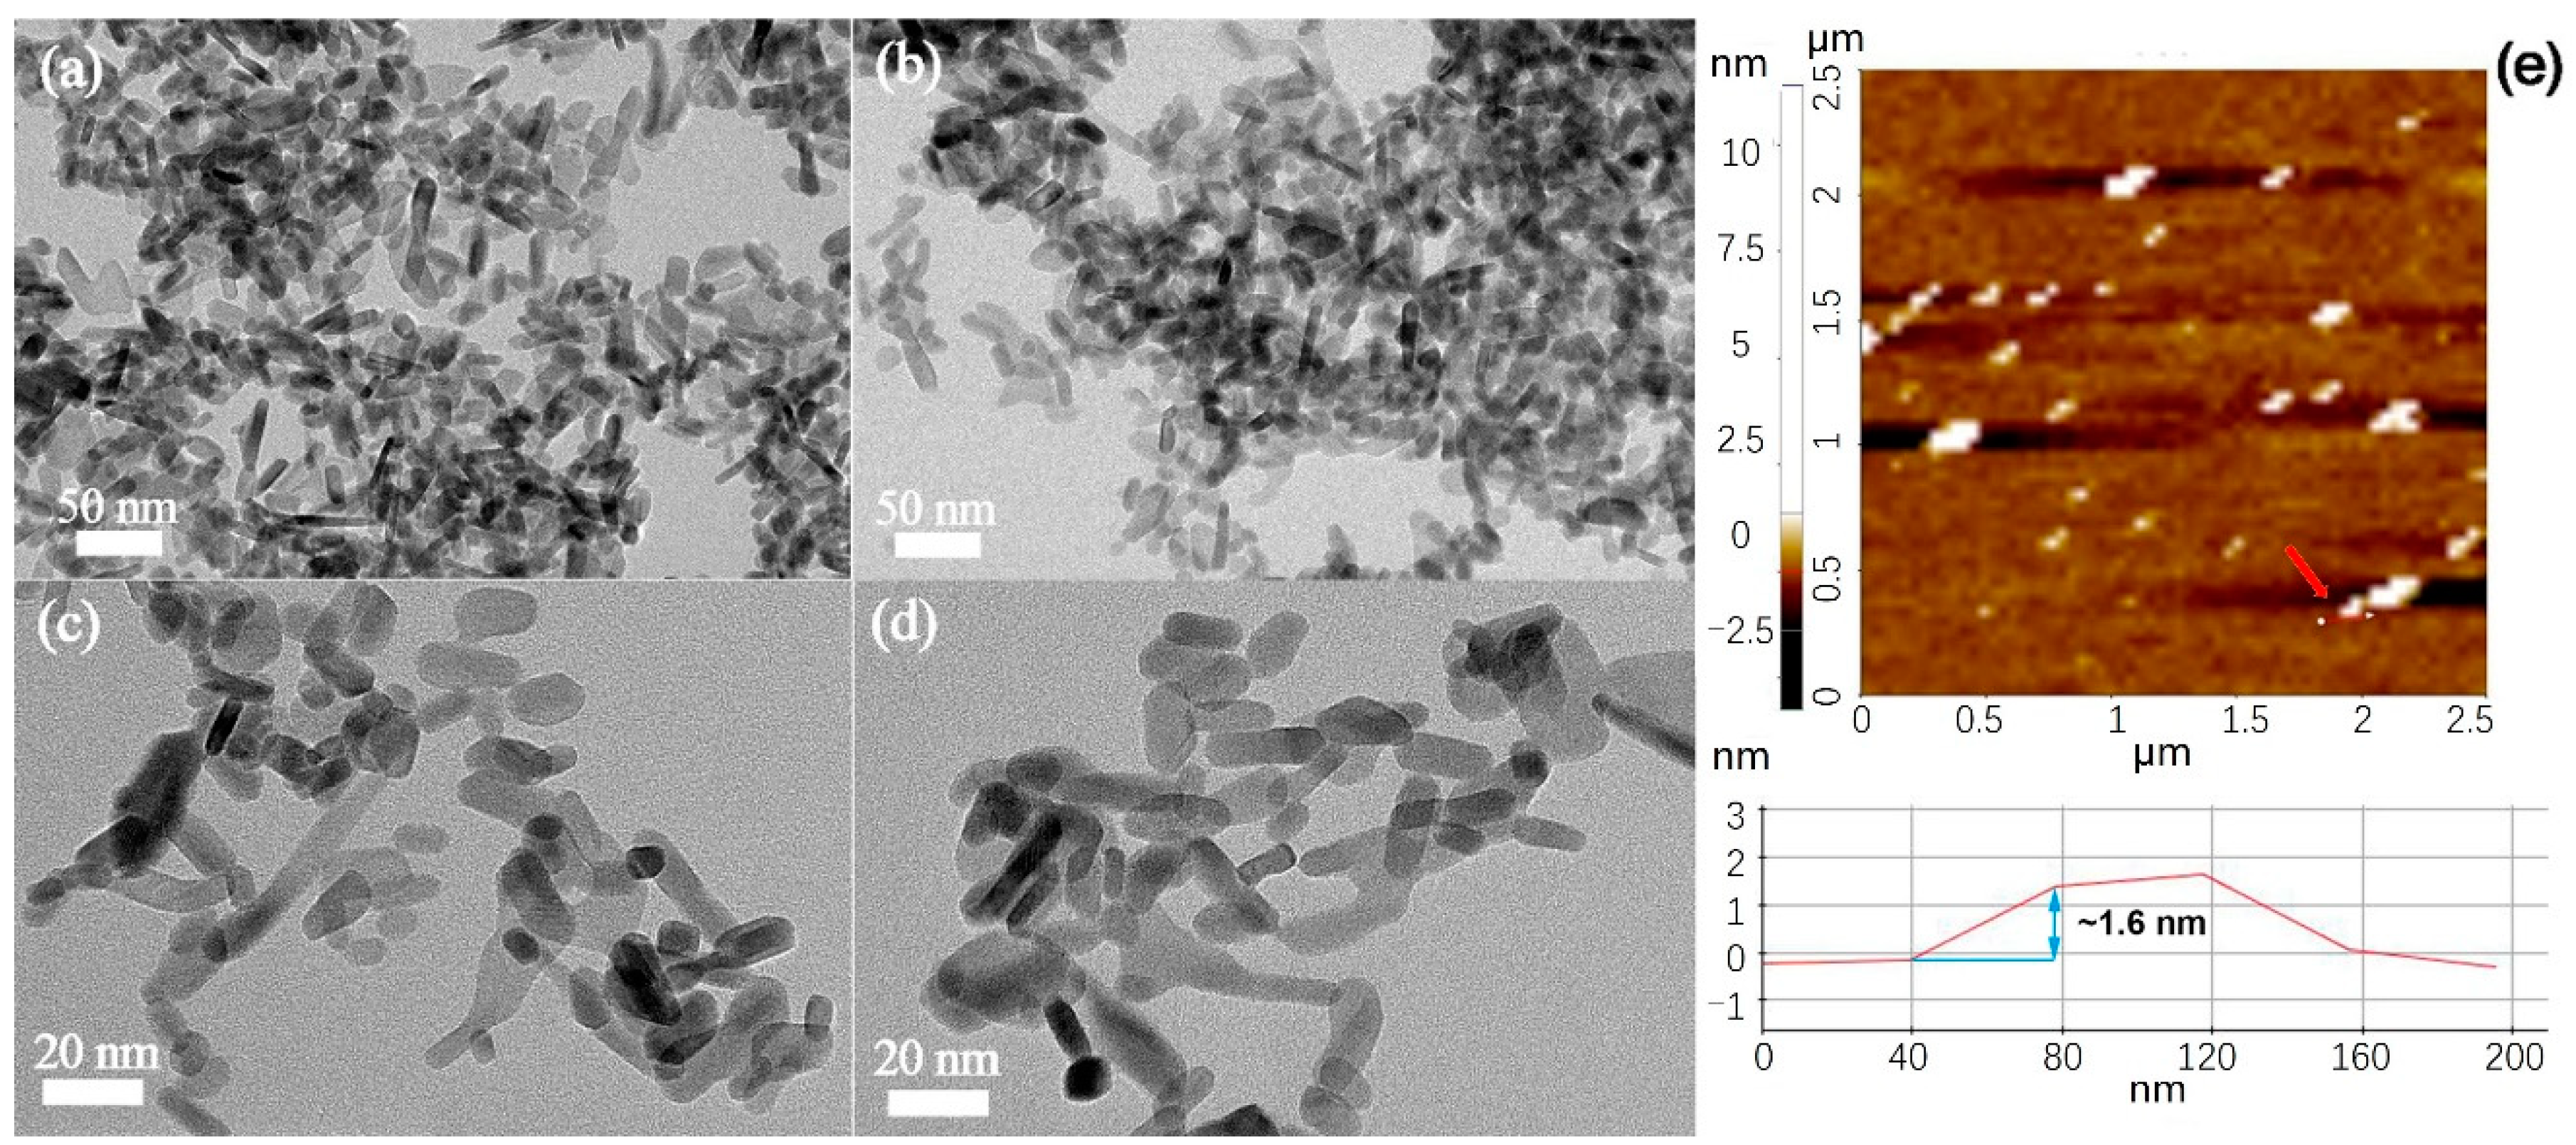
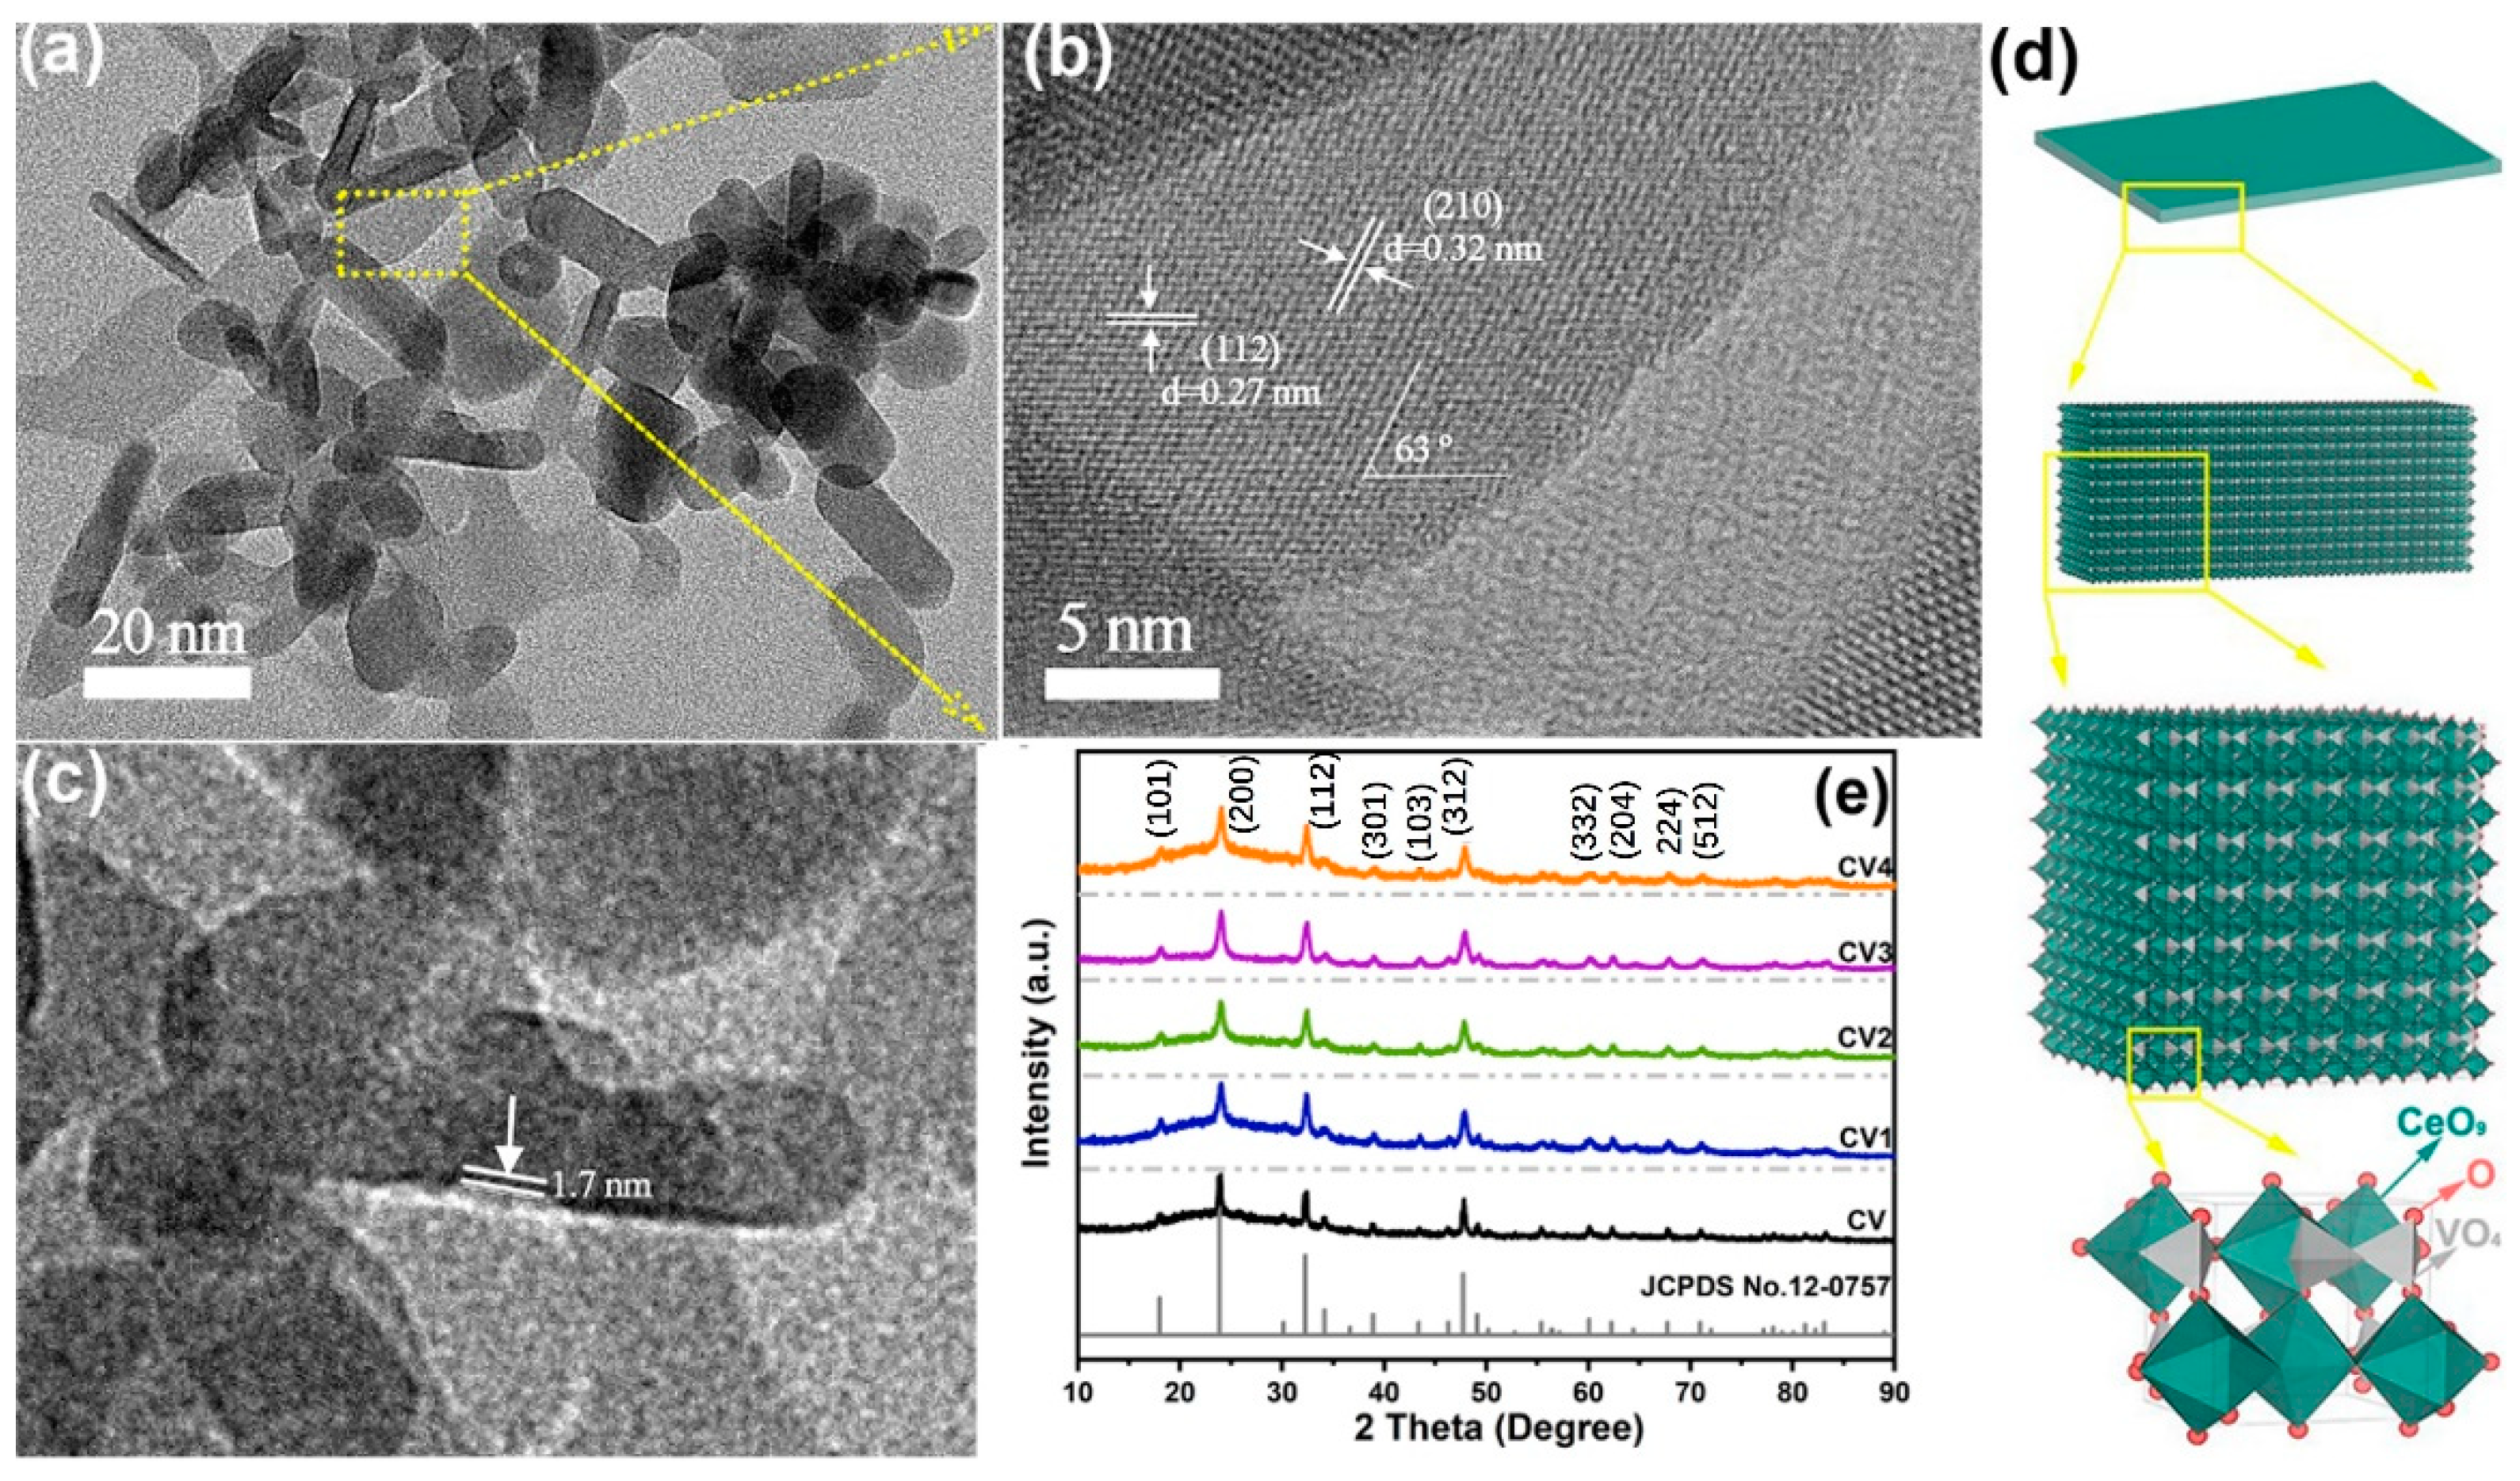
2.1. Morphology and Phase Characterization

Large CeVO4 crystallites with different sizes (>500 nm) were formed using the hydrothermal method without any structure-directing agents (Figure 1a). Comparatively, the as-prepared samples grew into uniformly nanoscale structures after MEA addition as observed from the scanning electron microscopy (SEM) images (Figure 1b–e). A detailed examination of the CeVO4 samples showed that most of the as-prepared CeVO4 (>99.9%) crystallized into translucent nanosheets in the MEA-assisted alkaline environment as shown in the TEM images. These ultrathin nanosheets are monodispersed and the average diameter of the oval-shaped nanosheets is approximately 10 nm (Figure 2). The lattice fringes with d-spacing values of 0.32 nm and 0.27 nm correspond to the (002) and (112) planes of the tetragonal CeVO4 phase, respectively, and their intersection angle is 63°, in agreement with the theoretical value (Figure 3a,b). Examination of the high-resolution TEM (HRTEM) images of crimpled nanosheets shows that they are approximately 1.7 nm thick (Figure 3c), which is also certified by AFM characterization with non-contact mode (Figure 4d) and their preferentially vertical growth is attributed to the high MEA absorption on the surface of the nanosheets [22,23,24]. The strongly adhesion of MEA blocks the epitaxial growth of CeVO4 nanosheet toward the longitudinal. The crystal structure of the CeVO4 nanosheet is schematically illustrated in Figure 3d. The vanadium atom environment is quite symmetric with four equivalent V-O bonds. Each A-site cation (Ce3+) has D 2d site symmetry and is surrounded by eight oxygen atoms forming an antiprism with two different sets of A-O bonds of almost equal length [14]. The advantageous crystal symmetry and abundant atom species is listed as a potential candidate for photocatalytic application.
The purity and crystallinity of the prepared samples were characterized by X-ray diffraction (XRD). As shown in Figure 3e, no impurity peaks were detected and all observed diffraction peaks are attributed to the pure tetragonal phase of CeVO4 (a= b = 7.399 Å, c = 6.496 Å, I41/amd). Comparison of the XRD spectra shows that the full width at half maximum (FWHM) values of the stongest peak increase for the CV1–4 samples with more MEA added, indicating that the longitudinal dimensions are effectively reduced relative to CV to obtain ultrathin nanosheets. Moreover, the strongest diffraction peak at 24.03° for (200) facets most likely characterizes the main horizontally exposed planes of the CV1–4 nanosheets [20,25]. UV–vis diffuse reflectance spectra show the light absorbing ability of the as-prepared samples (Figure 1f). Compared to the CV prepared without MEA, the light absorption of the CV1–4 samples is much stronger and extends much further into the visible range (ca. 700 nm) with all samples showing similar bandgaps of approximately 1.76 eV, which is slightly smaller than the previously reported [9,26].

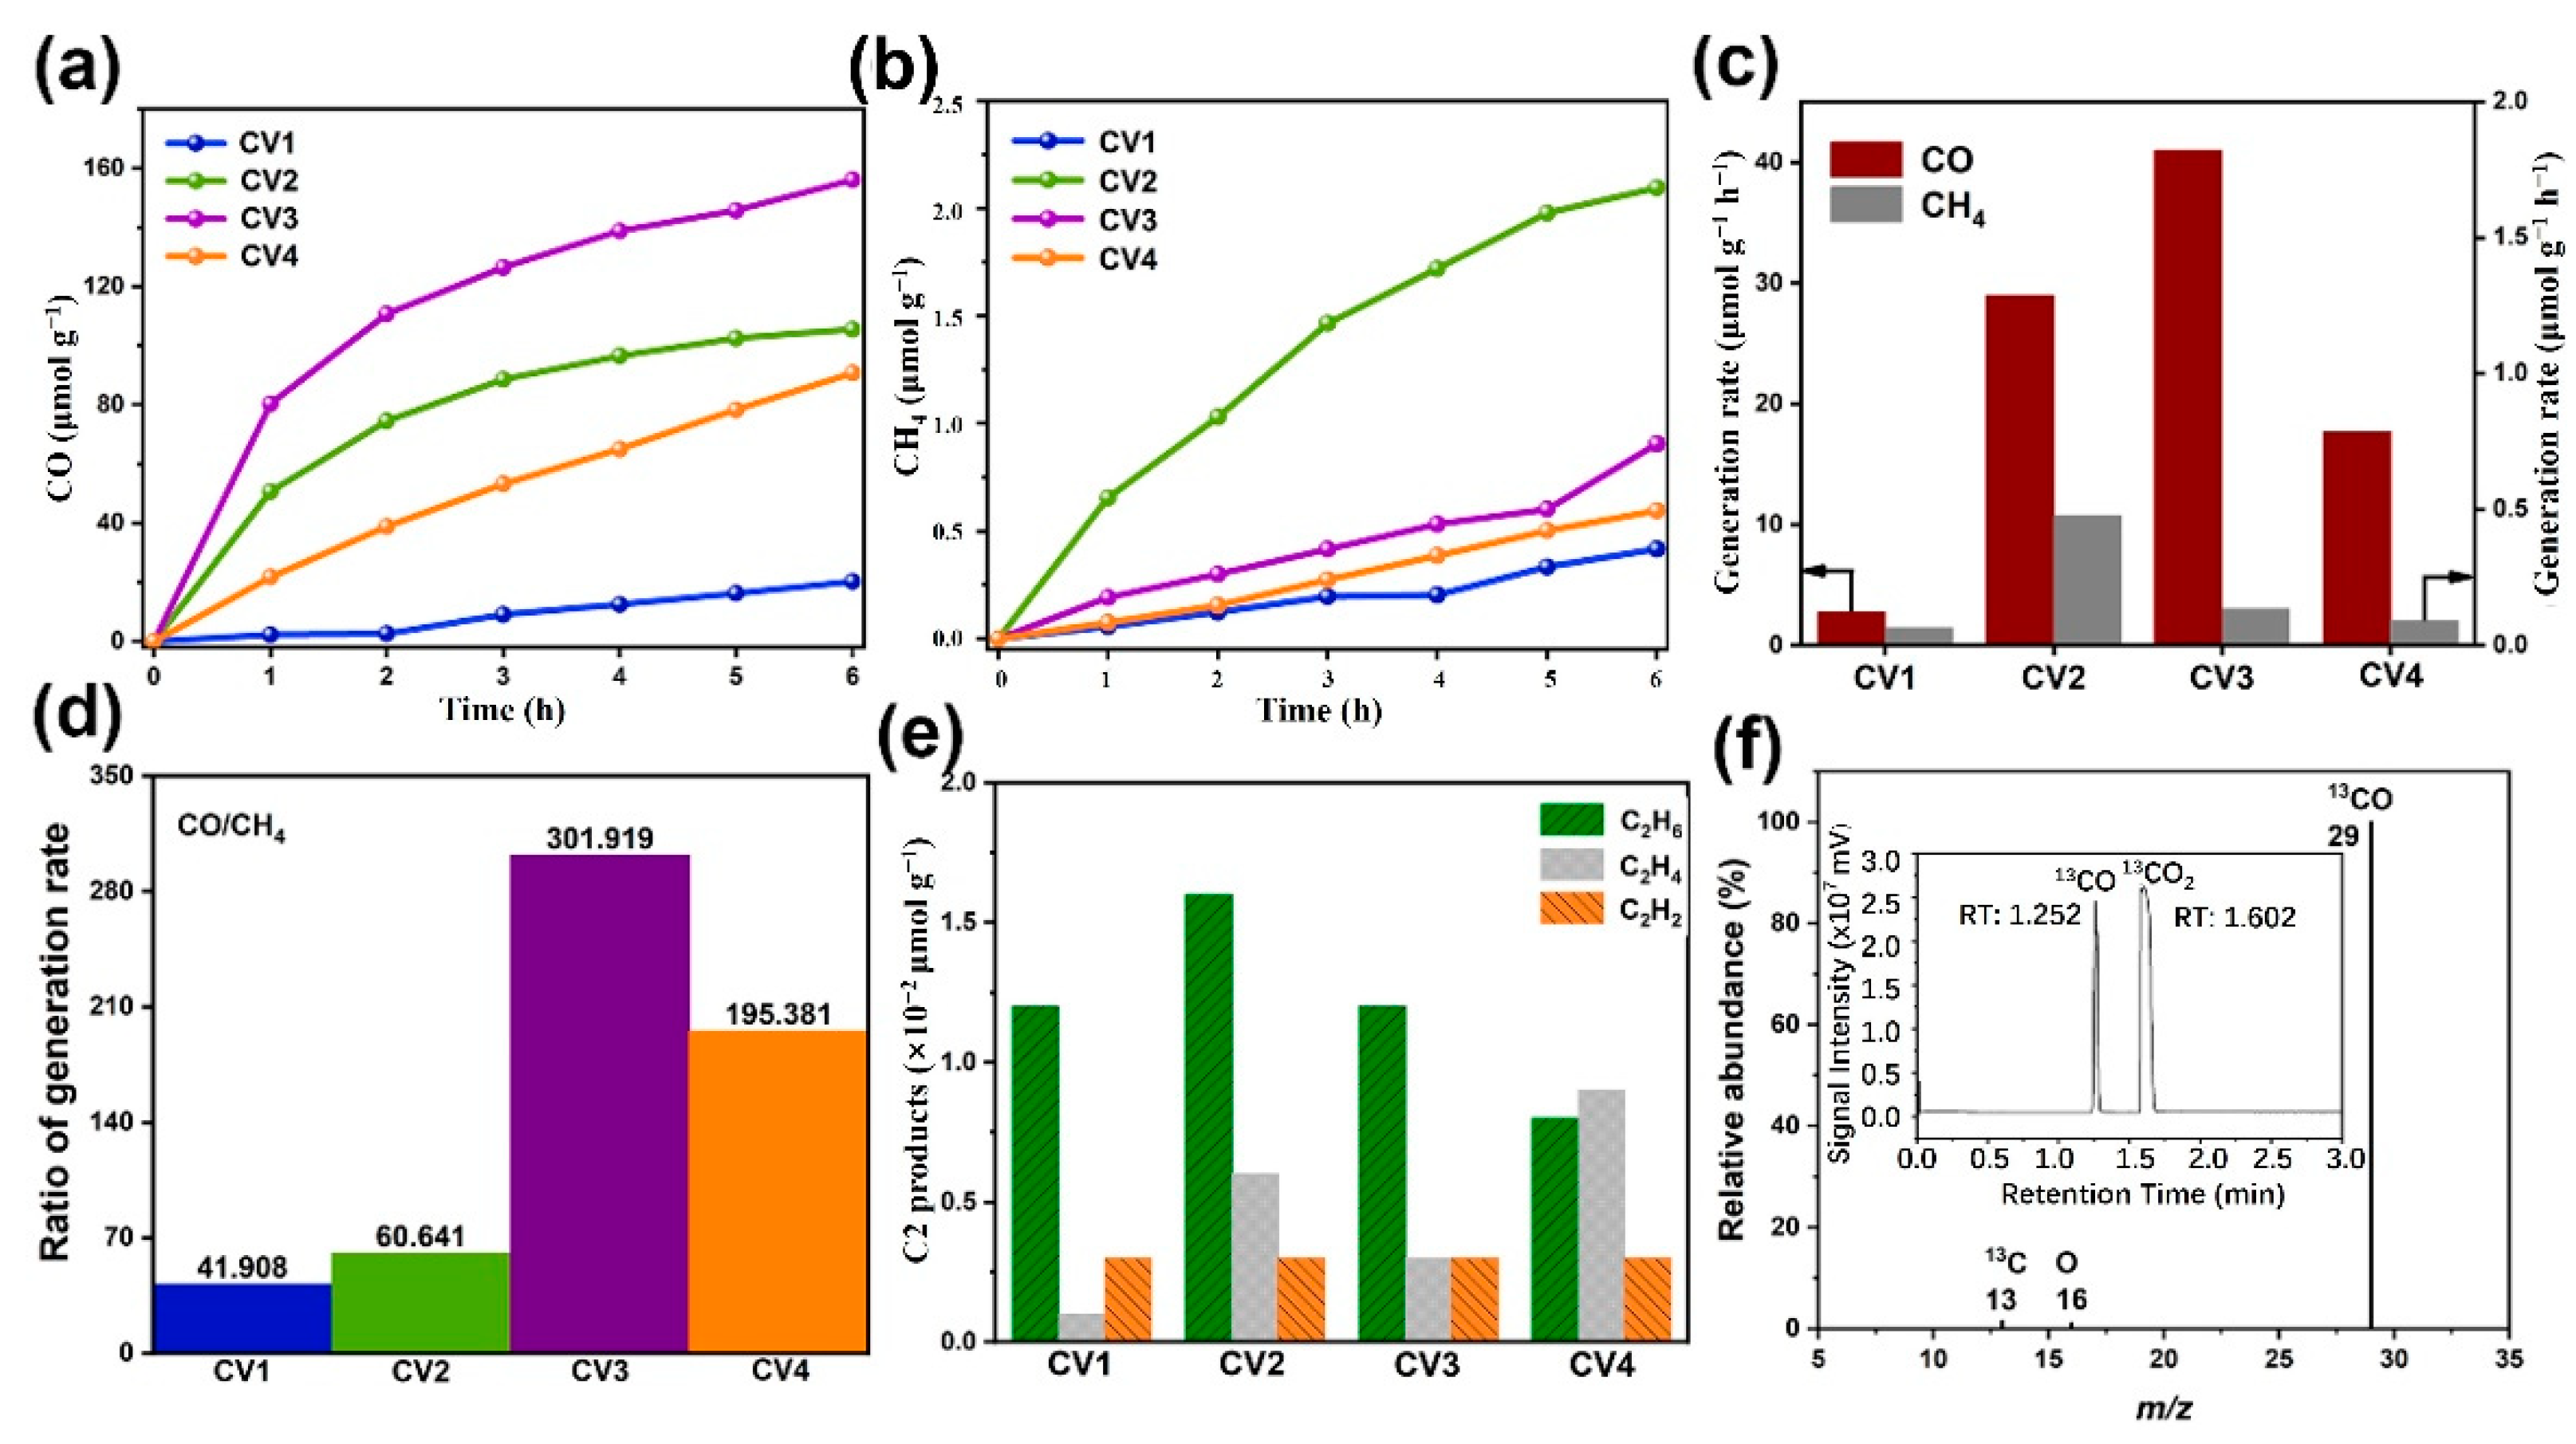
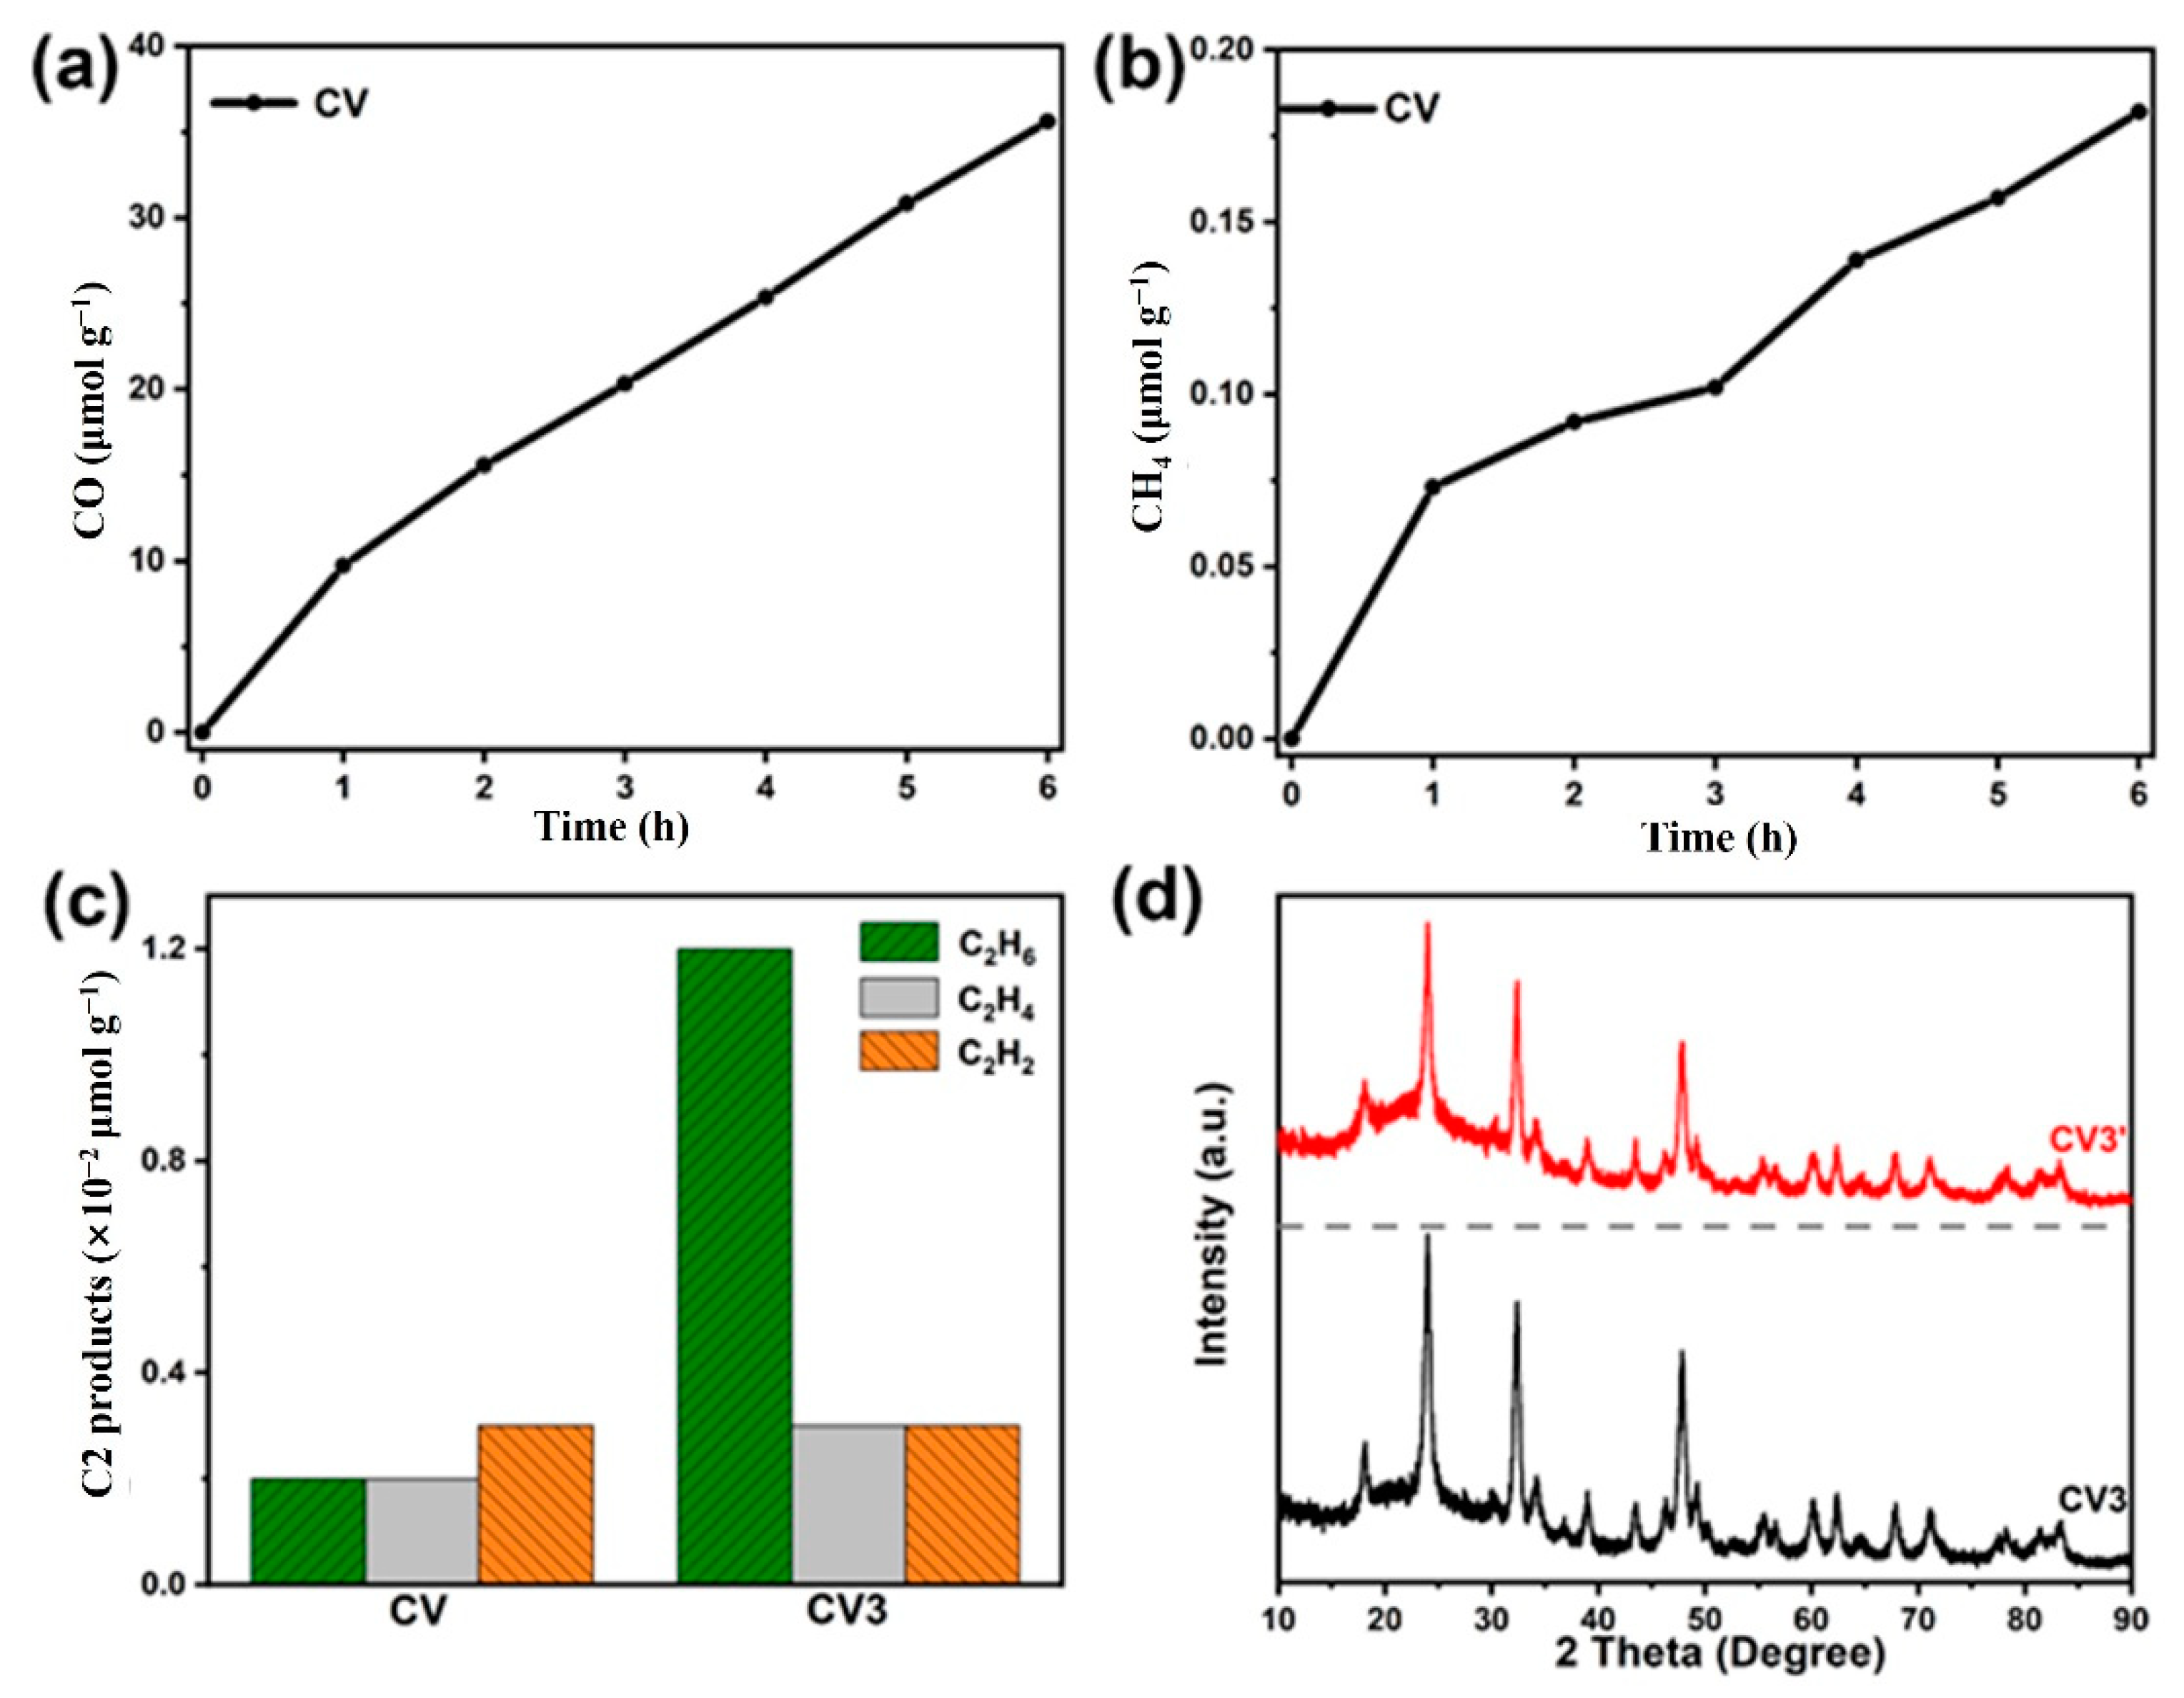
2.2. Photocatalytic CO2 Reduction Activity

The photocatalytic CO2 reduction activity of the as-prepared CeVO4 nanosheets was studied in the gas-phase reaction system (water vapor, CO2 gas) under simulated solar radiation. During the photocatalytic reaction, carbon monoxide (CO) was detected as the main product and methane (CH4) was detected as the secondary C1 product (Figure 4a,b). With longer time, the rate of CO generation increased linearly except for the CV2 and CV3 samples for which the products cannot be completely detected due to either light absorption by reactive intermediates or the transformation of multielectron-involved products accompanying the high reaction rate. In the photocatalytic CO2 reaction, the rate of CO production first increased and then decreased with the increasing amount of the MEA additive in the preparation process, and the maximum CO generation rate reached 40.97 µmol g−1 h−1 for CV3. This value is 6 and 14 times larger than the corresponding values for CV and CV1, respectively (Figure 4c and Figure 5a,b). CV2 showed superior CO generation (28.94 µmol g−1 h−1) compared to CV1 with a much greater increase compared to CV, demonstrating that for these materials, the interfacial effect modulated by MEA plays a more important role in the photocatalytic process than the specific surface area that is largely controlled by the nanomaterial size. Moreover, the catalytic selectivity was calculated as the ratio of the CO and CH4 production rates and the results are shown in Table 1 and Figure 4d. The catalytic selectivity results show the same trend as that for the CO generation rate and the improved selectivity may be correlated with surface properties controlled by the MEA agent, with CV3 showing the highest CO selectivity with a CO/CH4 ratio of 301.92. In addition, tiny amounts of C2 products were also detected in the reaction system (Figure 4e and Figure 5c). Comparison of the XRD spectra of the as-prepared sample and the sample after the reaction reveals no changes (Figure 5d), indicating that the phase of these nanosheets remain stable during the photocatalytic CO2 reaction process. No products were detected in the absence of either simulated solar radiation or catalysts. Moreover, isotopic substitution experiments showed that for CV3, the obtained 13CO product definitely originates from the reduction in gaseous 13CO2 rather than from other C-containing compounds (Figure 4f). The CO generation rate of the CV3 sample is higher than those for the other reported vanadate photocatalysts [2,3,4]. which shows adverse interfacially electronic structure [27].

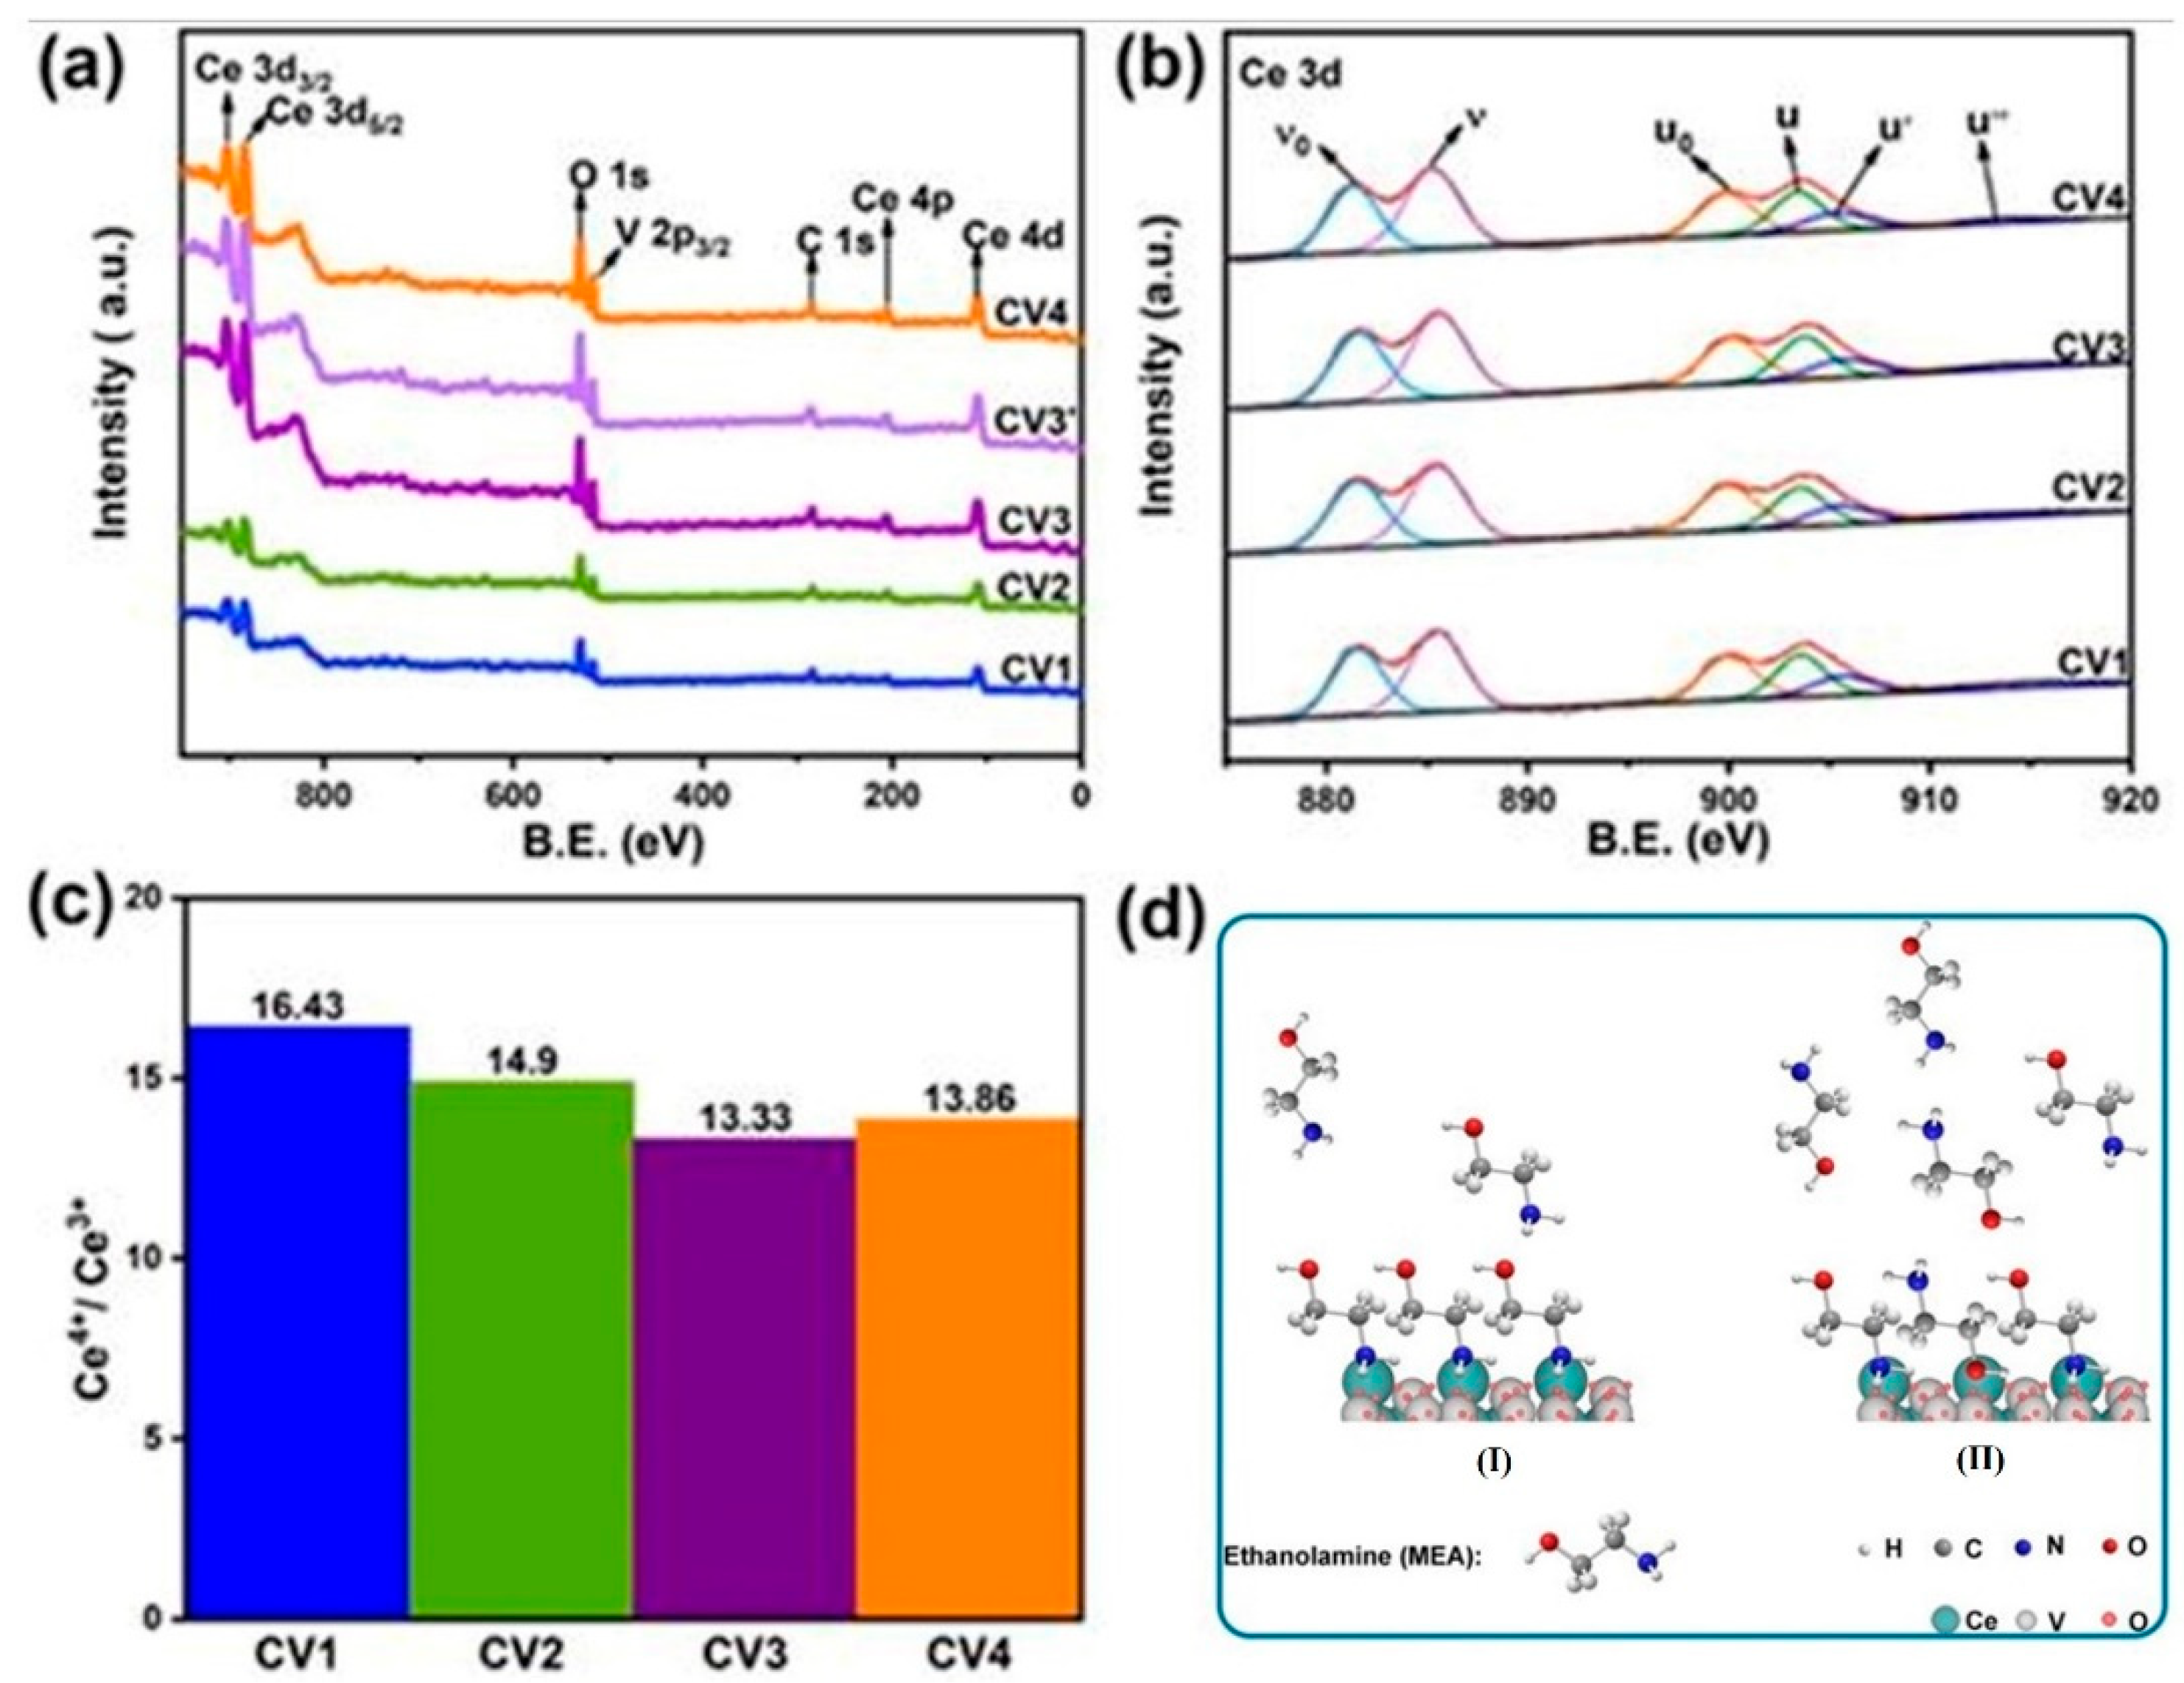
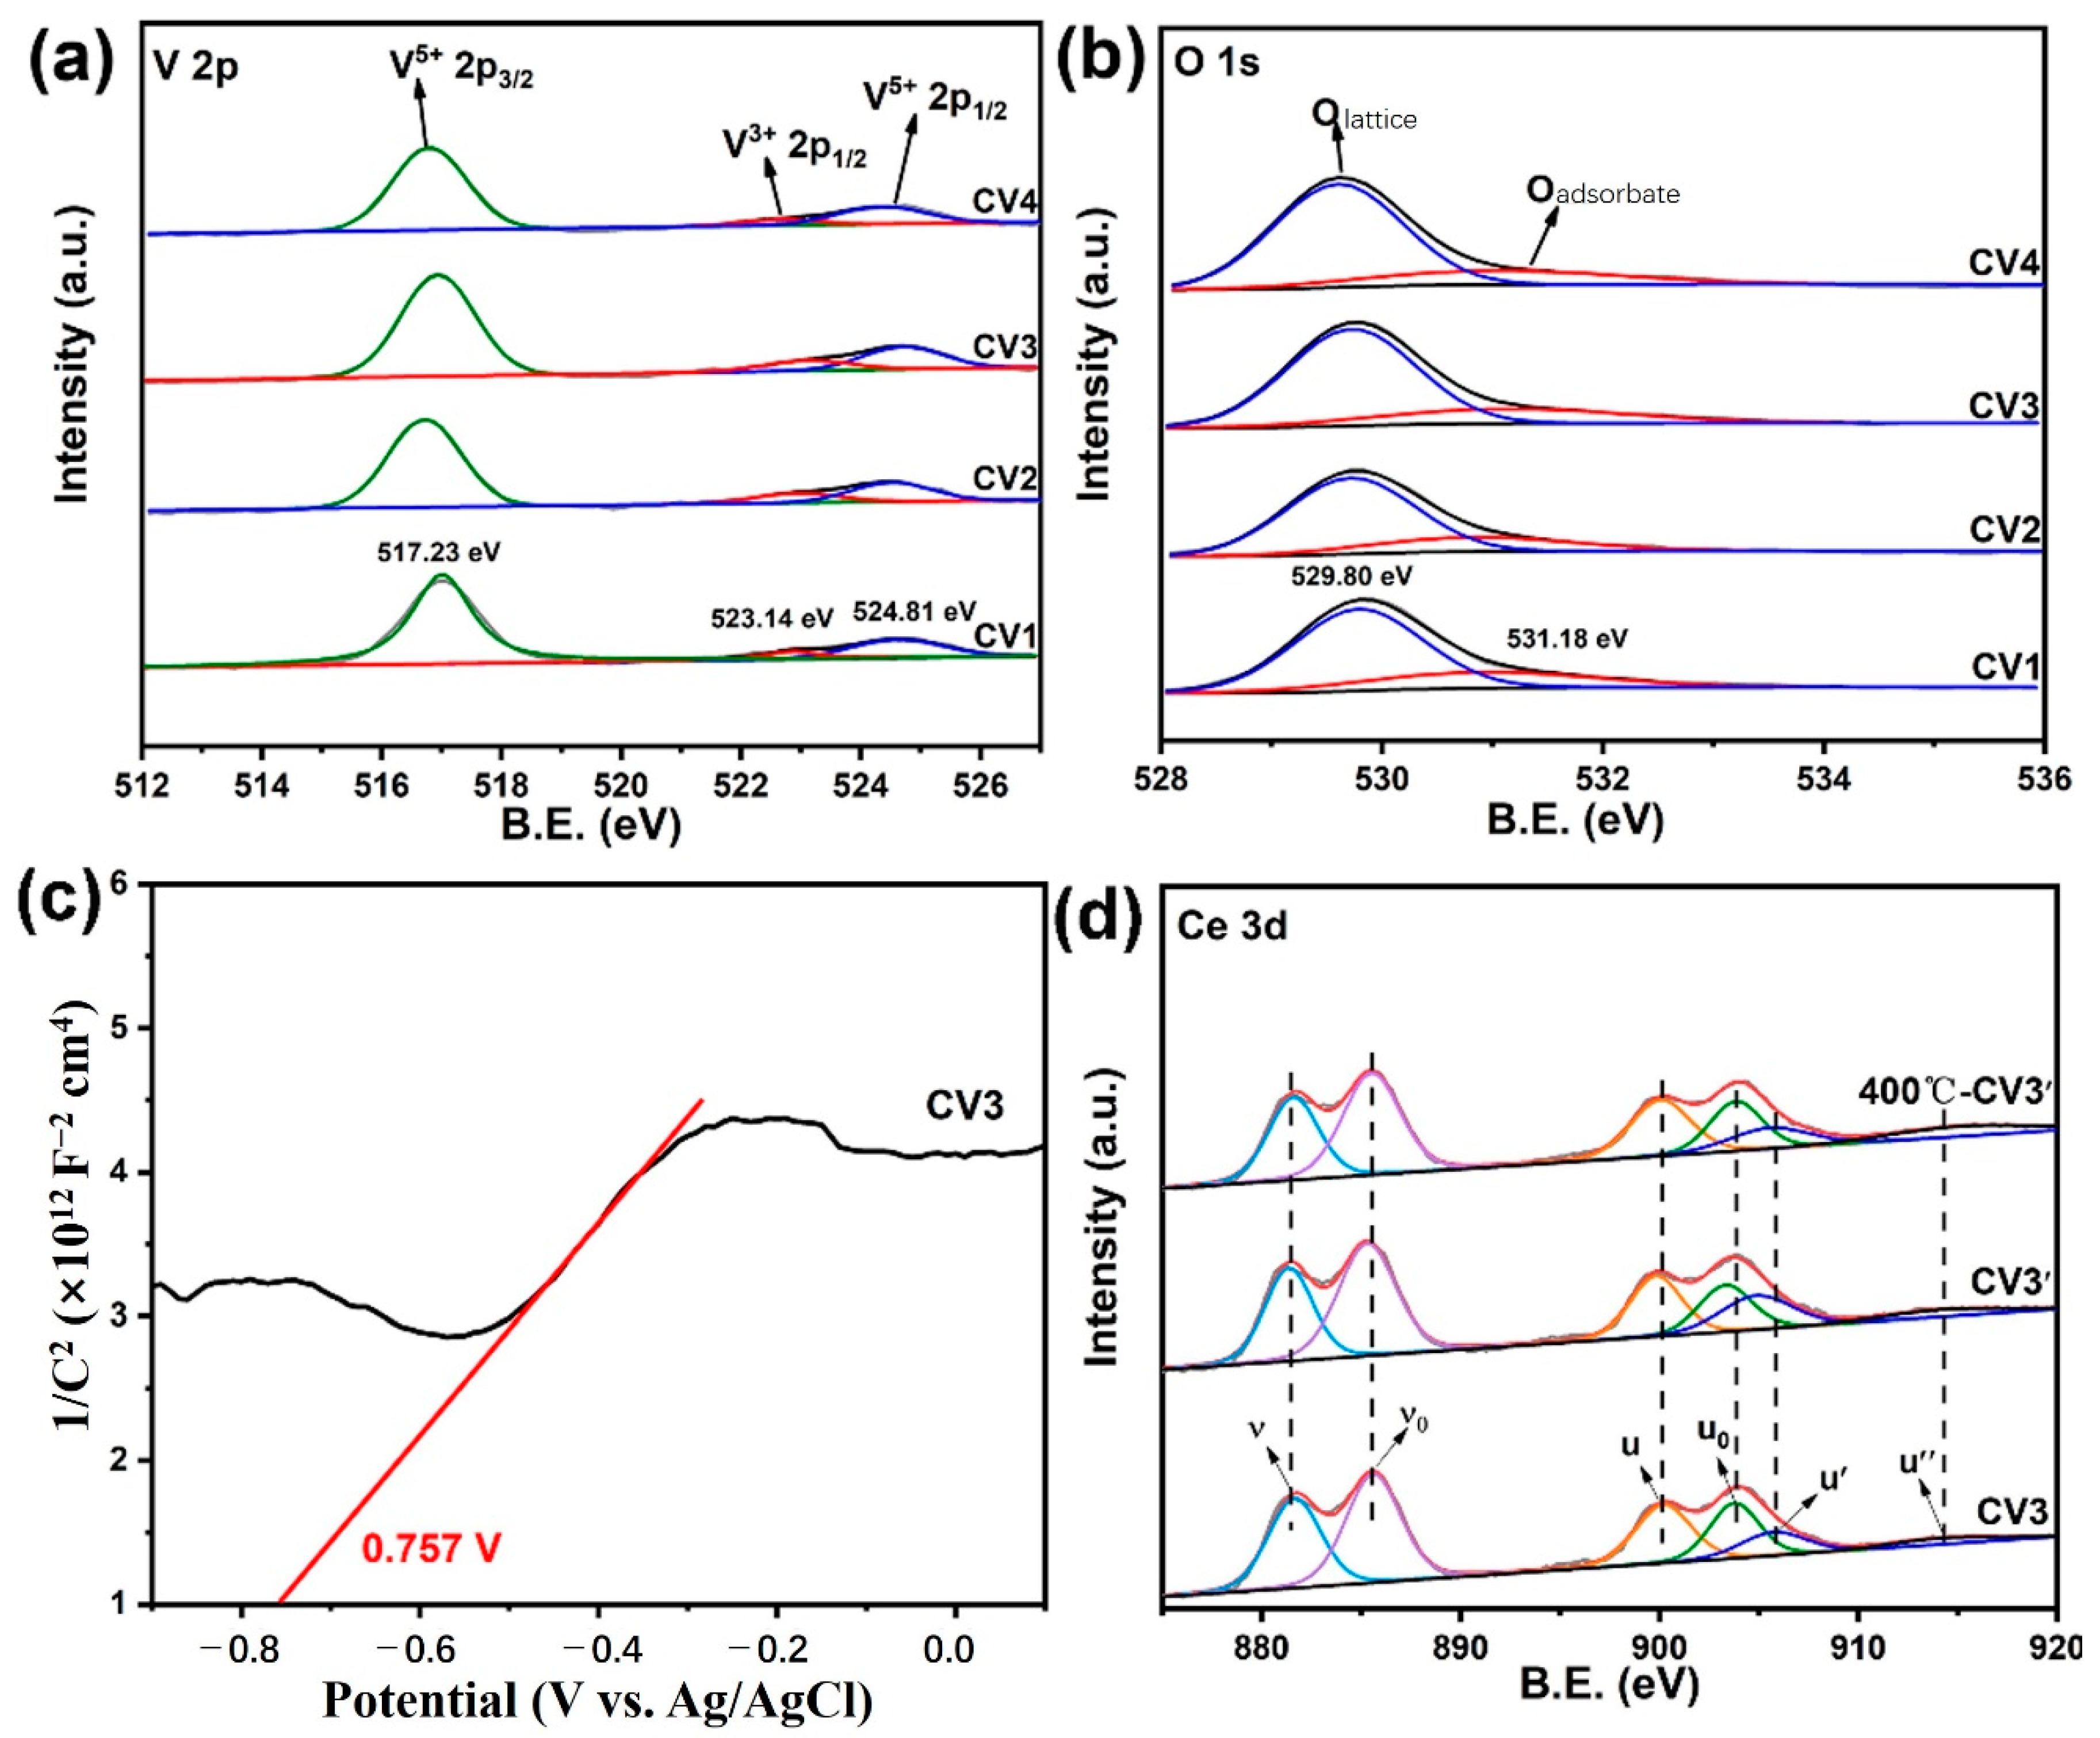
2.3. Spectroscopy Analysis

To investigate the electronic state of the surfaces of the as-prepared samples, X-ray photoelectron spectroscopy (XPS) characterizations were carried out using the C1s peak (294.8 eV) for calibration and Ce 3d, V 2p, O 1s peaks for analysis (Figure 6a). The ratio of Ce and V element is in accordance with the stoichiometric ratio of CeVO4. The Ce 3d XPS spectra of the as-prepared samples display four peaks at the binding energies of 881.6, 885.3, 900.1 and 903.5 eV labeled as ʋ0, ʋ, u0 and u, respectively, corresponding to the Ce3+ state (Figure 6b). The u’ and u’’ signature peaks or Ce4+ at the binding energies of 905.7 and 914.3 eV [13,28] are also observed in the XPS spectra. Generally, the integrated areas of the XPS spectra and the Ce4+/Ce3+ molar concentration ratio are positively correlated. Therefore, the XPS spectra were deconvoluted into the contributions of the two different Ce 3d valence states in order to obtain the Ce4+/Ce3+ molar concentration ratio according to the following formula [29]:
Ce 4 + Ce 3 + = A u + A u A v 0 + A v   + A u 0   + A u  
where Ai is the total integrated area of fitting peak i. The results of the calculations are shown in Figure 6c. It is observed that as the amount of the added MEA increases, the Ce4+/Ce3+ molar concentration ratio gradually decreases for the CV1–3 samples, and CV3 shows the lowest Ce4+/Ce3+ proportion (13.33:100). This change can be understood based on the molecular formula of MEA. MEA contains reducing amino groups and oxidizing hydroxyl groups (Figure 6d); when MEA is used as an addictive in small amounts, the amino groups absorbing on the surface of Ce3+ act as stabilizers and protect the Ce3+ ions from oxidation in the solvent. However, when excessive MEA is introduced in the reactor, hydroxyl groups oxidize Ce3+ to the Ce4+ state [30,31,32], increasing the concentration of the Ce4+ ions in the CV4 sample.
Examination of the XPS results shows that there is no variation in the integrated areas of the V 2p and O 1s XPS spectra of the as-prepared samples (Figure 7a,b). Two V5+ peaks located at 517.2 and 524.8 eV are due to V 2p3/2 and V 2p1/2, respectively, and are accompanied by a small peak at 523.1 eV corresponding to the V 2p1/2 state of V3+. Only two types of surface oxygen (Olattice and Oadsorbate) are observed in the XPS spectra for these samples, corresponding to the two peaks at 529.8 and 531.2 eV, respectively. Compared to CV, the peak position of CV1–4 gradually moves to the lower binding energies, which is likely due to the increasing electron enrichment of the O atoms in these samples. The positive slope of the Mott-Schottky (MS) curve further shows that the as-prepared CeVO4 is a characteristic n-type semiconductor (Figure 7c). The tangent of the MS curve has an x-axis intercept of −0.757 V corresponding to the flat charged potential (vs. Ag/AgCl, pH = 7). Generally, the CB potential of an n-type semiconductor is approximately equal to the flat charging potential. According to the conversion formula [33]:
E ( NHE ) = E ( Ag AgCl ) E θ + 0.059 pH
where E (Ag/AgCl) = 0.197 V at pH = 7. The conduction band (CB) potential of CV3 is determined to be −0.54 V (vs. NHE, pH = 7) and the corresponding valence band (VB) is 1.2 V (vs. NHE, pH = 7), effectively driving the photocatalytic conversion from CO2 to the CO, CH4 and C2 products kinetically. Moreover, the reactive barrier for catalytic reduction can be lowered with the intrinsic Ce4+ defective states, as confirmed by the LSV curves of the as-prepared samples (Figure 8a). The Tafel slope value for the CV3 nanosheets is smaller than that for the CV2 and other samples (363, 388, 311, and 371 mV decade−1 for CV1, CV2, CV3, and CV4, respectively) due to its lower energy input in the catalytic reaction. In addition, the Cep4+/Cep3+ ratio increased by 6.78:100 from 13.33:100 to 20.11:100 for CV3 after the photocatalytic reaction (Figure 7d), as is also confirmed by the results of Raman spectroscopy analysis (Figure 8b,c) carried out to explore the interactions between various groups (Table 2).
The characteristic Raman peaks of the symmetrical stretching (A1g) and the antisymmetric stretching (B1g) of the VO43− tetrahedron are observed at 831 and 760 cm−1, respectively. The Raman peaks at 446 and 354 cm−1 are assigned to the B1g and A1g bending modes of VO43−. The external mode of Ce-VO4 vibration appearing below 250 cm−1 confirms the formation of vanadate (Figure 8b) [10,34]. There is no change in the positions of the characteristic peaks of these groups after the photocatalytic reaction (Figure 8c). By contrast, the Raman peaks of the B1g bending modes of VO43− (448 cm−1) are clearly red-shifted, particularly for the CV3 and CV2 samples that show much higher photocatalytic activities. The red-shift corresponding to stronger Raman scattering originates from the greater energy capture that is likely to be related to the emergence of Ce4+ that lowers the geometric symmetry of the CeVO4 crystal structure. Moreover, the lower photoluminescence (PL) intensity of CV3 compared to CV2 demonstrates its superb photogenerated charge carrier transport behavior that is advantageous for the photocatalytic CO2 reduction (Figure 8d). The PL intensity change after the photocatalytic reaction further confirm presence of photo-induced Ce4+ ions that then reduced into Ce3+ after the post-treatment at 400 °C (Figure 8e and Figure 7d). Additionally, the CV1–4 samples display similar specific surface areas of 22.5332, 23.8444, 21.2346 and 22.9847 m2 g−1 (Figure 8f), respectively, as evaluated by the Brunauer-Emmet-Teller (BET) measurements, showing that the photocatalytic activity difference is not attributed to the surface area.

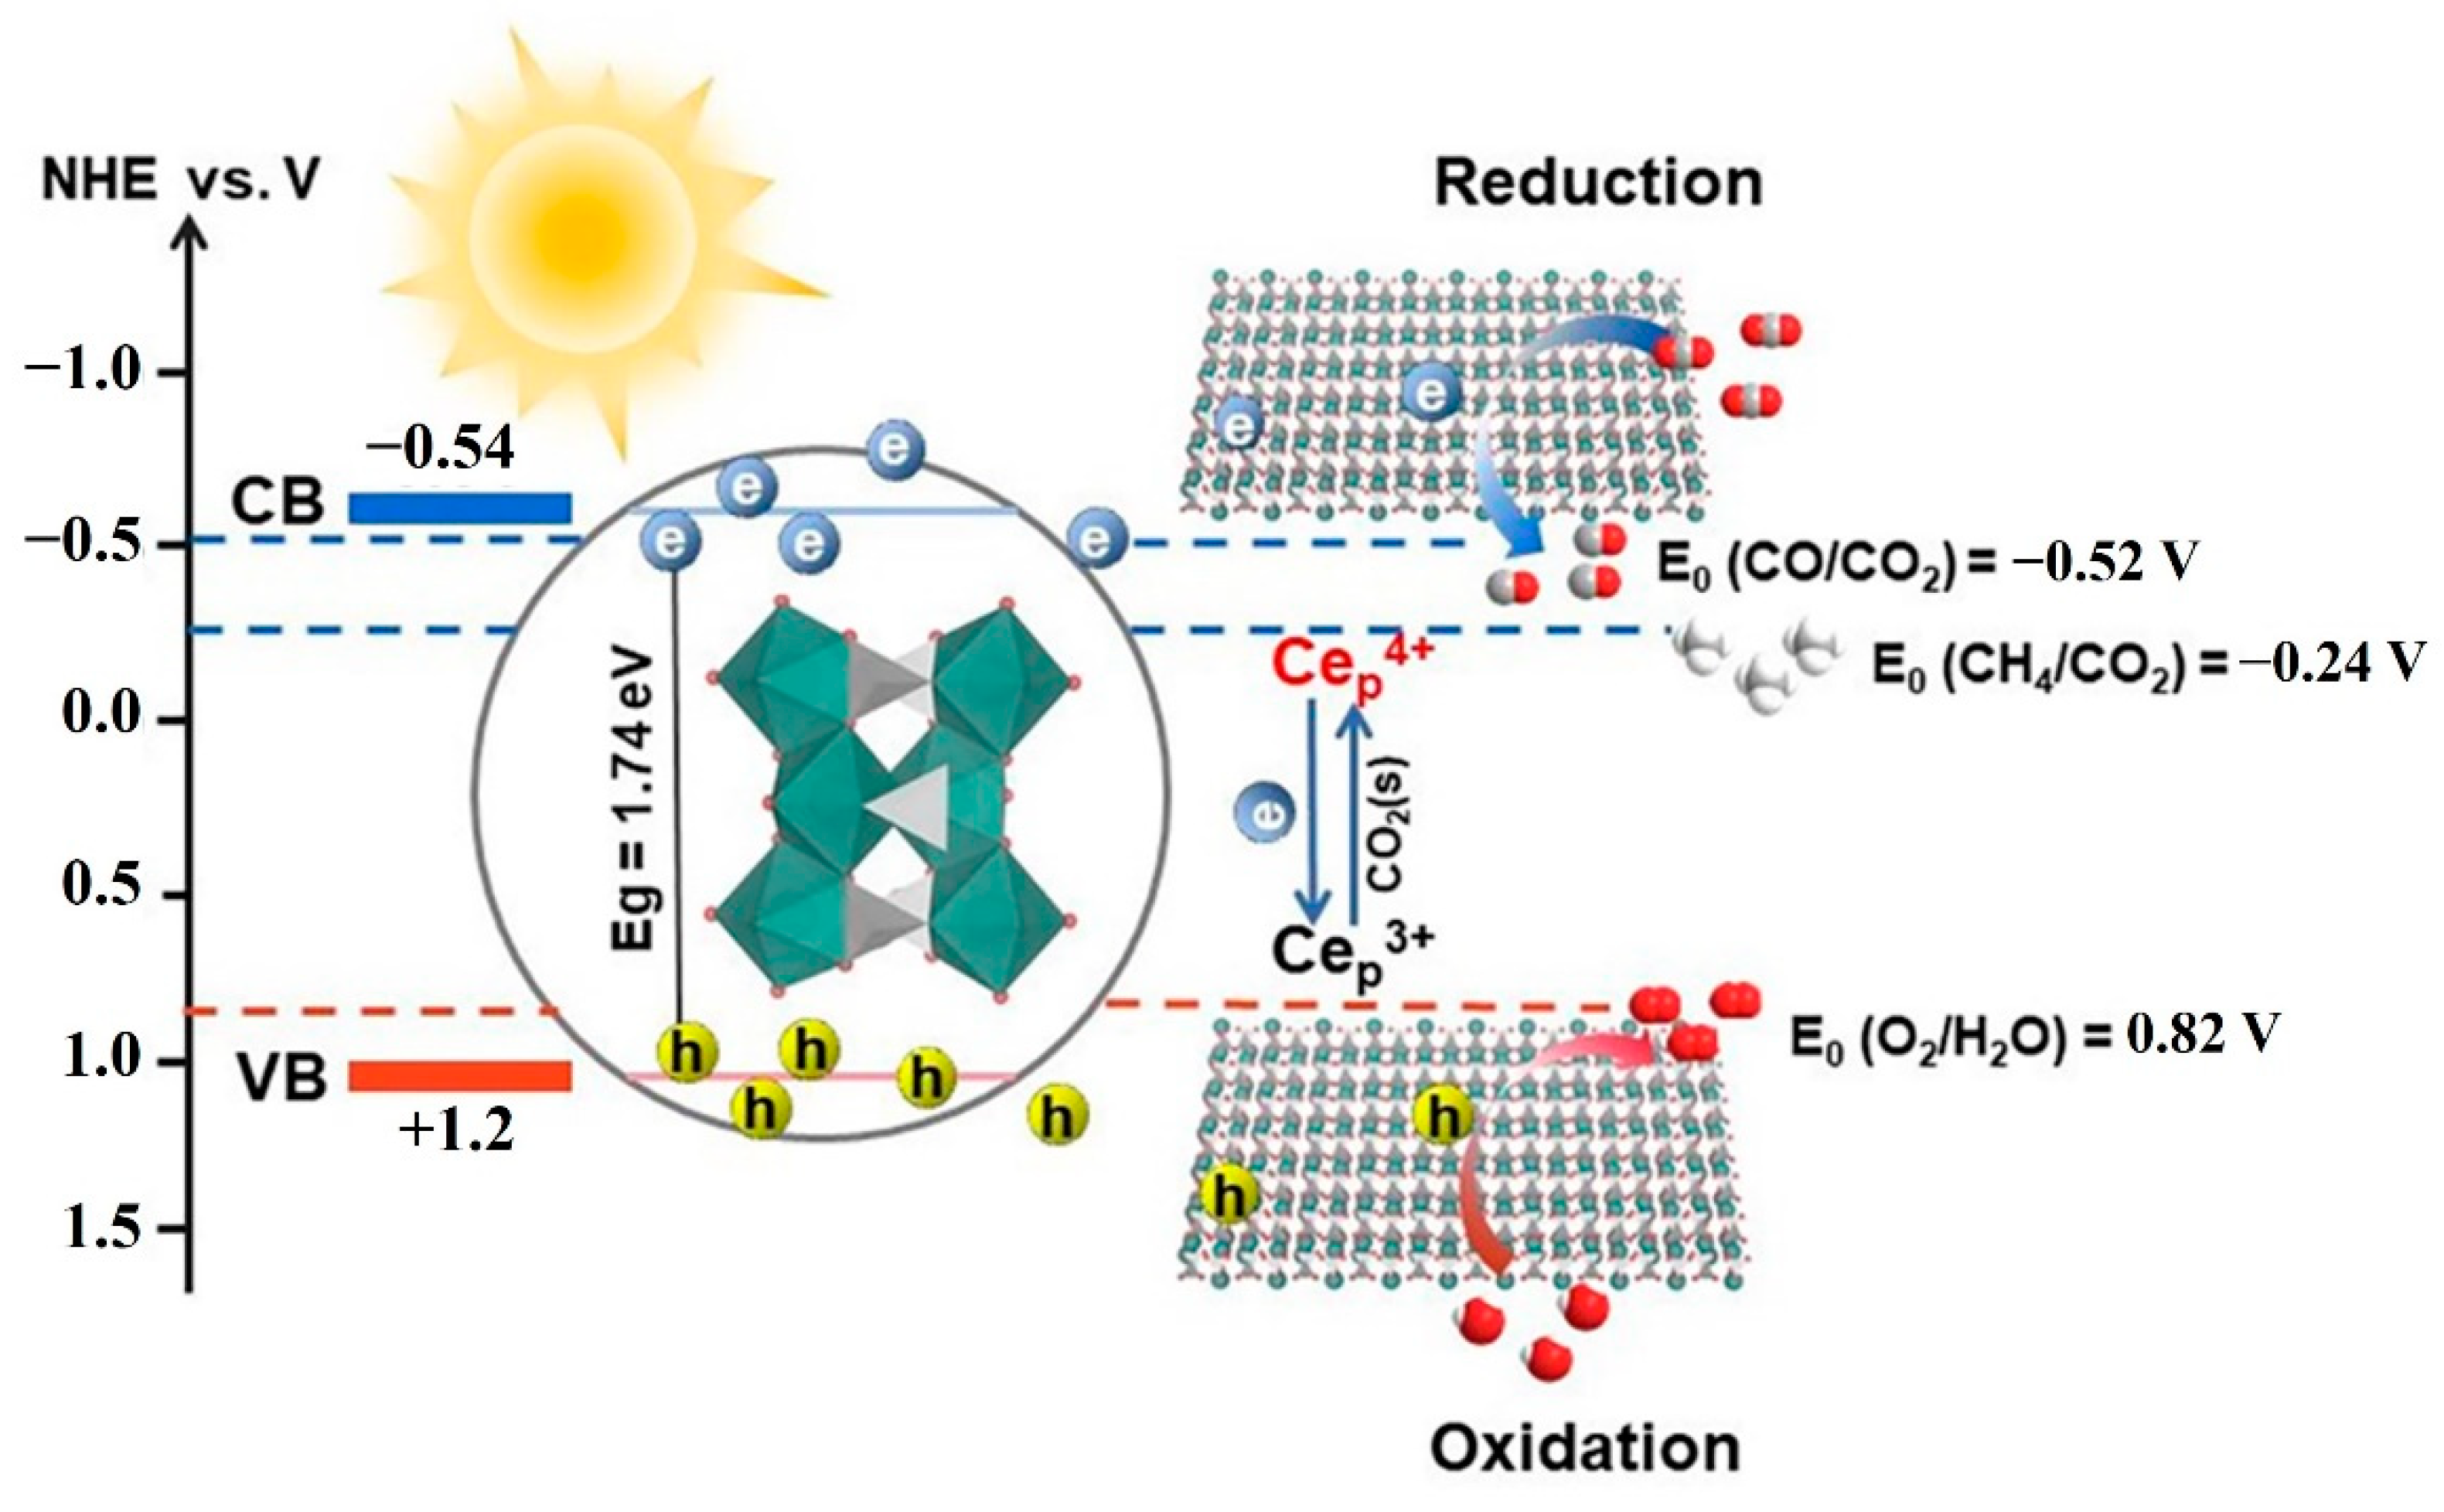
2.4. Photocatalytic Mechanism

These two Ce4+ ion species play important roles in the photocatalytic reaction process. The intrinsic Ce4+ ions act as recombination centers and are unfavorable for photocatalytic CO2 reduction, in which the CO product selectivity is inversely proportional to the intrinsic Ce4+/Ce3+ ratio. By contrast, the Cep4+ are active and inferred to improve the selective photocatalytic CO2 reduction to CO with the valence change. The pathway of photocatalytic CO2 reduction with H2O vapor is illustrated in Figure 9. First, the photogenerated carriers (holes and electrons, denoted as h+ and e, respectively) are generated on the surface of CeVO4 through the absorption of photon energy (hʋ). Simultaneously, a large number of Cep4+ ions appear on the surface of the photocatalysts under solar light irradiation. Next, a Cep4+ ion can be reduced to a Cep3+ ion by capturing the photogenerated electrons and generating an oxygen vacancy (Vo), providing the active site for CO2 adsorption as described by
Ce p 4 + + e Ce p 3 + + V O ,
CO 2 + V O CO 2 ( s ) .
As a reactive intermediate, Vo does not contributed to the XPS O 1s spectrum (Figure 7b). Meanwhile, H+ is generated by
H 2 O + H + 2 H + + 1 2 O 2
Then, the Cep3+ ions capture adsorbed CO2 with Cep4+ and the CO product is generated with assistance of H+ [27,35] as described by
Ce p 3 + + CO 2 ( s ) + 2 H + + e Ce p 4 + + CO + H 2 O
The conduction band position (−0.54 eV vs. NHE for CV3) is more negative than the standard redox potentials of CO and CH4. The existence of the Cep3+/Cep4+ pairs not only improves the effective separation of the photogenerated electrons and holes, but also promotes the absorption and extensive activation of CO2.

3. Materials and Methods

CeVO4 were synthesized by one-step solvothermal method. Firstly, Ce(NO3)3.6H2O 1.0 mmol (≥99.0%, Sinopharm, Shanghai, China) and NH4VO3 1.0 mmol (≥99.0%, Sinopharm, Shanghai, China) were added into 20 mL distilled water, respectively. Secondly, MEA (≥99.0%, Lingfeng, Shanghai, China) was dropped into the prepared solutions as structure-directing agent. The volume of MEA was varied from 1 to 4 mL with the sample of MEA scarcity for comparison. Then, the mixture was transferred to a Teflon-lined stainless-steel autoclave with a 30 mL inner volume after stirring for 2 h and put in an oven heated at 200 °C for 36 h. After the reaction, these samples cooled down to room temperature naturally. The bottom precipitates were centrifuged and washed for 3 times with ethanol and deionized water, respectively. The dark brown CeVO4 samples were successfully obtained after dry in freeze dryer.
The phases of these prepared powder samples were characterized by X-ray diffractometry (XRD; Rigaku Ultima III, Rigaku, Tokyo, Japan) at room temperature. Cu-Ka radiation (λ = 0.154178 nm) was used at 40 kV and 40 mA in a scan range of 10°–90° at a scan rate of 20° min−1. The morphology of the prepared samples was characterized by scanning electron microscopy (SEM, JSM-7800F, JEOL, Tokyo, Japan). Transmission electron microscopy (TEM) and high-resolution transmission electron microscopy (HRTEM) images were taken by TEM (JEM 200CX, JEOL, Tokyo, Japan). UV–visible diffuse reflectance spectra were obtained at room temperature using an ultraviolet-visible spectrophotometer (UV-2550, Shimadzu, Kyoto, Japan) and directly converted to absorption spectra by using the Kubelka-Munk equation in software. AFM images were taken using a Park XE7 (Park SYSTEMS, South Korean) atomic force microscope in non-contact mode. The PL spectra were obtained by using (F-7000, Tianmei, China) FL Spectrophotometer (excitation wavelength 280 nm). Raman spectroscopy is the use of the model Raman spectrometer (WITec alpha 300 M+, WITec, German) under 532 nm laser. The chemical state was examined by X-ray photoelectron spectroscopy (XPS; K-Alpha, Thermo Fisher Scientific, American), and charge correction was performed based on the binding energy of the indefinite C1s peak at 284.8 eV. Using a electrochemical workstation (ZaHNER PP211, Zahner, German), a 0.2 M Na2SO4 solution was used as the electrolyte, Ag/AgCl was used as the reference electrode, and Pt was the counter electrode as the standard of three-electrode system. The Mott-Schotty test was carried out at a frequency of 5 kV, Scan rate is 5 mV/min, and voltage rage at −0.9–0.1 V. The Tafel test by using the other electrochemical workstation (CHI660E, Huachen, Shanghai, China). Scan rate is 5 mV/min, and voltage rage at 0–0.6 V. Working electrode was prepared by deposited catalyst on the F-doped SnO2 conductive glass (FTO).
The photocatalytic reaction of carbon dioxide reduction was carried out at room temperature, and the 0.05 g sample of the prepared powder was evenly weighed on the top of a glass reactor with an area of 4.91 cm2. The bottom of the glass reactor was tied with a magnetic stirrer, it was guaranteed that during the reaction pure CO2 gas is slowly and evenly injected until it fills the reactor. The excess gas was collected with NaHCO3 solution, and finally, the glass reactor was put into a gas-tight reaction system with a volume of about 440 mL. 0.4 mL of pure water was injected from the silicone rubber diaphragm into the reactor through a micro syringe as a reducing agent and injected into the reaction system. After stirring the stirrer for 1 h, the adsorption of CO2-H2O atmosphere was balanced to ensure complete adsorption. A solar simulator (Micro-solar 300 W xenon lamp) was used to illuminate the vertical sample. From the start of the xenon lamp, the lighting time is 6 h. Draw about 1 mL of gas from the reaction cell. After injection, a gas chromatograph (GC-2014, Shimadzu Corporation, Kyoto, Japan) was used to analyze the subsequent reaction products. The isotope-labelled experiments were implemented using 13CO2 as the original reactant, and the products were analyzed using gas chromatograph-mass spectrometry (QP2010SE, Shimadzu Corporation, Kyoto, Japan).

4. Conclusions

In summary, ultrathin CeVO4 nanosheets with a thickness of approximately 1.7 nm were synthesized by one-step hydrothermal method with MEA as the structure-directing agent. This photocatalyst has a narrow bandgap of approximately 1.74 eV, extending the optical absorbance edge to 700 nm, and exhibits superior light capture. The proportion of Ce4+ ions can be decreased by MEA without either morphology or phase changes. The optimal photocatalytic activity is obtained when the Ce4+/Ce3+ molar ratio decreases to 13.33:100 for the CV3 sample. The maximum yield rate of CO is 40.97 µmol g−1 h−1 for CV3, showing an enhancement by 6 times compared to CV. Moreover, the Ce4+/Ce3+ ratio is negatively correlated with and modulates the C1 product selectivity. Finally, the likely reaction mechanism is proposed based on the Cep4+/Cep3+ pairs that give rise to the photocatalytic reaction process and drive the selective photocatalytic CO2 reduction to CO. The atomic valence regulation demonstrated in this work provides an effective alternative approach for the improvement of the product selectivity and efficiency enhancement in photocatalytic reactions.

Author Contributions

Methodology, L.D. and H.L.; software, L.D.; validation, L.D., H.L. and Q.H.; formal analysis, L.D., H.L., Q.H. and Y.Y.; investigation, L.D. and H.L.; resources, L.D.; data curation, G.L., H.Z. and X.R.; writing—original draft preparation, L.D.; writing—review and editing, P.L. and Y.X.; visualization, L.D.; supervision, P.L.; project administration, P.L., Y.C. and Y.Z.; funding acquisition, P.L. All authors have read and agreed to the published version of the manuscript.

Funding

This work was supported by the National Natural Science Foundation of China (Nos. 21802071, 51972172, 61705102, 61605073, 61935017, 91833304, 11974180 and 91733302), the National Natural Science Foundation of Jiangsu Province (Nos. BK20170979, BK20191293), Projects of International Cooperation and Exchanges NSFC (51811530018), Young 1000 Talents Global Recruitment Program of China, Jiangsu Specially-Appointed Professor program, and “Six talent peaks” Project in Jiangsu Province, China.

Data Availability Statement

The data of this research are available within the manuscript.

Acknowledgments

We are grateful to the experiment platform by the Institute of Advanced Materials of Nanjing Tech University. Thanks to the TEM characterization provided from Nanjing University and isotropic experiment provided by Nanjing University of Science and Technology.

Conflicts of Interest

The authors declare no conflict of interest.

References

  1. Stolarczyk, J.K.; Bhattacharyya, S.; Polavarapu, L.; Feldmann, J. Challenges and prospects in solar water splitting and CO2 reduction with inorganic and hybrid nanostructures. ACS Catal. 2018, 8, 3602–3635. [Google Scholar] [CrossRef]
  2. Wang, L.; Chen, W.; Zhang, D.; Du, Y.; Amal, R.; Qiao, S.; Wu, J.; Yin, Z. Surface strategies for catalytic CO2 reduction: From two-dimensional materials to nanoclusters to single atoms. Chem. Soc. Rev. 2019, 48, 5305–5426. [Google Scholar] [CrossRef]
  3. Lingampalli, S.R.; Ayyub, M.; Rao, C.N.R. Recent progress in the photocatalytic reduction of carbon dioxide. ACS Omega 2017, 2, 2740–2748. [Google Scholar] [CrossRef] [Green Version]
  4. Han, Q.; Bai, X.; Man, Z.; He, H.; Li, L.; Hu, J.; Alsaedi, A.; Hayat, T.; Yu, Z.; Zhang, W.; et al. Convincing synthesis of atomically thin, single-crystalline InVO4 sheets toward promoting highly selective and efficient solar conversion of CO2 into CO. J. Am. Chem. Soc. 2019, 141, 4209–4213. [Google Scholar] [CrossRef] [PubMed]
  5. Wang, K.; Zhang, L.; Su, Y.; Sun, S.; Wang, Q.; Wang, H.; Wang, W. Boosted CO2 photoreduction to methane via Co doping in bismuth vanadate atomic layers. Catal. Sci. Technol. 2018, 8, 3115–3122. [Google Scholar] [CrossRef]
  6. Chen, X.; Zhuang, C.; Wang, X.; Liao, A.; Li, L.; Liu, Q.; Tang, Y.; Wu, C.; Shen, Q.; Yu, Z.; et al. Two-Step Synthesis of Laminar Vanadate via a Facile Hydrothermal Route and Enhancing the Photocatalytic Reduction of CO2 into Solar Fuel through Tuning of the Oxygen Vacancies by in Situ Vacuum Illumination Treatment. ACS Appl. Energy Mater. 2018, 1, 6857–6864. [Google Scholar] [CrossRef]
  7. Watanabe, A. Highly conductive oxides, CeVO4, Ce12xMxVO420.5x(M Ca, Sr, Pb) and Ce12yBiyVO4, with zircon-type structure prepared by solid-state reaction in air. J. Solid State Chem. 2000, 153, 174–179. [Google Scholar] [CrossRef]
  8. Mahapatra, S.; Madras, G.; Row, T.N.G. Synthesis, characterization and photocatalytic activity of lanthanide (Ce, Pr and Nd) orthovanadates. Ind. Eng. Chem. Res. 2007, 46, 1013–1017. [Google Scholar] [CrossRef]
  9. Dolgos, M.R.; Paraskos, A.M.; Stoltzfus, M.W.; Yarnell, S.C.; Woodward, P.M. The electronic structures of vanadate salts: Cation substitution as a tool for band gap manipulation. J. Solid State Chem. 2009, 182, 1964–1971. [Google Scholar] [CrossRef]
  10. Phuruangrat, A.; Kuntalue, B.; Thongtem, S.; Thongtem, T. Effect of PEG on phase, morphology and photocatalytic activity of CeVO4 nanostructures. Mater. Lett. 2016, 174, 138–141. [Google Scholar] [CrossRef]
  11. Lu, G.; Zou, X.; Wang, F.; Wang, H.; Li, W. Facile fabrication of CeVO4 microspheres with efficient visible-light photocatalytic activity. Mater. Lett. 2017, 195, 168–171. [Google Scholar] [CrossRef]
  12. Allen, J.P.; Galea, N.M.; Watson, G.W. Valence states in CeVO4 and Ce0.5Bi0.5VO4 probed by density functional theory calculations and X-ray photoemission spectroscopy. J. Phys. Chem. C 2014, 118, 25330–25339. [Google Scholar] [CrossRef]
  13. Luo, F.; Jia, C.; Liu, R.; Sun, L.; Yan, C. Nanorods-assembled CeVO4 hollow spheres as active catalyst for oxidative dehydrogenation of propane. Mater. Res. Bull. 2013, 48, 1122–1127. [Google Scholar] [CrossRef]
  14. Shen, Y.; Huang, Y.; Zheng, S.; Guo, X.; Chen, Z.; Peng, L.; Ding, W. Nanocrystals of CeVO4 doped by metallic heteroions. Inorg. Chem. 2011, 50, 6189–6194. [Google Scholar] [CrossRef] [PubMed]
  15. Singh, N.; Mugesh, G. CeVO4 nanozymes catalyze the reduction of dioxygen to water without releasing partially reduced oxygen species. Angew. Chem. Int. Ed. 2019, 58, 7797–7801. [Google Scholar] [CrossRef] [PubMed]
  16. Ao, B.; Qiu, R.; Hu, S. First-principles Insights into the oxidation states and electronic structures of ceria-based binary, ternary and quaternary oxides. J. Phys. Chem. C 2019, 123, 175–184. [Google Scholar] [CrossRef]
  17. Chang, M.; Wang, M.; Chen, Y.; Shu, M.; Zhao, Y.; Ding, B.; Hou, Z.; Lin, J. Self-assembled CeVO4/Ag nanohybrid as photo conversion agents with enhanced solar-driven photocatalysis and NIR-responsive photothermal/photodynamic synergistic therapy performance. Nanoscale 2019, 11, 10129–10136. [Google Scholar] [CrossRef]
  18. Juez, A.I.; Huerta, M.V.M.; García, E.R.; Jehng, J.M.; Bañares, M.A. On the nature of the unusual redox cycle at the vanadia ceria interface. J. Phys. Chem. C 2018, 122, 1197–1205. [Google Scholar] [CrossRef]
  19. Bandiello, E.; Errandonea, D.; Platas, J.G.; Hernandez, P.R.; Munoz, A.; Bettinelli, M.; Popescu, C. Phase behavior of TmVO4 under hydrostatic compression: An experimental and theoretical study. Inorg. Chem. 2020, 59, 4882–4894. [Google Scholar] [CrossRef]
  20. Guan, J.; Li, J.; Ye, Z.; Wu, D.; Liu, C.; Wang, H.; Ma, C.; Huo, P.; Yan, Y. La2O3 media enhanced electrons transfer for improved CeVO4@halloysite nanotubes photocatalytic activity for removing tetracycline. J. Taiwan Inst. Chem. E 2019, 96, 281–298. [Google Scholar] [CrossRef]
  21. Kokulnathan, T.; Priya, T.S.; Wang, T.J. Surface engineering three-dimensional flowerlike cerium vanadate nanostructures used as electrocatalysts: Real time monitoring of clioquinol in biological samples. ACS Sustain. Chem. Eng. 2019, 7, 16121–16130. [Google Scholar] [CrossRef]
  22. Lu, Q.; Gao, F.; Zhao, D. One-step synthesis and assembly of copper sulfide nanoparticles to nanowires, nanotubes, and nanovesicles by a simple organic amine-assisted hydrothermal process. Nano Lett. 2002, 2, 725–728. [Google Scholar] [CrossRef]
  23. Jin, M.H.; Shin, E.; Jin, S.; Jo, H.; Min, K.; Hong, J. Solvothermal synthesis of ferroelectric BaTiO3 nanoparticles and their application to dye-sensitized solar cells. J. Korean Phys. Soc. 2018, 73, 627–631. [Google Scholar] [CrossRef]
  24. Xing, G.; Huang, M.; Hao, S.; He, C.; Li, X.; Fan, L.; Li, Y. One-pot and high-yield preparation of ultrathin β-PbO nanowires and nanosheets for high-capacity positive electrodes in lead-acid batteries. J. Alloys Compd. 2020, 831, 154845–154855. [Google Scholar] [CrossRef]
  25. Gillot, S.; Dacquin, J.P.; Dujardin, C.; Tricot, G.; Vezin, H.; Granger, P. Impact of thermal aging on the SCR performance of tungsten doped CeVO4 mixed oxides. Top. Catal. 2018, 62, 49–55. [Google Scholar] [CrossRef]
  26. Chen, Z.; Jia, H.; Sharafudeen, K.; Dai, W.; Liu, Y.; Dong, G.; Qiu, J. Up-conversion luminescence from single vanadate through blackbody radiation harvesting broadband near-infrared photons for photovoltaic cells. J. Alloys Compd. 2016, 663, 204–210. [Google Scholar] [CrossRef]
  27. Zhao, X.; Huang, L.; Namuangruk, S.; Hu, H.; Hu, X.; Shia, L.; Zhang, D. Morphology-dependent performance of Zr-CeVO4/TiO2 for selective catalytic reduction of NO with NH3. Catal. Sci. Technol. 2016, 6, 5543–5553. [Google Scholar] [CrossRef]
  28. Melchionna, M.; Fornasiero, P. Updates on the roadmap for photocatalysis. ACS Catal. 2020, 10, 5493–5501. [Google Scholar] [CrossRef] [Green Version]
  29. Hu, Q.; Huang, B.; Lia, Y.; Zhang, S.; Zhang, Y.; Hua, X.; Liu, G.; Li, B.; Zhou, J.; Xie, E.; et al. Methanol gas detection of electrospun CeO2 nanofibers by regulating Ce3+/ Ce4+ mole ratio via Pd doping. Sens. Actuat. B Chem. 2020, 307, 127638. [Google Scholar] [CrossRef]
  30. Meltsner, M.; Wohlberg, C.; Kleiner, M.J. Reduction of organic compounds by ethanolamines. J. Am. Chem. Soc. 1935, 57, 2554. [Google Scholar] [CrossRef]
  31. Pratt, H.D., III; Rose, A.J.; Staiger, C.L.; Ingersoll, D.; Anderson, T.M. Synthesis and characterization of ionic liquids containing copper, manganese, or zinc coordination cations. Dalton Trans. 2011, 40, 11396–11401. [Google Scholar] [CrossRef] [PubMed]
  32. Xie, J.; He, Y.; Li, X.; Duan, M.; Tang, J.; Wang, Y.; Chamas, M.; Wang, H. Adjustable band position of strontium titanate by doping-free solvents effect and its correlation with photodegradation performance. J. Mater. Sci. Mater. Electron. 2017, 28, 14981–14987. [Google Scholar] [CrossRef]
  33. Cao, S.; Shen, B.; Tong, T.; Fu, J.; Yu, J. 2D/2D Heterojunction of Ultrathin MXene/Bi2WO6 Nanosheets for Improved Photocatalytic CO2 Reduction. Adv. Funct. Mater. 2018, 28, 1800136. [Google Scholar] [CrossRef]
  34. Hojamberdiev, M.; Kadirov, Z.C.; Makinose, Y.; Zhu, G.; Emin, S.; Matsushit, N.; Hasegawa, M.; Okada, K. Involving CeVO4 in improving the photocatalytic activity of a Bi2WO6/allophane composite for the degradation of gaseous acetaldehyde under visible light. Colloids Surf. A Physicochem. Eng. Asp. 2017, 529, 600–612. [Google Scholar] [CrossRef]
  35. Ye, T.; Huang, W.; Zeng, L.; Li, M.; Shi, J. CeO2-x platelet from monometallic cerium layered double hydroxides and its photocatalytic reduction of CO2. Appl. Catal. B Environ. 2017, 210, 141–148. [Google Scholar] [CrossRef]
Figure 1. (ae) SEM images of all as-prepared samples CV-CV4, (f) Ultraviolet-visible absorption spectra of CV-CV4. (inset plots of (αhν)1/2 vs. photo energy of CV-CV4).
Catalysts 11 01115 g001
Figure 2. TEM images of CV3 selected from different areas (ad), and AFM characterization of CV3 (e).
Catalysts 11 01115 g002
Figure 3. (a) TEM image, (b) HRTEM image, (c) TEM image with crimpled edges of the nanosheets (CV3) from the vertical direction, (d) crystal structure model of the CeVO4 nanosheet, (e) XRD patterns of the as-prepared CV-CV4 samples and the standard spectrum of the tetragonal phase of CeVO4.
Catalysts 11 01115 g003
Figure 4. Photocatalytic (a) CO yields, (b) CH4 yields, (c) the ratio of CO and CH4 production rates, (d) comparison of the photocatalytic selectivity of the samples, (e) C2 yields after 6 h photocatalytic reaction, and (f) isotopic substitution experiment using 13CO2 as the reactant.
Catalysts 11 01115 g004
Figure 5. Photocatalytic (a) CO yields, (b) CH4 yields for CV, (c) C2 products (C2H6, C2H4, C2H2) evolution amounts in the photocatalytic CO2 reduction for CV and CV3, (d) XRD patterns of CV3 in comparison with CV3’ obtained after photocatalytic reaction.
Catalysts 11 01115 g005
Figure 6. (a) XPS spectra of the as-prepared samples, (b) Ce 3d and (c) Ce4+/Ce3+ ratio, (d) Possible interaction between MEA and Ce (I) process of protect Ce3+ in lowly ethanolamine concentration (II) process of oxidize Ce3+ in highly ethanolamine concentration.
Catalysts 11 01115 g006
Figure 7. XPS spectra for CV1–4: (a) V element, (b) O element, (c) Mott-Schottky curve of CV3, (d) XPS spectra for CV3, CV3’ and 400 °C-CV3’.
Catalysts 11 01115 g007
Figure 8. (a) LSV curves of CV1-CV4, (b,c) comparison of the Raman spectra, (d,e) photoluminescence spectra of the CeVO4 catalysts before and after the photocatalytic reaction and (f) BET curves of CV1-CV4.
Catalysts 11 01115 g008
Figure 9. Schematic illustration of the catalytic pathways for the photocatalytic CO2 reduction with H2O vapor.
Catalysts 11 01115 g009
Table 1. Generation rates of CO and CH4, and their ratio.
SamplesCO
(μmol g−1h−1)
CH4
(μmol g−1h−1)
CO/CH4
CV6.680.0325205.61
CV12.750.065541.91
CV228.940.47760.64
CV340.970.136301.92
CV417.680.0905195.38
Table 2. Raman peaks and various groups.
Raman PeaksGroupRaman Vibrations Modes
831 cm−1-VO43−symmetric stretching (A1g)
760 cm−1-VO43−anti-symmetric stretching (B1g)
446 cm−1-VO43−bending mode (B1g)
354 cm−1-VO43−bending mode (A1g)
below 250 cm−1Ce-VO4external mode (Eg)
Publisher’s Note: MDPI stays neutral with regard to jurisdictional claims in published maps and institutional affiliations.

