1. Introduction
Currently, significant volumes of water containing pharmaceutical residues are released into the environment, given the number of existing health care establishments or pharmaceutical industries. Pharmaceutical residues in surface waters have negative impacts on planktonic species [
1] and some studies indicate that surface water pharmaceutical levels can lead to potential environmental concerns for aquatic ecosystems [
2].
To remove pharmaceutical residues from water, various Advanced Oxidation Processes (AOPs) have been studied for many years, using electrochemical methods [
3], ozonation [
4], UV-light in photocatalytic oxidation [
5], Fenton and photo Fenton-like processes [
6]. AOP techniques proceed via reactive oxygen species such as ozone [
7], hydrogen peroxide [
8], or short-lived species such as hydroxyl radicals or atomic oxygen [
9].
Non-thermal Plasmas (NTPs) have been tested to treat various organic compounds and drug residues in water and appear to be a relevant AOP technique [
10,
11,
12,
13]. They have been used in various ways and the efficiencies (conversion, energy yield) were found to depend on the reactor configuration, the nature and concentration of the target molecules, and the water matrix (distilled, pure, or tap waters). Besides the removal of the target compound, it is important to achieve good mineralization, which represents the conversion of the parent molecule into carbon dioxide and water and eventually other inorganic compounds. A low mineralization degree, in spite of high removal efficiency, means that the treated effluent still contains large amounts of organic carbon, i.e., the by-products resulting from the initial compound degradation. These degradation products may sometimes be as harmful or even more dangerous than the pollutant. In practice, complete mineralization is required only for highly toxic compounds. However, high mineralization is usually required in order to make the effluent more amenable to conventional treatment.
Among the papers in the literature on the treatment of pharmaceutical molecules in water using NTPs, only a few articles concern the degradation of Paracetamol molecules [
11,
13,
14,
15]. Panorel et al. [
11] used a Pulsed Corona Discharge to oxidize paracetamol and to achieve complete degradation in a short time period with an energy yield in the range of 20–70 g (kWh)
−1 depending on the power and working gas. Even with a high power, in the range of 200 to 850 W, the Total Organic Carbon (TOC) removal was only about 20% when the paracetamol conversion reached 100%. Baloul et al. [
13] used a multiple needle-to-plate Dielectric Barrier Discharge (DBD) reactor for the treatment of paracetamol in aqueous medium with only 0.3 W injected power. In the case of O
2-Ar as injected gas, the conversion rate reached about 100% with an energy yield of around 5 g (kWh)
−1. The best energy yield of 12 g (kWh)
−1 was obtained for a gas mixture of air-Ar. Their paper also showed that carboxylic acids and aromatic compounds are the main degradation products of paracetamol in liquid and very low TOC removal rate was obtained, i.e., a very weak mineralization. Recently, Pan and Qiao [
14] reported that in their experiment using a cylindrical DBD reactor, the 10 mg L
−1 paracetamol concentration was removed completely after 5 min treatment with a TOC removal rate of 46.3% after 20 min treatment under 500 W discharge power and 50 mL·min
−1 air flow rate. Even with this short time of 5 min, the large dissipated power of 500 W implied a rather low energy yield of only 0.36 g (kWh)
−1. Moreover, one point reported in the paper requires clarification: the total volume was 1500 mL and the recirculating flow rate was 50 mL·min
−1, implying a duration of 30 min to ensure that all the liquid has passed through the plasma zone, much longer than the duration of 5 min reported. Furthermore, Iervolino et al. [
15] studied the degradation of 25 mg L
−1 paracetamol in water using a cylindrical DBD reactor. They obtained a complete degradation and mineralization of paracetamol within 15 min using pure O
2 as working gas. However, their best energy yield of 0.59 g (kWh)
−1 was much lower than that of 12 g (kWh)
−1 obtained in our previous work [
13].
Coupling several AOPs, such as the Fenton process [
16,
17] and catalytic ozonation [
18], which have been extensively studied, may increase the mineralization. Heterogeneous catalytic ozonation has been studied over various materials such as unsupported metal oxides (MnO
2, TiO
2, Al
2O
3), supported metals, or metal oxides (Fe, Mn, Ni, etc.) [
7,
19]. The catalytic activity is mainly based on the decomposition of ozone at the surface of the catalyst leading to the enhanced generation of HO
• radicals. When performing the reaction under oxidative conditions, it was reported that the Fenton process is particularly efficient for the mineralization of a wide range of organic compounds, as the presence of oxygen enhances the degradation of the pharmaceutical residues thanks to the occurrence of auto-oxidation initiated by HO
• radicals [
20]. Many investigations have focused on the development of stable heterogeneous catalysts to minimize leaching while increasing catalytic activity and long-term stability. However, the development of a more reliable process involving catalysts is still necessary [
21].
Recently, studies on the combination of plasma with a catalyst, called the plasma-catalyst process, have been reported for polluted wastewater treatment [
22,
23]. They showed that the presence of cerium-based catalysts as powder dispersed in the aqueous solution improved the mineralization of phenol. Kusic et al. obtained high phenol removal results by electrical discharge in combination with FeZSM5, which was attributed to the catalytic activity of iron [
24].
The present study focused on enhancing the mineralization rate for paracetamol degradation in water using a coupled plasma-catalysis process. For this, NTP-Catalysis coupling based on the Fenton-like mechanism was chosen. In our experimental conditions, NTP alone produced a small amount of HO
• due to the extremely low power dissipated. The coupling with the catalyst allowed for a greater amount of HO
• to be produced thanks to the Fenton-like effect of Fe
3+, which regenerates HO
• from H
2O
2. The NTP rector already used in the work of Baloul et al. [
13] was used. The manufacturing protocols of the homemade supported catalyst are described in detail in
Section 3 together with the experimental setup.
2. Results and Discussion
To demonstrate the decisive role of Plasma-Catalysis coupling in obtaining a good mineralization rate, plasma treatment experiments were conducted with and without coupling to a catalyst for comparison. The experiments were performed under similar conditions to those in our previous work [
13]. The treatment was performed with an applied square alternative High Voltage (HV) of ±5.9 kV in amplitude and 500 Hz in frequency. The electrical discharge operated under the streamer regime instead of the spark regime as the latter caused excessive water evaporation and rapid damage to the electrodes [
25]. The injected working gas was dry air with a flow rate of 100 standard cubic centimeters per minute (sccm) since it was established in the above-mentioned work that O
2 is mandatory in a DBD discharge for efficient paracetamol degradation.
A homemade supported-catalyst was immersed in the liquid to be treated in the DBD plasma reactor. The advantages of using Fe
3+ salt in a heterogeneous Fenton (i.e., Fenton-like) process rather than Fe
2+ (i.e., Fenton) are its lower cost, non-iron-containing sludge generation, and the ease of catalyst separation and reuse [
26,
27]. In the current work, the Fenton-like process was initiated by the in-situ generation of H
2O
2 by the discharge plasma at an initial pH of 6.1 without adding any external chemical reagent.
2.1. Conversion Rate
In the previous work by Baloul et al. [
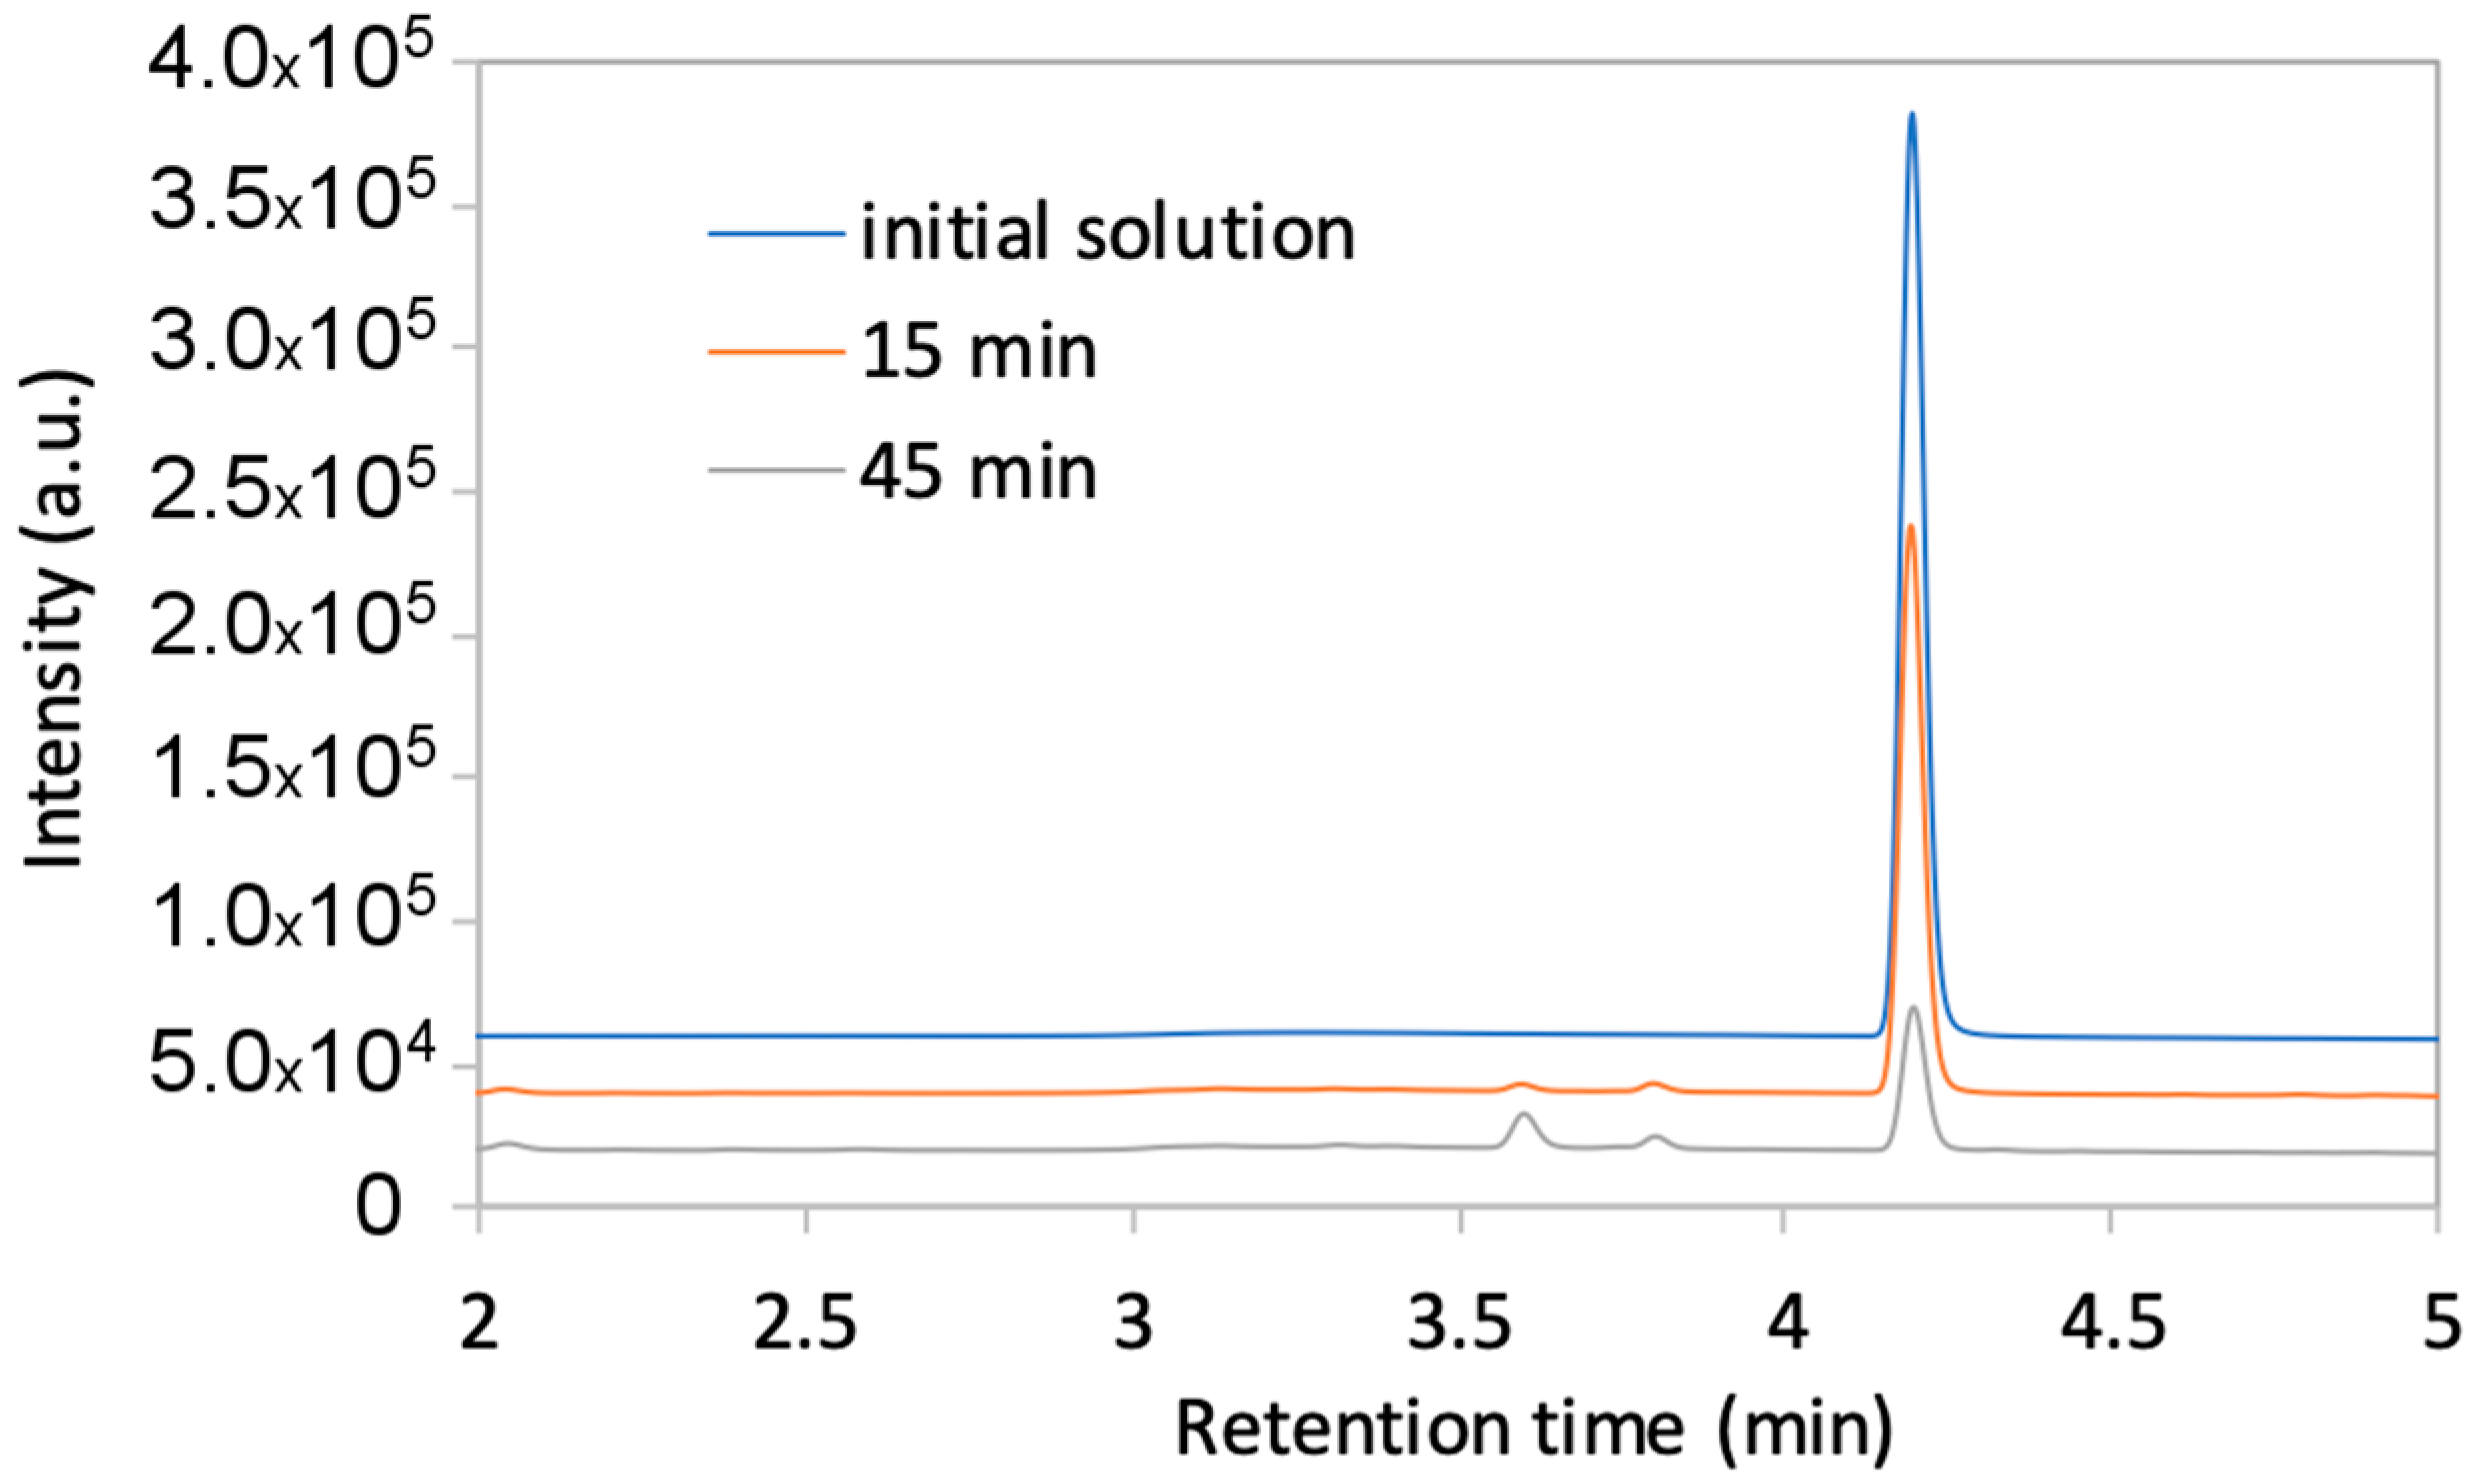
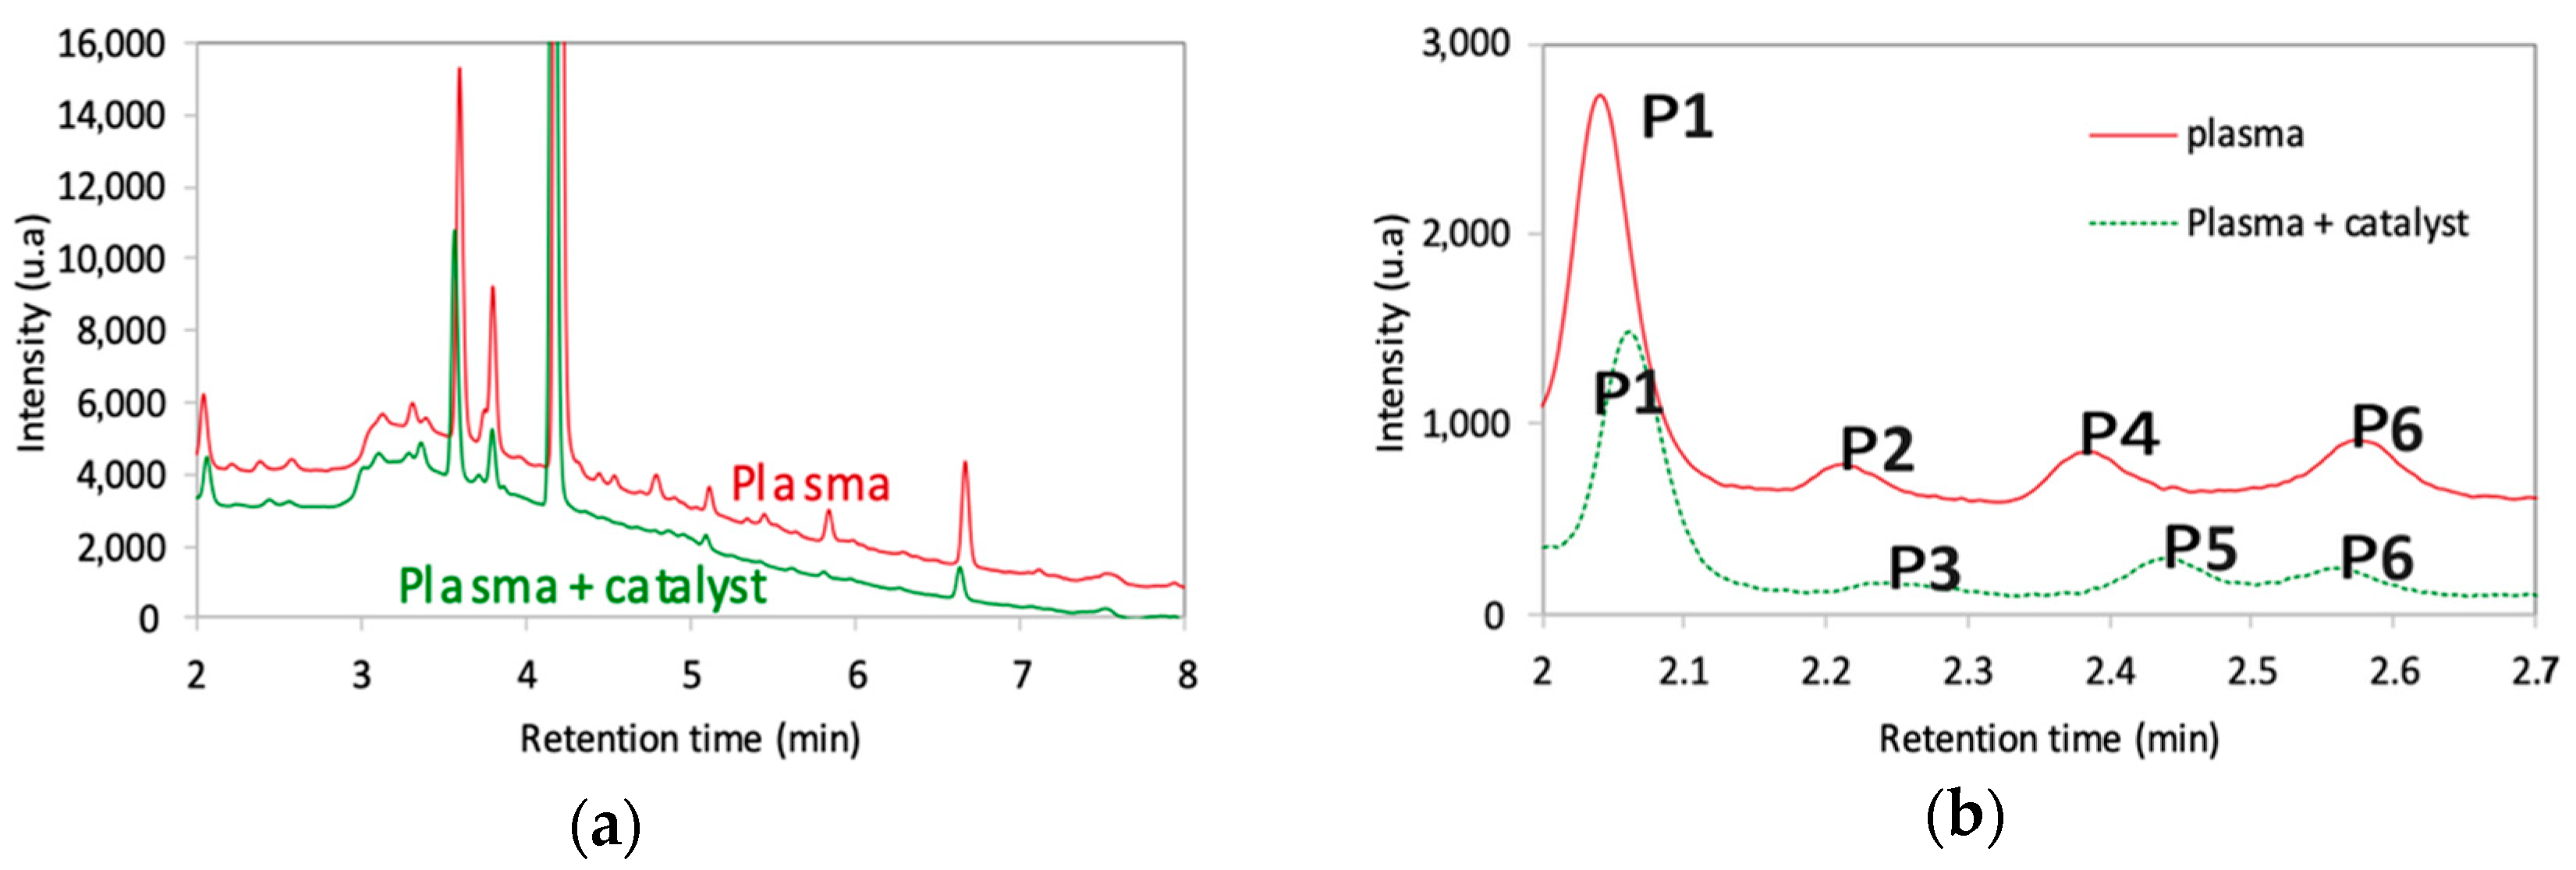
13], the concentration of paracetamol was measured mainly by using UV absorption at 243 nm. However, some by-products also absorb at this wavelength; hence, the concentration of paracetamol residue was overestimated, as proved by High-Resolution Mass Spectrometry (HRMS) measurements. In the current work, the concentrations were determined from High-Performance Liquid Chromatography (HPLC) chromatograms of the treated solutions and the relative error was estimated to be lower than 1%. For instance, in
Figure 1, two chromatograms of the solution after 15 and 45 min’ treatment by plasma alone are presented. The peak with a retention time of 4.2 min corresponds to the paracetamol molecule. The area of this peak can be used to determine the concentration of paracetamol through preliminary calibration. The other peaks corresponding to by-products generated from the paracetamol degradation will be discussed later (
Section 2.4).
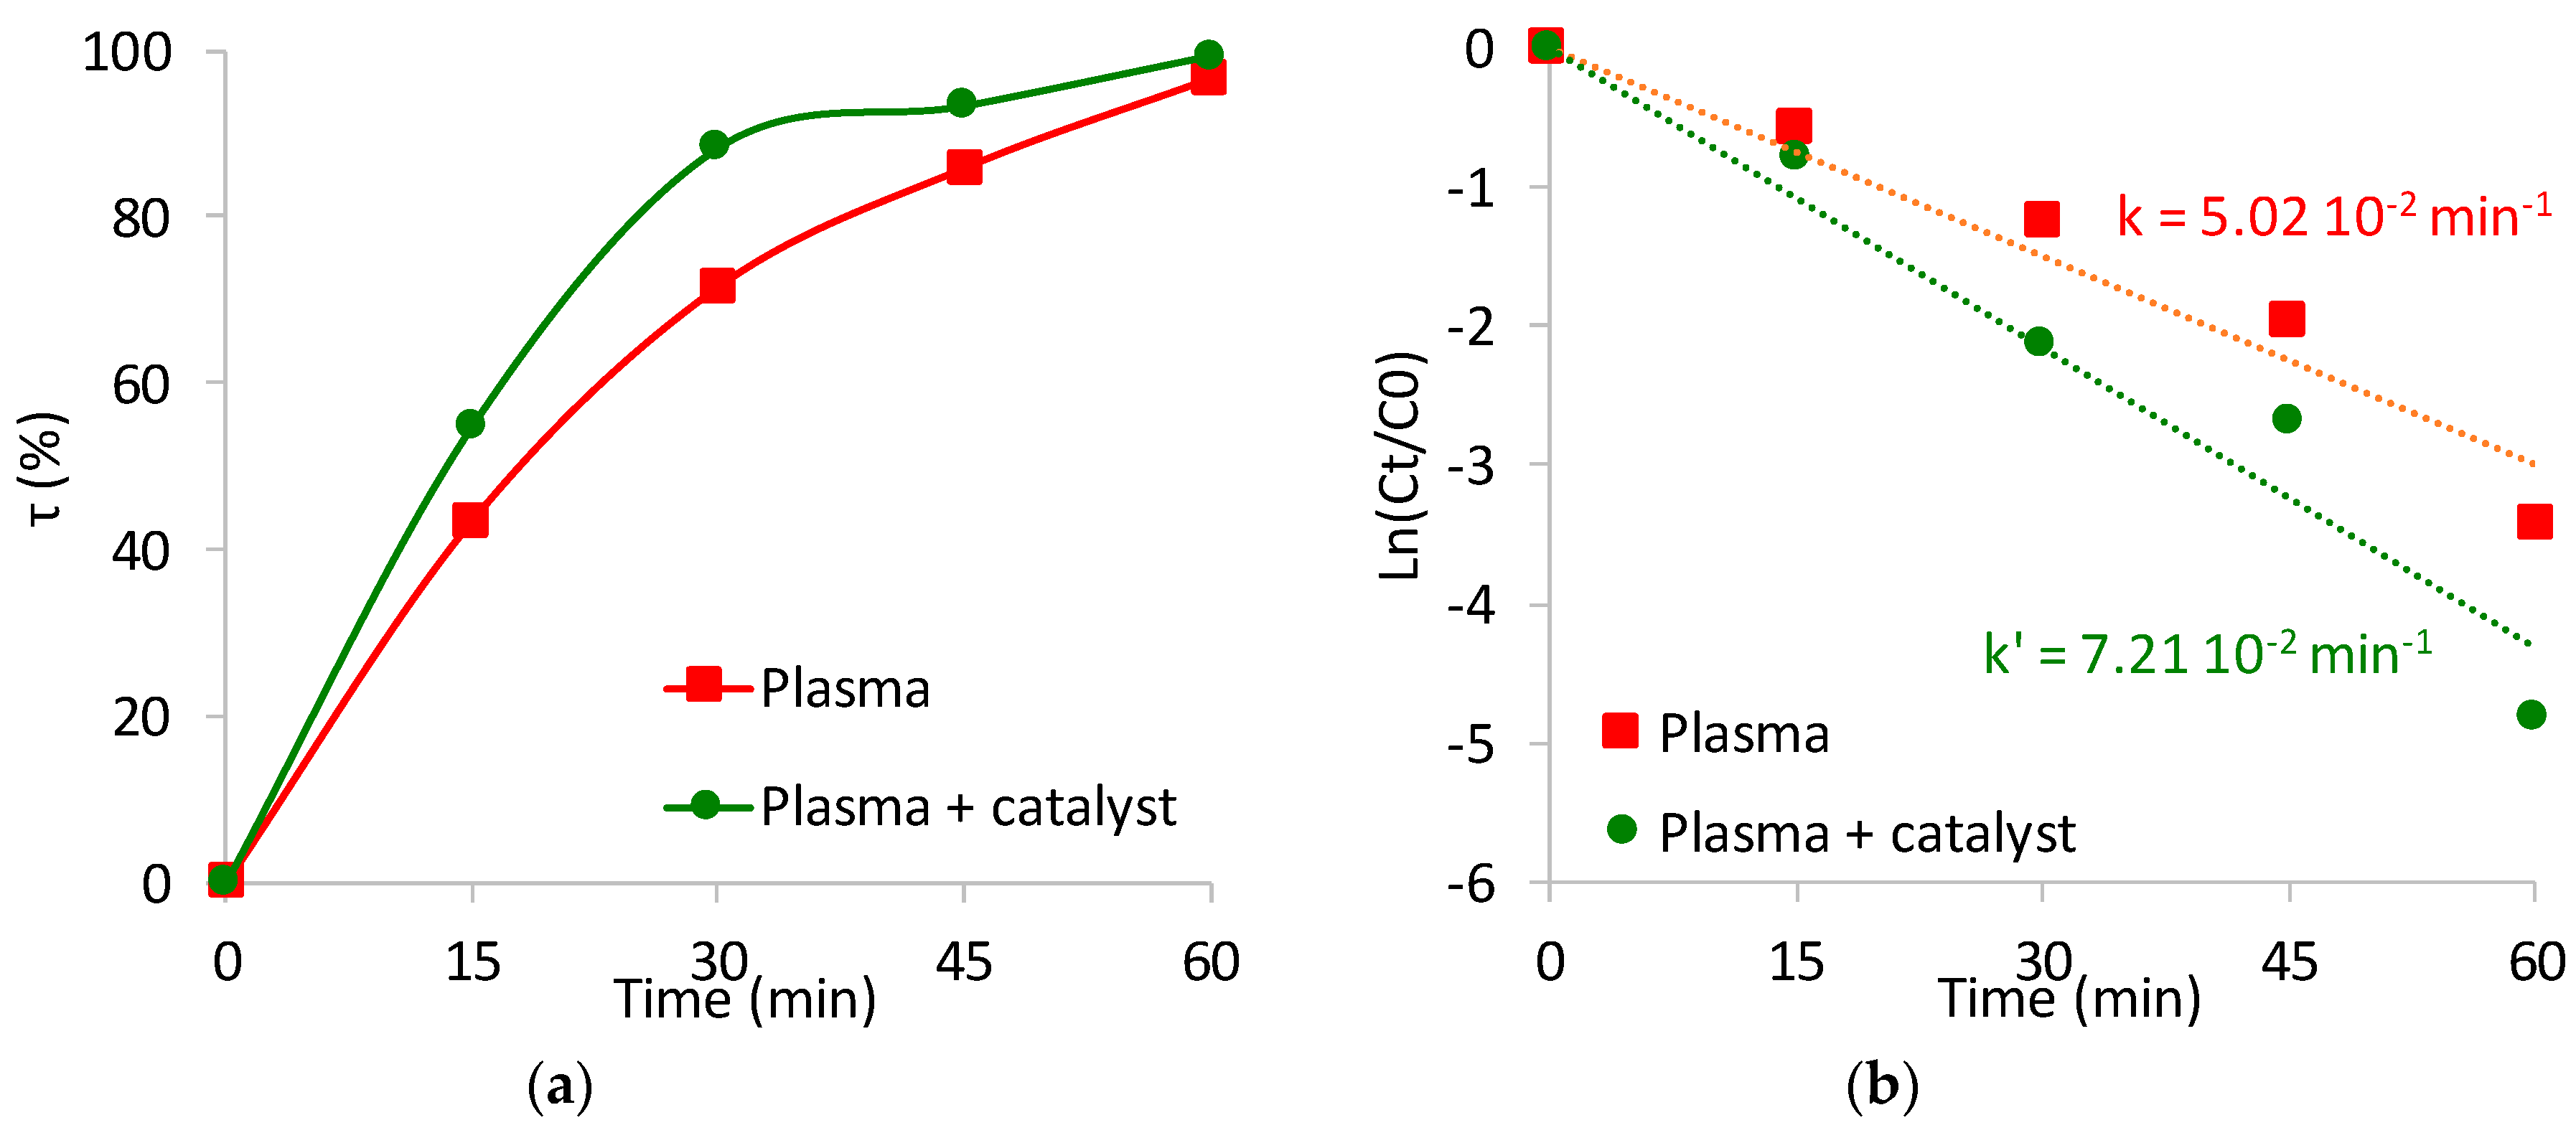
The concentrations of paracetamol after plasma treatment with and without catalysis were determined for four treatment durations, namely 15, 30, 45, and 60 min. The calculated conversion rates,
τ (%)
, using these concentrations are presented in
Figure 2a. To obtain a complete conversion, a duration of 60 min was necessary. This apparently long treatment time should be regarded in correlation with the low input power (about 0.3 W). Pan and Qiao [
14] and Iervolino et al. [
15] required a shorter treatment duration, but with a much higher consumed power and lower energy yield.
Figure 2a also shows that there is an increase in the conversion rate of paracetamol with the presence of the catalyst compared to the process with plasma alone. This corresponds to a rise of about 40% of the rate constant of the paracetamol degradation with the plasma-catalysis coupling process compared with the treatment by plasma alone, as shown in
Figure 2b.
Before evaluating the exact role of the plasma/heterogeneous Fenton coupling on paracetamol degradation, the effects of the catalytic activity of the Fe (NO3)3 precursor alone in the removal of paracetamol were observed. Neither paracetamol degradation nor mineralization was observed even for a long contact time of 60 min with the catalyst alone. It can therefore be concluded that the contribution of the catalyst without NTP to paracetamol degradation is negligible.
The enhancement in conversion rates can be ascribed to the presence of Fe
3+ which drives the Fenton reaction to the formation of hydroxyl radicals, considered as the highest reactive radical, via the H
2O
2 produced by the discharge according to the mechanism below [
28,
29]. Although other radicals (HO
2•) are produced, their oxidation potential is smaller than that of HO
• species.
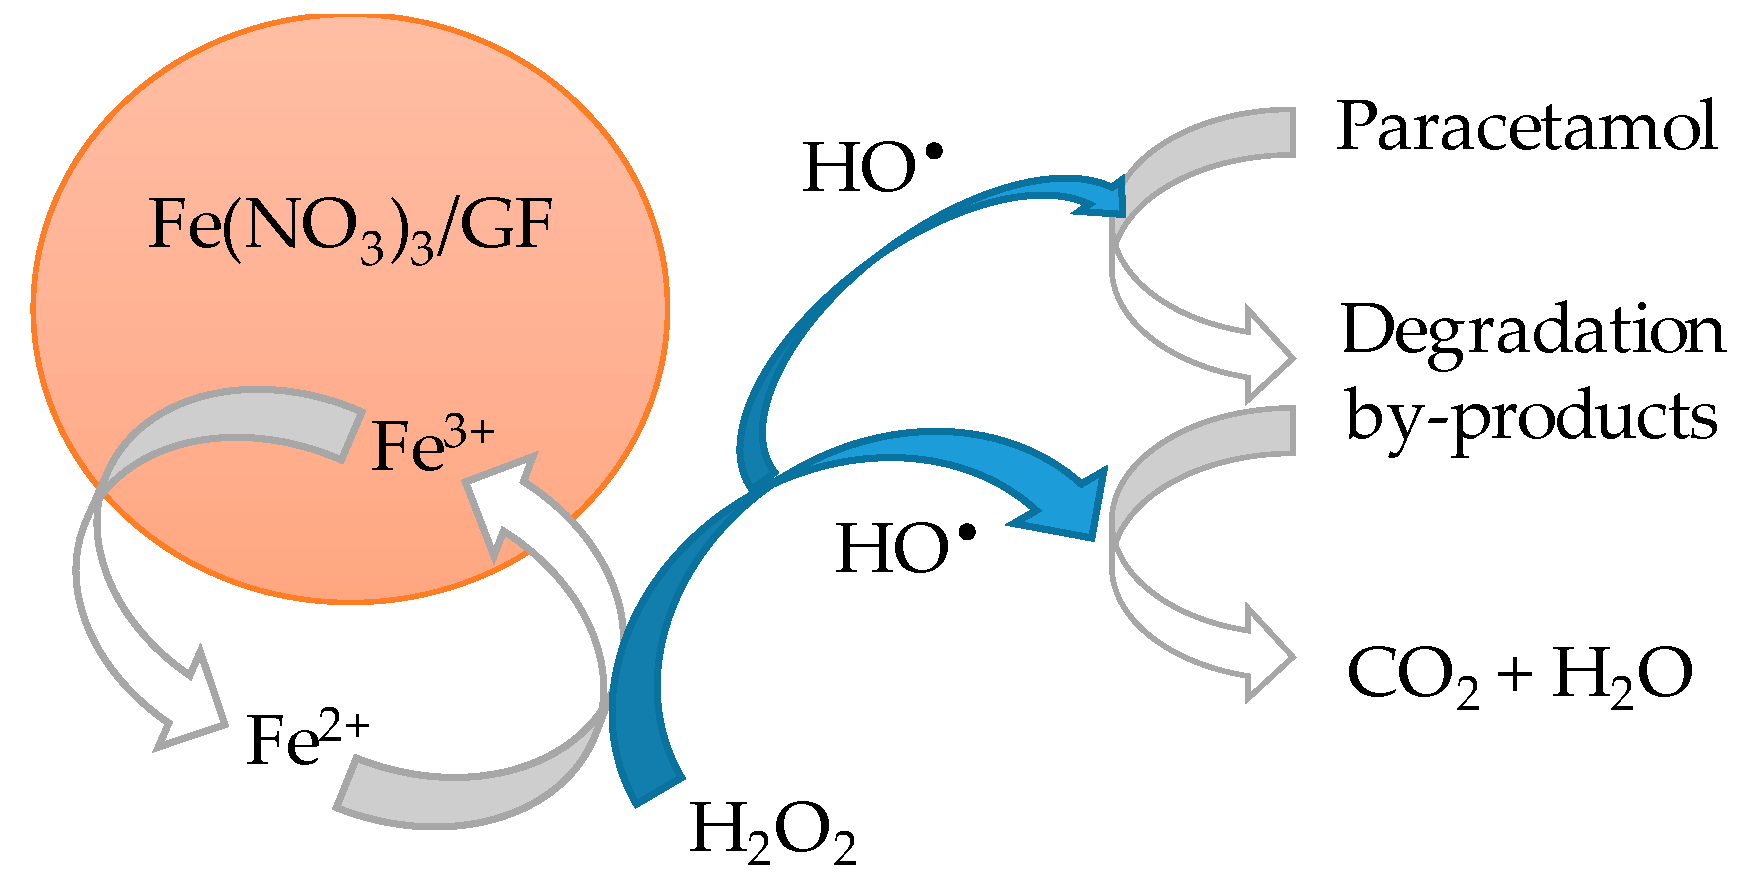
Figure 3 illustrates the main reactions of the heterogeneous Fenton-like system in the enhancement of mineralization. It starts with the in situ generation of hydroxyl radicals from iron oxidation by H
2O
2. The HO
• will then react directly not only with the paracetamol in water during plasma/catalysis coupling but also with the generated by-products. Thus, a decrease in the content of organic carbon is expected in the presence of catalyst, since the intermediates can be mineralized into CO
2 and H
2O as final products.
2.2. Mineralization Rate
The mineralization efficiency (
τTOC) expresses the conversion of the organic carbon into CO
2 and inorganic carbons with the generation of H
2O. Despite the high removal rates of paracetamol by NTP alone, no mineralization has yet been obtained. To understand this “high conversion but low mineralization” phenomenon, Baloul et al. [
13] analyzed the treated solution using HRMS and showed that many organic compounds such as carboxylic acids and aromatic compounds were produced from paracetamol degradation. These compounds may be a limiting factor for mineralization of the solution according to Brillas et al. [
30].
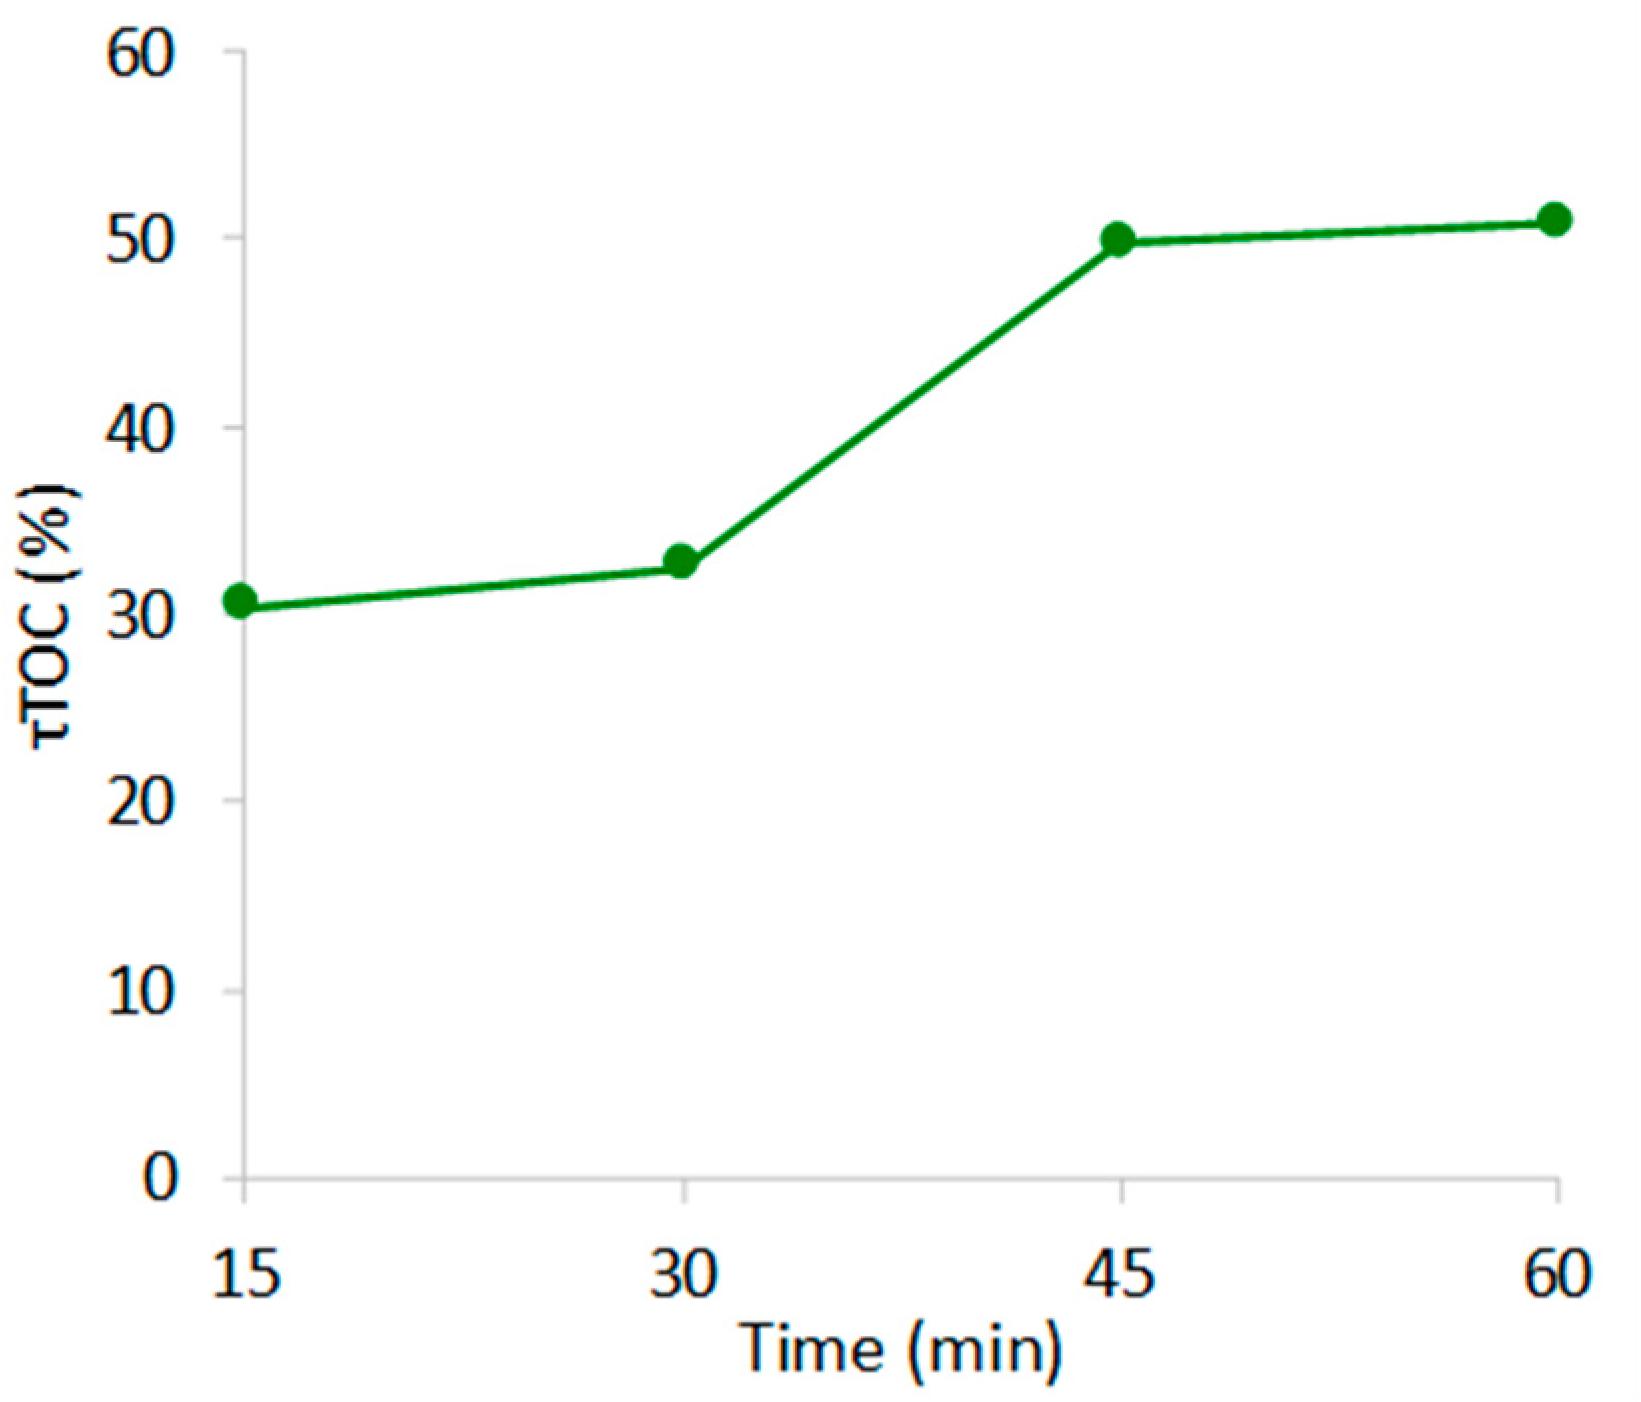
Figure 4 shows the mineralization rates of solution treated by plasma/catalysis coupling as a function of the treatment time. The τ
TOC was lower than the conversion rate of the paracetamol, confirming that the pollutant was transformed upon oxidation into other organic by-products. With the plasma-catalysis coupling, the mineralization rate increased significantly to 30% after 15 min of treatment and reached a maximum of 54% within 60 min. The mineralization rates obtained are comparable to those of Slamani et al. [
31], who obtained 60.6% of mineralization after 60 min of paracetamol treatment in water by coupling the Fenton process and a gliding arc discharge, but using much higher input energy than the one consumed by our process.
2.3. Stability and Reuse of the Catalysts
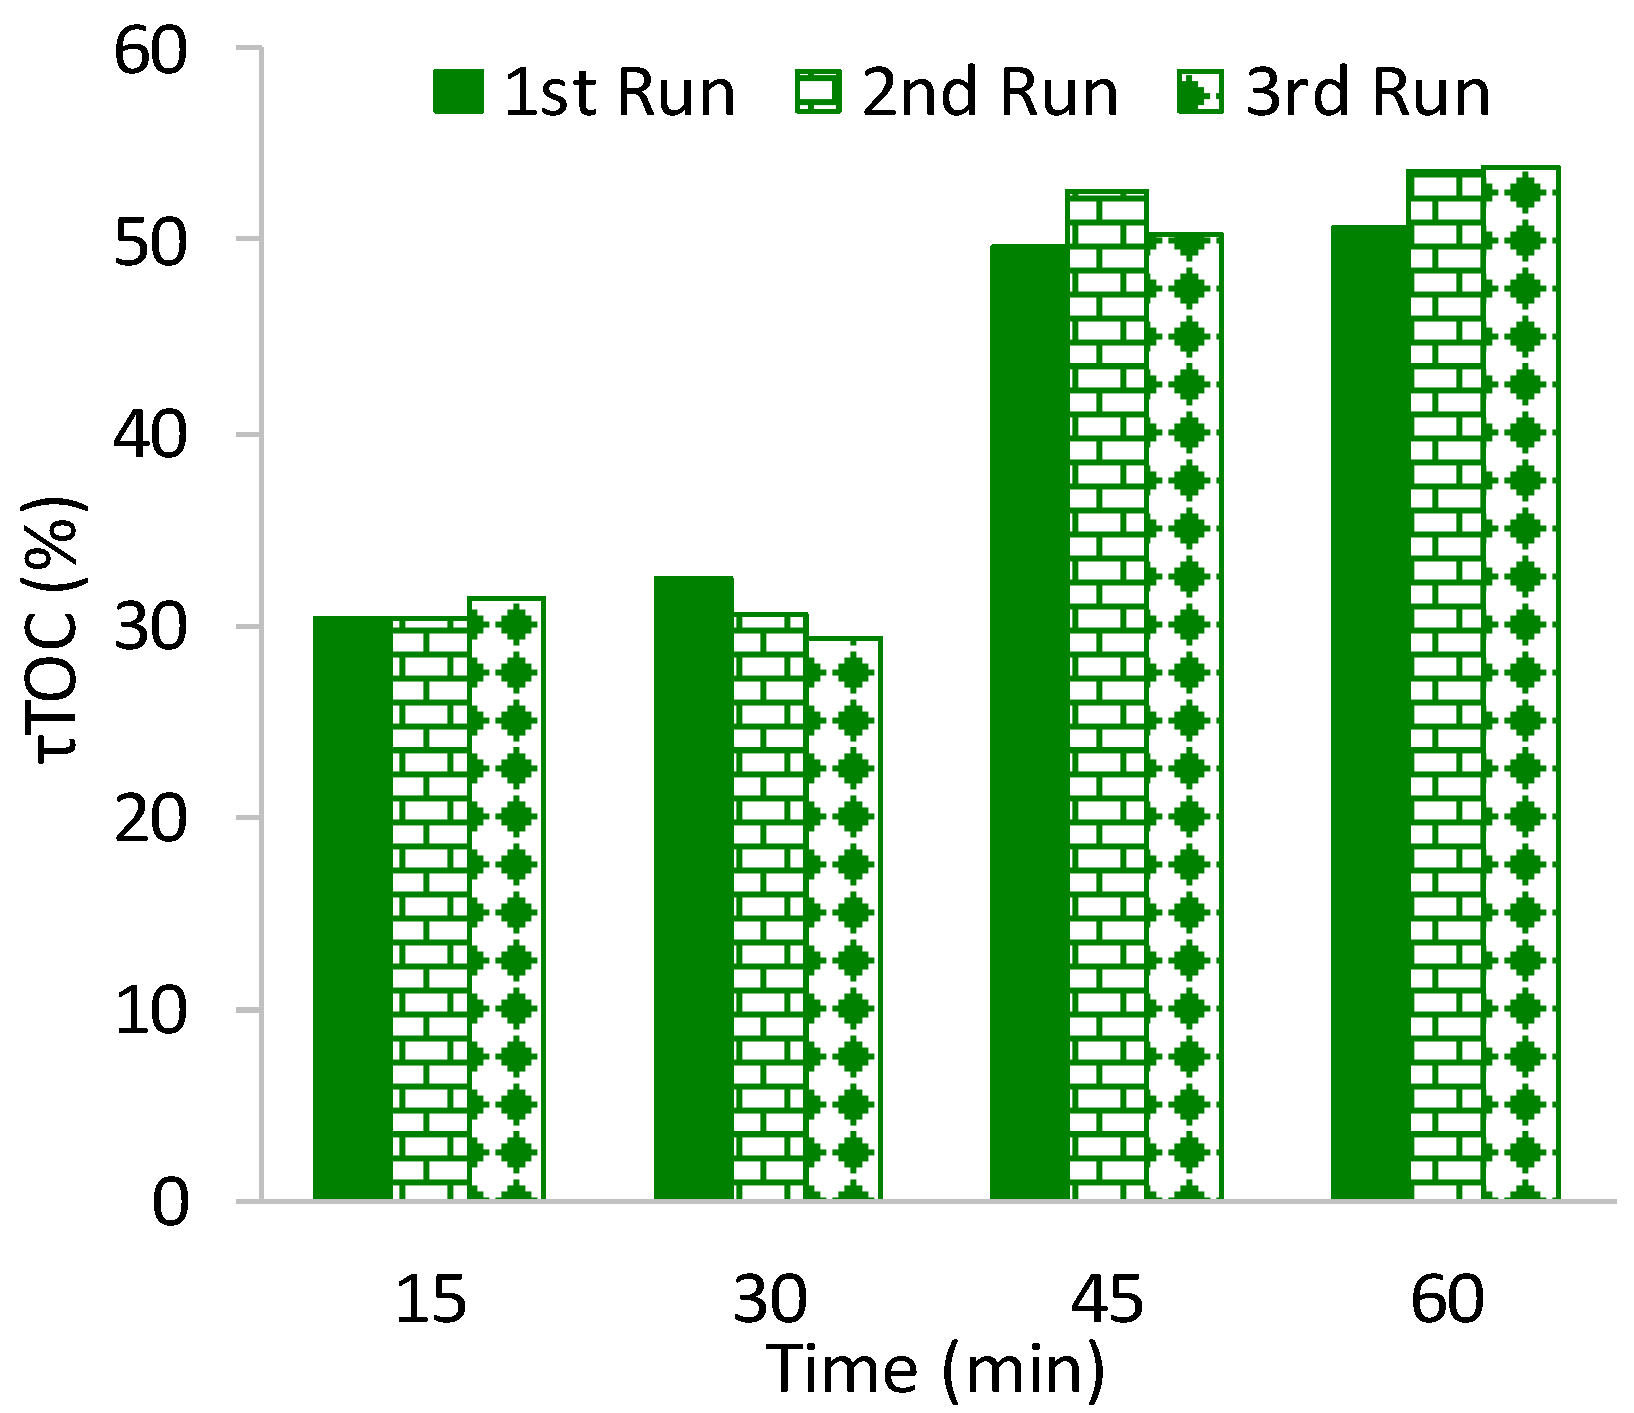
Tests were performed in order to evaluate the stability and the reusability of the catalyst during successive NTP/Fenton-like treatments. Three successive runs of the experiment were carried out using the same working conditions as those mentioned above. As shown in
Figure 5, the mineralization efficiency was maintained at a stable level after three successive tests, which proved that the catalyst had good stability and reusability in these operating conditions. Note that the maximum mineralization rate reached 54%.
2.4. HPLC Analyses
Figure 6a displays chromatograms obtained for paracetamol treatments with and without plasma-catalyst coupling for 30 min treatment time. This figure focuses on the species produced due to the paracetamol degradation and corresponding to the various peaks observed. It shows that the plasma/catalysis coupling led to a decrease in the number and area of peaks, which corresponds to an increase in the mineralization rate in this case. In
Figure 6b, a zoom of the HPLC chromatograms is displayed, where slight variations in the retention times can be observed. In order to check whether two small shifted peaks corresponded or not to the same molecule, UV-absorption spectra were analyzed, confirming that there were six molecules from 2 to 2.7 min and that different products are formed in the solution treated by the coupled process (for instance, P3 and P5 in
Figure 6b). This check was carried out for all the detected peaks.
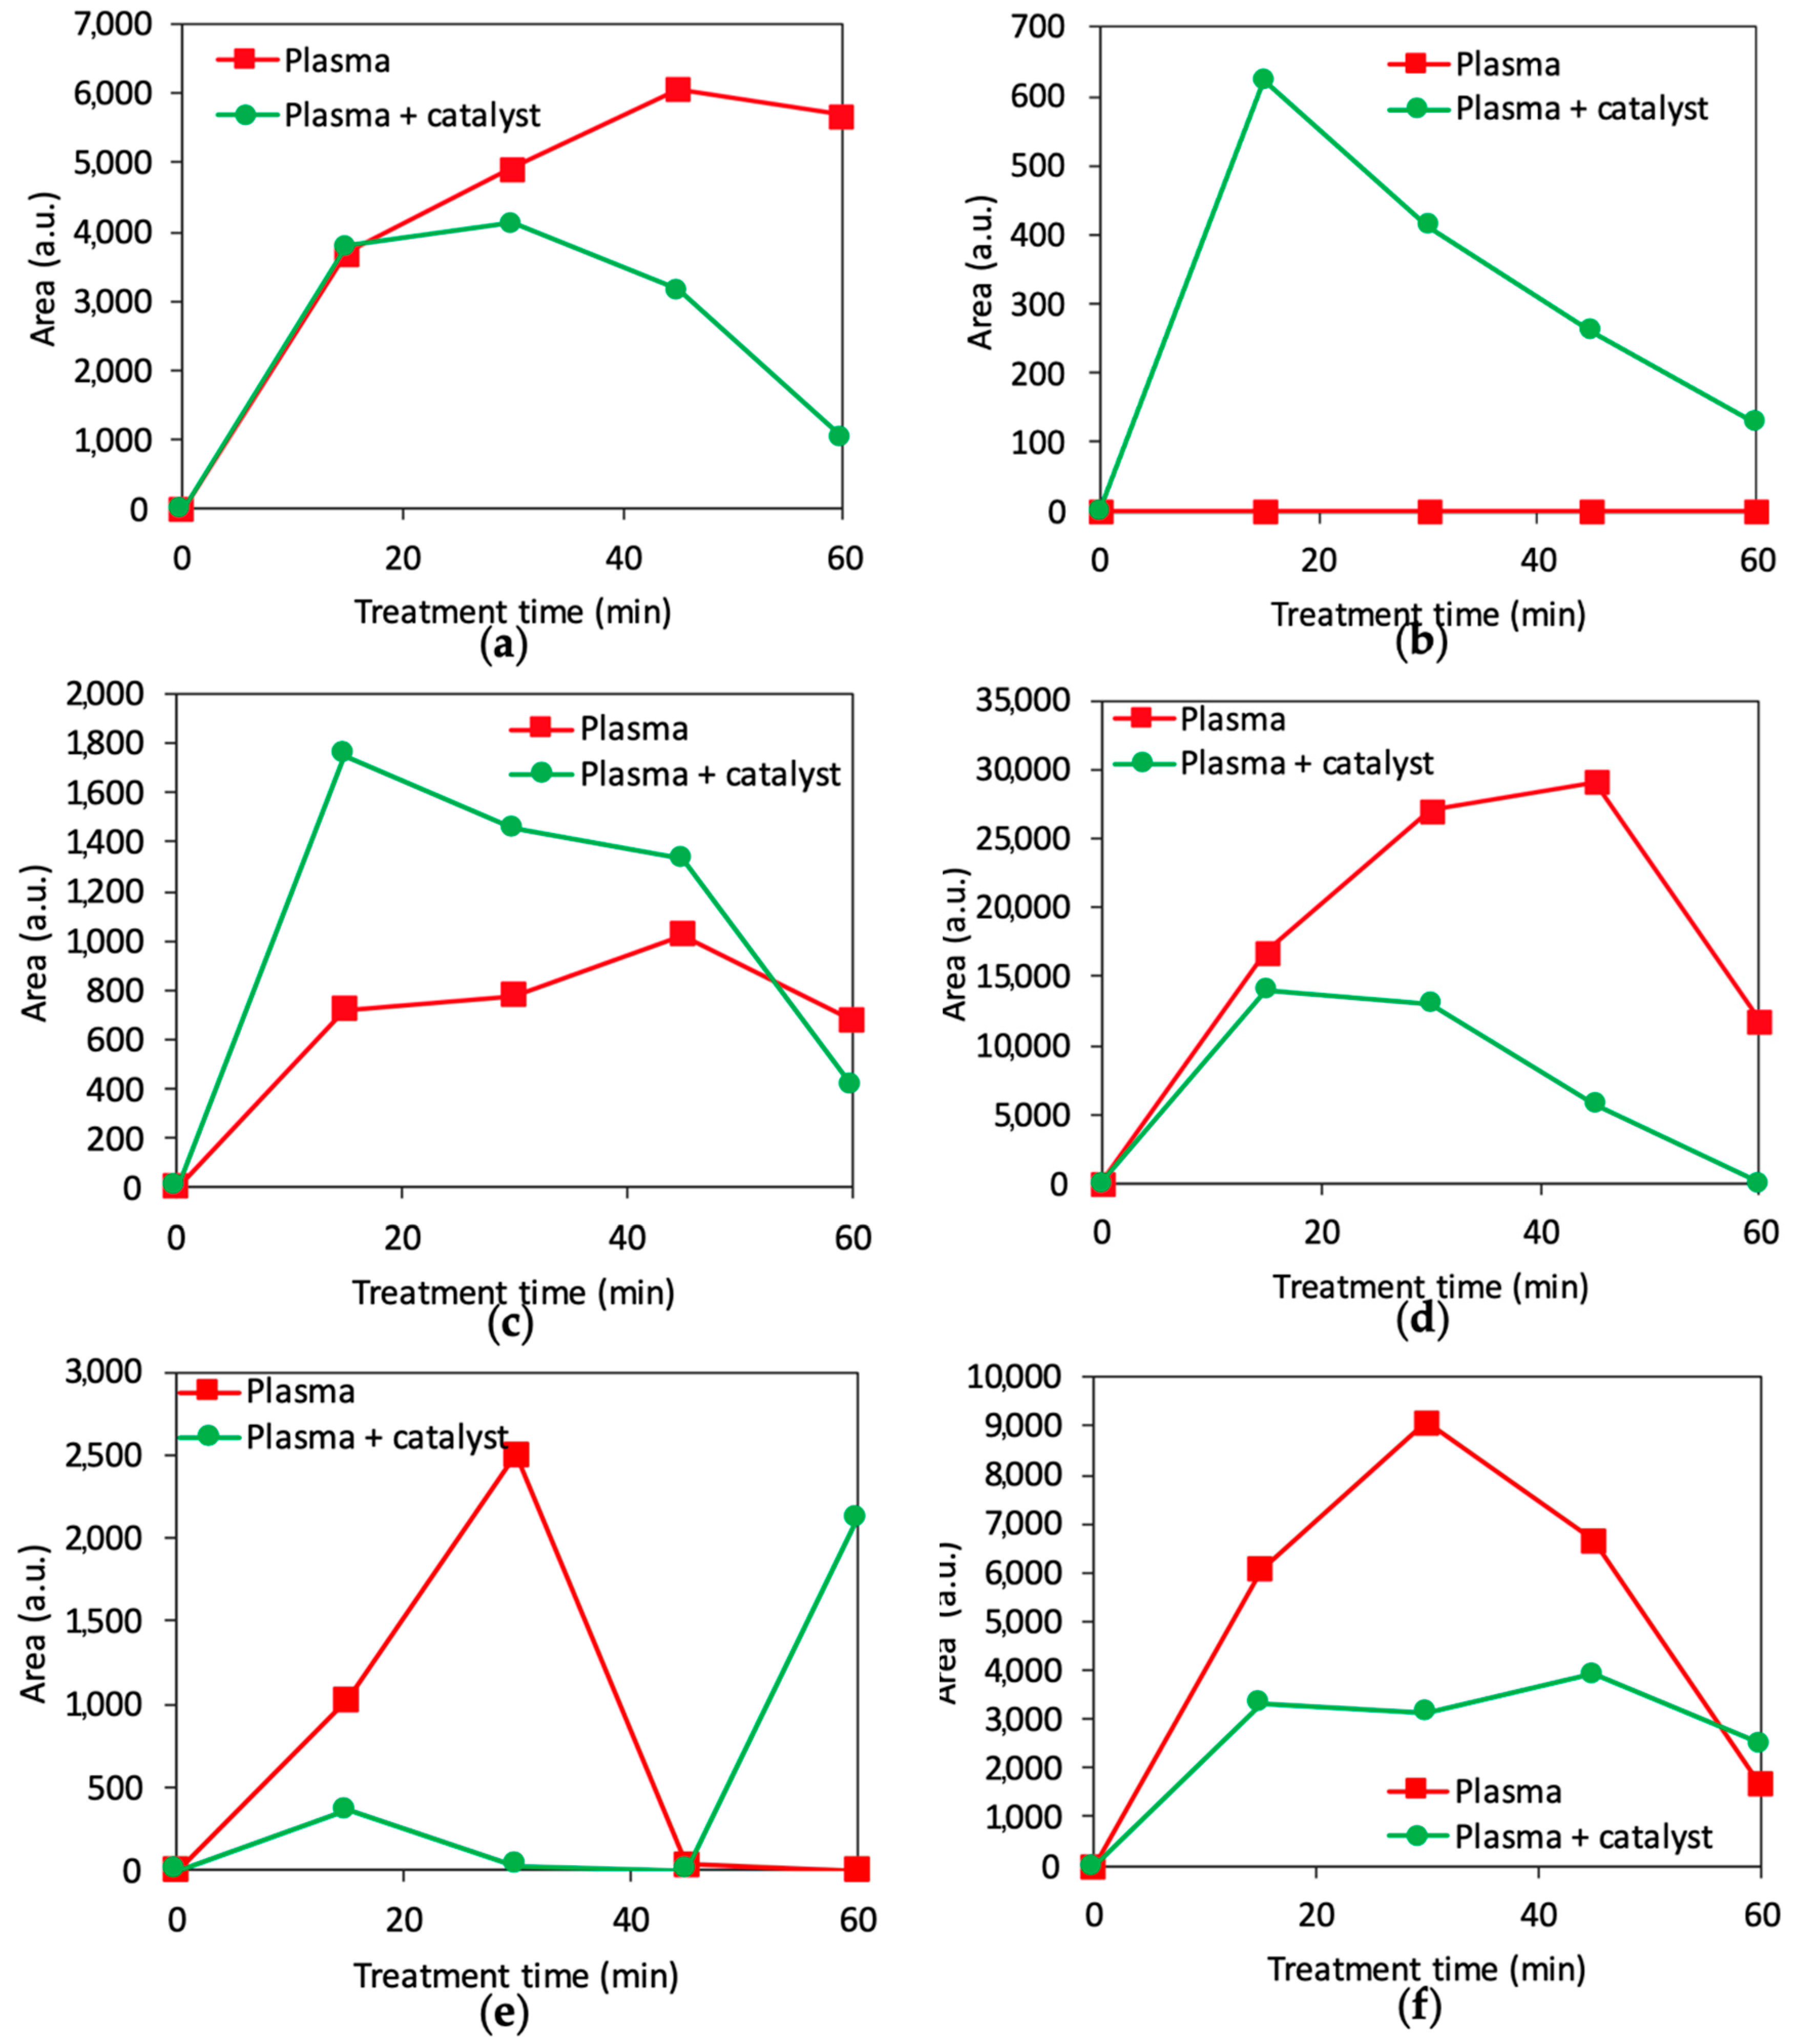
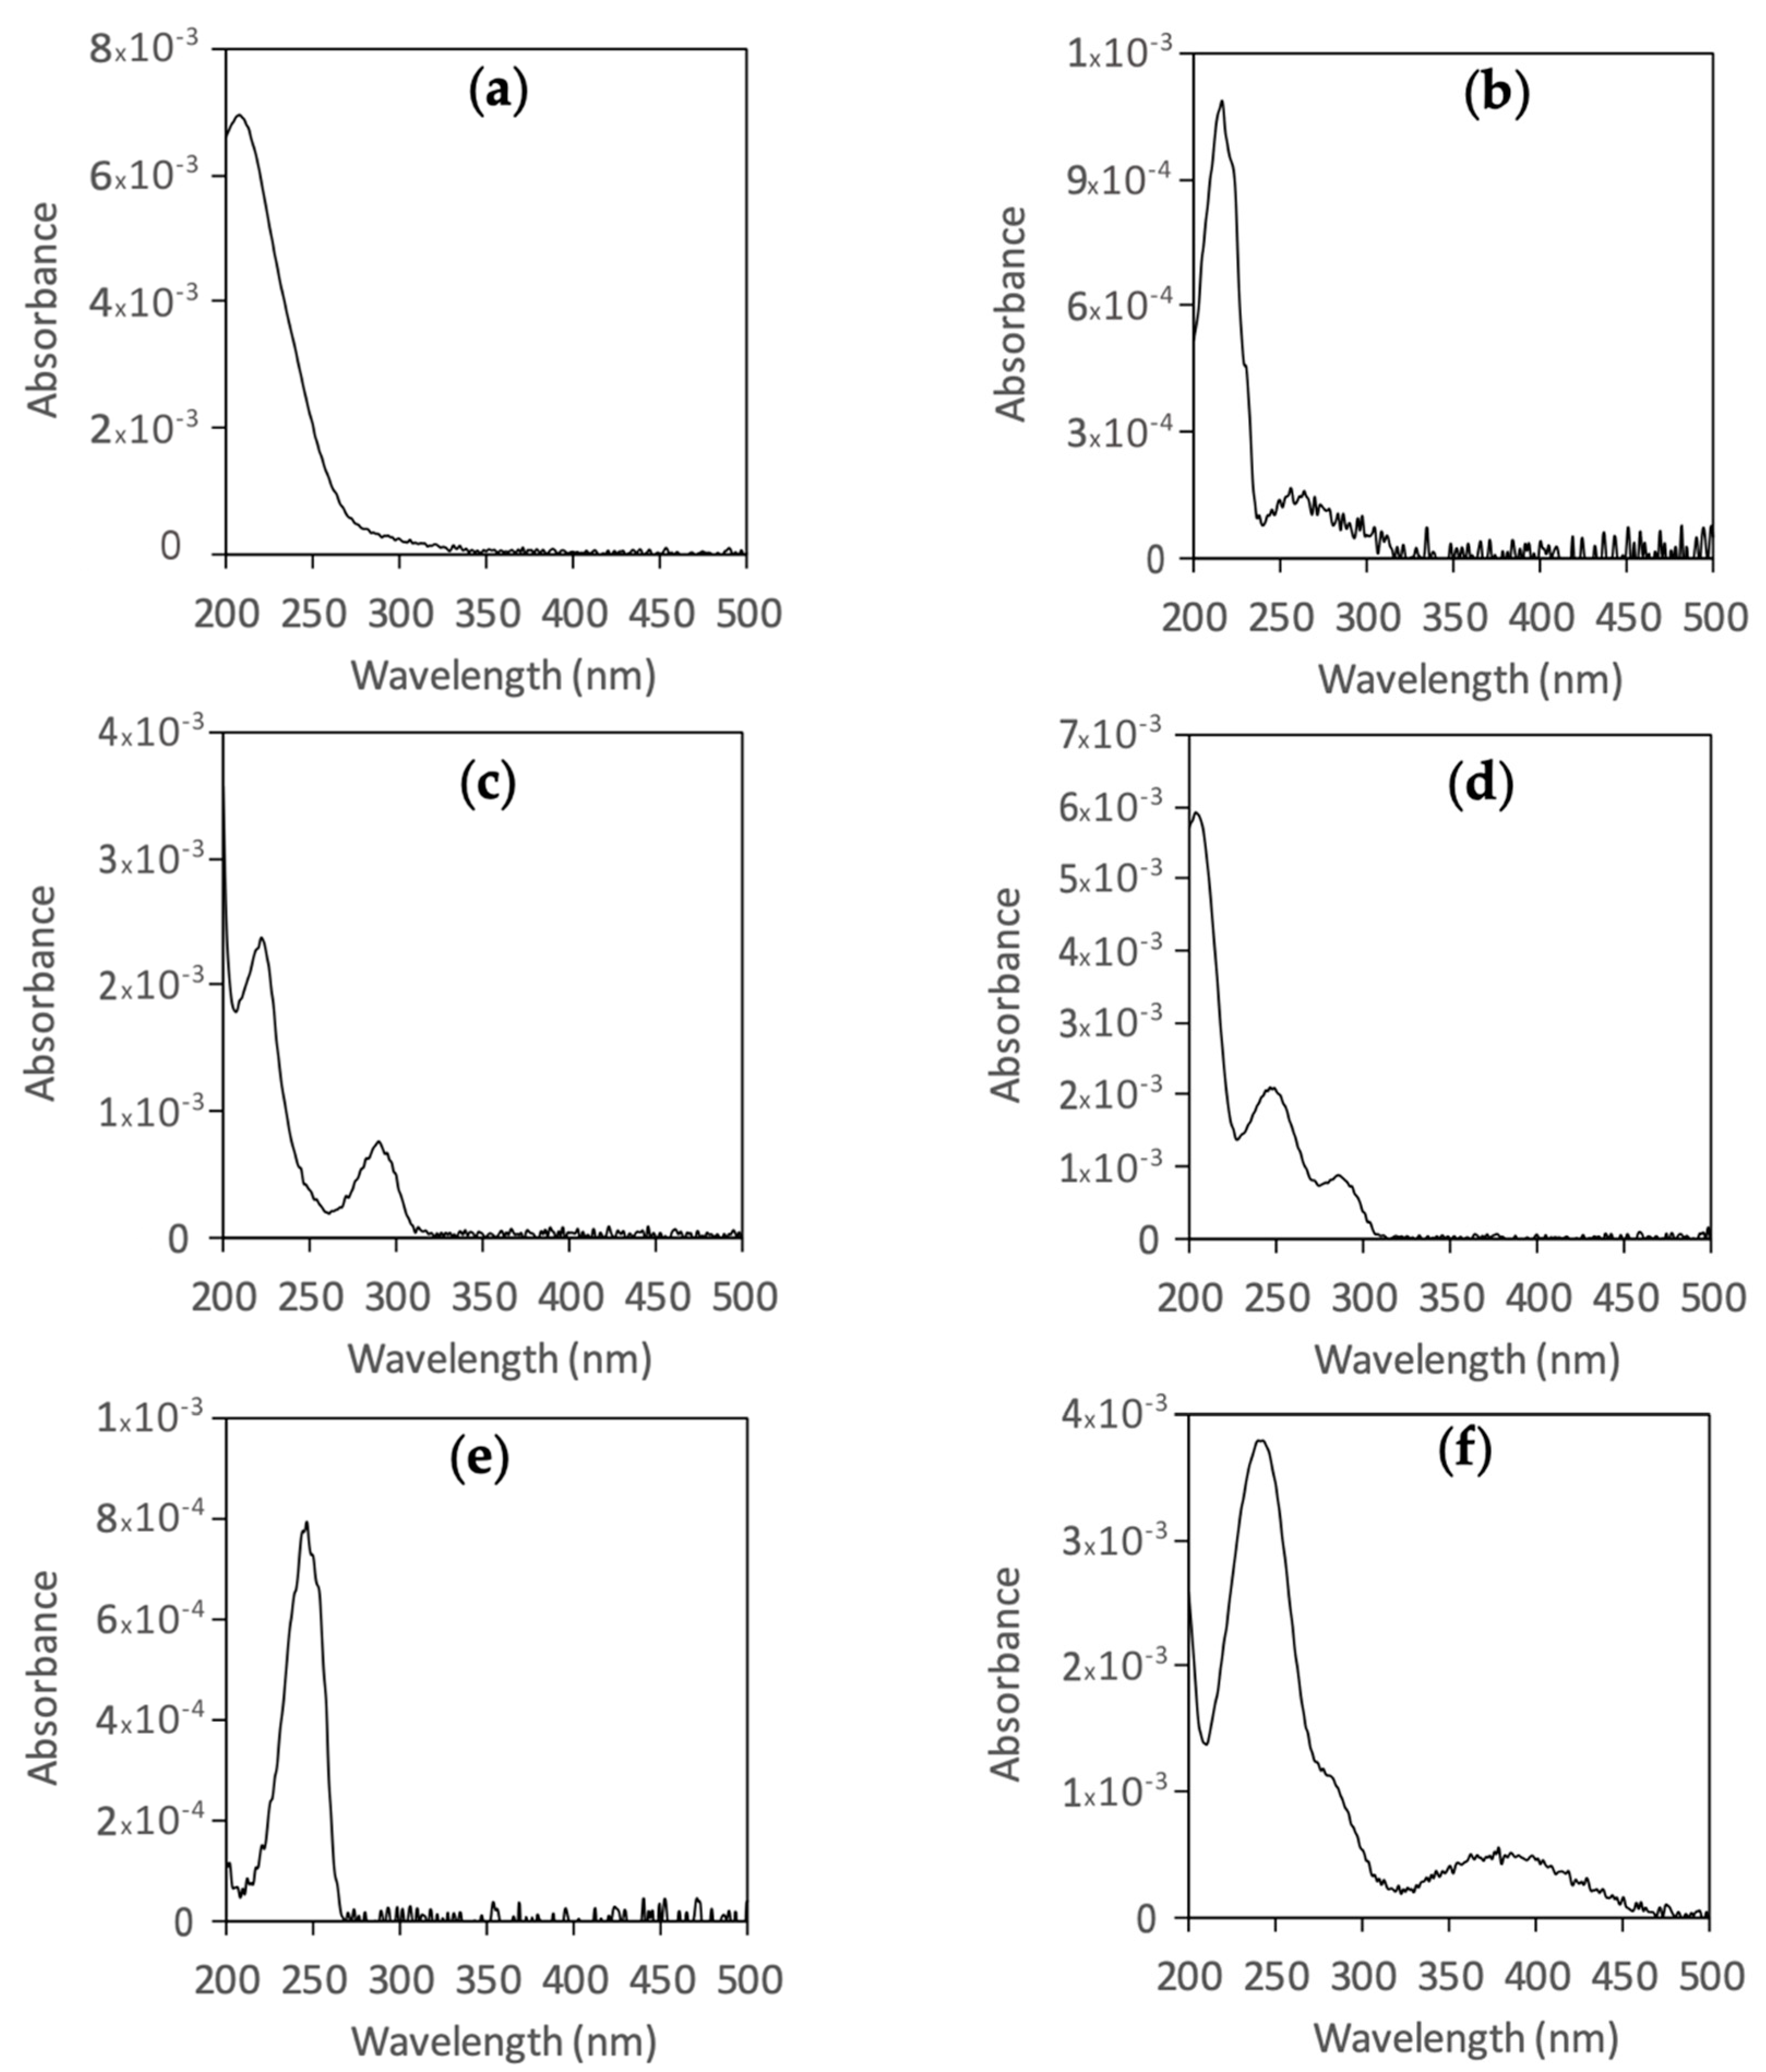
Figure 7 and
Figure 8 show the evolution of the main peaks observed on the chromatograms in terms of peak area and UV absorbance spectra. Variation in the peak area at a given retention time gives information on the evolution of the concentration of a given species. Generally, the degradation products start to be formed soon after the treatment starts, reach a maximum concentration, and then decrease. With plasma/catalyst coupling, it was observed that many of the detected peaks had lower areas than with plasma alone and/or are characterized by a faster decline (
Figure 7a,d,f). An exception is the peak at a retention time 2.5 min that only appears for the plasma-catalytic treatment. The peak at 3.4 min is considerably larger in the presence of the catalyst; however, it shows a more pronounced decrease towards long treatment time. The peak at the retention time at 4.8 min was also promoted with the coupled treatment, but only for the longest processing time.
Based on the literature and on the information obtained from HPLC (retention times, experimental UV absorbance spectra), the identification of the detected species was attempted. Using commercial standard solutions, only two species were identified by HPLC analyses: 1,4-hydroquinone and 1,4-benzoquinone, which correspond to the peaks detected at 3.4 and 4.8 min. The hydroxylation of aromatic rings is due to the collision reactions of the radicals and other plasma species [
32]. The initial attack of HO
• on the C‒N bond leads to hydroquinone and further oxidation of hydroquinone leads to 1,4-benzoquinone [
33,
34].
Thanks to standard analyses, the concentration of 1,4-hydroquinone and 1,4-benzoquinone produced from paracetamol treatment can be estimated. For hydroquinone, in plasma-catalyst treatment conditions, the maximum concentration was about 0.34 mg L−1 (after 15 min of treatment), while for plasma alone the maximum concentration was lower, with 0.2 mg L−1. For benzoquinone, the maximum concentrations obtained were about 0.02 mg L−1 with or without catalysis coupling. The other peaks were not matched with other tested standard species, i.e., nitrophenol and acetamide.
From the results above and the mineralization rates, it can be deduced that most of the species produced are not detected by HPLC since the used column was not appropriate. Baloul et al. [
13], for paracetamol treatment by plasma alone, showed by using HRMS that carboxylic acids were produced. These species were no doubt also produced with the plasma-catalyst coupling process to treat paracetamol, but in smaller quantities due to the partial mineralization thanks to the HO
• produced by the Fenton–like effect. The pathway is assumed to be initiated by the attack of HO
• radicals and the substitution of the amide group, followed by the opening of the aromatic ring with the formation of carboxylic acids and finally mineralization. The transformation of primary aromatic products into carboxylic acids [
35], such as acetic and formic acids, leads to the production of oxalic acid and then its mineralization by HO
• into CO
2 and H
2O.
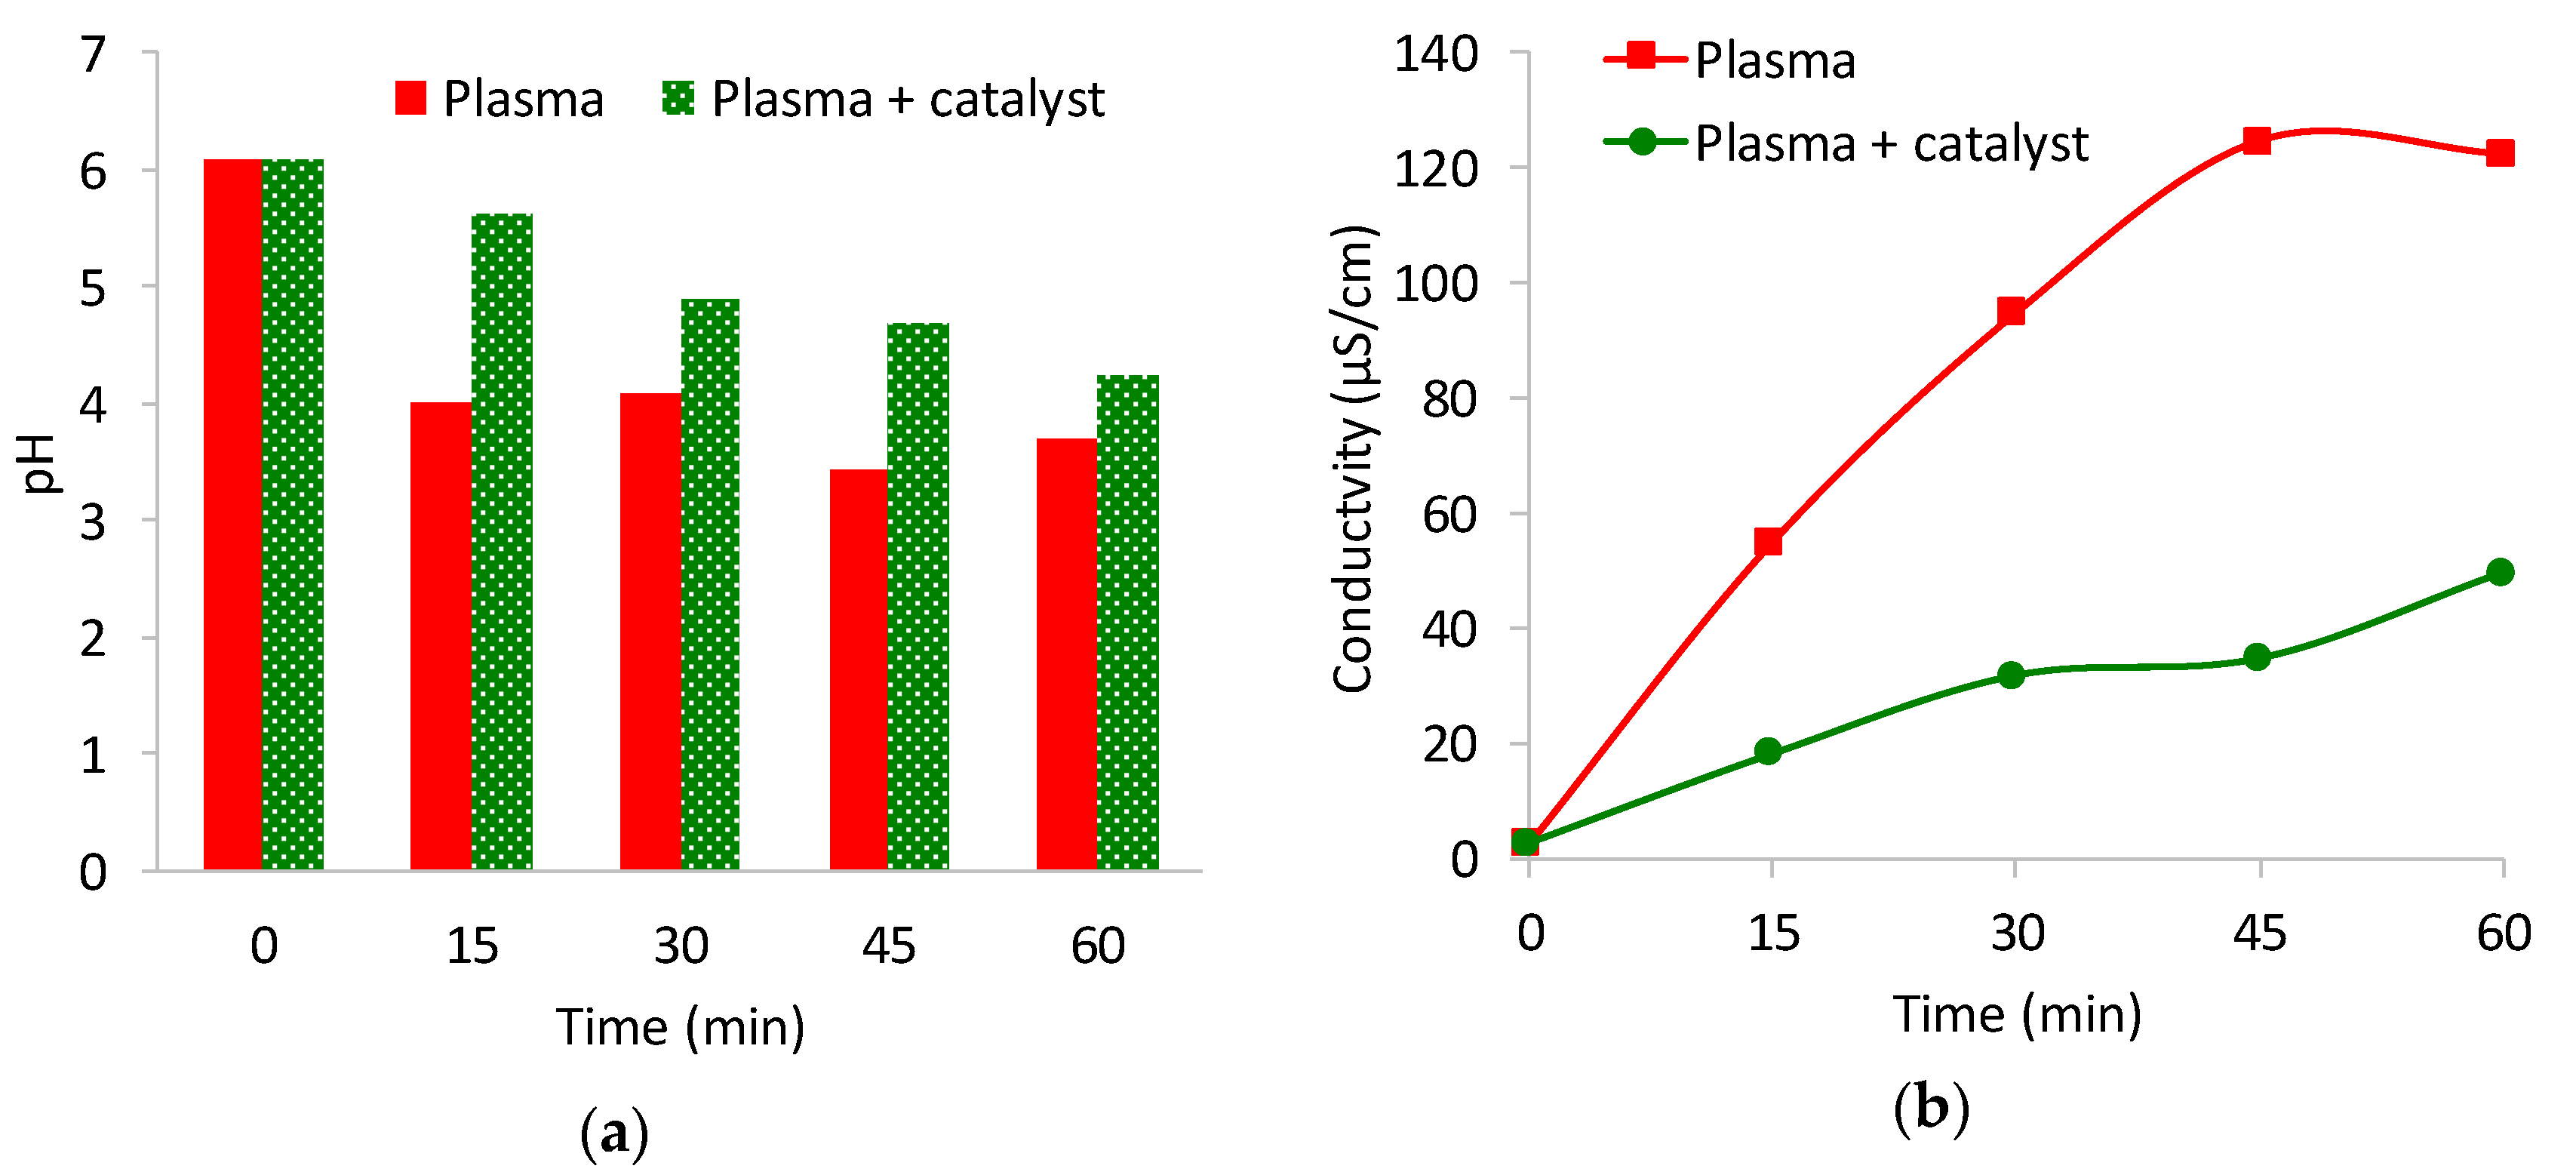
2.5. pH and Conductivity of the Treated Solution
Figure 9 shows the pH and conductivity changes of the samples treated by NTP/Fenton-like coupling compared with the ones with plasma alone. The presence of the catalyst leads to less acidification of the samples (i.e., higher pH values, see
Figure 9a) and less pronounced increase in the conductivity (
Figure 9b) compared to the treatment by plasma alone. For the treatment with plasma alone, the pH of the solution decreases from 6.1 to 3.7 and the conductivity increases from 2.6 µS·cm
−1 to 122 µS·cm
−1, where it appears to stabilize within 60 min. In comparison, with the plasma/catalyst coupling, the final pH and conductivity in the treated solution are 4.35 and 49.5 µS·cm
−1 for a treatment of 60 min. The observed changes in the pH can be explained by the production of carboxylic acids in the solution, while the rise of nitrites or nitrates, discussed below, could explain, among other factors, the observed trends of conductivity.
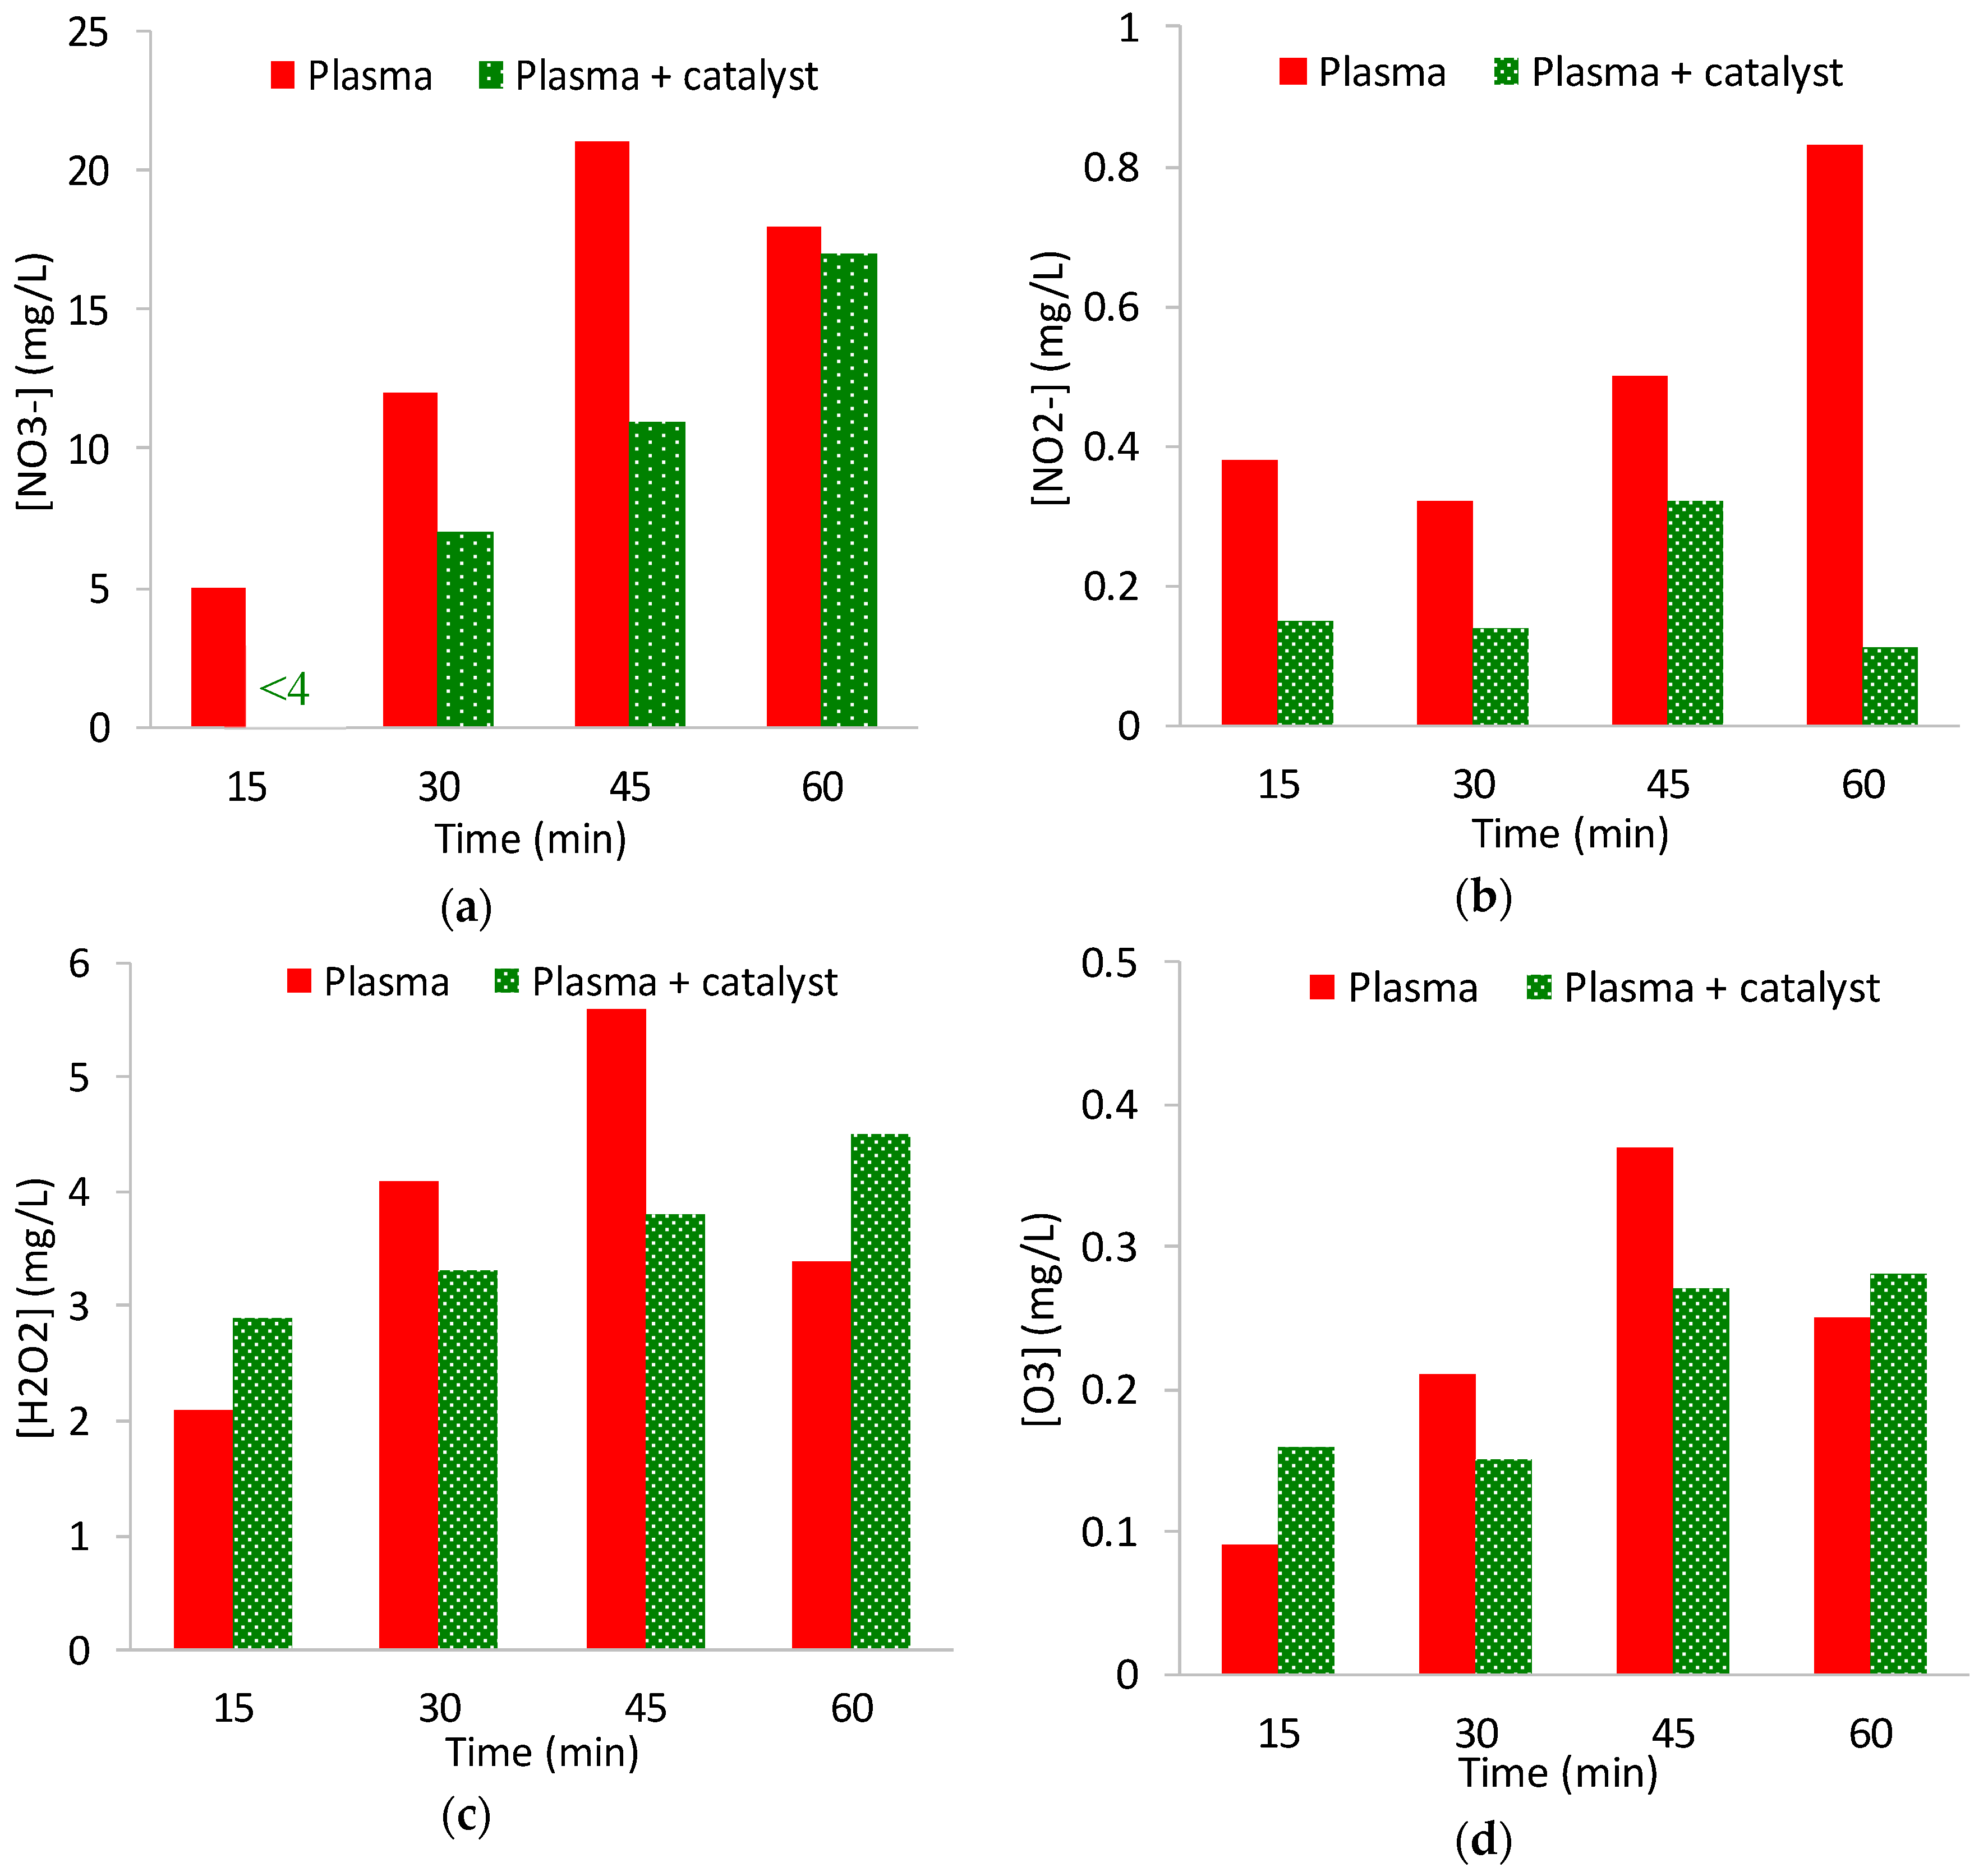
Nitrites and nitrates are produced during the plasma treatment as displayed in
Figure 10. It can be seen that with plasma/catalysis coupling, the concentrations of nitrates and nitrites are lower, or even below the detection threshold which was 4 mg L
−1 for nitrate (the case of 15 min treatment by NTP/Catalyst), than those with plasma alone.
The generation of nitrites or nitrates can be explained by the following pathways. The excited species in the discharge plasma undergo dissociation, forming NO and NO
2 in the gas phase that may be transformed into the inorganic acids HNO
3 and HNO
2 in liquid (Equations (7)–(12)) [
36,
37,
38]. Note that the concentrations of these acids depend on many parameters such as the concentration of the excited species formed in the gas phase and their transformation into mineral acids in the liquid phase.
The presence of NO
3− and NO
2− can be explained by the dissolution of NO
2 in water (Equation (13). Nitrous and nitric acids are highly unstable, and they convert into NO
2− easily (or dissociate into NO
2− or NO
3− (Equation (14)) depending on the pH of the solution [
36]:
H
2O
2 and O
3 were also detected in the treated liquid as shown in
Figure 10c,d, respectively. These species are produced by the reactions in the discharge starting from H
2O and O
2 as shown in the equations below [
39,
40]:
The oxidative species H
2O
2, HO
•, and O
3 are well-known to react with organic molecules. The presence of H
2O
2 in the treated solution confirms the availability of this species to participate in the Fenton-like mechanism in order to promote the generation of HO
• and improve the degradation and mineralization rates of paracetamol and other aromatic by-products. As the Fenton-like effects require H
2O
2 to produce HO
•, one may expect a lower concentration of H
2O
2 in the process with the catalyst, but our measurements (
Figure 10c) are not in accordance with the mentioned expectation.
According to Equations (19) and (20) [
36], H
2O
2 and O
3 in the solution can oxidize nitrite to produce NO
3−, which are considered as blocking reactions for pollutant degradation:
These different sources of hydrogen peroxide production are important for the initiation of the heterogeneous Fenton process in the coupling process with plasma.
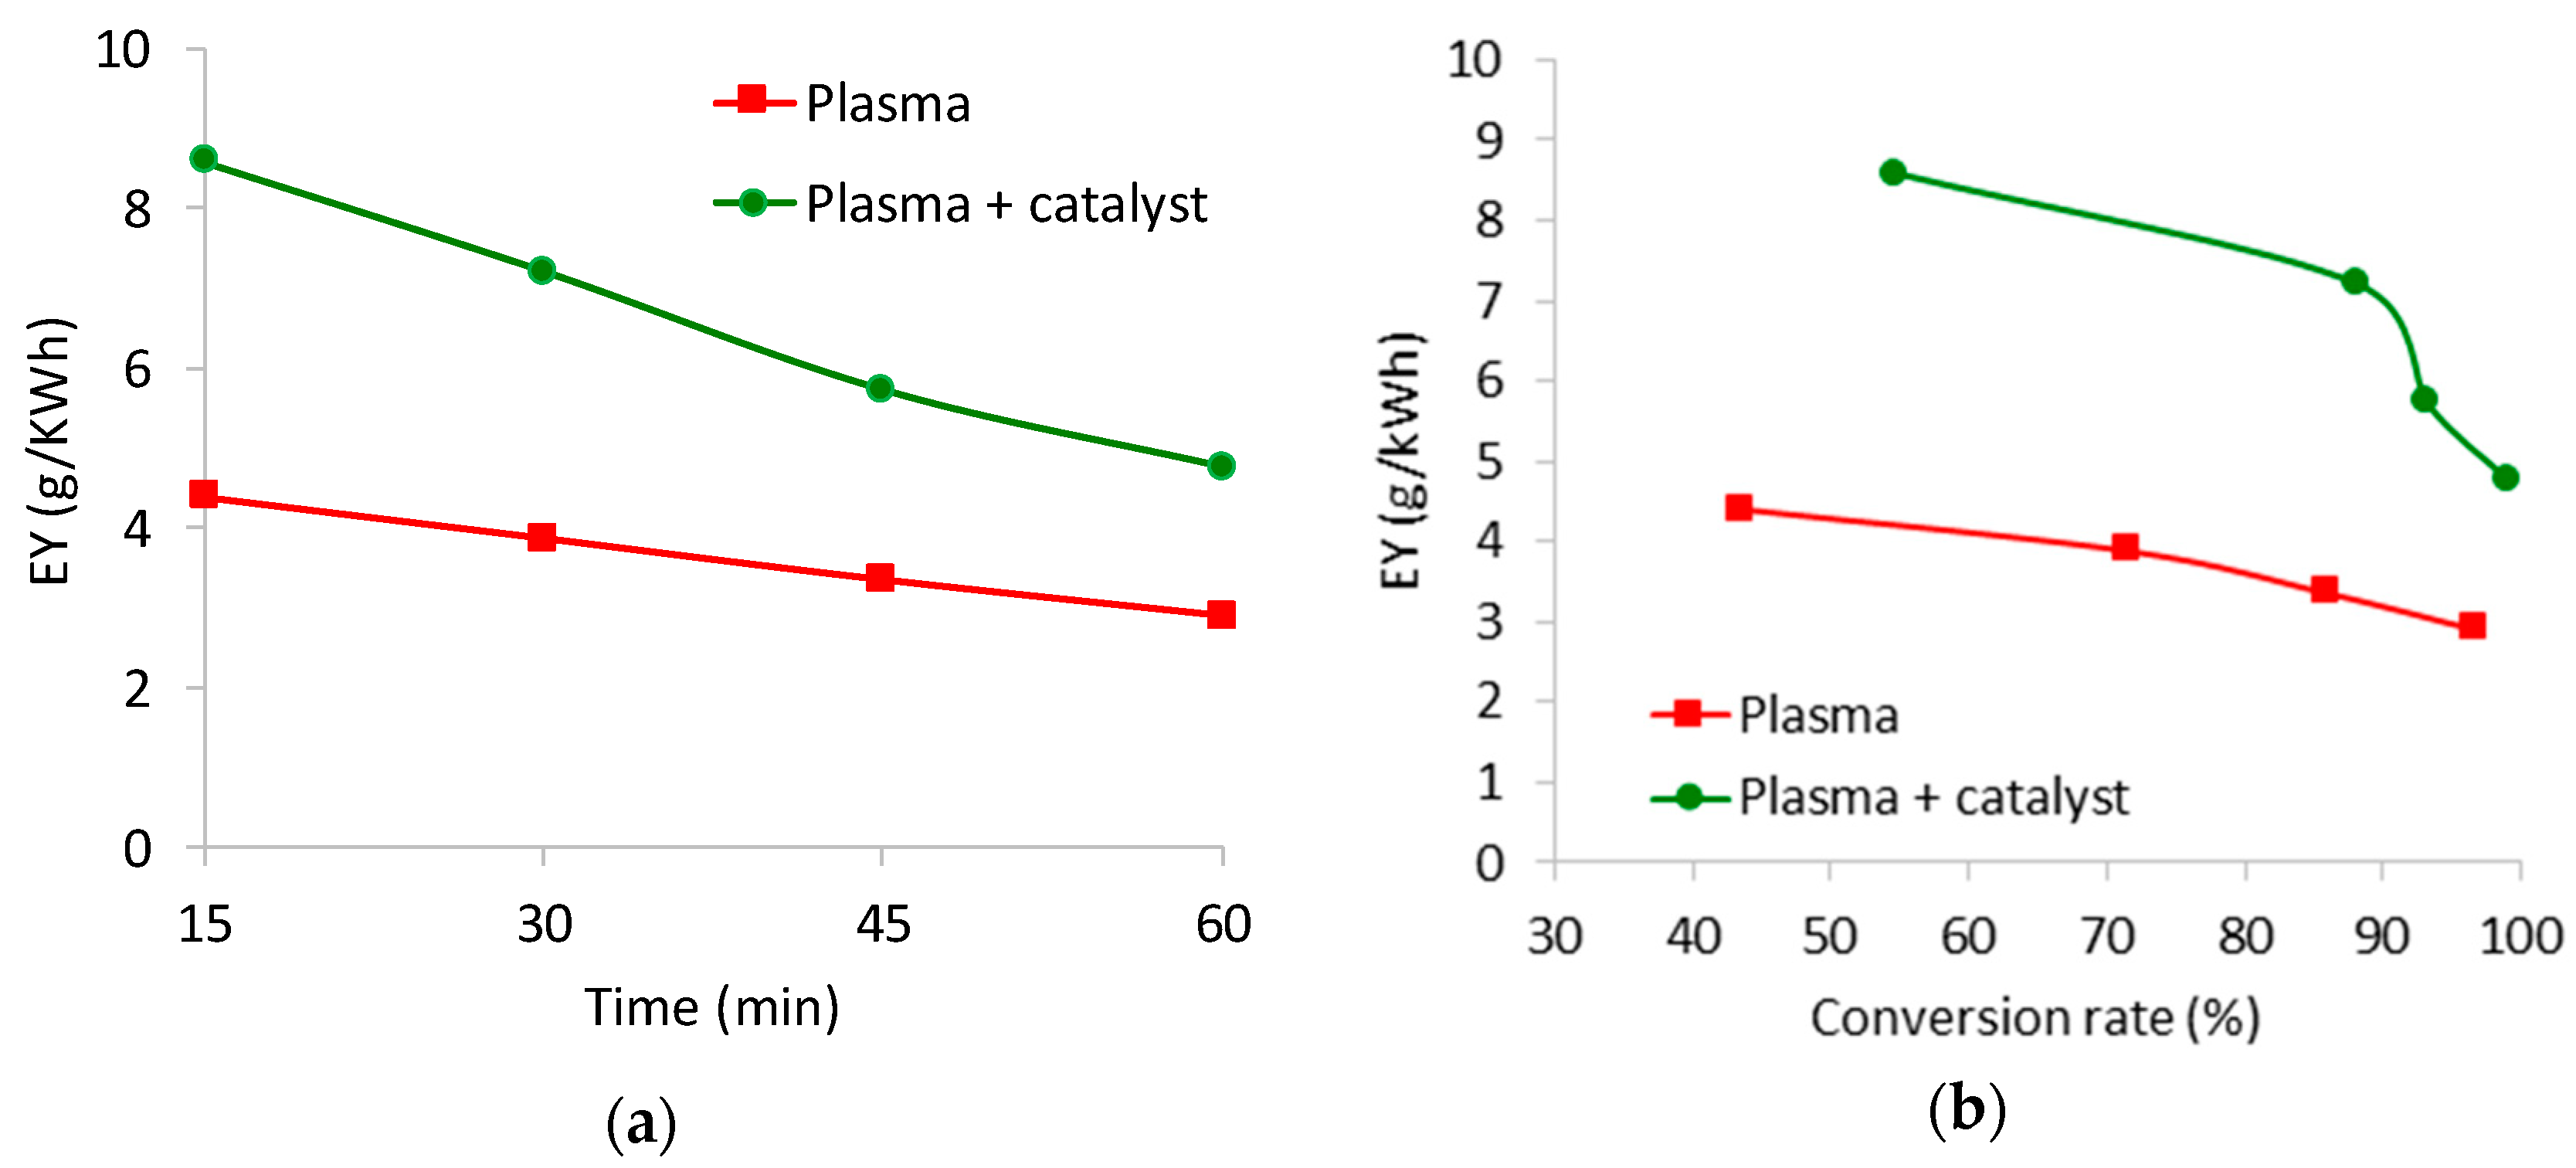
2.6. Energy Yield
Typically, in these experiments, the power consumed was 0.31 W with plasma alone and 0.21 W for NTP/catalysis coupling. The Energy Yield (EY) for the plasma alone was in the range of 2.9–4.4 g·(kWh)
−1, and is shown in
Figure 11a as a function of the treatment time, while
Figure 11b shows the energy yield as a function of the conversion rate. The EY of the NTP/catalysis coupling system was higher (160 to 200%) than that with plasma alone, indicating that the catalyst significantly improved the EY of the NTP process.
Figure 11b showed that the coupling process simultaneously resulted in a better conversion rate and better energy yield. Note that because the calculation used the total dissipated electrical energy, of which only a portion was used for the degradation of paracetamol, so the rate given in this paper is then the mean EY of the process, but not the mean EY of paracetamol degradation.
Even with a much higher input power, Panorel et al. [
11] obtained a higher EY (up to 28 g·(kWh)
−1 with air as working gas) since the treated volume was 40 L, much bigger than the one used in the present work. In the work of Pan and Qiao [
14], with a large dissipated power of 500 W and a treated volume of 1.5 L, their EY should be one-tenth of ours. However, carrying out a direct comparison of EY remains difficult since the experimental devices, the treated volumes, and the concentrations of paracetamol are very different.
3. Materials and Methods
3.1. Reagents
Paracetamol (Acetaminophen, BioXtra ≥ 99%), sodium dihydrogen phosphate monohydrate (NaH2PO4·H2O), orthophosphoric acid (H3PO4 85%), Aluminum oxide nanopowder (13 µm primary particle size), and iron (III) nitrate nonahydrate (Fe(NO3)3·9H2O) were supplied by Sigma Aldrich® (France). Acetonitrile, nitric acid (HNO3 at 70%), and ultrapure water (HPLC gradient) were obtained from Fischer Scientific® (France). All chemicals were used without any additional purification. Commercial standards for HPLC analyses were supplied by Sigma Aldrich® (1,4-benzoquinone Supelco®, hydroquinone ReagentPlus® ≥ 99%, spectrophotometric grade p-nitrophenol, maleic acid Reagentplus® ≥ 99%, oxalic acid ≥ 99.0% (RT), acetamide~99% (GC)).
3.2. Catalyst Preparation
Commercial Glass Fiber (GF) tissue, 300 g/m2, was used as a support for iron oxide deposition via the wet impregnation method. To prepare the supported catalyst, the four steps below were carried out. Note that drying and calcinations were done under ambient air, except for the last calcination which used pure oxygen (in step c).
- (a)
GF cleaning: The GF tissue was cut in a circular shape with a diameter of 110 mm. In order to remove residual carbon coming from the fabrication process of the GF, it was calcined at 600 °C for 4 h. The GF was washed repeatedly with distilled water until it no longer released any carbon into the water. The non-release of carbon was checked by measuring the Total Organic Carbon (TOC) of the washing water.
- (b)
Washcoating of the GF: The washcoat solution was prepared with 15 g of alumina, 0.7 mL of nitric acid, and 20 mL of ultrapure water. The mixture was kept under vigorous stirring for 12 h at room temperature [
41], then GF was dipped in the washcoat solution. The washcoated GF tissue was dried at 100 °C for 12 h then calcined at 400 °C for 4 h. This step creates a bearing layer for the iron precursor.
- (c)
Iron impregnation: The alumina-washcoated GF tissue was dipped into an aqueous solution containing 1 g of iron (III) nitrate nonahydrate, and then dried for 16 h at 100 °C. The GF tissue was calcined under an oxygen flow rate of 1 mL·min−1 at 400 °C for 4 h.
- (d)
Catalyst storage: The final catalyst was washed several times with distilled water then stored in closed glass dishes at 100 °C.
3.3. Catalyst Characterisation Using BET and TGA
The specific surface area of the catalyst was measured using the Brunauer-Emmett-Teller (BET) surface area method. The BET surface area of the materials was determined from nitrogen adsorption at −196 °C obtained with an ASAP 2020 Micromeritics apparatus. Beforehand, the samples were degassed at 250 °C for at least 24 h under a residual vacuum of at least 6 µm Hg (0.8 Pa).
Table 1 shows the specific BET surface area (S
BET) of Fe/GF before and after 90 min of use in the plasma/catalysis coupling process. It can be seen that there is a very slight increase in the surface area of the catalyst after use.
Thermogravimetric analyses were performed using a Netzsch STA 449 JUPITER F5. A mass of approximately 0.040 g of sample was placed in the thermobalance under a 160 mL min−1 argon flow. Systematically, a blank experiment was carried out, under the same conditions, in order to determine the correction required for the base-line. The procedure consisted of a temperature increase at a 20 °C min−1 heating ramp from ambient temperature to 900 °C (to study a larger temperature domain), followed by cooling to room temperature at a cooling rate of 10 °C min−1. The TGA analyses (not shown here) indicated that there was no difference in the thermogram of each material studied with a mass loss of approximately 1%.
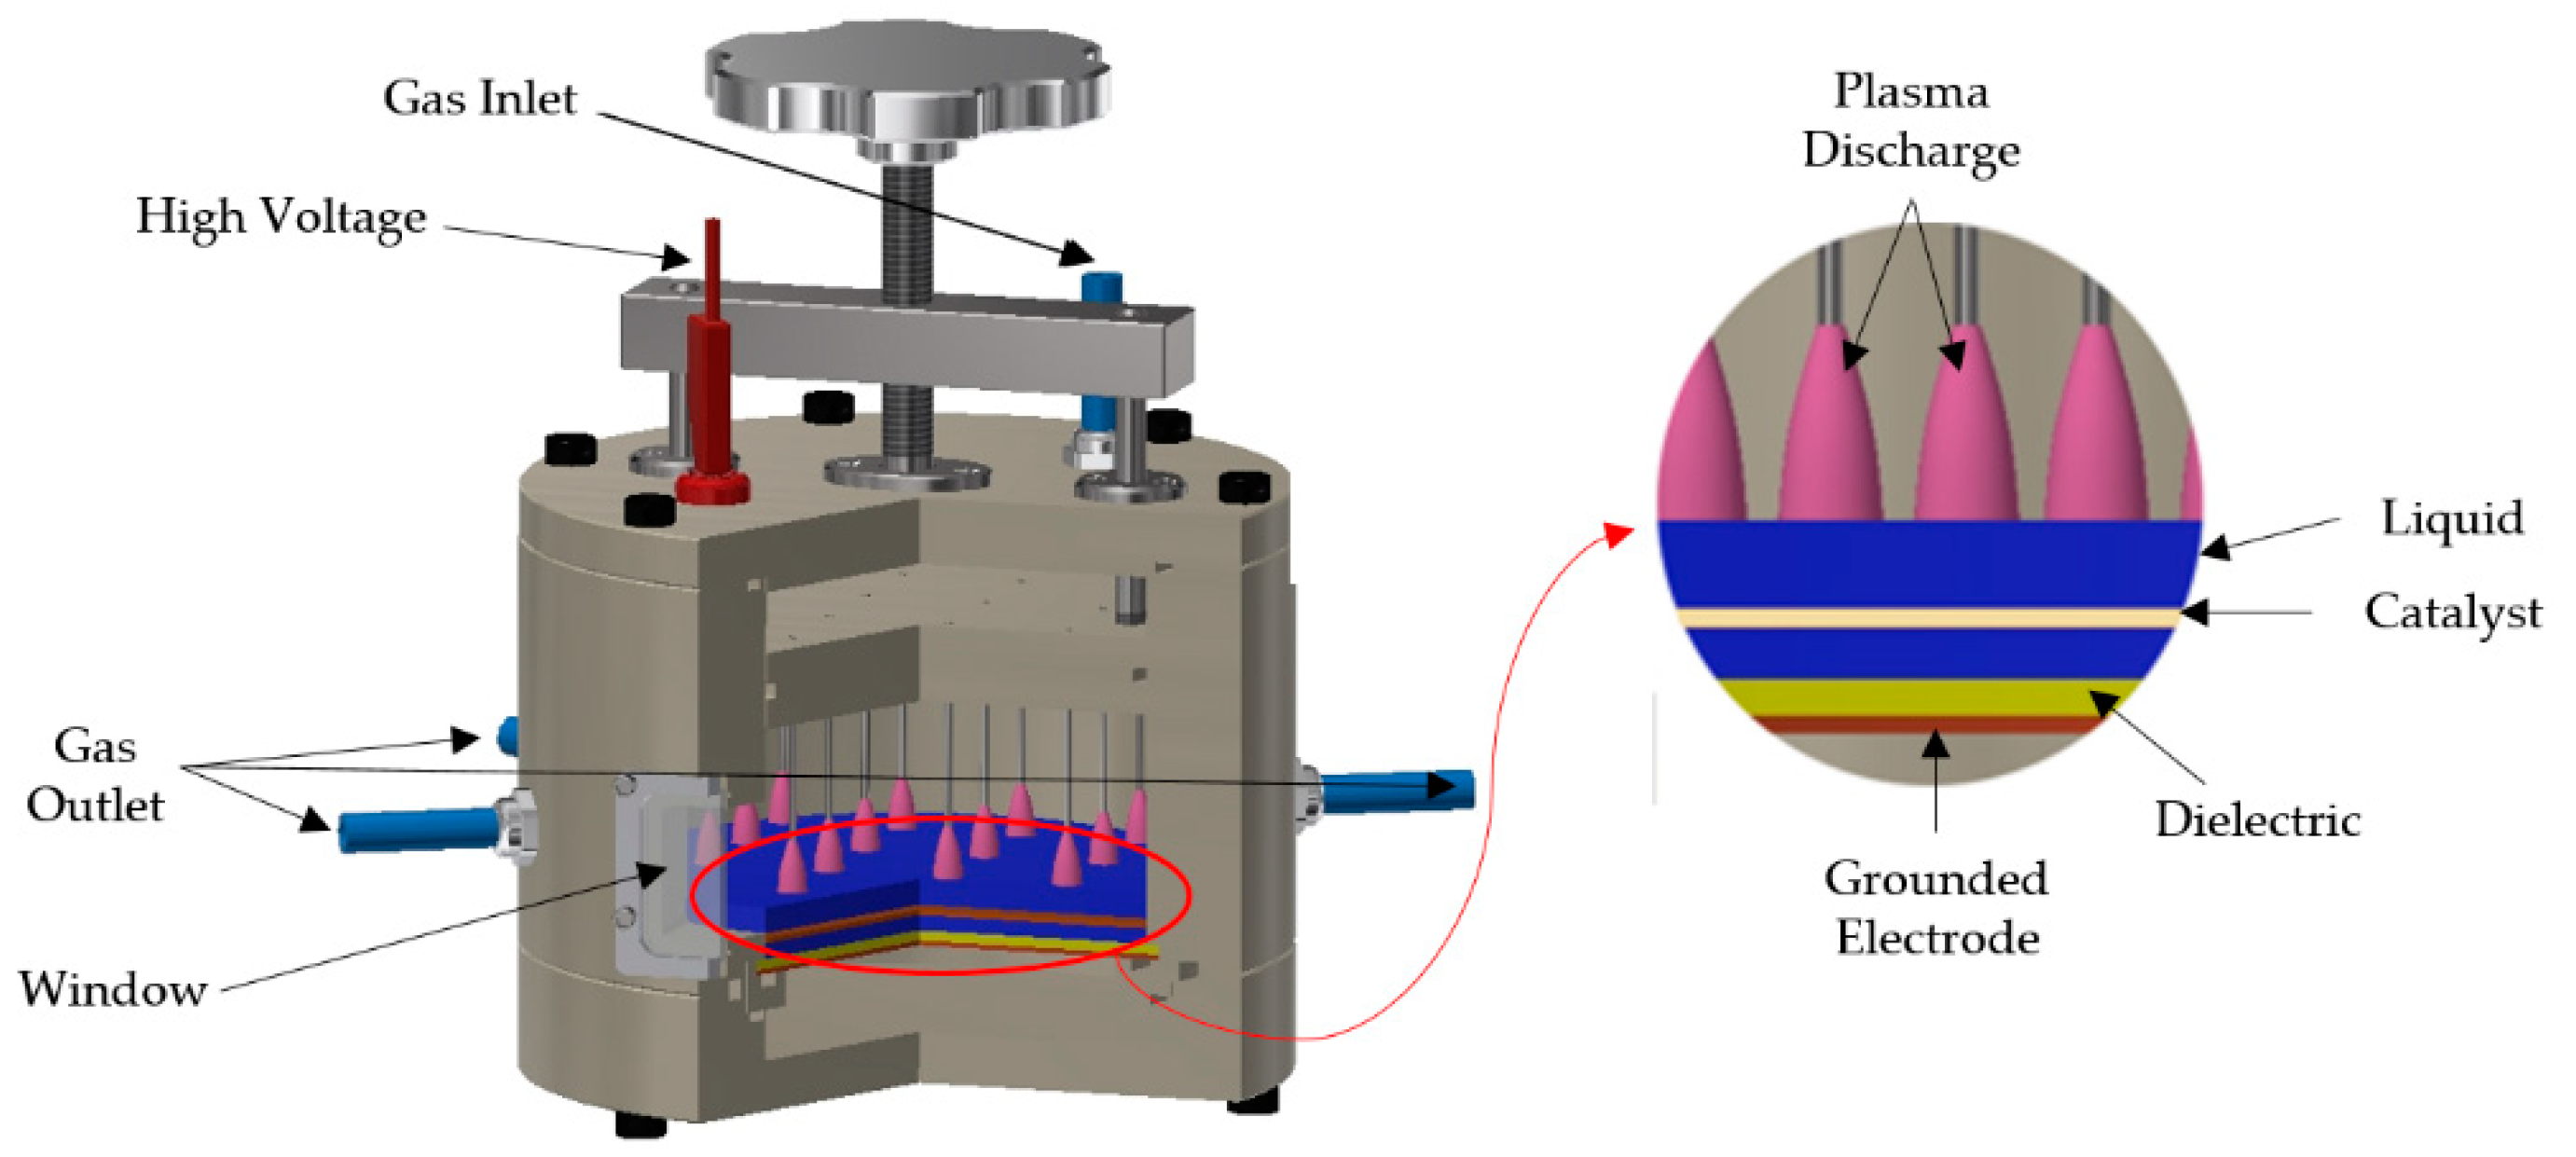
3.4. Experimental Setup
The Non Thermal Plasma (NTP) reactor shown in
Figure 12 was already described in a previous paper [
13]. Briefly, a Dielectric Barrier Discharge (DBD) reactor with multiple needle-to-plate configurations was placed inside a cylindrical recipient made of Polyvinyl Chloride (PVC). High-Voltage (HV) was applied to the 12 stainless steel needle electrodes with 0.4 mm of inner diameter. The working gas (air) was introduced through the hollow electrodes at a flow rate of 100 sccm. The grounded electrode was a copper thin film deposited on a dielectric epoxy plate. The volume of the solution of paracetamol to be treated was 40 mL prepared in ultrapure water at a concentration of 25 mg L
−1 maintaining a distance between the electrodes and the surface of the liquid of 5 mm.
For NTP/Catalysis coupling, the catalyst was dipped into the liquid above the dielectric, as illustrated in the inset in
Figure 12. The discharges were generated above the liquid by a HV amplifier (Trek
® 20/20C) with a frequency of 500 Hz driven by a function generator (TTI
® TG4001). Electrical measurements were performed using high-voltage (PMK-14KVAC PHV4-3272) and current (P6015A Tektronix
®) probes connected to an oscilloscope (DPO 3054 Tektronic
®). A capacitor of 0.5 nF was inserted in the discharge circuit in order to determine the dissipated power using the Lissajous method.
3.5. Analytical Methods & Instrumentation
A High Performance Liquid Chromatography system (HPLC, NEXERA i-Series LC2040C 3D, Shimadzu Corporation, France) with an SPD-40V UV-Vis detector was used to detect paracetamol and its intermediates. The analyte separation was carried out on a 150 × 3.0 mm reverse-phase Shim-pack GIST-HP C18 (Shimadzu®) column with a spherical particle (Octadecyl groups) size of 3 μm diameter. The column temperature was set at 40 °C. The mobile phase (5:95 v/v) was a mixture of Acetonitrile (ACN): Ultrapure water (20 mM NaH2PO4·H2O) at pH 2.8. The flow rate was 0.6 mL·min−1 and a programmed gradient system was used (5% of ACN for 0.5 min. then ACN increased up to 70% until 10 min and kept stabilized until 13 min; finally, a decrease of ACN down to 5% at 13.5 min). To detect paracetamol molecules, the UV-detection wavelength was 246 nm with a running time of 20 min per sample to determine the retention time and peak area of paracetamol. The concentration of paracetamol residue was calculated using a pre-determined calibration curve.
The paracetamol conversion rate τ (%) for a given treatment time was calculated from the following (Equation (21)):
where
C0 and
Ct are the concentrations of paracetamol in mg L
−1 before and after treatment duration
t.
The mineralization of paracetamol was characterized by Total Organic Carbon (TOC) removal, which was determined by a TOC-L
CSH/CSN (Shimadzu
®) analyzer based on the high-temperature combustion oxidation method. The removal ratio of TOC (τ
TOC), indicating the mineralization rate, was calculated by (Equation (22)):
where [TOC] is the initial TOC of the paracetamol solution in (mg L
−1), [TOC]t is the TOC value at treatment time
t (min).
The Energy Yield of the process was evaluated from the following expression (EY):
where
C0 and
Ct are the concentrations of the pollutant before and after treatment, △t (in h) is the treatment time;
V is the volume of the treated solution (L) and
P is the power dissipated in the discharge (in kW). EY corresponds to the mass of paracetamol removed per kWh.
The concentrations of nitrites, nitrates, hydrogen peroxide, and ozone in aqueous phase were measured with a photometer MultiDirect (Lovibond®). The values of pH and conductivity of the solutions before and after treatment were measured with an Accumet AB200 (Fisher Scientific®).


