Cu-Mg-Fe-O-(Ce) Complex Oxides as Catalysts of Selective Catalytic Oxidation of Ammonia to Dinitrogen (NH3-SCO)

 , ,
, , 
Abstract
: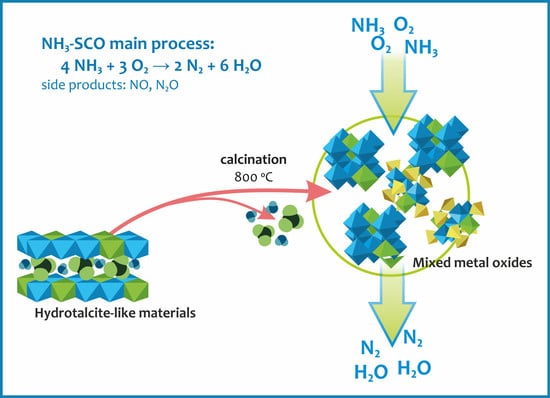
1. Introduction
2. Results and Discussion
2.1. Characterisation of Hydrotalcite-Like Materials
2.2. Properties of the Mixed Metal Oxides
2.2.1. Chemical Composition
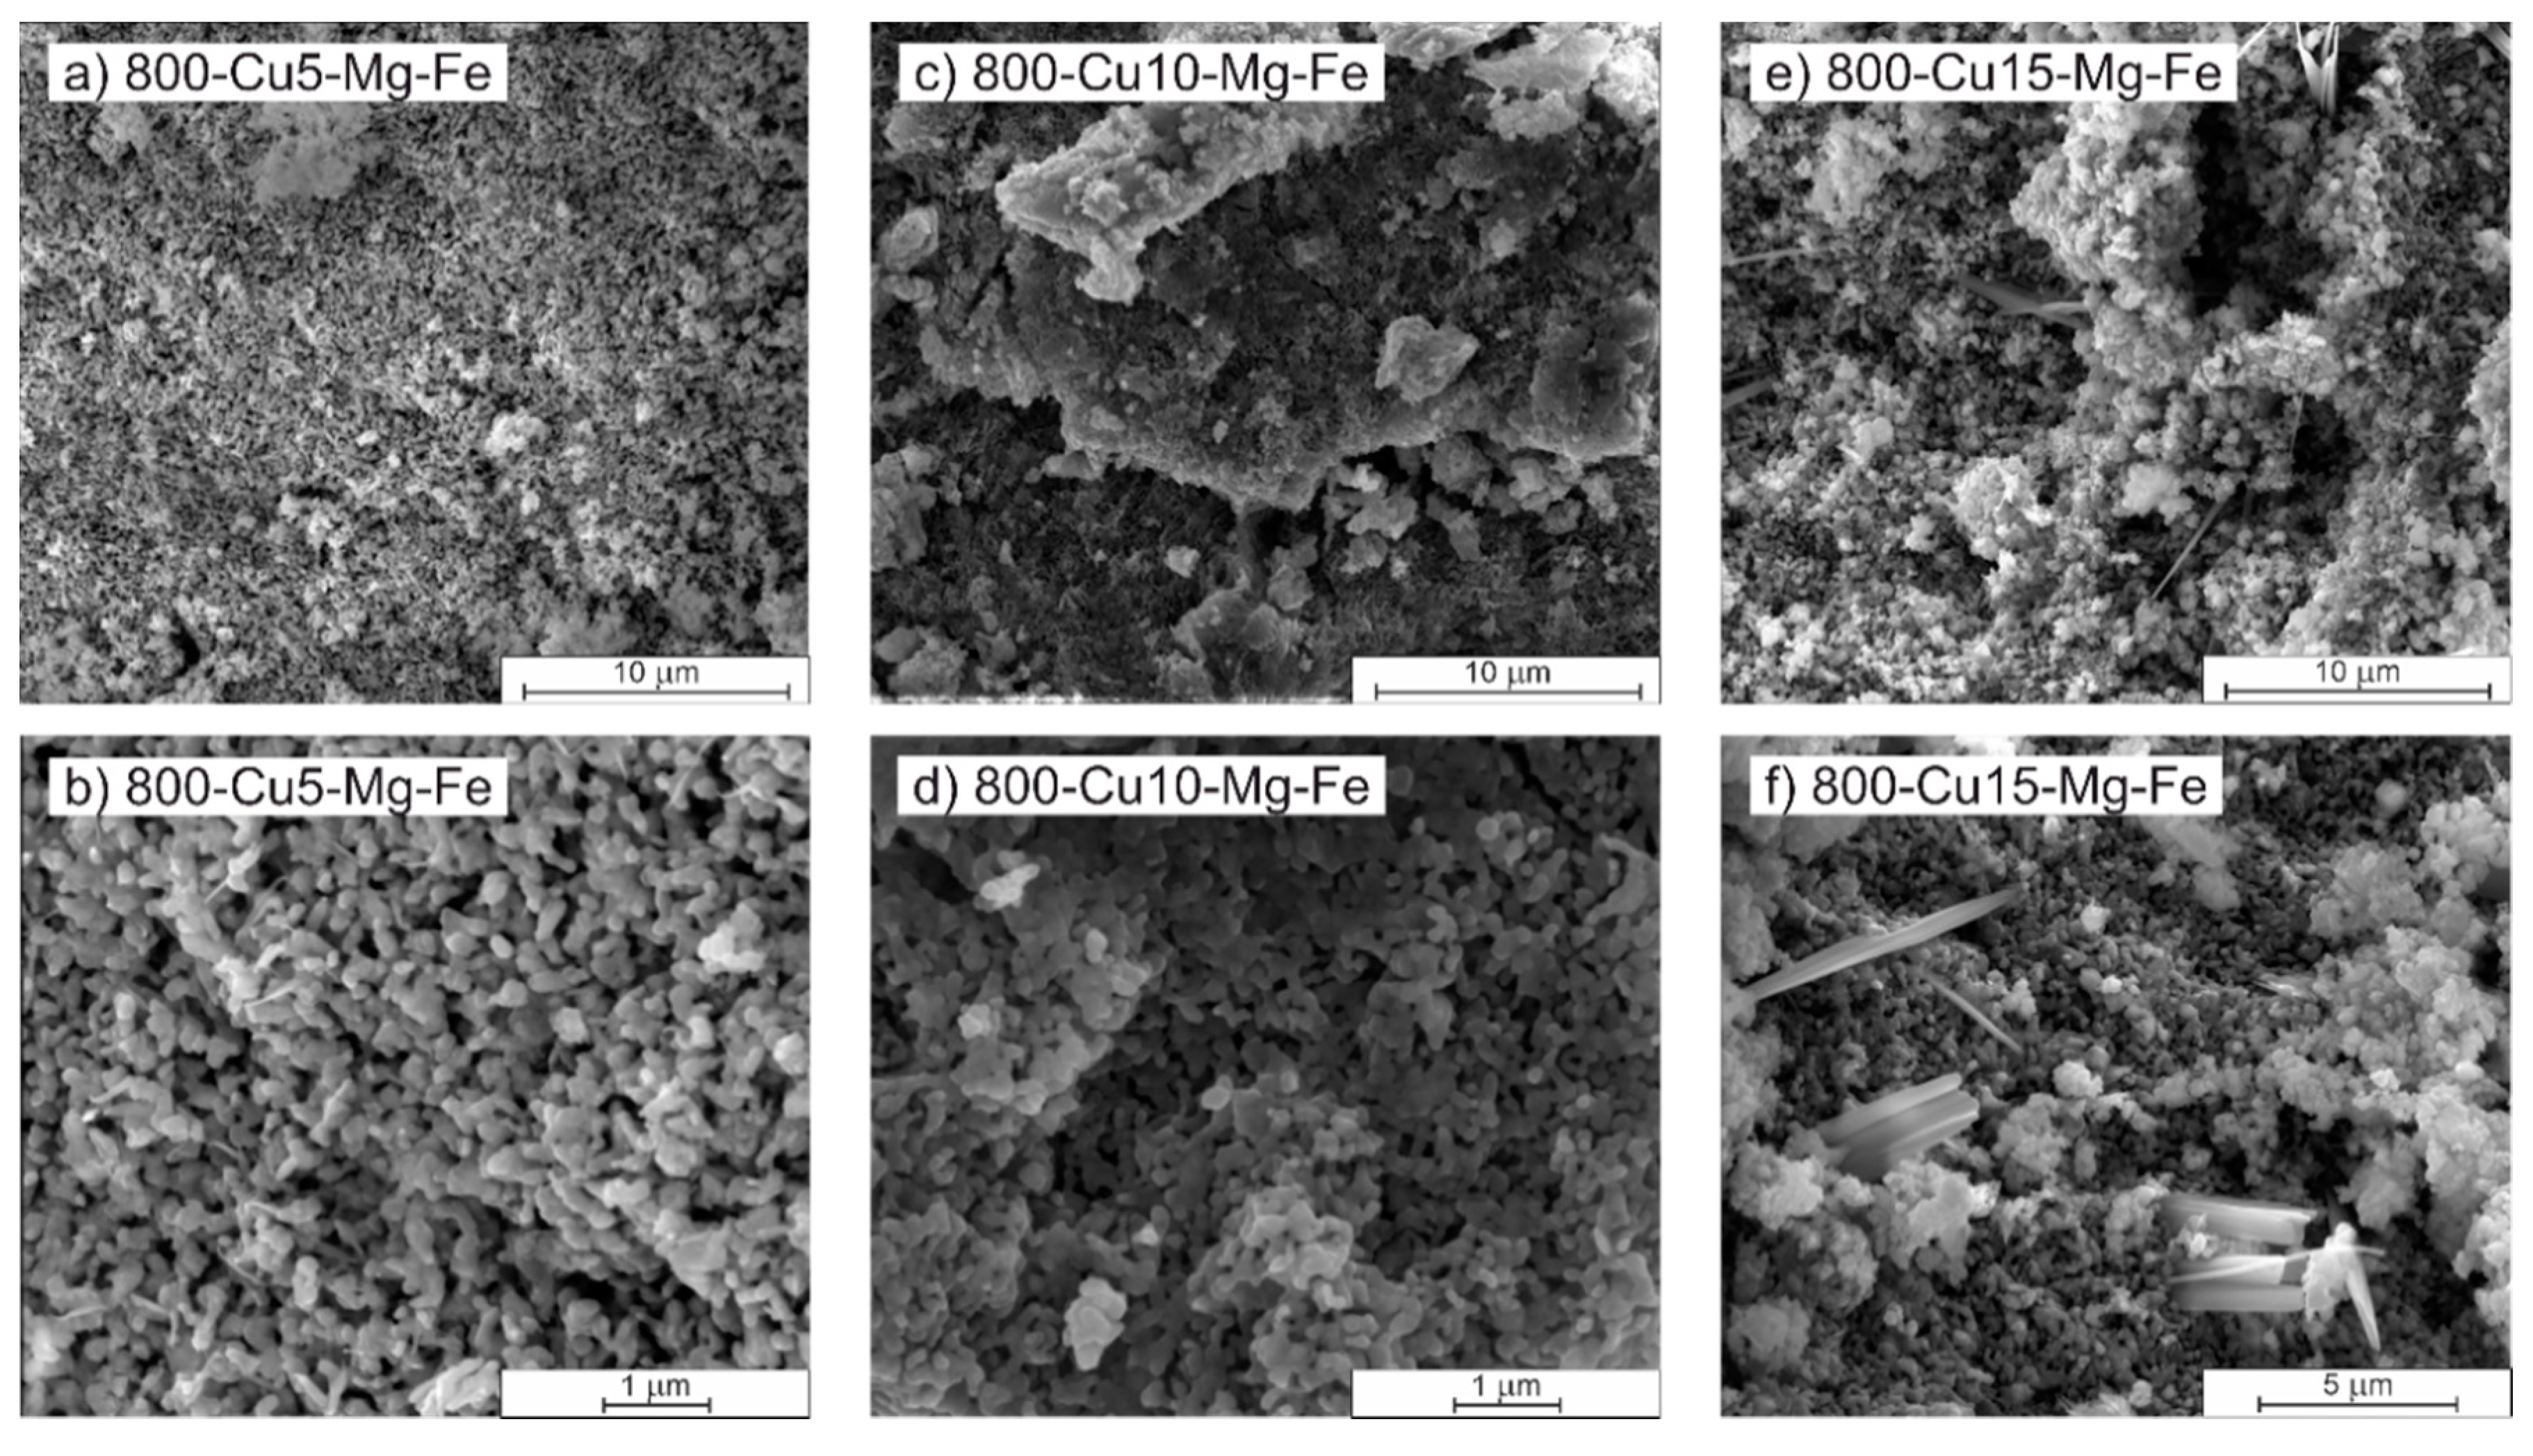
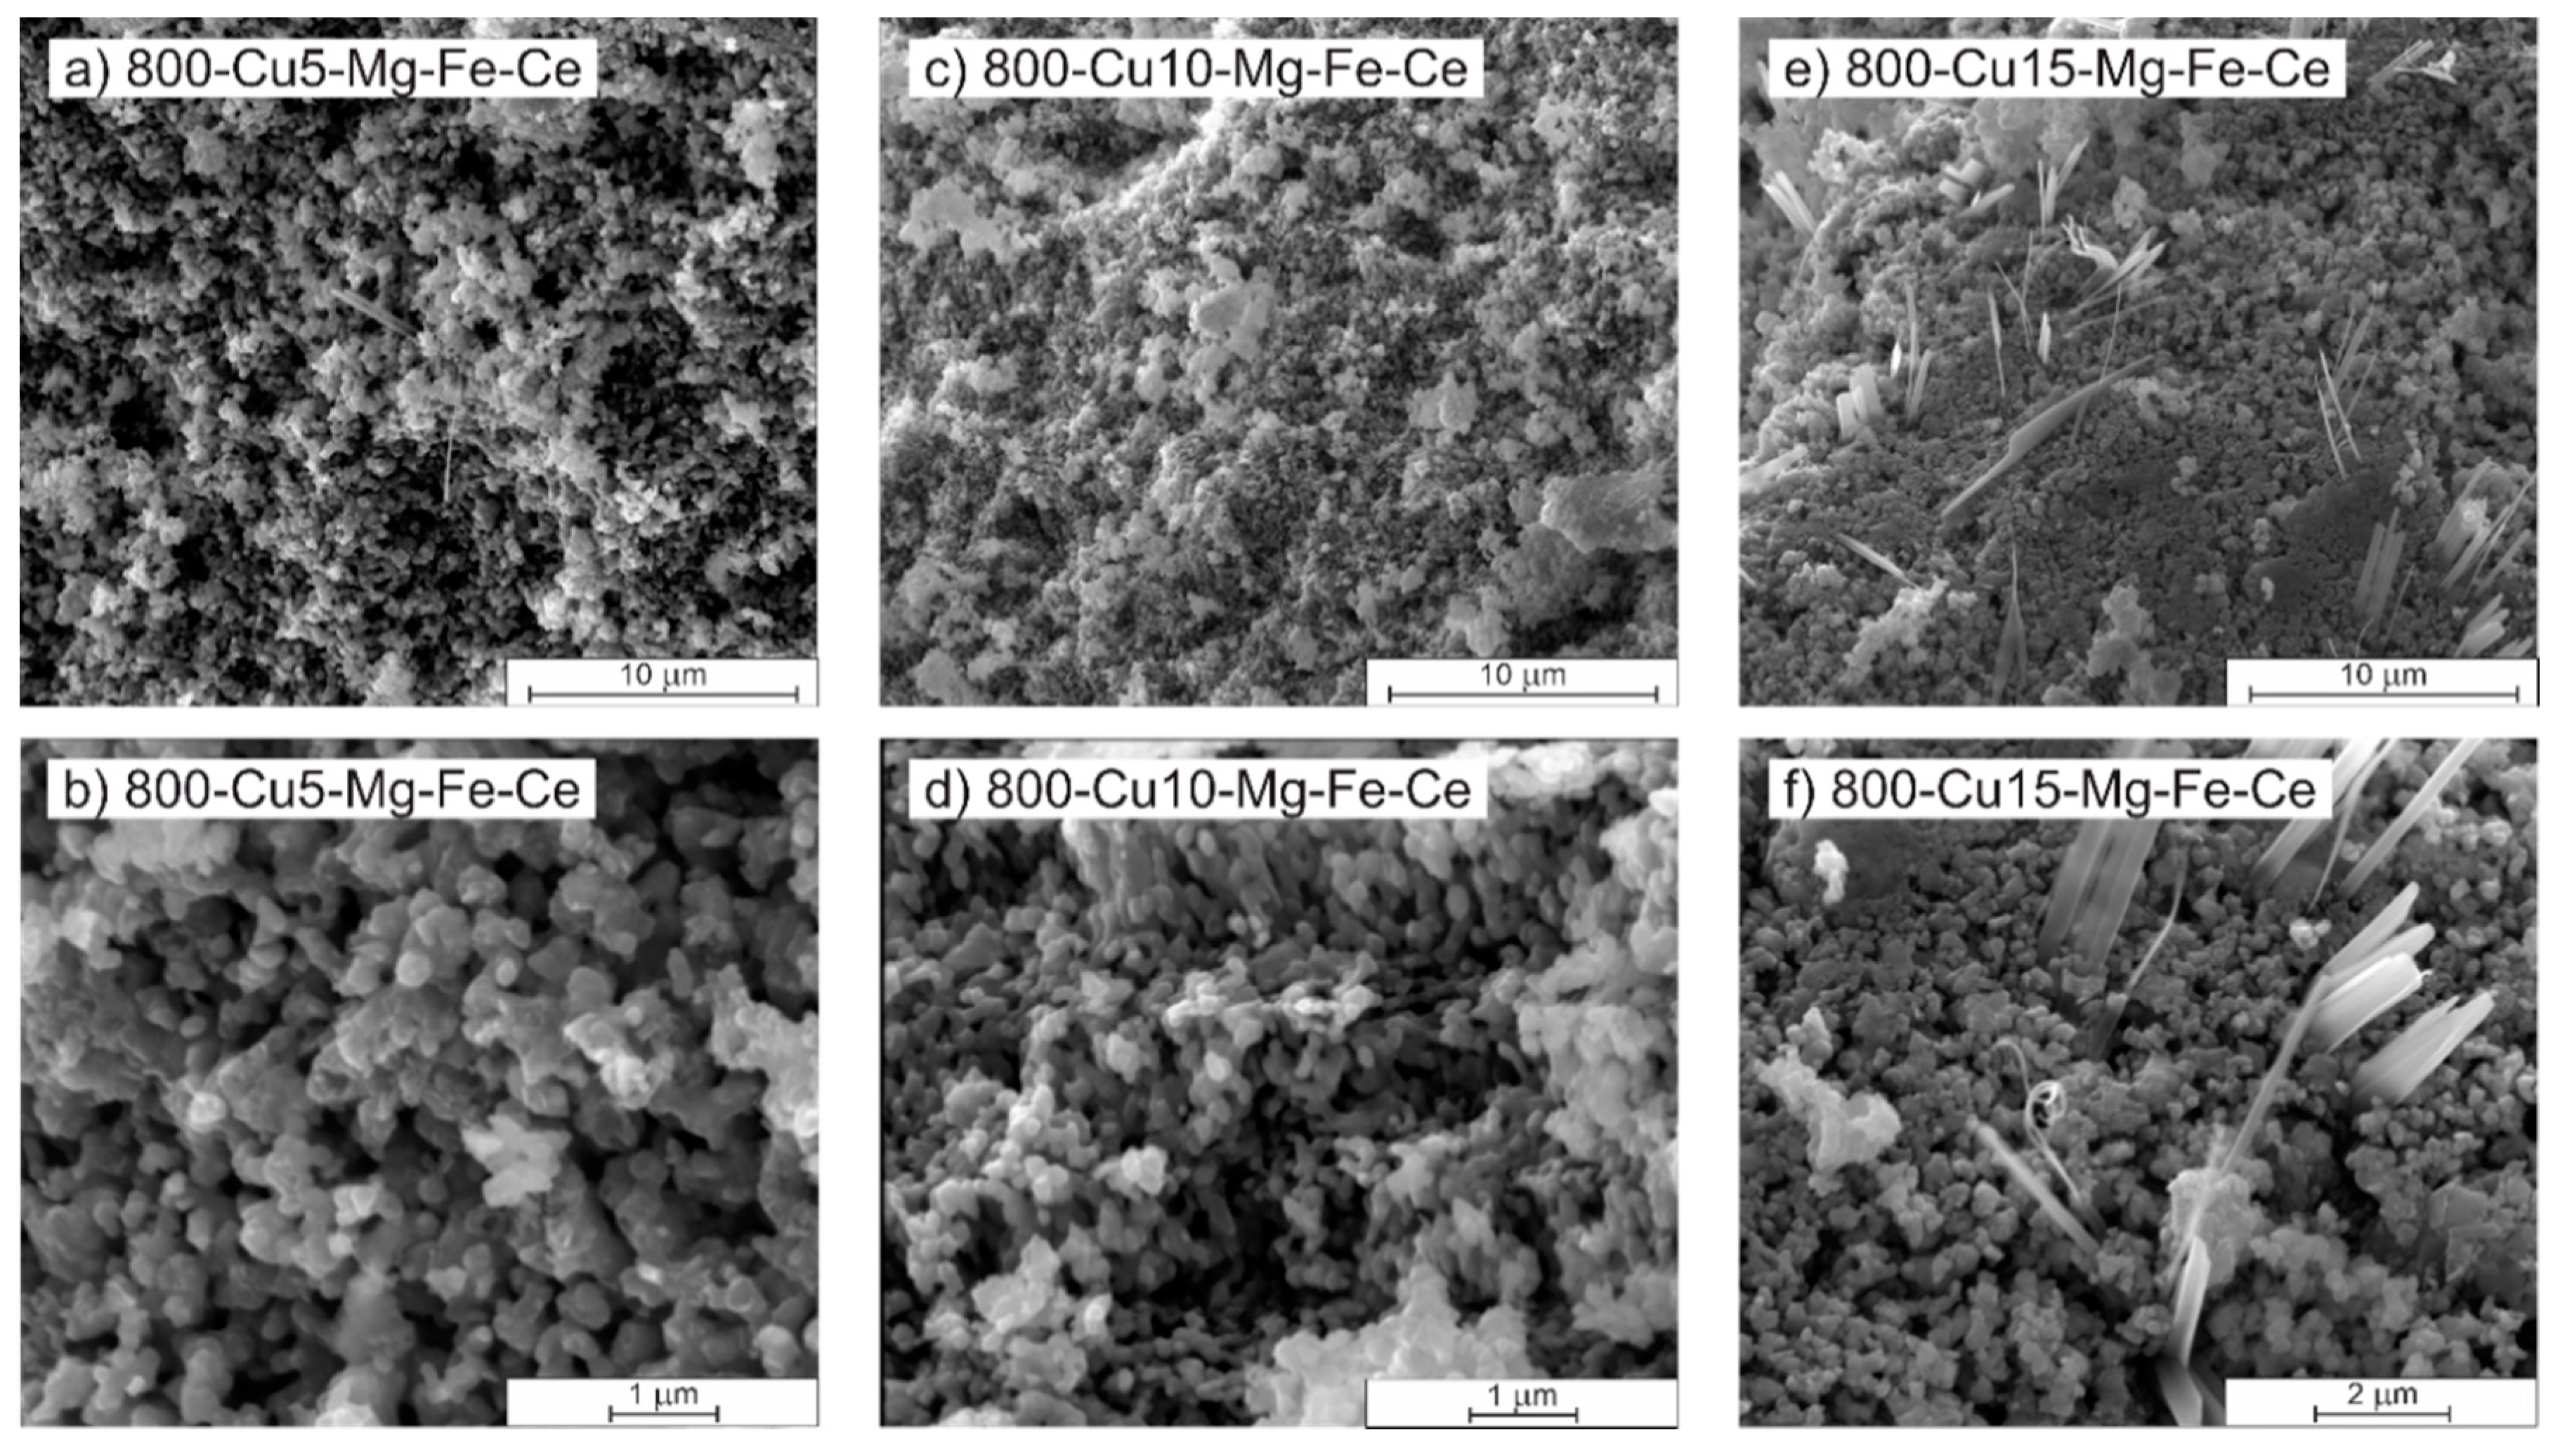
2.2.2. Phase Composition and Morphology
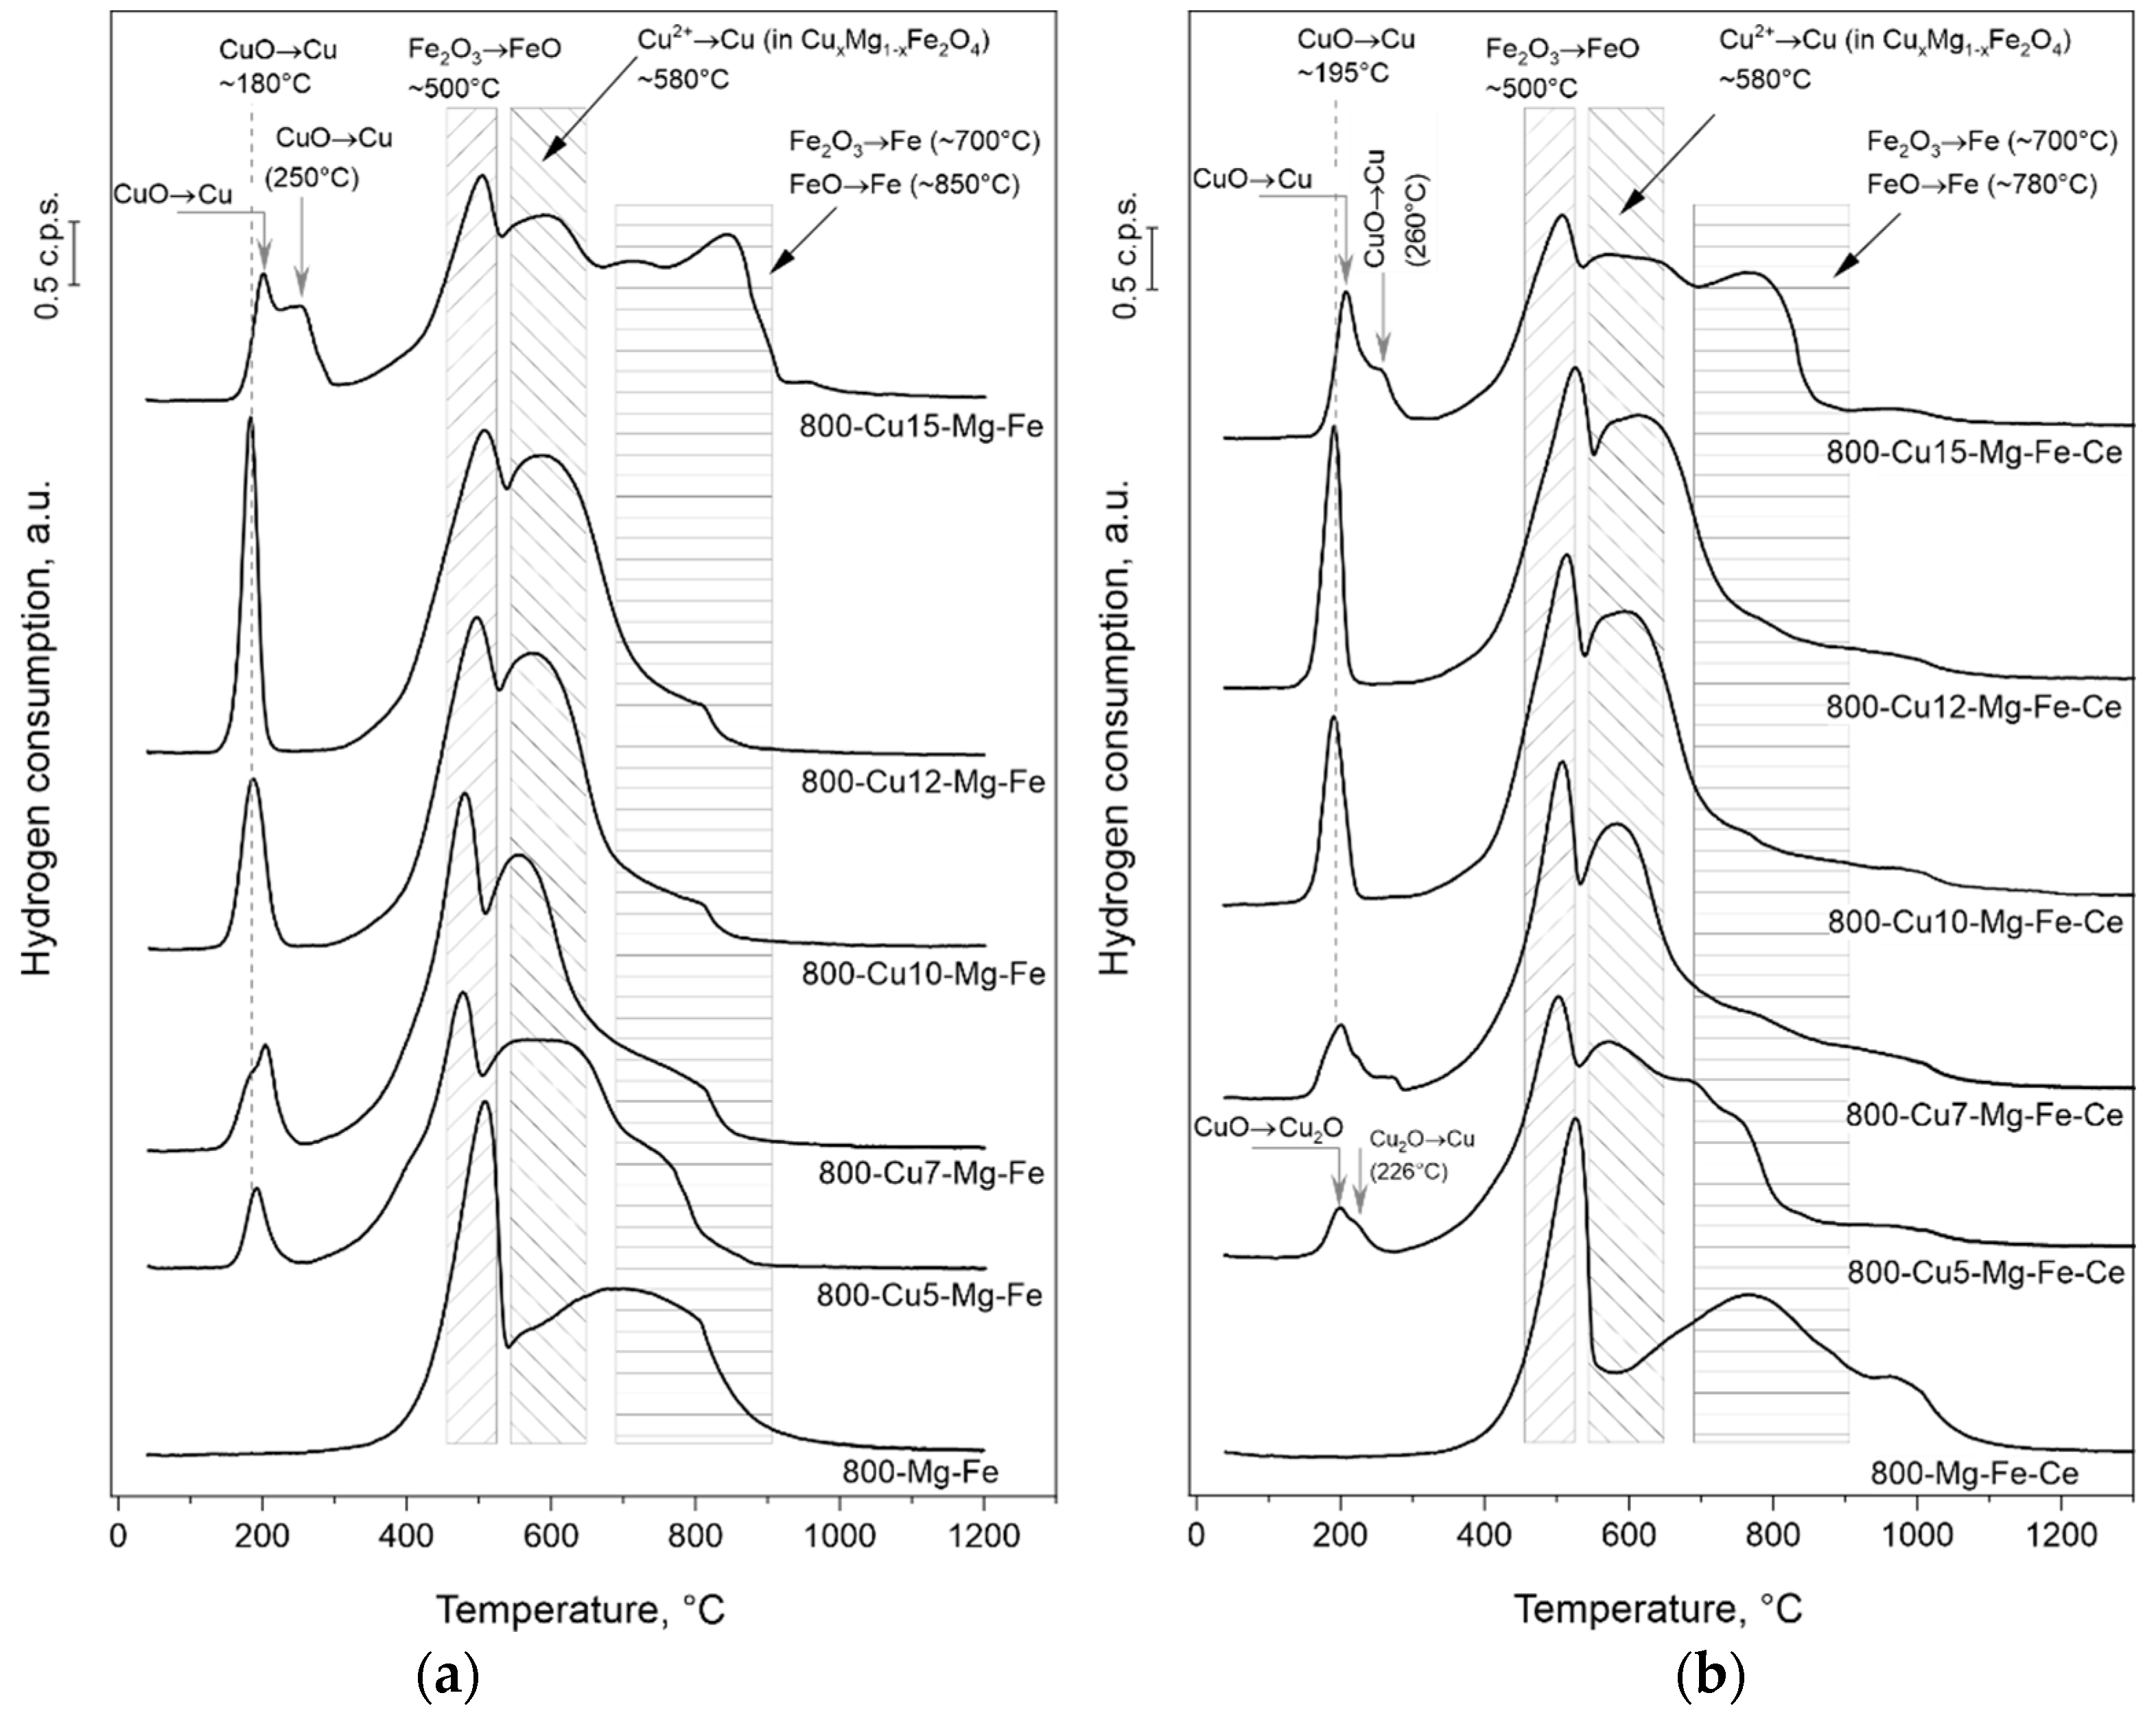
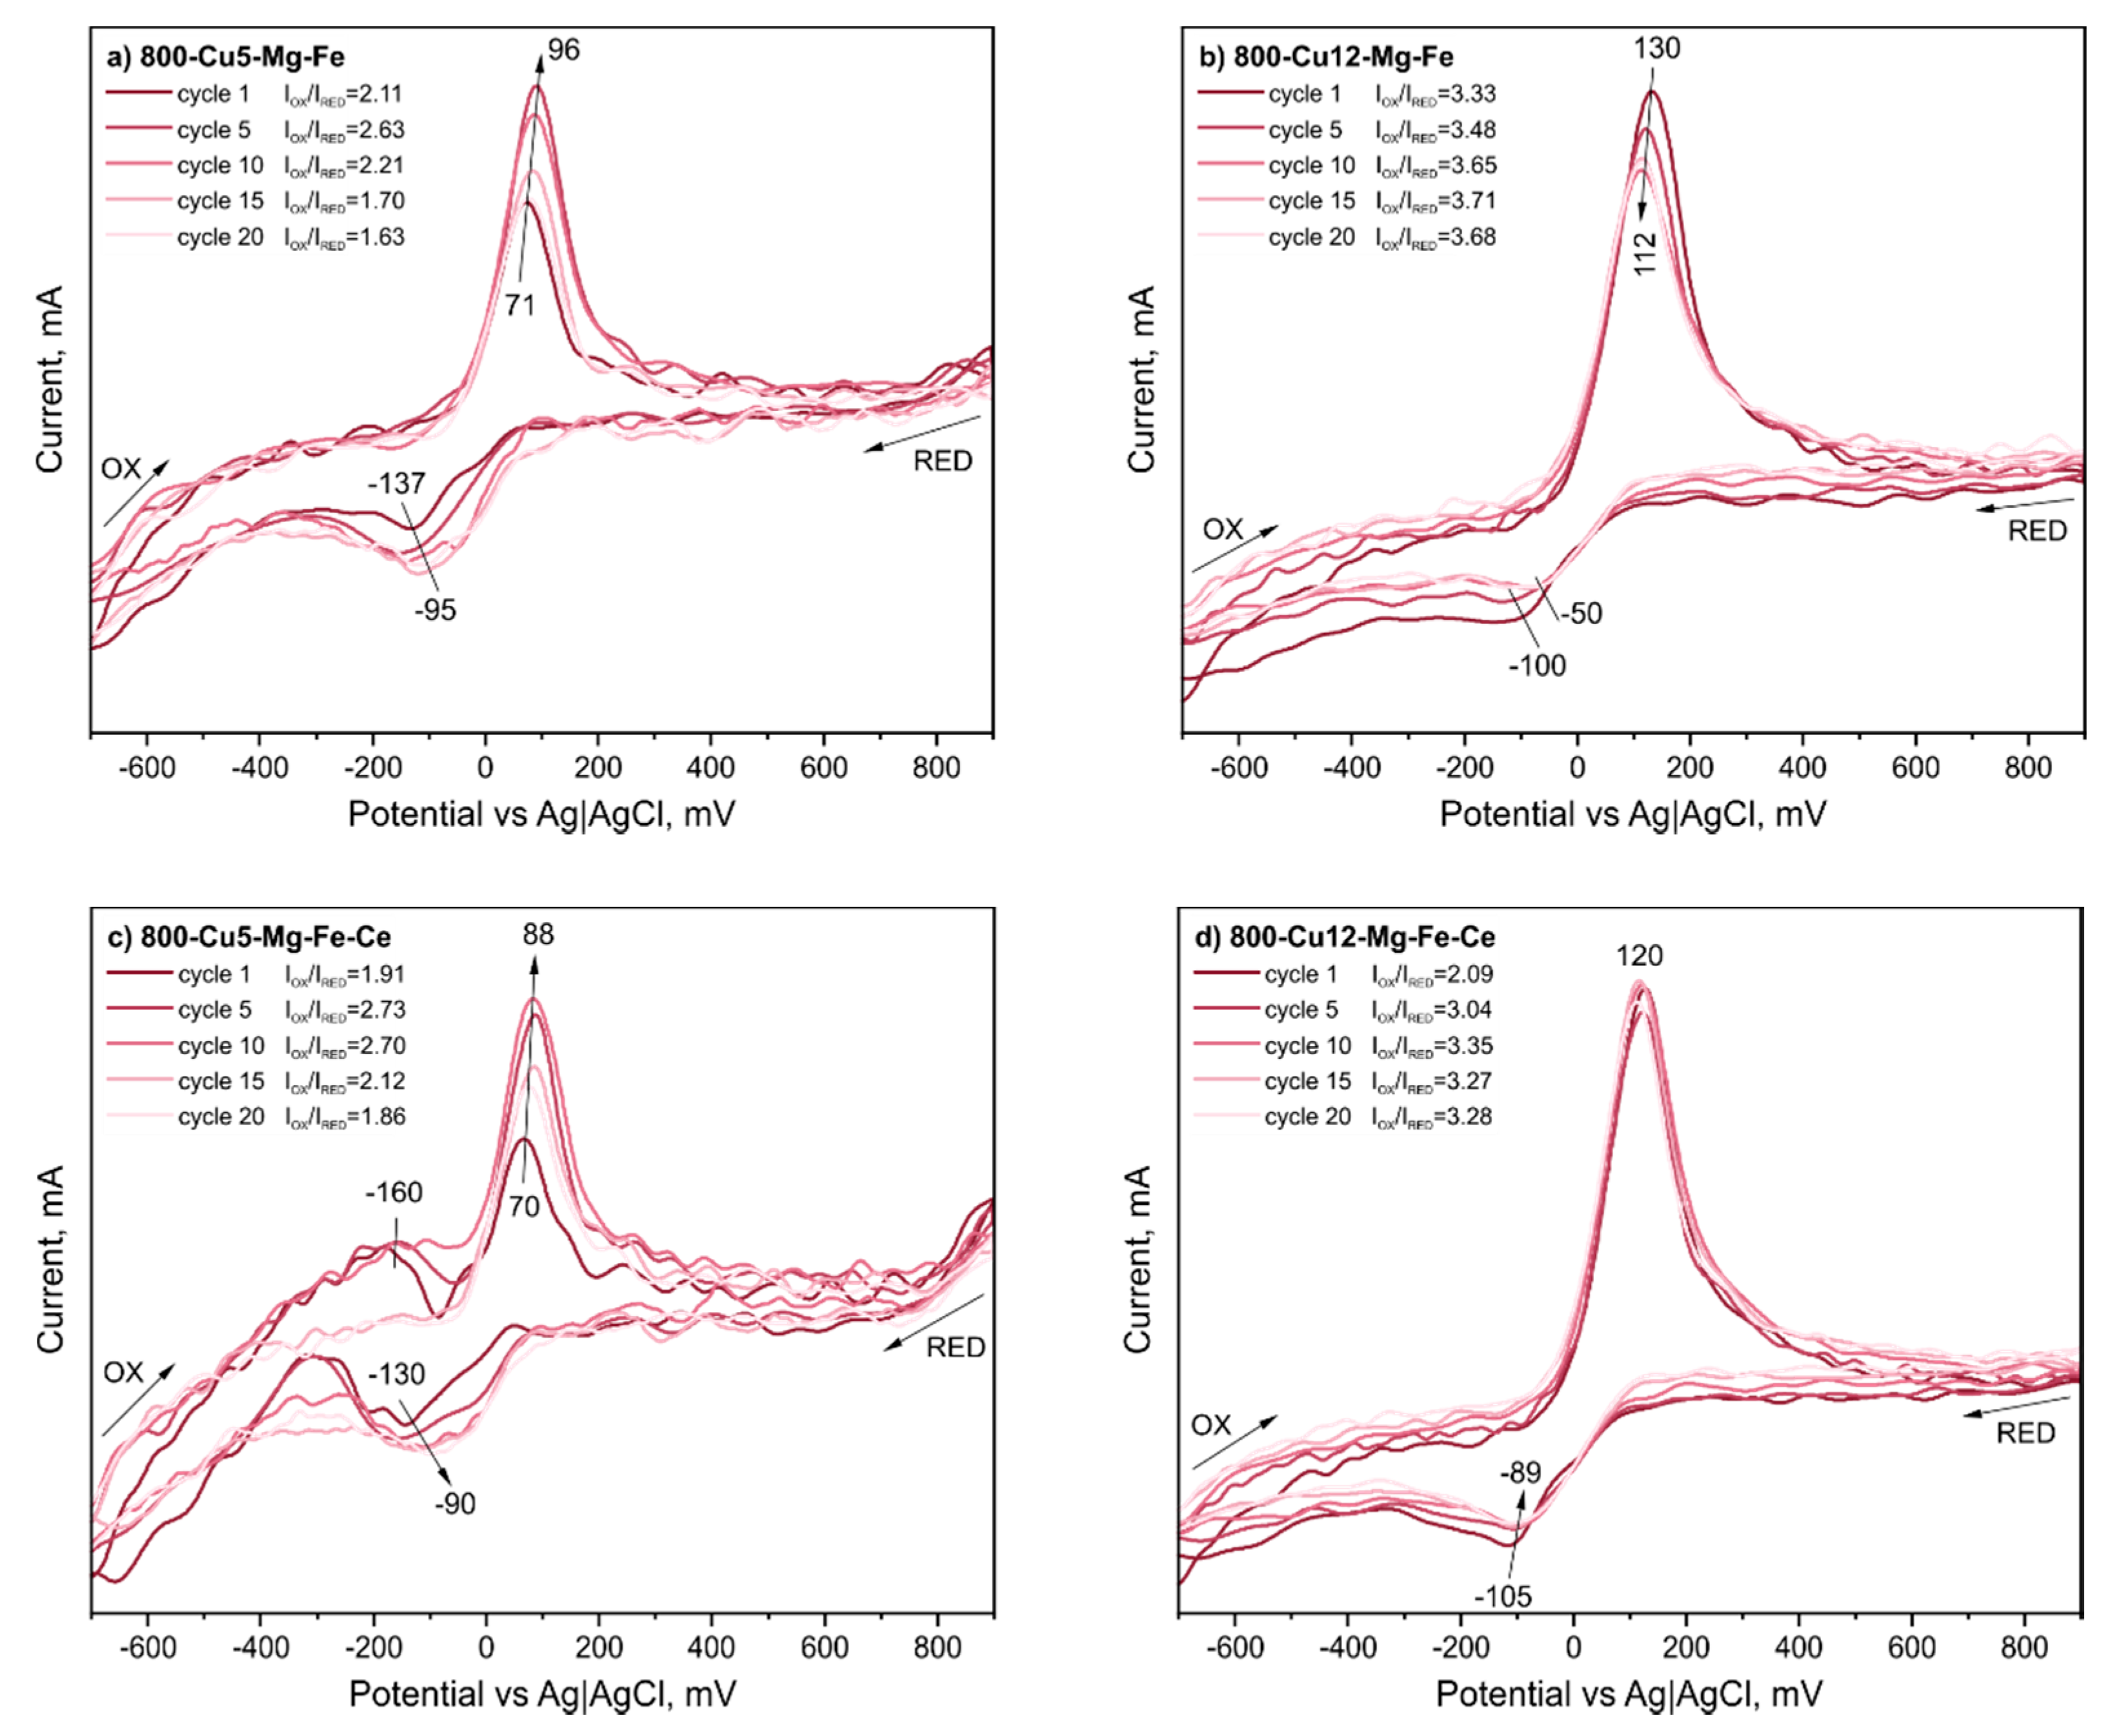
2.2.3. Reducibility and Redox Properties
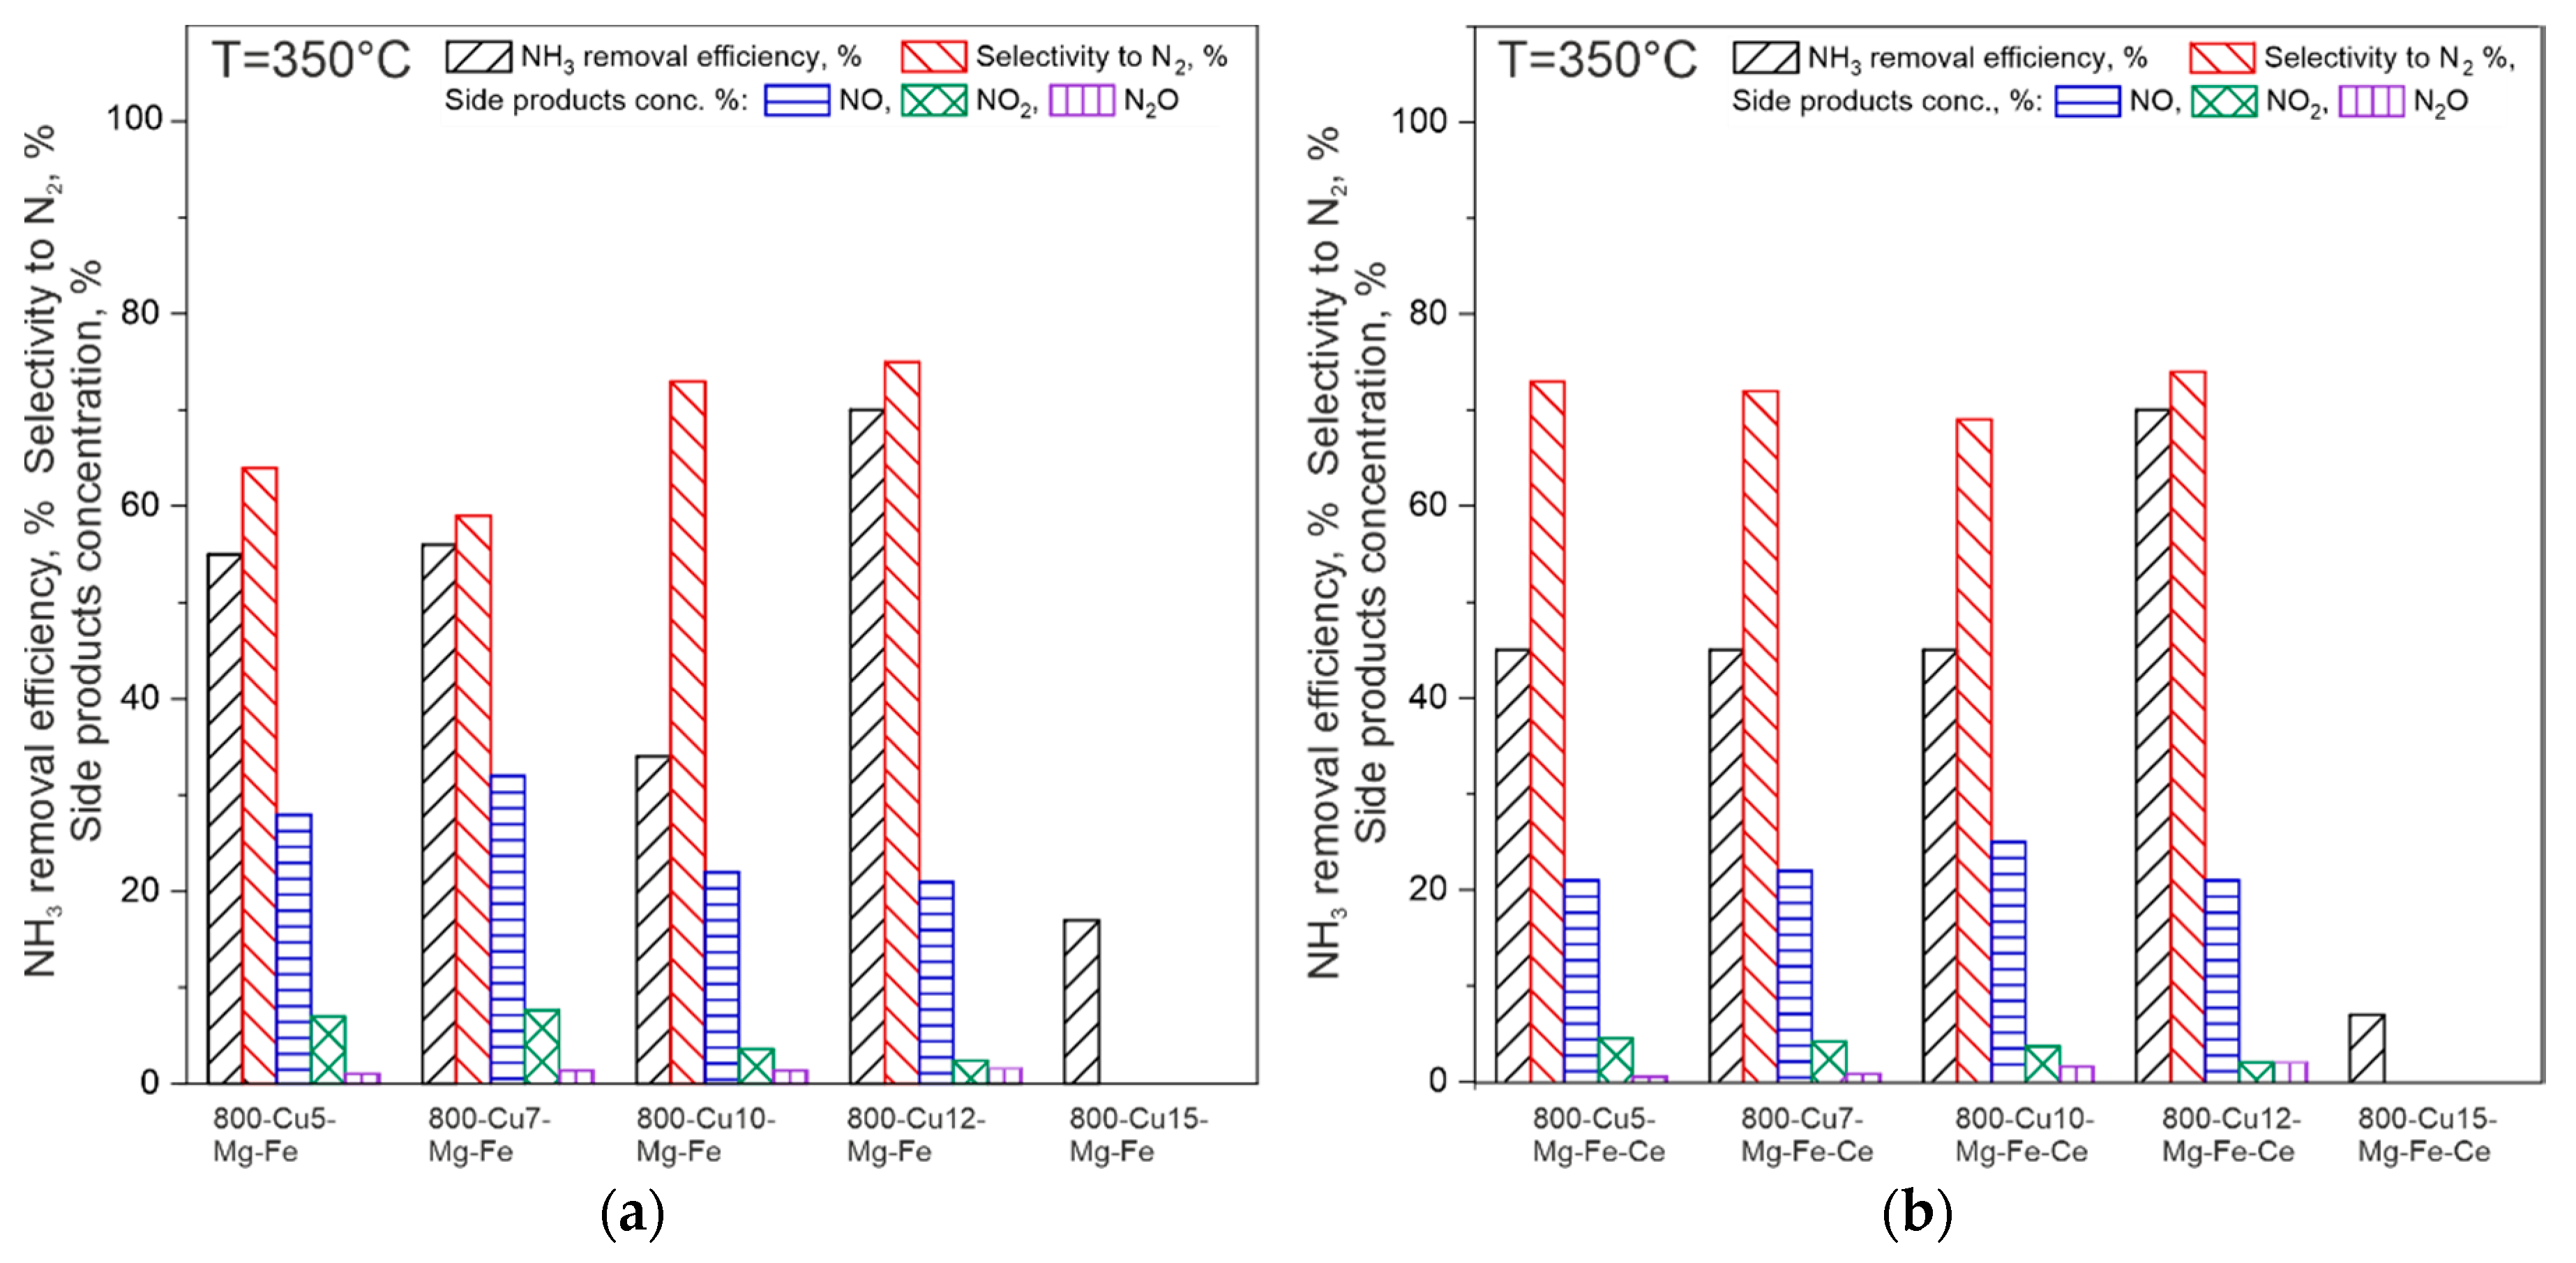
2.3. Catalytic Studies
3. Conclusions
4. Materials and Methods
4.1. Catalysts Preparation
4.2. Sample Characterization
4.3. Catalytic Studies
Supplementary Materials
Author Contributions
Funding
Acknowledgments
Conflicts of Interest
Abbreviations
| List of symbols | |
| ammonia removal efficiency (conversion), % | |
| inlet ammonia concentration, | |
| outlet ammonia concentration | |
| selectivity to dinitrogen, | |
| outlet NO concentration, | |
| outlet NO2 concentration, | |
| outlet N2O concentration. | |
| selectivity to the side product i = NO, NO2 or N2O, | |
| outlet concentration of product i | |
| sum of outlet product concentrations, including N2 concentration described as: | |
References
- Dammers, E.; McLinden, C.A.; Griffin, D.; Shephard, M.W.; Van Der Graaf, S.; Lutsch, E.; Schaap, M.; Gainairu-Matz, Y.; Fioletov, V.; Van Damme, M.; et al. NH3 emmisions from large point sources from CrIS and IASI satellite observations. Atmos. Chem. Phys. Discuss. 2019, 19, 1–47. [Google Scholar]
- Monteny, G.-J.; Hartung, E. Ammonia Emissions in Agriculture; Wageningen Academic Publishers: Wageningen, The Netherlands, 2007; ISBN 978-90-8686-0296. [Google Scholar]
- Borsari, V.; de Assunção, J.V. Ammonia emissions from a light-duty vehicle. Transp. Res. Part D 2017, 51, 53–61. [Google Scholar] [CrossRef]
- Sutton, M.A.; Reis, S.; Baker, S.M.H. Atmospheric Ammonia. Detecting Emmisions Changes and Environmental Impacts; Sutton, M.A., Reis, S., Baker, S.M.H., Eds.; Springer: Dordrecht, The Netherlands, 2009; ISBN 9781402091209. [Google Scholar]
- Sutton, M.A.; Dragosits, U.; Hellsten, S.; Place, C.J.; Dore, A.J.; Tang, Y.S.; van Dijk, N.; Love, L.; Fournier, N.; Vieno, M.; et al. Ammonia emission and deposition in Scotland and its potential environmental impacts. Sci. World Journal. 2004, 4, 795–810. [Google Scholar] [CrossRef] [PubMed] [Green Version]
- NEC Directive Reporting Status 2015. 2015. Available online: https://www.eea.europa.eu/themes/air/air-pollution-sources-1/national-emission-ceilings/nec-directive-reporting-status-2015 (accessed on 11 December 2019).
- Suarez-Bertoa, R.; Zardini, A.A.; Astorga, C. Ammonia exhaust emissions from spark ignition vehicles over the New European Driving Cycle. Atmos. Environ. 2014, 97, 43–53. [Google Scholar] [CrossRef]
- Elser, M.; El-Haddad, I.; Maasikmets, M.; Bozzetti, C.; Wolf, R.; Ciarelli, G.; Slowik, J.G.; Richter, R.; Teinemaa, E.; Hüglin, C.; et al. High contributions of vehicular emissions to ammonia in three European cities derived from mobile measurements. Atmos. Environ. 2018, 175, 210–220. [Google Scholar] [CrossRef]
- Chmielarz, L.; Jabłońska, M. Advances in selective catalytic oxidation of ammonia to dinitrogen: A review. RSC Adv. 2015, 5, 43408–43431. [Google Scholar] [CrossRef]
- Jabłońska, M.; Palkovits, R. Copper based catalysts for the selective ammonia oxidation into nitrogen and water vapour - recent trends and open challenges. Appl. Catal. B Environ. 2016, 181, 332–351. [Google Scholar] [CrossRef]
- FAO. Global Estimates of Gaseous Emissions of NH3, NO and N2O from Agricultural Land; FAO: Rome, Italy, 2001; ISBN 9251046891. [Google Scholar]
- Zawadzki, J. The mechanism of ammonia oxidation and certain analogous reactions. Discuss. Faraday Soc. 1950, 8, 140–152. [Google Scholar] [CrossRef]
- Zhang, X.; Wang, H.; Wang, Z.; Qu, Z. Adsorption and surface reaction pathway of NH3 selective catalytic oxidation over different Cu-Ce-Zr catalysts. Appl. Surf. Sci. 2018, 447, 40–48. [Google Scholar] [CrossRef]
- Basąg, S.; Piwowarska, Z.; Kowalczyk, A.; Węgrzyn, A.; Baran, R.; Gil, B.; Michalik, M.; Chmielarz, L. Cu-Mg-Al hydrotalcite-like materials as precursors of effective catalysts for selective oxidation of ammonia to dinitrogen - The influence of Mg/Al ratio and calcination temperature. Appl. Clay Sci. 2016, 129, 122–130. [Google Scholar] [CrossRef]
- Chmielarz, L.; Węgrzyn, A.; Wojciechowska, M.; Witkowski, S.; Michalik, M. Selective catalytic oxidation (SCO) of ammonia to nitrogen over hydrotalcite originated Mg-Cu-Fe mixed metal oxides. Catal. Lett. 2011, 141, 1345–1354. [Google Scholar] [CrossRef] [Green Version]
- Zhang, L.; He, H. Mechanism of selective catalytic oxidation of ammonia to nitrogen over Ag/Al2O3. J. Catal. 2009, 268, 18–25. [Google Scholar] [CrossRef]
- Wang, Z.; Qu, Z.; Quan, X.; Li, Z.; Wang, H.; Fan, R. Selective catalytic oxidation of ammonia to nitrogen over CuO-CeO2 mixed oxides prepared by surfactant-templated method. Appl. Catal. B Environ. 2013, 134–135, 153–166. [Google Scholar] [CrossRef]
- Basąg, S.; Kocoł, K.; Piwowarska, Z.; Rutkowska, M.; Baran, R.; Chmielarz, L. Activating effect of cerium in hydrotalcite derived Cu–Mg–Al catalysts for selective ammonia oxidation and the selective reduction of NO with ammonia. React. Kinet. Mech. Catal. 2017, 121, 225–240. [Google Scholar] [CrossRef] [Green Version]
- Lou, J.C.; Hung, C.M.; Yang, S.F. Selective Catalytic Oxidation of Ammonia over Copper-Cerium Composite Catalyst. J. Air Waste Manag. Assoc. 2004, 54, 68–76. [Google Scholar] [CrossRef] [Green Version]
- Gang, L.; Van Grondelle, J.; Anderson, B.G.; Van Santen, R.A. Selective low temperature NH3 oxidation to N2 on copper-based catalysts. J. Catal. 1999, 186, 100–109. [Google Scholar] [CrossRef]
- Jabłońska, M.; Wolkenar, B.; Beale, A.M.; Pischinger, S.; Palkovits, R. Comparison of Cu-Mg-Al-Ox and Cu/Al2O3 in selective catalytic oxidation of ammonia (NH3-SCO). Catal. Commun. 2018, 110, 5–9. [Google Scholar] [CrossRef] [Green Version]
- Roy, S.; Hegde, M.S.; Madras, G. Catalysis for NOx abatement. Appl. Energy 2009, 86, 2283–2297. [Google Scholar] [CrossRef]
- Jabłońska, M.; Palomares, A.E.; Chmielarz, L. NOx storage/reduction catalysts based on Mg/Zn/Al/Fe hydrotalcite-like materials. Chem. Eng. J. 2013, 231, 273–280. [Google Scholar] [CrossRef]
- Huang, Y.; Tong, Z.; Wu, B.; Zhang, J. Low temperature selective catalytic reduction of NO by ammonia over V2O5-CeO2/TiO2. J. Fuel Chem. Technol. 2008, 36, 616–620. [Google Scholar] [CrossRef]
- Luong, N.T.; Okumura, H.; Yamasue, E.; Ishihara, K.N. Structure and catalytic behaviour of CuO-CeO 2 prepared by high-energy ball milling. R. Soc. Open Sci. 2019, 6. [Google Scholar]
- Cavani, F.; Trifirò, F.; Vaccari, A. Hydrotalcite-type anionic clays: Preparation, properties and applications. Catal. Today 1991, 11, 173–301. [Google Scholar] [CrossRef]
- Rives, V. Characterisation of layered double hydroxides and their decomposition products. Mater. Chem. Phys. 2002, 75, 19–25. [Google Scholar] [CrossRef]
- Wu, J.S.; Xiao, Y.K.; Wan, J.Y.; Wen, L.R. The growth mechanism of hydrotalcite crystal. Sci. China Technol. Sci. 2012, 55, 872–878. [Google Scholar] [CrossRef]
- Anthony, J.W.; Bideaux, R.A.; Bladh, K.W.; Nichols, M. Handbook of Mineraology; Mineralogical Society of America: Chantilly, VA, USA; Available online: http://www.handbookofmineralogy.org/search.html?p=all (accessed on 11 December 2019).
- Bezerra, D.M.; Rodrigues, J.E.F.; Assaf, E.A. Structural, vibrational and morphological properties of layered double hydroxides containing Ni2+, Zn2+, Al3+ and Zr4+ cations. Mater. Charact. 2017, 125, 29–36. [Google Scholar] [CrossRef]
- Węgrzyn, A.; Rafalska-Łasocha, A.; Majda, D.; Dziembaj, R.; Papp, H. The influence of mixed anionic composition of Mg–Al hydrotalcites on the thermal decomposition mechanism based on in situ study. J. Therm. Anal. Calorim. 2010, 99, 443–457. [Google Scholar] [CrossRef]
- Pérez-Ramírez, J.; Abelló, S.; Van Der Pers, N.M. Memory effect of activated Mg-Al hydrotalcite: In situ XRD studies during decomposition and gas-phase reconstruction. Chem. A Eur. J. 2007, 13, 870–878. [Google Scholar] [CrossRef]
- Basąg, S.; Kovanda, F.; Piwowarska, Z.; Kowalczyk, A.; Pamin, K.; Chmielarz, L. Hydrotalcite-derived Co-containing mixed metal oxide catalysts for methanol incineration: Role of cobalt content, Mg/Al ratio and calcination temperature. J. Therm. Anal. Calorim. 2017, 129, 1301–1311. [Google Scholar] [CrossRef] [Green Version]
- Shannon, R.D. Revised effective ionic radii and systematic studies of interatomic distances in halides and chalcogenides. Acta Cryst. 1976, 13, 751–767. [Google Scholar] [CrossRef]
- Pavel, O.D.; Zǎvoianu, R.; Bîrjega, R.; Angelescu, E. The effect of ageing step elimination on the memory effect presented by Mg0.75Al0.25 hydrotalcites (HT) and their catalytic activity for cyanoethylation reaction. Catal. Commun. 2011, 12, 845–850. [Google Scholar] [CrossRef]
- Mascolo, G.; Mascolo, M.C. On the synthesis of layered double hydroxides (LDHs) by reconstruction method based on the “memory effect”. Microporous Mesoporous Mater. 2015, 214, 246–248. [Google Scholar]
- Angelescu, E.; Pavel, O.D.; Bîrjega, R.; Florea, M.; Žvoianu, R. The impact of the “memory effect” on the catalytic activity of Mg/Al; Mg,Zn/Al; Mg/Al,Ga hydrotalcite-like compounds used as catalysts for cycloxene epoxidation. Appl. Catal. A Gen. 2008, 341, 50–57. [Google Scholar] [CrossRef]
- Stanimirova, T.S.; Kirov, G.; Dinolova, E. Mechanism of hydrotalcite regeneration. J. Mater. Sci. Lett. 2001, 20, 453–455. [Google Scholar] [CrossRef]
- Guijarro, N.; Bornoz, P.; Prévot, M.; Yu, X.; Zhu, X.; Johnson, M.; Jeanbourquin, X.; Le Formal, F.; Sivula, K. Evaluating spinel ferrites MFe 2 O 4 (M = Cu, Mg, Zn) as photoanodes for solar water oxidation: Prospects and limitations. Sustain. Energy Fuels 2018, 2, 103–117. [Google Scholar] [CrossRef] [Green Version]
- Kong, Z.Y.; Wong, N.X.; Lum, S.W.; Tan, S.Y.; Khan, M.R.; Cheng, C.K. The application of magnesium ferrite photocatalyst for photo treatment of methylene blue. J. Eng. Sci. Technol. 2015, 10, 1–10. [Google Scholar]
- Durrani, S.K.; Naz, S.; Mehmood, M.; Nadeem, M.; Siddique, M. Structural, impedance and Mössbauer studies of magnesium ferrite synthesized via sol–gel auto-combustion process. J. Saudi Chem. Soc. 2017, 21, 899–910. [Google Scholar] [CrossRef] [Green Version]
- Taffa, D.H.; Dillert, R.; Ulpe, A.C.; Bauerfeind, K.C.L.; Bredow, T.; Bahnemann, D.W.; Wark, M. Photoelectrochemical and theoretical investigations of spinel type ferrites (MxFe3-xO4) for water splitting: A mini-review. J. Photonics Energy 1997, 2, 5–8. [Google Scholar] [CrossRef] [Green Version]
- Wanke, S.E.; Fiedorow, R.M.J. The Influence of Preparation Methods on Surface Area, Porosity and Crystallinity of Magnesium Oxide. In Studies in Surface Science and Catalysis; Elsevier: Amsterdam, The Netherlands, 1988; Volume 39, pp. 601–609. [Google Scholar]
- Xu, L.; Xu, H.-Y.; Wang, F.; Zhang, F.-J.; Meng, Z.-D.; Zhao, W.; Oh, W.-C. Microwave-Assisted Synthesis of Flower-like and Plate-like CuO Nanopowder and Their Photocatalytic Activity for Polluted Lake Water. J. Korean Ceram. Soc. 2012, 49, 151–154. [Google Scholar] [CrossRef] [Green Version]
- Camtakan, Z.; Erenturk, S.; Yusan, S. Magnesium oxide nanoparticles: Preparation, characterisation, and uranium sorption properties. Environ. Prog. Sustain. Energy 2011, 31, 482–489. [Google Scholar] [CrossRef]
- Radhakrishnan, A.A.; Beena, B.B. Structural and optical absorption analysis of CuO nanoparticles. Indian J. Adv. Chem. Sci. 2014, 2, 28–35. [Google Scholar]
- Altincekic, T.G.; Boz, I.; Baykal, A.; Kazan, S.; Topkaya, R.; Toprak, M.S. Synthesis and characterization of CuFe2O4 nanorods synthesized by polyol route. J. Alloys Compd. 2010, 493, 493–498. [Google Scholar] [CrossRef]
- Sagar, G.V.; Rao, P.V.R.; Srikanth, C.S.; Chary, K.V.R. Dispersion and reactivity of copper catalysts supported on Al2O3-ZrO2. J. Phys. Chem. B 2006, 110, 13881–13888. [Google Scholar] [CrossRef] [PubMed]
- Shi, X.; Chu, B.; Wang, F.; Wei, X.; Teng, L.; Fan, M.; Li, B.; Dong, L.; Dong, L. Mn-Modified CuO, CuFe2O4, and γ-Fe2O3 three-phase strong synergistic coexistence catalyst system for NO reduction by CO with a wider active window. ACS Appl. Mater. Interfaces 2018, 10, 40509–40522. [Google Scholar] [CrossRef] [PubMed]
- Wang, Y.; Xue, R.; Zhao, C.; Liu, F.; Liu, C.; Han, F. Effects of Ce in the catalytic combustion of toluene on CuxCe1-xFe2O4. Colloids Surfaces A Physicochem. Eng. Asp. 2018, 540, 90–97. [Google Scholar] [CrossRef]
- Do, J.Y.; Son, N.; Park, N.K.; Kwak, B.S.; Baek, J.I.; Ryu, H.J.; Kang, M. Reliable oxygen transfer in MgAl2O4 spinel through the reversible formation of oxygen vacancies by Cu2+/Fe3+ anchoring. Appl. Energy 2018, 219, 138–150. [Google Scholar] [CrossRef]
- Pang, S.C.; Chin, S.F.; Anderson, M.A. Redox equilibria of iron oxides in aqueous-based magnetite dispersions: Effect of pH and redox potential. J. Colloid Interface Sci. 2007, 311, 94–101. [Google Scholar] [CrossRef]
- Bodade, A.B.; Taiwade, M.A.; Chaudhari, G.N. Bioelectrode based chitosan-nano copper oxide for application to lipase biosensor. J. Appl. Pharm. Res. 2017, 5, 30–39. [Google Scholar]
- Noerochim, L.; Indra, M.A.T.; Purwaningsih, H.; Subhan, A. Porous Fe 2 O 3 Microspheres as Anode for Lithium-Ion Batteries. IOP Conf. Ser. Mater. Sci. Eng. 2018, 367, 012038. [Google Scholar] [CrossRef]
- Shang, H.; Zhang, X.; Xu, J.; Han, Y. Effects of preparation methods on the activity of CuO/CeO2 catalysts for CO oxidation. Front. Chem. Sci. Eng. 2017, 11, 603–612. [Google Scholar] [CrossRef]
- Tang, X.; Zhang, B.; Li, Y.; Xu, Y.; Xin, Q.; Shen, W. CuO/CeO2 catalysts: Redox features and catalytic behaviors. Appl. Catal. A Gen. 2005, 288, 116–125. [Google Scholar] [CrossRef]
- Jabłońska, M.; Chmielarz, L.; Wegrzyn, A.; Guzik, K.; Piwowarska, Z.; Witkowski, S.; Walton, R.I.; Dunne, P.W.; Kovanda, F. Thermal transformations of Cu-Mg (Zn)-Al(Fe) hydrotalcite-like materials into metal oxide systems and their catalytic activity in selective oxidation of ammonia to dinitrogen. J. Therm. Anal. Calorim. 2013, 114, 731–747. [Google Scholar] [CrossRef] [Green Version]
- Yue, W.; Zhang, R.; Liu, N.; Chen, B. Selective catalytic oxidation of ammonia to nitrogen over orderly mesoporous CuFe2O4 with high specific surface area. Chinese Sci. Bull. 2014, 59, 3980–3986. [Google Scholar] [CrossRef]
- Zhang, L.; Liu, F.; Yu, Y.; Liu, Y.; Zhang, C.; He, H. Effects of adding CeO2 to Ag/Al2O3 catalyst for ammonia oxidation at low temperatures. Cuihua Xuebao/Chinese J. Catal. 2011, 32, 727–735. [Google Scholar] [CrossRef]
- Jabłońska, M. Selective catalytic oxidation of ammonia into nitrogen and water vapour over transition metals modified Al2O3, TiO2 and ZrO2. Chem. Pap. 2015, 69, 1141–1155. [Google Scholar] [CrossRef]
- Gang, L.; Anderson, B.G.; Van Grondelle, J.; Van Santen, R.A. NH3 oxidation to nitrogen and water at low temperatures using supported transition metal catalysts. Catal. Today 2000, 61, 179–185. [Google Scholar] [CrossRef]


| Sample | Cu/Mg/Fe Intended Chemical Composition, % * | Intended Molar Cu:Fe Ratio, - | XRF Chemical Composition, wt % | Actual Molar Cu:Fe Ratio, - | Cell Parameters, nm | |||
|---|---|---|---|---|---|---|---|---|
| Cu | Mg | Fe | a | c | ||||
| HT-Mg-Fe | 0/67/33 | - | 0 | 14.6 | 23.4 | - | 0.311 | 2.361 |
| HT-Cu5-Mg-Fe | 5/62/33 | 0.15 | 3.1 | 10.3 | 18.7 | 0.16 | 0.311 | 2.358 |
| HT-Cu7-Mg-Fe | 7/60/33 | 0.21 | 4.7 | 11 | 20.2 | 0.23 | 0.311 | 2.354 |
| HT-Cu10-Mg-Fe | 10/57/33 | 0.30 | 5.9 | 8.6 | 18.8 | 0.32 | 0.305 | 2.298 |
| HT-Cu12-Mg-Fe | 12/55/33 | 0.36 | 7.3 | 8.6 | 18.6 | 0.39 | 0.311 | 2.343 |
| HT-Cu15-Mg-Fe | 15/52/33 | 0.45 | 8.0 | 7.3 | 16.6 | 0.48 | 0.312 | 2.343 |
| Series 800-Cu-Mg-Fe-O | Series 800-Cu-Mg-Fe-O-Ce | |||||||
|---|---|---|---|---|---|---|---|---|
| Sample Code | Int. Chemical Composition, mol % * | Sample Code | Int. Chemical Composition, mol % * | |||||
| Cu | Mg | Fe | Cu | Mg | Fe | Ce | ||
| 800-Mg-Fe | 0 | 67 | 33 | 800-Mg-Fe-Ce | 0 | 65.3 | 32.2 | 2.5 |
| 800-Cu5-Mg-Fe | 5 | 62 | 33 | 800-Cu5-Mg-Fe-Ce | 4.9 | 60.5 | 32.2 | 2.5 |
| 800-Cu7-Mg-Fe | 7 | 60 | 33 | 800-Cu7-Mg-Fe-Ce | 6.8 | 58.5 | 32.2 | 2.5 |
| 800-Cu10-Mg-Fe | 10 | 57 | 33 | 800-Cu10-Mg-Fe-Ce | 9.7 | 55.7 | 32.2 | 2.5 |
| 800-Cu12-Mg-Fe | 12 | 55 | 33 | 800-Cu12-Mg-Fe-Ce | 11.7 | 53.6 | 32.2 | 2.5 |
| 800-Cu15-Mg-Fe | 15 | 52 | 33 | 800-Cu15-Mg-Fe-Ce | 14.6 | 50.7 | 32.2 | 2.5 |
| Sample | Wt. % | Cu:Fe Molar Ratio Calc. * | Cu:Fe Molar Ratio Int. ** | ||
|---|---|---|---|---|---|
| Cu | Mg | Fe | |||
| 800-Mg-Fe | 21.0 | 33.8 | |||
| 800-Cu5-Mg-Fe | 5.2 | 17.0 | 31.8 | 0.14 | 0.15 |
| 800-Cu7-Mg-Fe | 7.4 | 12.3 | 28.9 | 0.22 | 0.21 |
| 800-Cu10-Mg-Fe | 10.0 | 14.5 | 30.8 | 0.29 | 0.30 |
| 800-Cu12-Mg-Fe | 12.0 | 10.6 | 28.5 | 0.37 | 0.36 |
| 800-Cu15-Mg-Fe | 13.6 | 9.9 | 25.6 | 0.46 | 0.45 |
| Sample | Wt % | Cu:Fe Molar Ratio | Cu:Ce Molar Ratio | |||||
|---|---|---|---|---|---|---|---|---|
| Cu | Mg | Fe | Ce | Int. ** | Calc. * | Int. ** | Calc. * | |
| 800-Mg-Fe-Ce | 20.6 | 31.0 | 4.2 | |||||
| 800-Cu5-Mg-Fe-Ce | 4.6 | 13.4 | 28.3 | 4.3 | 0.15 | 0.14 | 2.0 | 2.35 |
| 800-Cu7-Mg-Fe-Ce | 6.7 | 14.7 | 29.6 | 4.4 | 0.21 | 0.19 | 2.8 | 3.35 |
| 800-Cu10-Mg-Fe-Ce | 9.3 | 10.9 | 28.6 | 4.8 | 0.30 | 0.28 | 4.0 | 4.27 |
| 800-Cu12-Mg-Fe-Ce | 10.9 | 12.4 | 28.7 | 4.0 | 0.36 | 0.33 | 4.8 | 6.0 |
| 800-Cu15-Mg-Fe-Ce | 11.9 | 10.2 | 24.8 | 4.0 | 0.45 | 0.42 | 6.0 | 6.6 |
| Sample | Direct Band Gap Energy, eV | I(440)/I(222) * | Crystallite Size **, nm | |||
|---|---|---|---|---|---|---|
| CuO | MgO | MgFe2O4 | CeO2 | |||
| 800-Mg-Mg-Fe | 2.46 | - | - | 16 | 19 | - |
| 800-Cu5-Mg-Fe | 2.44 | 1.13 | - | 36 | 28 | - |
| 800-Cu7-Mg-Fe | 2.44 | 1.27 | - | 41 | 31 | - |
| 800-Cu10-Mg-Fe | 2.10 | 1.54 | 21 | 38 | 37 | - |
| 800-Cu12-Mg-Fe | 2.09 | 1.72 | 34 | 40 | 30 | - |
| 800-Cu15-Mg-Fe | 2.15 | 0.93 | 35 | 41 | 37 | - |
| 800-Mg-Fe-Ce | 2.47 | - | - | 22 | 23 | 13 |
| 800-Cu5-Mg-Fe-Ce | 2.46 | 1.22 | - | 28 | 26 | 20 |
| 800-Cu7-Mg-Fe-Ce | 2.46 | 1.36 | - | 24 | 26 | 24 |
| 800-Cu10-Mg-Fe-Ce | 2.20 | 1.58 | 25 | 43 | 33 | 21 |
| 800-Cu12-Mg-Fe-Ce | 2.12 | 1.85 | 30 | 40 | 28 | 16 |
| 800-Cu15-Mg-Fe--Ce | 2.21 | 0.98 | 35 | 34 | 26 | 21 |
| Sample | BET Surface Area, m2 g−1 | t-Plot Micropore Area, m2 g−1 | t-Plot External Surface Area, m2 g−1 |
|---|---|---|---|
| 800-Mg-Fe | 32.4 | 4.0 | 28.4 |
| 800-Cu5-Mg-Fe | 14.1 | 1.3 | 12.8 |
| 800-Cu7-Mg-Fe | 8.9 | 1.6 | 7.3 |
| 800-Cu10-Mg-Fe | 6.3 | 0.5 | 5.8 |
| 800-Cu12-Mg-Fe | 6.2 | 0.5 | 5.7 |
| 800-Cu15-Mg-Fe | 18.6 | 1.4 | 18.5 |
| 800-Mg-Fe-Ce | 26.8 | 4.4 | 22.4 |
| 800-Cu5-Mg-Fe-Ce | 17.5 | 0.1 | 17.4 |
| 800-Cu7-Mg-Fe-Ce | 7.6 | 1.0 | 6.6 |
| 800-Cu10-Mg-Fe-Ce | 5.8 | 0.5 | 5.4 |
| 800-Cu12-Mg-Fe-Ce | 6.4 | 1.2 | 5.2 |
| 800-Cu15-Mg-Fe-Ce | 15.3 | 2.4 | 12.8 |
| Sample | H2 Consumption (50–250 °C), mmol/g | H2 Consumption (50–900 °C), mmol/g | Cu Reduced at 50–250 °C Region, % * |
|---|---|---|---|
| 800-Mg-Fe | 0 | 7.7 | |
| 800-Cu5-Mg-Fe | 0.3 | 8.6 | 46 |
| 800-Cu7-Mg-Fe | 0.5 | 9.0 | 54 |
| 800-Cu10-Mg-Fe | 0.7 | 8.7 | 56 |
| 800-Cu12-Mg-Fe | 0.9 | 9.1 | 60 |
| 800-Cu15-Mg-Fe | 0.9 | 8.8 | 57 |
| 800-Mg-Fe-Ce | 0 | 8.2 | |
| 800-Cu5-Mg-Fe-Ce | 0.3 | 8.5 | 45 |
| 800-Cu7-Mg-Fe-Ce | 0.5 | 9.5 | 57 |
| 800-Cu10-Mg-Fe-Ce | 0.7 | 10.1 | 62 |
| 800-Cu12-Mg-Fe-Ce | 0.8 | 9.9 | 61 |
| 800-Cu15-Mg-Fe-Ce | 0.9 | 9.3 | 63 |
© 2020 by the authors. Licensee MDPI, Basel, Switzerland. This article is an open access article distributed under the terms and conditions of the Creative Commons Attribution (CC BY) license (http://creativecommons.org/licenses/by/4.0/).
Share and Cite
Górecka, S.; Pacultová, K.; Górecki, K.; Smýkalová, A.; Pamin, K.; Obalová, L. Cu-Mg-Fe-O-(Ce) Complex Oxides as Catalysts of Selective Catalytic Oxidation of Ammonia to Dinitrogen (NH3-SCO). Catalysts 2020, 10, 153. https://doi.org/10.3390/catal10020153
Górecka S, Pacultová K, Górecki K, Smýkalová A, Pamin K, Obalová L. Cu-Mg-Fe-O-(Ce) Complex Oxides as Catalysts of Selective Catalytic Oxidation of Ammonia to Dinitrogen (NH3-SCO). Catalysts. 2020; 10(2):153. https://doi.org/10.3390/catal10020153
Chicago/Turabian StyleGórecka, Sylwia, Kateřina Pacultová, Kamil Górecki, Aneta Smýkalová, Katarzyna Pamin, and Lucie Obalová. 2020. "Cu-Mg-Fe-O-(Ce) Complex Oxides as Catalysts of Selective Catalytic Oxidation of Ammonia to Dinitrogen (NH3-SCO)" Catalysts 10, no. 2: 153. https://doi.org/10.3390/catal10020153